Communication

Gaussian-Shaped Free-Space Optical Beam Intensity Estimation in Detector Arrays

by
Muhammad Ali Umair
1,2,
Hira Khalid
2,
Sheikh Muhammad Sajid
2 and
Hector E. Nistazakis
3,*
1
European Laboratory for NonLinear Spectroscopy (LENS), University of Florence, 50121 Sesto Fiorentino, Italy
2
Department of Electrical Engineering, National University of Computer and Emerging Sciences, Lahore 54000, Pakistan
3
Section of Electronic Physics and Systems, Department of Physics, National and Kapodistrian University of Athens, 15784 Athens, Greece
*
Author to whom correspondence should be addressed.
Photonics 2023, 10(8), 930; https://doi.org/10.3390/photonics10080930
Submission received: 29 June 2023 / Revised: 2 August 2023 / Accepted: 11 August 2023 / Published: 14 August 2023
(This article belongs to the Special Issue New Advances in Optical Wireless Communication)

Abstract

:
Photon counting detector arrays are commonly used for deep space optical communication receivers operating on the principle of intensity modulation/direct detection (IM/DD). In scenarios where beam parameters can vary at the receiver due to scattering, it is important to estimate beam parameters in order to minimize the probability of error. The use of array of detectors increases the sensitivity of the receiver as compared to single photo-detector of the same size. In this paper, we present the derivation of a maximum likelihood estimator (ML) for peak optical intensity, providing both numerical and closed form expressions for the estimator. Performance of both forms of ML estimator are compared using the mean squared error (MSE) criterion and Cramer–Rao Lower Bound (CRLB) is also derived to assess the proposed estimator’s efficiency. This research contributed to the advancement of estimation techniques and has practical implications for optimizing deep space optical communication systems.

1. Introduction

An exponential increase in the number of devices is creating congestion in the radio frequency (RF) spectrum [1]. This has prompted the exploitation of other regions of the electro-magnetic (EM) spectrum for future wireless communication networks. In this scenario, optical wireless communication (OWC), also known as Free-Space Optical (FSO) communication, has gained a lot of attention exploiting unlicensed optical bands of the EM spectrum [2,3,4]. Due to its high data rate capability, low installation cost, rapid deployment, scalability, enhanced security, and notably wide bandwidth on the unregulated spectrum, Free-Space Optical (FSO) communication stands as a favorable alternative to its RF counterpart. Free-Space Optical (FSO) communication is the most promising technique for high data rate transmission [5]. Usage of high power laser sources allows the implementation of FSO communication systems which support large link distances, due to the smaller divergence angle of the transmitted optical signal as compared to radio frequency systems. FSO systems have emerged as an attractive means not only for terrestrial point-to-point links [6] or as a supplement to fiber optics, but also for deep space and inter-satellite communication [7] and other applications, including cellular back-hauls [8] and local area network segment interconnects [9].
In deep space communications, photon counting detector arrays are widely used due to their ability to detect even a single photon received [10,11]. In the case of pulse position modulation (PPM), the time of arrival of each photon in a given time slot is very important for the correct detection of an incoming signal. The sensitivity of the receiver can be enhanced by using a photon counting detector array instead of a single photon counting detector of the same size. The authors of [12] have investigated that an array of photo-detectors receiver minimizes the probability of error for a fixed Signal-to-Noise ratio (SNR) and receiver size compared to a single large photo-detector as discussed. In [13], researchers suggested the use of flexible curvature array detectors for wider field of view (FOV) detection in astronomy. These curved detector arrays can reduce the complexity of optical system and enhance the performance of detectors. There are several other advantages of using photo-detector arrays over a single photo-detector receiver. Firstly, detector arrays are more helpful during beam acquisition [10] and tracking process, as large array elements ensure higher tracking accuracy. Secondly, the size of array is easily adoptable by adding more photo-detectors according the requirement of the system. Finally, an individual photo-detector in array can be serviced easily without changing the entire system.
Channel State Information (CSI) is an important parameter in every communication system, which is required for optimum detection of transmitted signal in a communication system. For a common scenario of a Gaussian beam profile as discussed in [14], beam parameters like the beam’s peak intensity, beam radius and beam center location on a detector array represent the CSI for the purpose of optical signal detection. A scattering channel, such as optical propagation through fog or clouds, results in absorption and scattering of the energy. This results in the attenuation of the beam peak intensity and the spreading of the beam on the detector array. Moreover, optical wireless communication requires line of sight (LOS) for communications [15] but, due to different phenomena, misalignment occurs between transmitter and receiver. The values of the parameters like beam position, beam intensity, and beam center location may be unknown on a detector array [16]. It is evident that, for the optimal detection of a transmitted optical symbol, these parameters are required to be estimated at the receiver end. The optical beam position estimator has already been proposed, assuming that other parameters like beam width and peak optical beam intensity are known [17]. Since practical detector arrays are discrete in nature, the problem of beam position estimation has been studied for discrete detector arrays.
In this paper, we are proposing an estimator for the peak signal intensity I o of a Gaussian-shaped optical beam received over a scattering channel using array of detectors at the receiver end. We assume that the received optical beam maintains its Gaussian profile (or an approximately Gaussian profile) as the scattering and absorption merely hamper the signal intensity. Even though scattering results in beam spreading, the detector array is large enough to collect all the scattered energy. In Figure 1, the foot print of Gaussian-shaped optical signal received by single cell photo-detector and detector array are shown. The spacing between the detector array greater than the size of a photon is ignored. It can be seen that the optical signal is Gaussian-shaped, with its maximum at the center, and a gradual decrease as we move away from the center. Moreover, we derived expression for CRLB, which serves as a lower bound for derived estimators. To the best of the authors’ knowledge, optical beam intensity is being estimated for the first time using a photo counting detector array.
The rest of the paper is organized as follows: the system model for an optical link is outlined in Section 2, whereas the closed form of an ML estimator for the beam’s parameter is derived in Section 3. In Section 4, the results are presented and discussed. The conclusion is drawn in Section 5.

2. System Modeling

The received optical signal gives rise to the photo-electrons in each of the detector of the array due to the photo-electric effect. Two very common modulation schemes, PPM [18] and ON-OFF keying (OOK) [19], are used to modulate signal in FSO. The emission of these photo-electrons during the signal pulse interval help us to detect transmitted symbol. These photo-electrons are modeled by a non-homogeneous Poisson process [2]:
P o ( Z m = z m ) = ( m ) z m exp m z m !
where m = A m λ ( a , b , d ) d a d b is the beam intensity profile on the detector array. Assume that we have an array of M cells, denoted by regions A 1 , A 2 , , A M and each one has a uniform area equal to A. During an interval T, the count in each cell is given by an independent Poisson random variable z 1 , z 2 , , z M . Noise photons are modeled by a homogeneous Poisson process with a constant rate of λ n . These noise photons are produced by the background radiation and thermal effects of the detector. Thus, the total mean photon count per cell are produced by both signal and noise given by:
m = λ n A + A m λ ( a , b , d ) d a d b
For a Gaussian beam, the received signal intensity at the detector array is given in [10]:
λ ( a , b , d ) = I 0 exp ( a α ) 2 ( b β ) 2 2 ρ 2 ( d )
where, I o is the peak signal intensity, ( α o , β o ) are the beam center location on the detector array, ( a , b ) are any point inside the region of the detector array, and ρ ( d ) is the beam radius or spot size where [20]
ρ ( d ) = ρ o 2 1 + λ ( d ) π ρ o 2 2
Here, the factor ρ o is the beam waist, λ is the wavelength of the optical signal, and d is the link distance.

Detection of the Optical Signal

A common modulation technique used in FSO is pulse position modulation (PPM); a symbol is sent by varying the position of the pulse during the symbol period, assuming that transmitter and receiver are synchronized in time with each other. On the bases of a likelihood ratio test, receiver will make a decision for every sub interval, whether a pulse is present or not. We assume two hypothesis [17].
H0: 
Signal beam is not present.
H1: 
Signal beam is present.
For H 0 , when photons are only generated through noise, the mean rate for each cell is λ n , so
P o ( z 1 , z 2 , , z 3 ) = m = 1 M P m ( 0 ) ( z m )
and
P o ( z 1 , z 2 , , z 3 ) = m = 1 M ( λ n A ) z m exp λ n A z m !
For H 1 , when photons are generated through signal and noise jointly, the mean rate is given by Equation (2). Therefore, under H 1 :
p 1 ( z 1 , z 2 , , z M ) = m = 1 M p m ( 1 ) ( z m )
p 1 ( z 1 , z 2 , , , z M ) = m = 1 M ( m ) z m exp m z m !
Computing the likelihood ratio, we will obtain:
ζ ( z 1 , z 2 , , z M ) = p 1 ( z 1 , z 2 , , z M ) p 0 ( z 1 , z 2 , , z M )
Taking the natural log on both sides will give Equation (10):
ln ζ ( z 1 , z 2 , , z M ) = m = 1 M z m ln 1 + 1 λ n A A m I 0 exp ( a α ) 2 ( b β ) 2 2 ρ 2 ( d ) m = 1 M A m I 0 exp ( a α ) 2 ( b β ) 2 2 ρ 2 ( d )
An accurate determination of log-likelihood ratio requires an optimal estimate of the magnitude of peak intensity function I o , beam center location on the detector array ( α , β ) , beam width ρ ( z ) , and noise λ n . Previously, in [17], the beam center location on detector array was estimated; now, in this paper, we will estimate I o , assuming that beam width ρ ( z ) and noise λ n are known and constant.

3. An Estimator for the Beam’s Parameter

In this section, we derive an estimator to estimate our beam parameter I o . As we do not have any subjective knowledge about the channel, we can not assign any “prior distribution”. We are assuming that our parameter is unknown but constant, and hence a classical estimation approach has been preferred.

3.1. Maximum Likelihood Estimator

Taking tools from the classical estimation approach, we are using maximum likelihood (ML) estimator for estimation of optical signal intensity I o . From the Poisson Point Process (PPP), the likelihood function is given as [21]
P ( z , I o ^ ) = ( m ) i = 1 M z m exp M m m = 1 M z m !
and the log-likelihood function is given as:
ln ( P ( z , I o ^ ) ) = i = 1 M Z i ln M i = 1 M ln Z i !
where
m = λ n A + A m λ ( a , b , d ) d a d b
Putting the value of ⋀ into Equation (12), we obtain the final analytical form expression, which is given as
ln ( P ( z , I o ^ ) ) = i = 1 M Z i ln A I 0 ^ exp ( a α ) 2 ( b β ) 2 2 ρ 2 ( d ) + λ n M A I 0 ^ exp ( a α ) 2 ( b β ) 2 2 ρ 2 ( d ) + λ n i = 1 M ln Z i !
Taking the derivative, we will obtain:
= i = 1 M Z i A exp ( a α ) 2 + ( b β ) 2 2 ρ 2 ( d ) A I 0 exp ( a α ) 2 + ( b β ) 2 2 ρ 2 ( d ) + λ n M A exp ( a α ) 2 + ( b β ) 2 2 ρ 2 ( d ) 0
To maximize, equate the above equation to zero:
0 = i = 1 M Z i A exp ( a α ) 2 + ( b β ) 2 2 ρ 2 ( d ) A I 0 exp ( a α ) 2 + ( b β ) 2 2 ρ 2 ( d ) + λ n M A exp ( a α ) 2 + ( b β ) 2 2 ρ 2 ( d )
M = i = 1 M Z i A I 0 exp ( a α ) 2 + ( b β ) 2 2 ρ 2 ( d ) + λ n
simplifying the above equation for intensity I o ^ :
I o ^ = i = 1 M Z i M λ n M A I 0 exp ( a α ) 2 + ( b β ) 2 2 ρ 2 ( d )
Equation (18) gives the closed form of the maximum-likelihood estimator.

3.2. CRLB of the ML Estimator

Taking the second derivative of Equation (16), we will obtain:
2 p ( z ) 2 ( I o ) = 0 i = 1 M Z i A exp ( a α ) 2 + ( b β ) 2 2 ρ 2 2 A I 0 exp ( a α ) 2 + ( b β ) 2 2 ρ 2 + λ n 2
2 p ( z ) 2 ( I o ) = i = 1 M Z i A exp ( a α ) 2 + ( b β ) 2 2 ρ 2 2 A I 0 exp ( a α ) 2 + ( b β ) 2 2 ρ 2 + λ n 2
Taking the expectation on both sides:
E 2 p ( z ) 2 ( I o ) = E A exp ( a α ) 2 + ( b β ) 2 2 ρ 2 2 i = 1 M Z i A I 0 exp ( a α ) 2 + ( b β ) 2 2 ρ 2 + λ n 2
as Z i follows the Poisson distribution, thus:
E 2 p ( z ) 2 ( I o ) = A exp ( a α ) 2 + ( b β ) 2 2 ρ 2 2 M ( ) A I 0 exp ( a α ) 2 + ( b β ) 2 2 ρ 2 + λ n 2
where
m = A m I 0 exp ( a α ) 2 ( b β ) 2 2 ρ 2 d a d b + λ n
Solving Equation (22), we will obtain following result:
E 2 p ( z ) 2 ( I o ) = M A exp ( a α ) 2 + ( b β ) 2 2 ρ 2 2 A I 0 exp ( a α ) 2 + ( b β ) 2 2 ρ 2 + λ n
Taking the negative reciprocal of Equation (24) to obtain the final expression for CRLB gives:
C R L B = 1 E 2 p ( z ) 2 ( I o ) = A I 0 exp ( a α ) 2 + ( b β ) 2 2 ρ 2 + λ n M A exp ( a α ) 2 + ( b β ) 2 2 ρ 2 2

4. Results

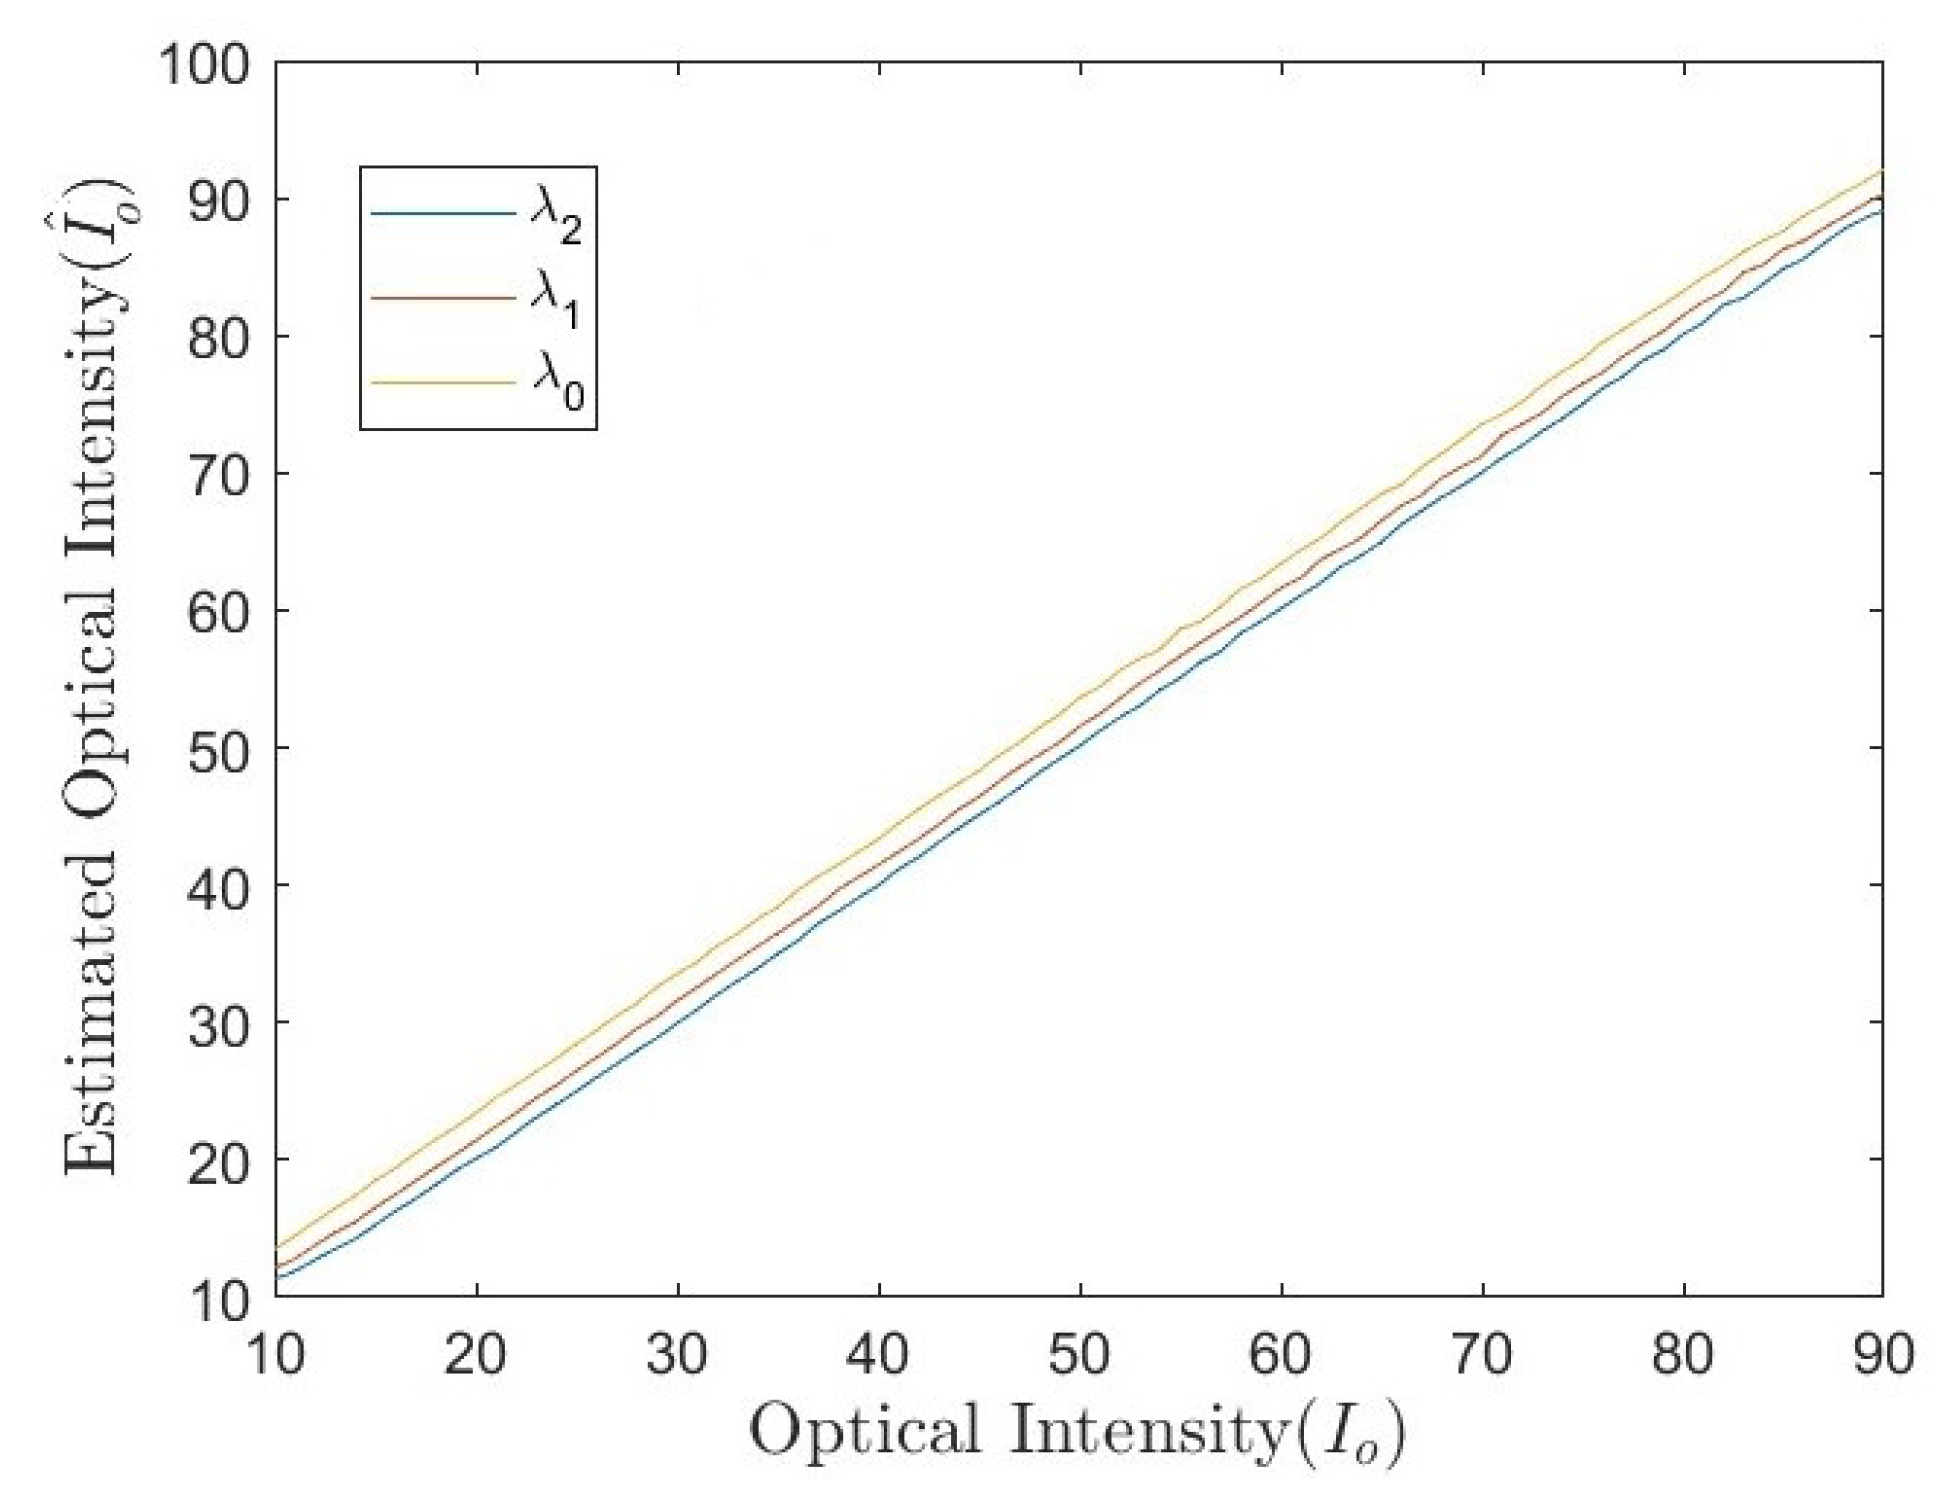
Figure 2 gives the estimated optical intensity I o ^ against the actual optical intensity. This graph is plotted using Equation (18) for different values of noise λ n . It is evident from the equation and the plot that estimated optical intensity is inversely proportional to noise λ n . This is due to the fact that as the number of noise photons incident on the detector increases, the efficiency for detecting the actual signal decreases.
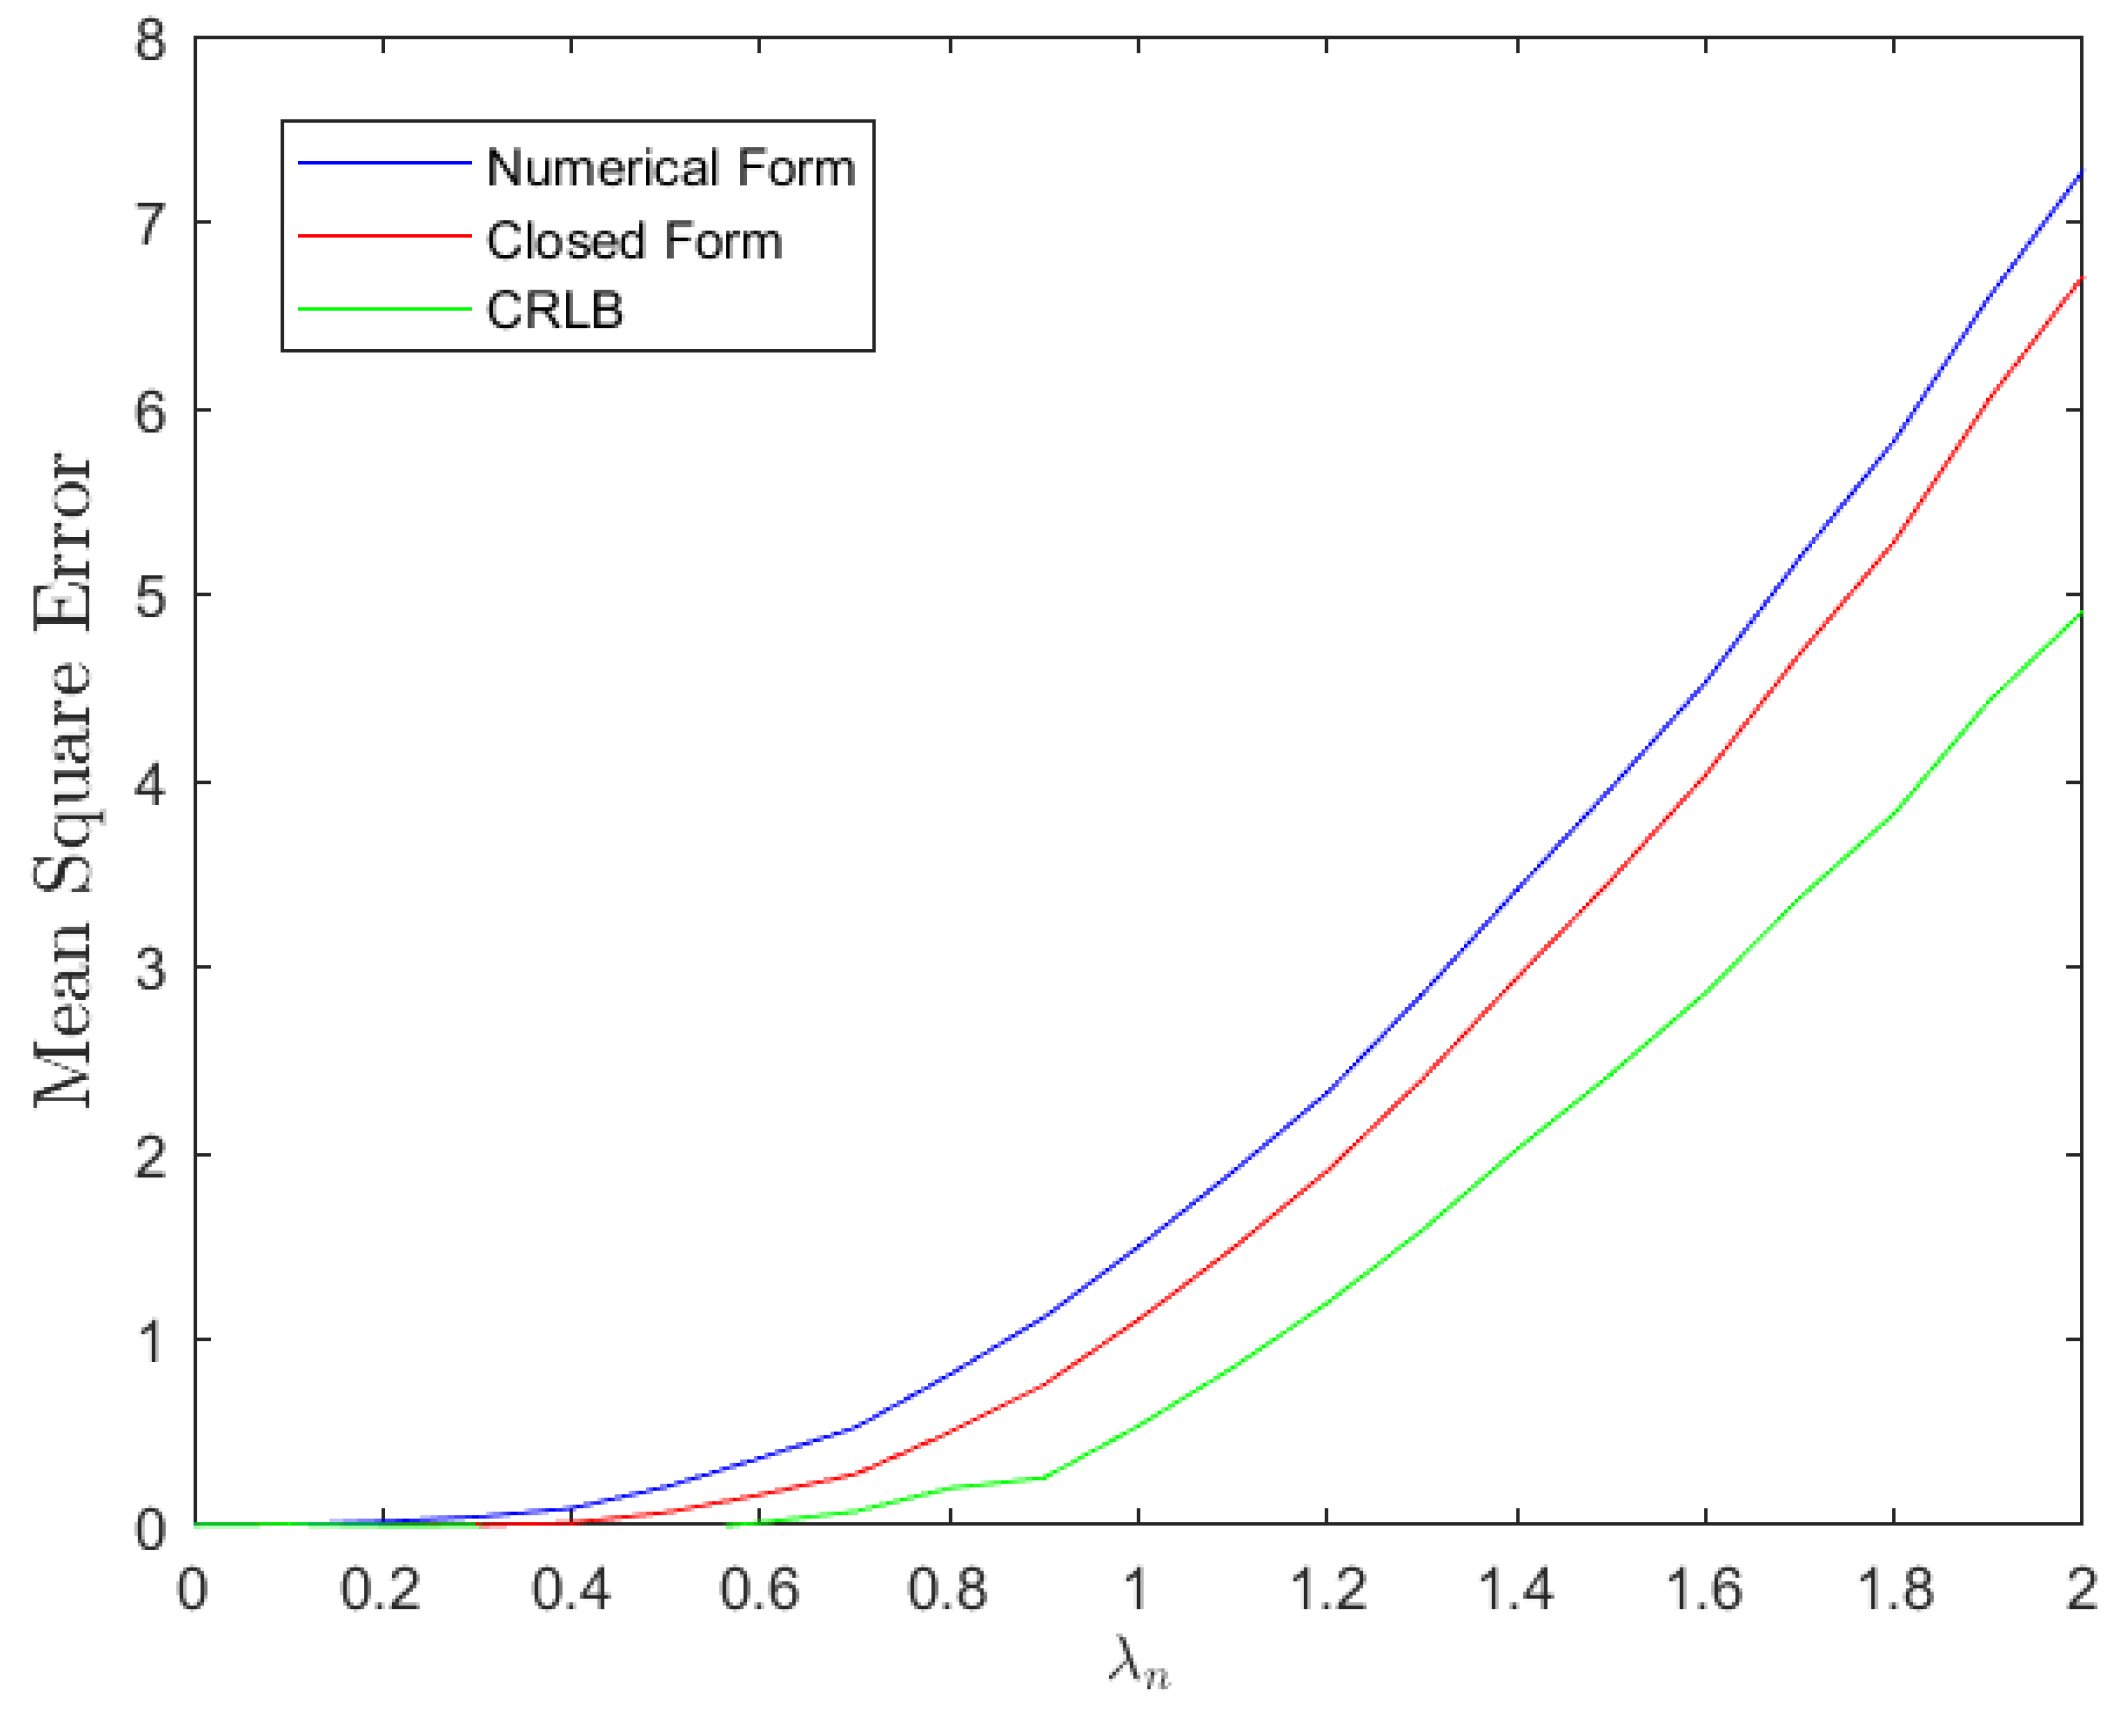
The quantity of error in this detection is shown in Figure 3. This plot is generated for numerical form, closed form and CRLB using Equations (14), (18) and (25), respectively. The assumed parameters are: optical intensity I o = 50 , beam width ρ = 1 and beam center location on detector array ( α , β ) = ( 0 , 0 ) . It can be observed from the graph that MSE increases as the number of noise photon increases. The MSE remains almost zero for numerical and closed forms, until the average rate of received noise photons approaches 0.4; later, it grows gradually. For CRLB, it is evident from the graph that its performance surpass both numerical and closed forms in terms of error. MSE is almost zero till 0.8 and, even later, the graph for CRLB has less of a slope.
The results presented in Figure 2 and Figure 3 can be compared with those of previous studies [22,23] for marginal cases of our work. These comparisons show that there is a good agreement between our results and those of previous studies.

5. Conclusions

In this paper, an estimator has been derived for a received Gaussian-shaped optical signal’s intensity using photon counting detector arrays. Performance of the estimator has been bench-marked using the mean squared error (MSE) criterion, and comparison is performed between the numerical form, closed form and CRLB. It was observed that with increasing noise, the MSE of the estimated signal increases. In the beginning, when the photon count is less than 0.4 (average rate of received noise photons), the MSE remains zero, and then it grows gradually with an increasing value of λ n . The Cramer–Rao Lower Bound is also derived; its comparison with numerical and closed forms show that it significantly surpass them both in terms of performance.
For the scope of this research, it was assumed that transmitter and receiver are synchronized in time, but in a real scenario, one has to synchronize the transmitter and receiver to minimize delays. Thus, this problem can be extended by considering both time synchronization as well as intensity estimation problems for future research.

Author Contributions

Conceptualization, M.A.U., H.K., S.M.S. and H.E.N.; methodology, M.A.U. and H.K.; software, M.A.U. and H.K.; validation, M.A.U., H.K. and S.M.S.; formal analysis, M.A.U., H.K., S.M.S. and H.E.N.; investigation, M.A.U. and H.E.N.; resources, M.A.U. and S.M.S.; data curation, M.A.U. and H.K.; writing—original draft preparation, M.A.U. and H.K.; writing—review and editing, H.K., S.M.S. and H.E.N.; visualization, M.A.U. and S.M.S.; supervision, M.A.U. and S.M.S.; project administration, M.A.U. All authors have read and agreed to the published version of the manuscript.

Funding

This research received no external funding.

Institutional Review Board Statement

Not applicable.

Informed Consent Statement

Not applicable.

Data Availability Statement

Not applicable.

Conflicts of Interest

The authors declare no conflict of interest.

References

  1. Chowdhury, M.Z.; Hossan, M.T.; Islam, A.; Jang, Y.M. A Comparative Survey of Optical Wireless Technologies: Architectures and Applications. IEEE Access 2018, 6, 9819–9840. [Google Scholar] [CrossRef]
  2. Manor, H.; Arnon, S. Performance of an optical wireless communication system as a function of wavelength. Appl. Opt. 2003, 42, 4285–4294. [Google Scholar] [CrossRef] [PubMed]
  3. Zeng, Z.; Fu, S.; Zhang, H.; Dong, Y.; Cheng, J. A Survey of Underwater Optical Wireless Communications. IEEE Commun. Surv. Tutor. 2017, 19, 204–238. [Google Scholar] [CrossRef]
  4. Celik, A.; Romdhane, I.; Kaddoum, G.; Eltawil, A.M. A Top-Down Survey on Optical Wireless Communications for the Internet of Things. IEEE Commun. Surv. Tutor. 2022, 25, 1–45. [Google Scholar] [CrossRef]
  5. Walsh, S.M.; Karpathakis, S.F.E.; McCann, A.S.; Dix-Matthews, B.P.; Frost, A.M.; Gozzard, D.R.; Gravestock, C.T.; Schediwy, S.W. Demonstration of 100Gbps coherent free-space optical communications at Leo Tracking Rates. Sci. Rep. 2022, 12, 18345. [Google Scholar] [CrossRef] [PubMed]
  6. Majumdar, A.K. Chapter 4—Fundamentals of Free-Space Optical Communications Systems, Optical Channels, Characterization, and Network/Access Technology. In Optical Wireless Communications for Broadband Global Internet Connectivity; Majumdar, A.K., Ed.; Elsevier: Amsterdam, The Netherlands, 2019; pp. 55–116. [Google Scholar] [CrossRef]
  7. Kaur, S. Analysis of inter-satellite free-space optical link performance considering different system parameters. Opto-Electron. Rev. 2019, 27, 10–13. [Google Scholar] [CrossRef]
  8. Jaber, M.; Imran, M.A.; Tafazolli, R.; Tukmanov, A. 5G Backhaul Challenges and Emerging Research Directions: A Survey. IEEE Access 2016, 4, 1743–1766. [Google Scholar] [CrossRef] [Green Version]
  9. Ghassemlooy, Z.; Le Minh, H.; Rajbhandari, S.; Perez, J.; Ijaz, M. Performance Analysis of Ethernet/Fast-Ethernet Free Space Optical Communications in a Controlled Weak Turbulence Condition. J. Light. Technol. 2012, 30, 2188–2194. [Google Scholar] [CrossRef]
  10. Bashir, M.S.; Alouini, M.S. Signal Acquisition with Photon-Counting Detector Arrays in Free-Space Optical Communications. IEEE Trans. Wirel. Commun. 2020, 19, 2181–2195. [Google Scholar] [CrossRef] [Green Version]
  11. Mendenhall, J.A.; Candell, L.M.; Hopman, P.I.; Zogbi, G.; Boroson, D.M.; Caplan, D.O.; Digenis, C.J.; Hearn, D.R.; Shoup, R.C. Design of an Optical Photon Counting Array Receiver System for Deep-Space Communications. Proc. IEEE 2007, 95, 2059–2069. [Google Scholar] [CrossRef]
  12. Bashir, M.S.; Bell, M.R. The Impact of Optical Beam Position Estimation on the Probability of Error in Free-Space Optical Communications. IEEE Trans. Aerosp. Electron. Syst. 2019, 55, 1319–1333. [Google Scholar] [CrossRef]
  13. Hugot, E.; Jahn, W.; Chambion, B.; Moulin, G.; Nikitushkina, L.; Gaschet, C.; Henry, D.; Getin, S.; Ferrari, M.; Gaeremynck, Y. Flexible focal plane arrays for UVOIR wide field instrumentation. In Proceedings of the High Energy, Optical, and Infrared Detectors for Astronomy VII, Astronomical Telescopes + Instrumentation, SPIE, Biarritz, France, 18–21 October 2016; Volume 9915, p. 1H. [Google Scholar] [CrossRef] [Green Version]
  14. Khalighi, M.A.; Uysal, M. Survey on free space optical communication: A communication theory perspective. IEEE Commun. Surv. Tutor. 2014, 16, 2231–2258. [Google Scholar] [CrossRef]
  15. Hemmati, H. Deep Space Optical Communications; John Wiley & Sons: Hoboken, NJ, USA, 2006; Volume 11. [Google Scholar]
  16. Snyder, D.L.; Miller, M.I. Point and Counting Processes: Introduction and Preliminaries. In Random Point Processes in Time and Space; Springer: New York, NY, USA, 1991; pp. 1–40. [Google Scholar] [CrossRef]
  17. Bashir, M.S.; Bell, M.R. Optical beam position estimation in free-space optical communication. IEEE Trans. Aerosp. Electron. Syst. 2016, 52, 2896–2905. [Google Scholar] [CrossRef]
  18. Shiu, D.S.; Kahn, J. Differential pulse-position modulation for power-efficient optical communication. IEEE Trans. Commun. 1999, 47, 1201–1210. [Google Scholar] [CrossRef] [Green Version]
  19. Audeh, M.; Kahn, J. Performance evaluation of baseband OOK for wireless indoor infrared LAN’s operating at 100 Mb/s. IEEE Trans. Commun. 1995, 43, 2085–2094. [Google Scholar] [CrossRef]
  20. Bashir, M.S. Free-space optical communications with detector arrays: A mathematical analysis. IEEE Trans. Aerosp. Electron. Syst. 2019, 56, 1420–1429. [Google Scholar] [CrossRef]
  21. Kay, S.M. Fundamentals of Statistical Signal Processing; Prentice Hall PTR: Hoboken, NJ, USA, 1993. [Google Scholar]
  22. Bashir, M.S.; Alouini, M.S. Free-Space Optical MISO Communications with an Array of Detectors. IEEE Open J. Commun. Soc. 2020, 1, 1765–1780. [Google Scholar] [CrossRef]
  23. Bashir, M.S.; Tsai, M.C.; Alouini, M.S. Cramér–Rao Bounds for Beam Tracking with Photon Counting Detector Arrays in Free-Space Optical Communications. IEEE Open J. Commun. Soc. 2021, 2, 1065–1081. [Google Scholar] [CrossRef]
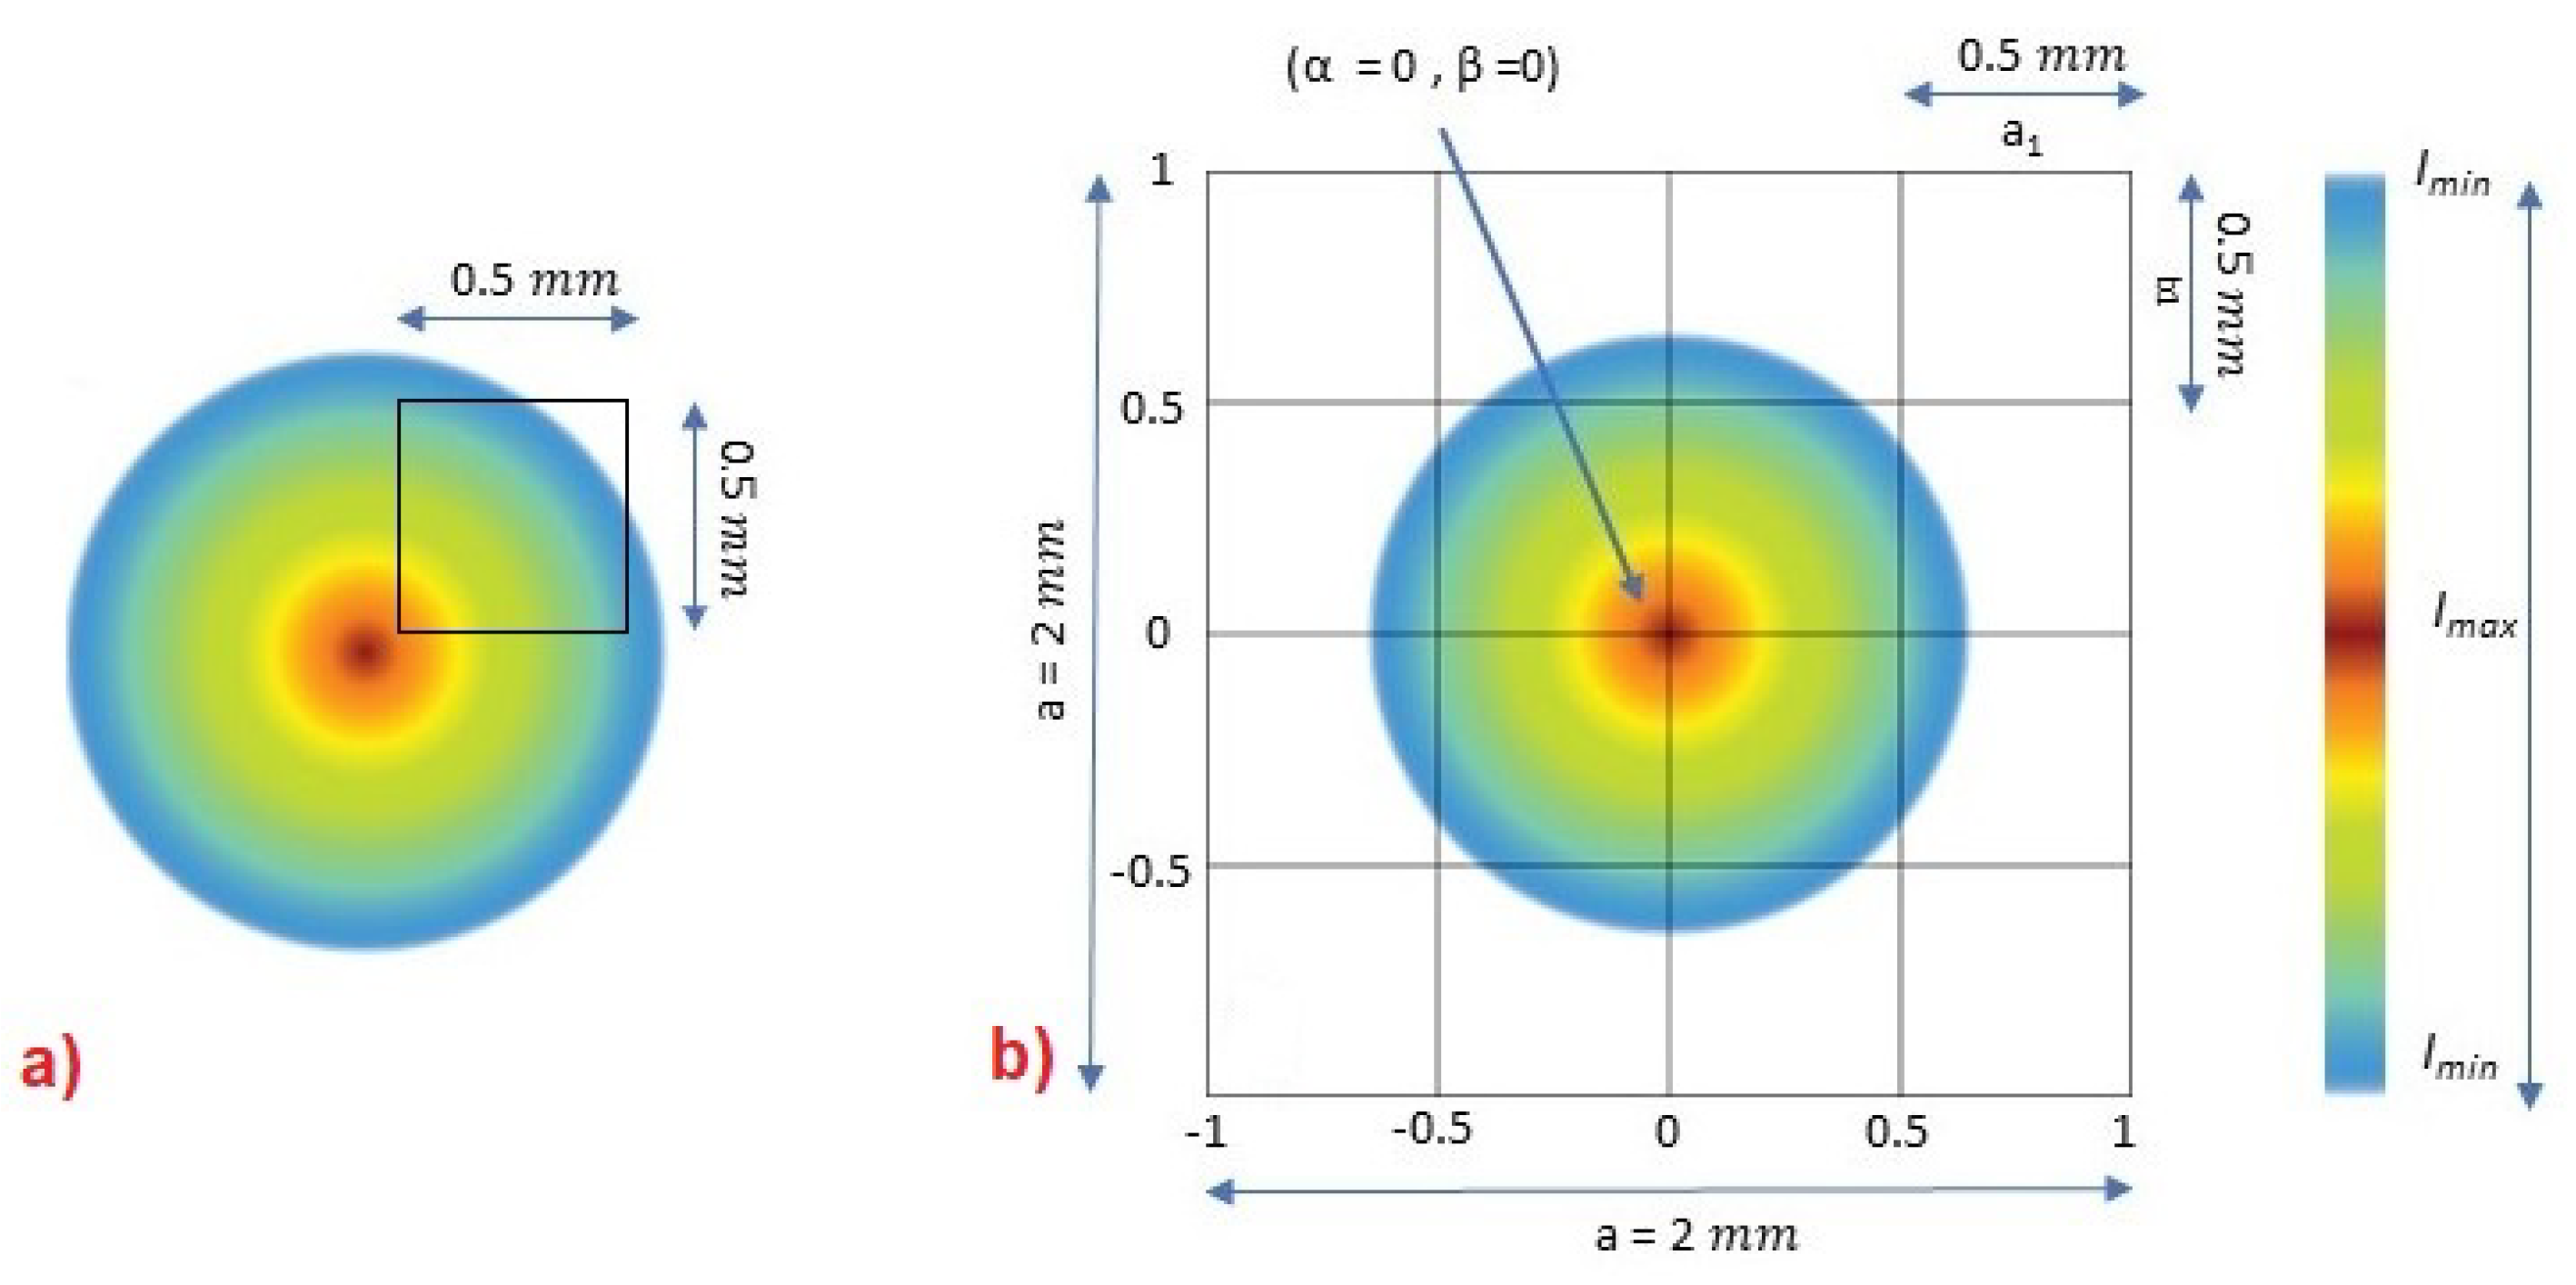
Figure 1. Footprint of Gaussian beam observed at receiver. (a) Single photo-detector, and (b) array of photo-detectors.
Photonics 10 00930 g001
Figure 2. Estimated signal intensity I o ^ for different values of λ 0 = 0 ,   λ 1 = 1 ,   λ 2 = 2 .
Photonics 10 00930 g002
Figure 3. Mean square error for I o = 50 , ρ = 1 , ( α , β ) = ( 0 , 0 ) .
Photonics 10 00930 g003
Disclaimer/Publisher’s Note: The statements, opinions and data contained in all publications are solely those of the individual author(s) and contributor(s) and not of MDPI and/or the editor(s). MDPI and/or the editor(s) disclaim responsibility for any injury to people or property resulting from any ideas, methods, instructions or products referred to in the content.