1. Introduction
Hollow core fiber (HCF), as a special microstructure device, has enabled sensor size miniaturization. In recent years, the anti-resonant (AR) effect integrated into HCF has shined light on its optical characterization, which is referred to as anti-resonant hollow core fiber (AR-HCF). It is precisely because the AR effect enriches the optical transmission in the HCF, which provides a micro-sized inline platform to achieve diversified sensing detection. In particular, AR-HCF has a great prospect in special scenario sensing applications, such as in the fields of microfluidics [
1], photothermal spectroscopy [
2], and photoacoustic imaging [
3,
4]. Moreover, several common physical parameters can be directly detected by monitoring the variation in the AR transmission spectrum. For example, exploiting the drift of the resonance peak can acquire the measurement of temperature [
5], displacement [
6], stress [
7], curvature [
8], refractive index [
9], and gas pressure [
10]. These measurands all take advantage of the AR optical characteristics, which feature resonant peaks and an irregularly coherent envelope [
11]. Unlike the direct wavelength demodulation of the aforementioned parameters, the photothermal or photoacoustic effect needs the interaction between light and gas to excite acoustic signals [
12]. AR-HCF combined with femtosecond laser drilling techniques can provide a perfect microscale platform to induce photoacoustic effect generation. Thus, the acoustical characterization in AR-HCF appears to be significant. To the best of our knowledge, it has been seen so rarely in the relative reports about acoustical transmission in HCF so far.
Recently, AR-HCF-based photoacoustic effects have given rise to their application in trace gas detection [
13,
14]. However, the acoustic signal generated by the interaction between light and gas is pretty weak, especially in such a narrow area. Therefore, enhancing light-induced acoustic efficiency is the key point to address the issues of low sensitivity and detection thresholds. Several typical methods are proposed to achieve the above goal, such as mode-phase-difference photothermal spectroscopy [
15,
16] and photoacoustic Brillouin spectroscopy [
17]. These solutions are focused on the physical mechanisms to achieve higher sensitivities rather than geometric structures. Additionally, the excitation efficiency of the acoustic signal can be further increased by optimizing the geometry of the AR-HCF. In particular, partial light will leak out of the fiber cladding when the beams meet resonant conditions, which means the exciting power is relatively decreased compared with the incident probe light. Thus, more beams should be confined in the hollow core region to access higher photoacoustic excitation efficiency. AR-HCF embedded with Bragg cladding enables the leaking beams to reflect back to the air core region. This special optical device is referred to as an anti-resonant Bragg hollow core fiber (AR-BHCF). Consequently, for the photoacoustic or photothermal effect, the distribution and propagation of the optical and acoustic field occupies a decisive position in the AR-BHCF.
In this study, we conducted a simulation and an experiment on the AR effect in an HCF and BHCF, and the results revealed that the AR-BHCF can enable more beams to be restricted in the air core region indeed. Then the excitation efficiency of the photoacoustic effect enhances dramatically with the total exciting power increasing. The comparison results of the detected acoustic wave amplitude directly characterize the light-induced acoustic efficiency. Furthermore, the frequency response of acoustic wave propagation in the BHCF ranges from 1 Hz to 1 MHz, covering infrasound to ultrasound. This feature of the ultra-wideband is instrumental in multiple-component gas monitoring at the microscale level. Unlike the low-frequency band, the beat frequency resonance will occur with the sound source frequency approaching the natural frequency of the AR-BHCF at a relatively high-frequency band. It should be noted that the frequency of photoacoustic trace gas detection is mainly focused below 10 kHz. Hence, the research on acoustic and optical characterization in the AR-BHCF will make it possible to promote the HCF-based new type of distributed acoustic sensing rapidly.
2. Anti-Resonant Effect and Optical Characterization in the BHCF
The proof-of-concept of the AR reflecting optical waveguide was proposed to solve the energy loss on a silicon substrate in 1986 [
18], while the AR effect was first demonstrated in 2002 [
19]. To access more excited light in the air core, we proposed the BHCF in our previous work [
20]. The cross-section of the BHCF is shown in
Figure 1a. It can be seen that four slightly higher refractive index layers are embedded into the cladding, constructing the Bragg cladding. The refractive indices of the core, cladding, and high index layer are
n0,
n1, and
n2, respectively. The thickness of the high-index layer is d
2, and the interval of two adjacent layers is d
1.
Figure 1b presents the schematic diagram of the BHCF, and the light-guide mechanism of the inset indicates that more light beams will be reflected to the air core after passing through the Bragg cladding. On the one hand, light is reflected at the interface of each high refractive index layer and the cladding layer. On the other hand, each layer can also be regarded as an FP resonator, which means the AR effect exists in the whole Bragg region. Moreover, the BHCF is sandwiched between single-mode fibers (SMFs) by fusion splicing as shown in
Figure 1b, and the length is selected as 875 μm to ensure the generation of the AR effect [
21]. The optical field distribution of the resonant wavelength (λ = 1540 nm) and the anti-resonant wavelength (λ = 1550 nm) are illustrated in
Figure 1c,d, respectively. The periodic loss peaks will also appear in the transmission spectrum of the BHCF. The wavelength of the lossy dip corresponding to the resonant condition and the deduced universal formula of
λm can be expressed as:
where
represents the resonance order. Here,
; thus, the Equation (1) can be simplified as:
In general, we can obtain the
λm with an arbitrary number of Bragg layers:
where
N is the number of high refractive index layers and d
p and
np are the thickness and refractive index of this layer, respectively. In this case, the value of
N is 4, and d
p and
np correspond to d
2 and
n2 in
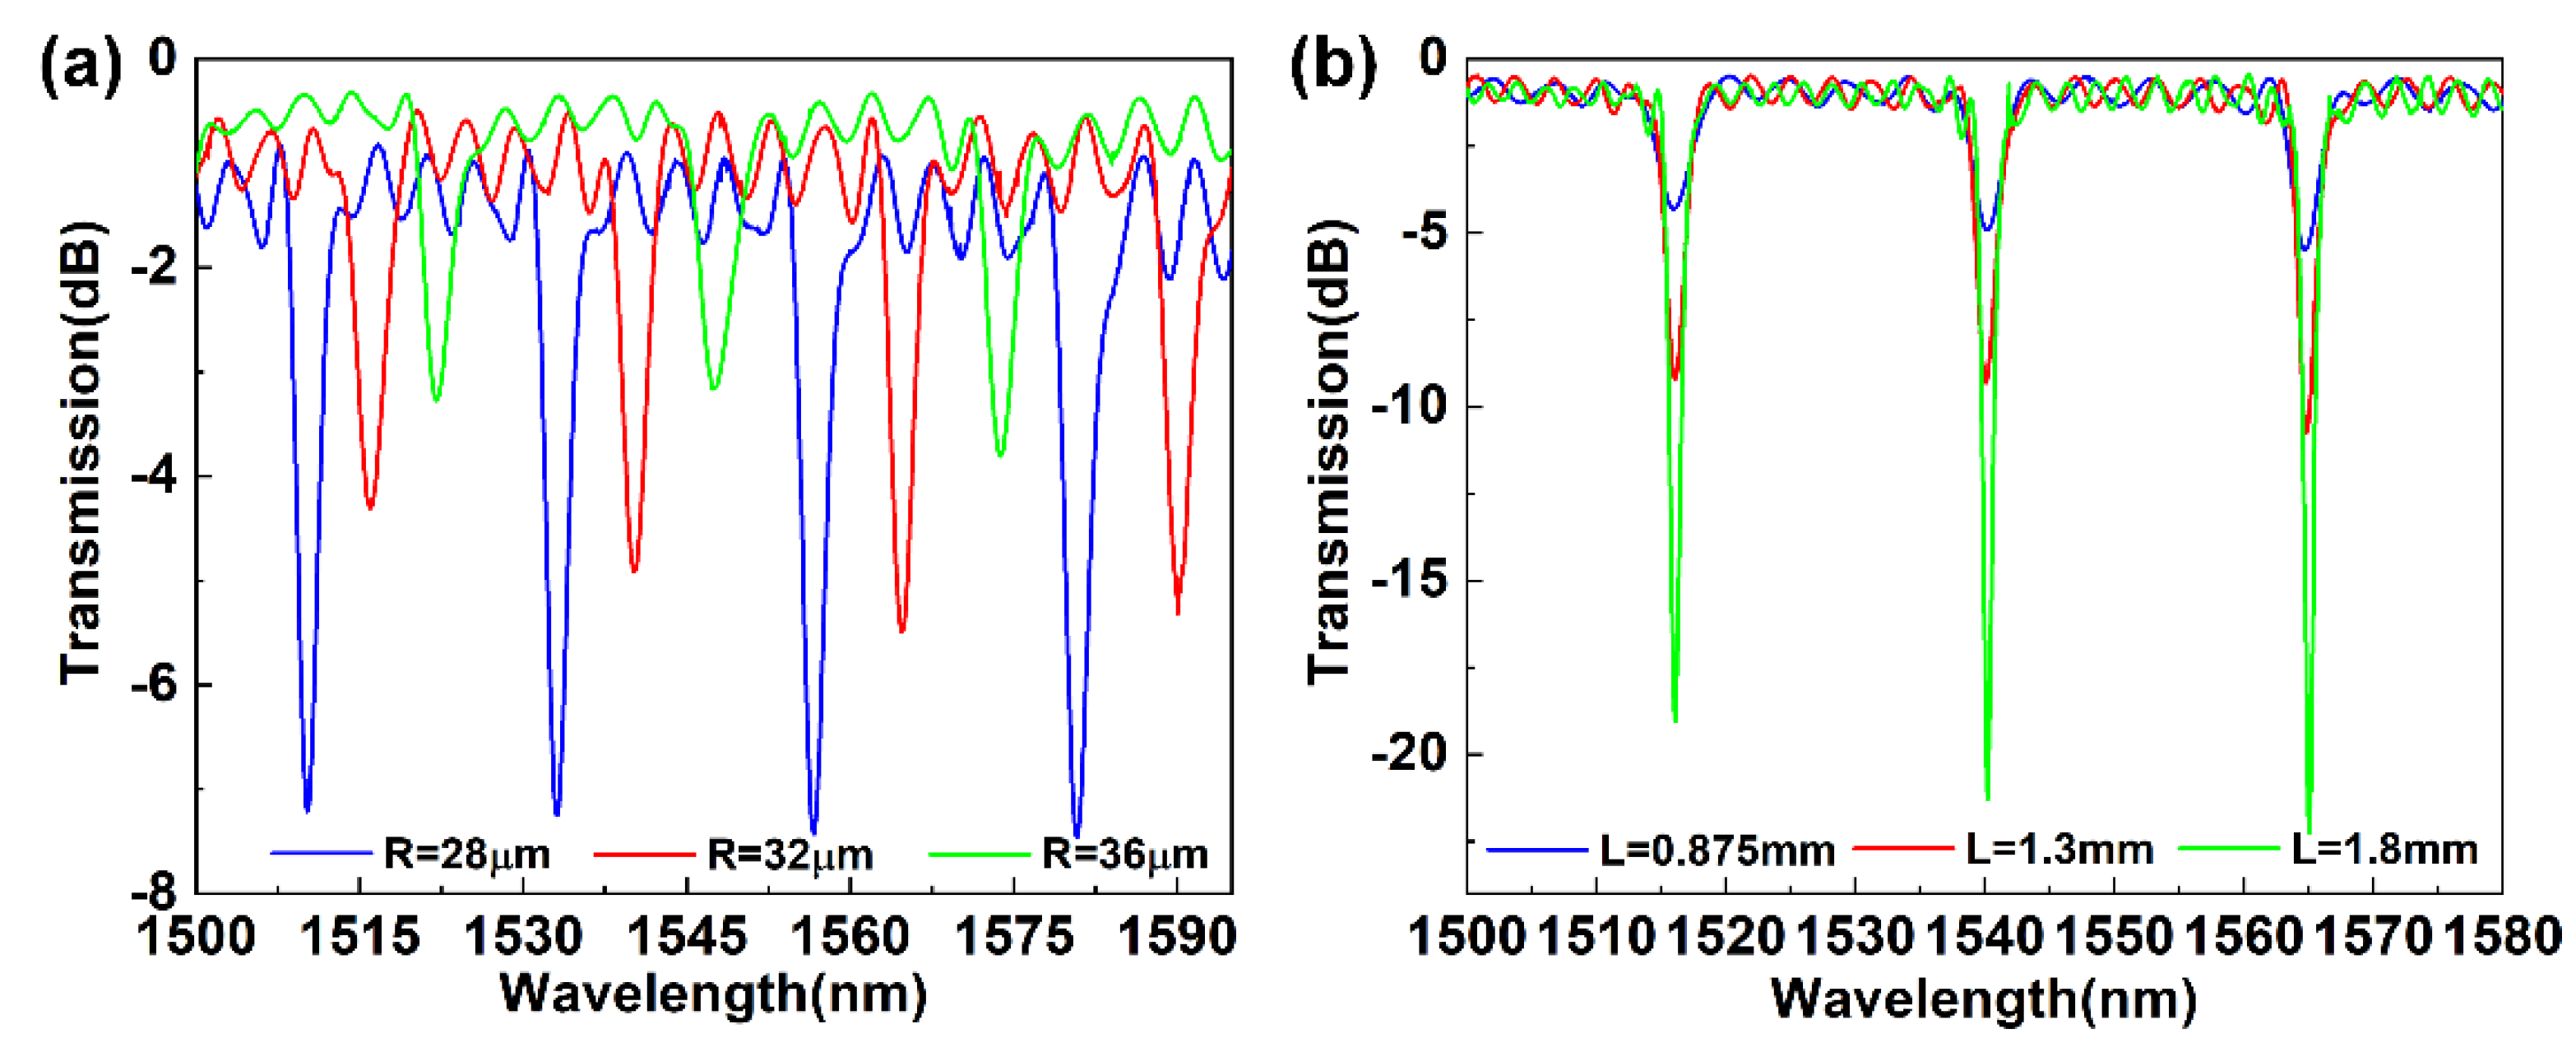
Figure 1b, respectively. Here, the transmission spectrum of the BHCF with different length
L and inner diameter
R(2
r) are acquired and are shown in
Figure 2a,b. The distribution of the refractive index is 1.000, 1.444, and 1.454 corresponding to
n0,
n1, and
n2, respectively. The cladding diameter of the BHCF is 125 μm. The thickness of the high-index layer is 1.06 μm, and the interval of two adjacent layers is 3.07 μm, corresponding to d
1 and d
2. The structure parameters setting is similar to the AR-HCF. R is set as 28 μm, 32 μm, and 36 μm with an L of 875 μm, as depicted in
Figure 2a. Likewise, with R increasing, all dips drift to a short wavelength direction, and the contrast gradually fades. As shown in
Figure 2b, once R is confirmed, the position of the resonant peaks will remain unchanged regardless of the length of the BHCF. Moreover, the resonant peaks are dramatically sharp with L increasing. It should be noted that the splicing between the SMF and BHCF is selected as the aligned fusion not the collapsed manners.
The geometric structure of the cladding characterizes four high refractive index layers, which can induce multiple AR effects in Bragg cladding. In Equation (1), the value of N is 0 and 4 for the HCF and the BHCF, respectively. It is apparent that the positive items of the BHCF of
λm are more than the HCF. Thus, under the conditions of the same parameters, the resonant peaks of the BHCF will undergo a red shift compared with HCF, as illustrated in
Figure 3. As expected, the Bragg structure can induce multiple AR effects to enhance the utilization efficiency of excited light, according to the aforementioned description of optical characterization in the BHCF. Then, the light induces sound, and its propagation characteristics in the BHCF will be emphatically analyzed in the next part.
3. Acoustical Characterization of the BHCF
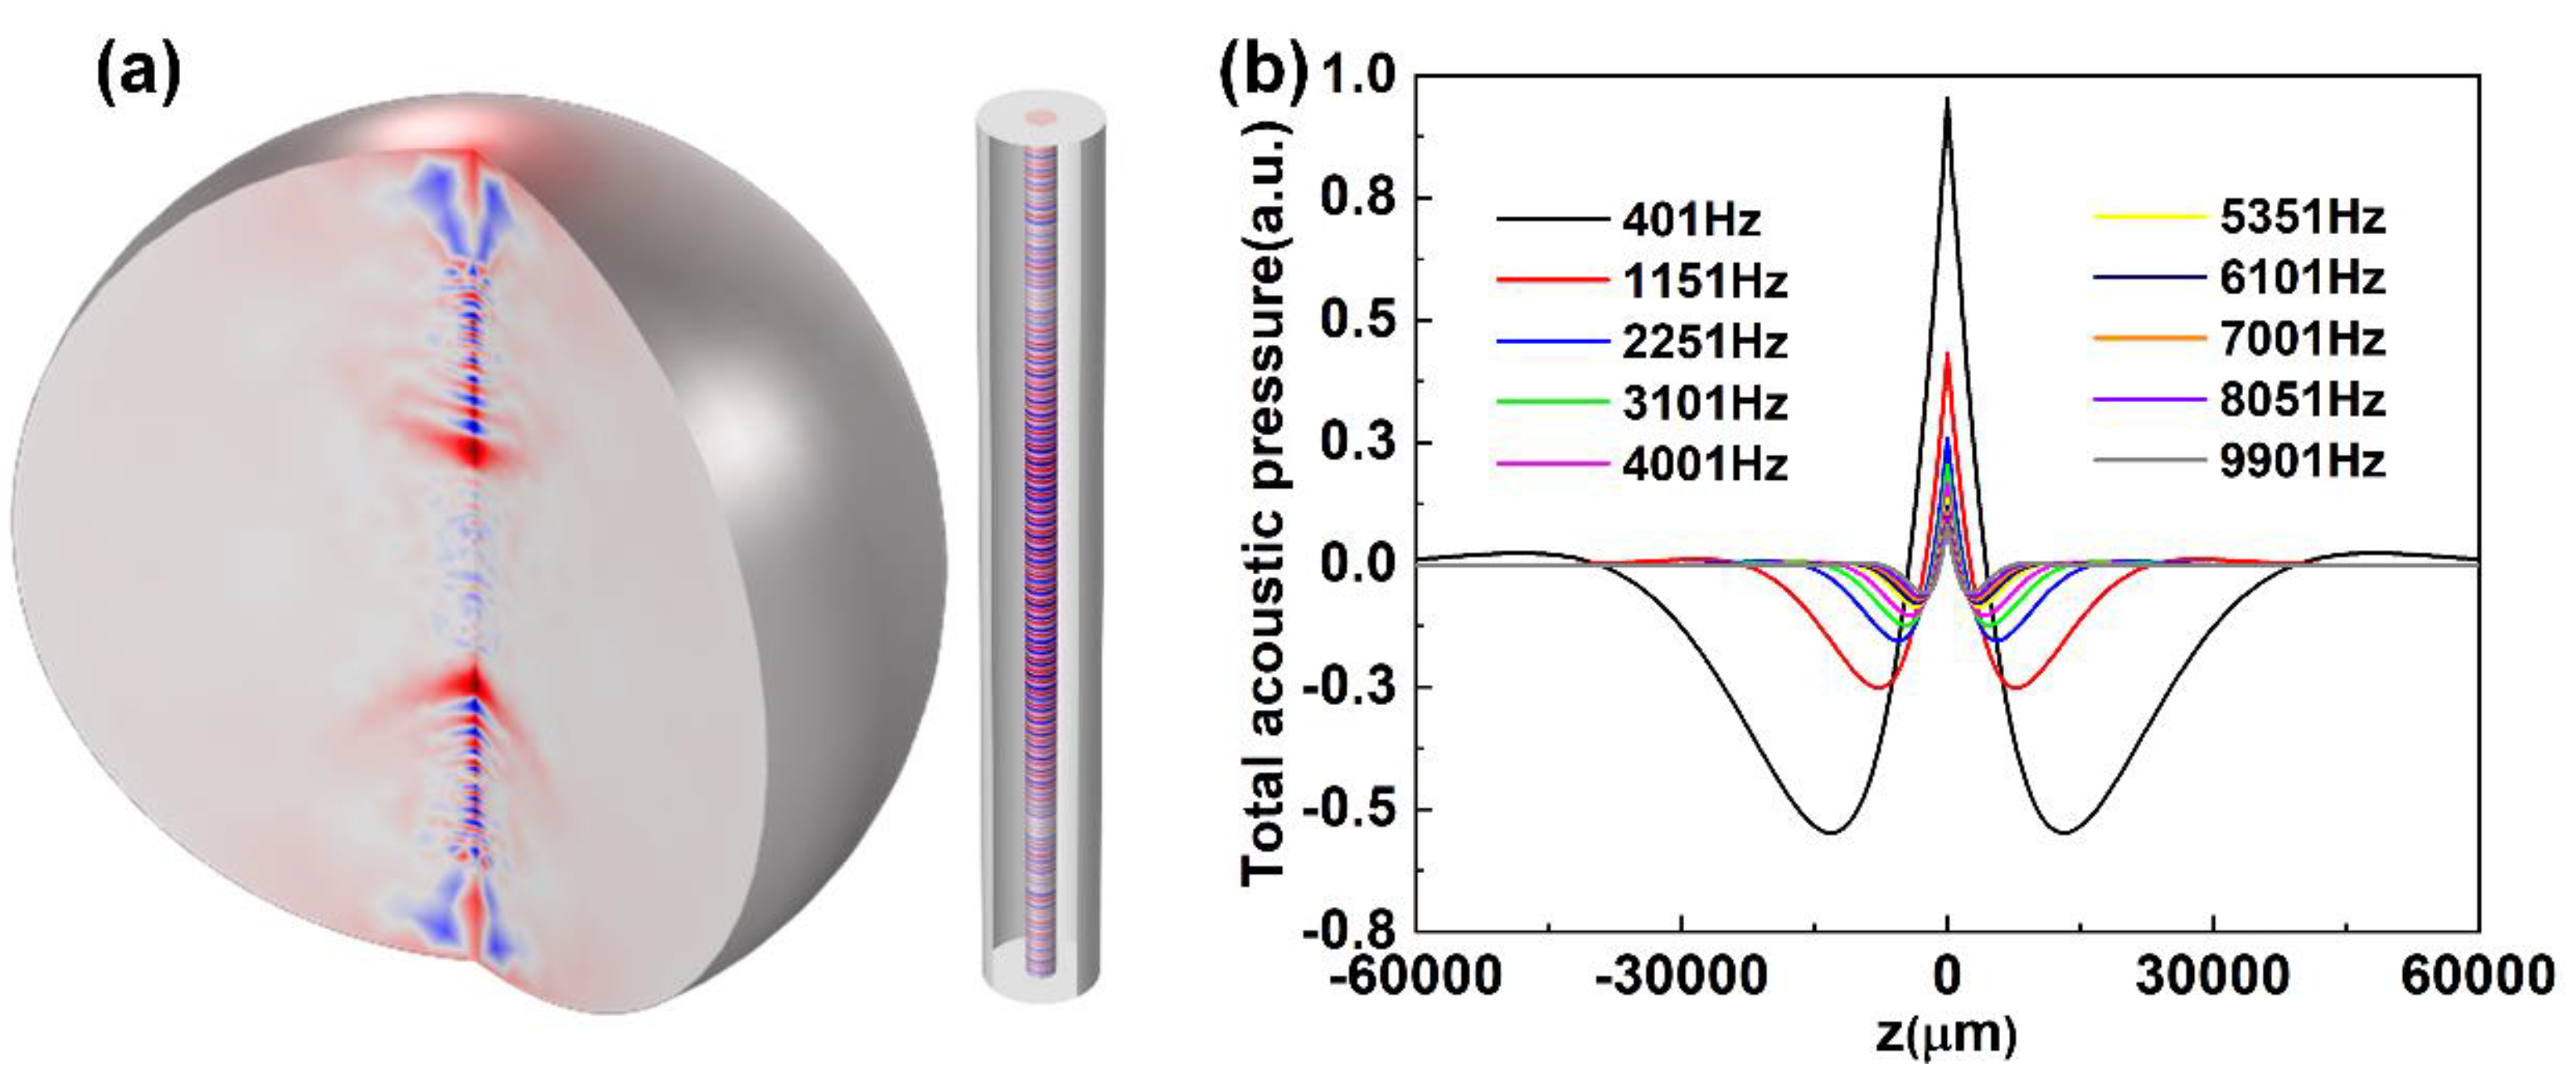
The propagation of acoustic waves is relatively complicated when there is more than one medium. In the past decades, several solutions have been reported for the propagation of acoustic waves in circular tubes. Here, assuming that the model of the BHCF is a circular pipe with a diameter in the order of microns, to explore the propagation of acoustic waves in the BHCF, a simulation was conducted to exploit the finite element analysis method in the frequency and time domain. As shown in
Figure 4a, the adopted model is a section of the BHCF placed in the air. It should be noticed that the simulation of the infinite domain needs to truncate the air domain into a spherical one. The diameter of the air core and fiber cladding are 30 μm and 125 μm, respectively, and the other parameters are consistent with those described in
Figure 5. In the frequency domain, the governing equation is the inhomogeneous Helmholtz equation:
where
ρ refers to the density and c denotes the sound velocity. The subscript “
c” on the density and the sound velocity represents that they will be complex values when there is a loss in the medium. Ω is the angular frequency, and
pt is the total pressure which is the sum of a possible background pressure field and the scattered field.
Qd is the dipole source, and
Qm denotes the monopole source item. In particular, the viscous loss and thermal loss of the acoustic wave near the inner wall of the air core should be considered. Therefore, it is necessary to introduce complex wave number
kc and complex acoustic impedance
Zc, which can be expressed as:
where γ is the ratio of specific heats.
k0 =
ω/c represents the free space wave number, and
Z0 =
ρc is the specific acoustic impedance.
Yv and
Υth are the mean value of the scalar viscous and thermal field functions, respectively. The subscripts “v” and “th” stand for viscous and thermal fields, respectively. Once these are confirmed, the complex sound velocity and complex density used in (2) can be given by:
The function
Υi (
i stands for v or th) can be solved by breaking down the full set of linearized Navier–Stokes equations into an isentropic (adiabatic), viscous, and thermal part. Then the viscous and the thermal wave numbers can be expressed as below:
where
Cp is the heat capacity at constant pressure, ε represents the thermal conductivity of the medium, and μ is the dynamic viscosity. Therefore,
Υi can be expressed as:
where
J2 and
J0 represent the second-order and zero-order Bessel functions, respectively, and r is the inner radius of the fiber. Here, a monopole acoustic source is equivalent to the inducing sound of the interactions between light and gas, which is exposed in the middle of the air core of the BHCF. The distribution of acoustic pressure in the frequency domain (right inset) is shown in
Figure 4a. Obviously, the acoustic pressure gradually attenuates along the axial direction of the fiber. Generally, the acoustic pressure is proportional to the gas concentration when the pulsed light is loaded on the stimulated gas. Consequently, the position of the strongest acoustic pressure is located in the middle of the BHCF, which denotes the gas density mainly concentrated in this part.
Figure 4b reveals that the attenuation along the axial direction of the BHCF is faster as the frequency increases, which agrees with Equation (5). Additionally, the response effect in low frequency is better than the high-frequency band in the BHCF, which is contrary to the acoustic wave propagation in the air. In the frequency domain, these results merely reflect the characteristics of the acoustic response. To access the comprehensive acoustical features of the BHCF, the characterizations of the real-time propagation of acoustic waves are indispensable. In the time domain, taking
Figure 4a (left inset) as an example, the frequency of the sound source and the fiber length are 50 Hz and 1 m, respectively. Moreover, both ends of the BHCF are set as the hard boundary condition. The instantaneous state distribution of the acoustic field is illustrated in
Figure 4a (left inset) after propagation of 2.3 ms. We can see that the acoustic field is distributed symmetrically. In particular, when the propagated frequencies meet the conditions of destructive interference, the acoustic field will disappear in the BHCF. As illustrated in
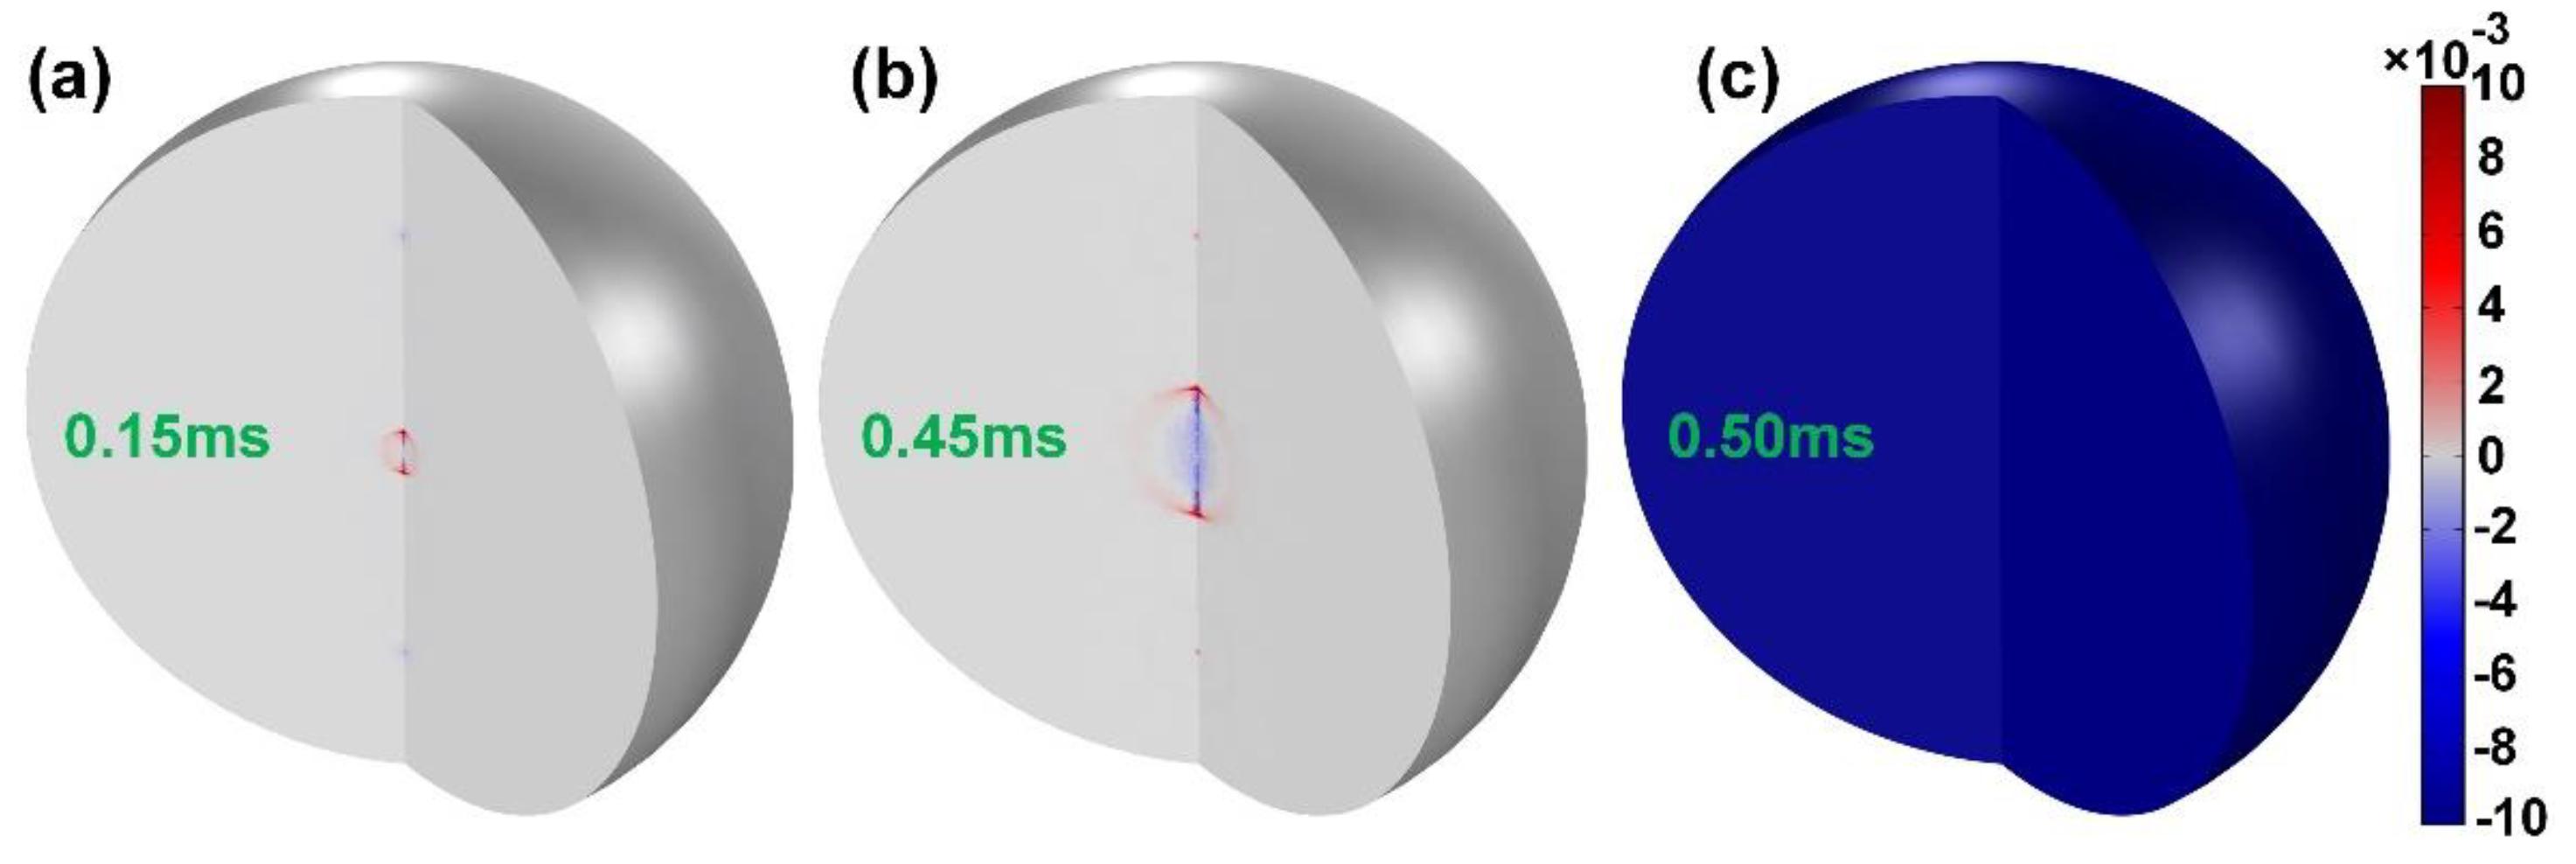
Figure 5a–c, the 1 kHz acoustic signal will gradually spread out along with the fiber axial, and then it vanishes abruptly at the moment of 0.5 ms. This phenomenon is induced by the standing wave effect when acoustic wave propagation takes place in this closed boundary condition. This moment happens to the two acoustic signals propagating in opposite directions with coherent cancellation in the BHCF.
In the field of acoustical measurement, the range of frequency response is a vital evaluation index. In particular, acoustic wave propagation in an enclosed capillary pipe is greatly distinct from the free space. As described in
Figure 5c, several special frequencies are sporadically distributed in the whole response band. To further acquire the frequency response range, the length and inner diameter of the BHCF were selected as 10 cm and 30 μm, respectively. Moreover, the detection point was set at 3.5 cm away from the sound source to record the real-time variation of acoustic pressure. From
Figure 6a to
Figure 6d, the monitoring frequency is 1 Hz, 100 Hz, 10 kHz, and 1 MHz, respectively, covering the range from infrasound to ultrasound. The inset in these four cases shows the acoustic field and acoustic pressure distribution at a certain time. Under the same conditions, the acoustic pressure of the low-frequency band obviously surpasses the high-frequency band. In other words, the BHCF is more suitable for low-frequency acoustic wave propagation. According to the definition of the natural frequency, here, the length is the most important factor for the characteristic frequency of the BHCF. The characteristic frequency when theoretically calculated is 10,296 Hz on the basis of the aforementioned setting parameters.
Figure 6 reveals that the resonance phenomenon will be dominant when the sound source frequency is closer to the natural frequency. Moreover, when the excited frequency is 10 kHz, which approaches extremely close to the calculated value, the beat frequency phenomenon occurs in the BHCF, as displayed in
Figure 6c. The time domain waveform of 10 kHz contains a finesse fringe and envelope structure, corresponding to the frequency components of 10.3 kHz and 10 kHz, respectively. Furthermore, 10 kHz is similar to the effect of 1 kHz, manifested by the illustration of the acoustic field distribution at 0.049 ms. The acoustic field of 10 kHz will suddenly disappear at 0.05 ms. It can be speculated that the coefficient of 0.5 multiplied between the propagation frequency and time can be regarded as the characteristic constant for the acoustic field forbidden band. This unique feature may open up a new avenue for the self-calibration of the acoustic wave in the BHCF.
In acoustic wave measurement, intensity information is the most direct manifestation of the acoustic signal.
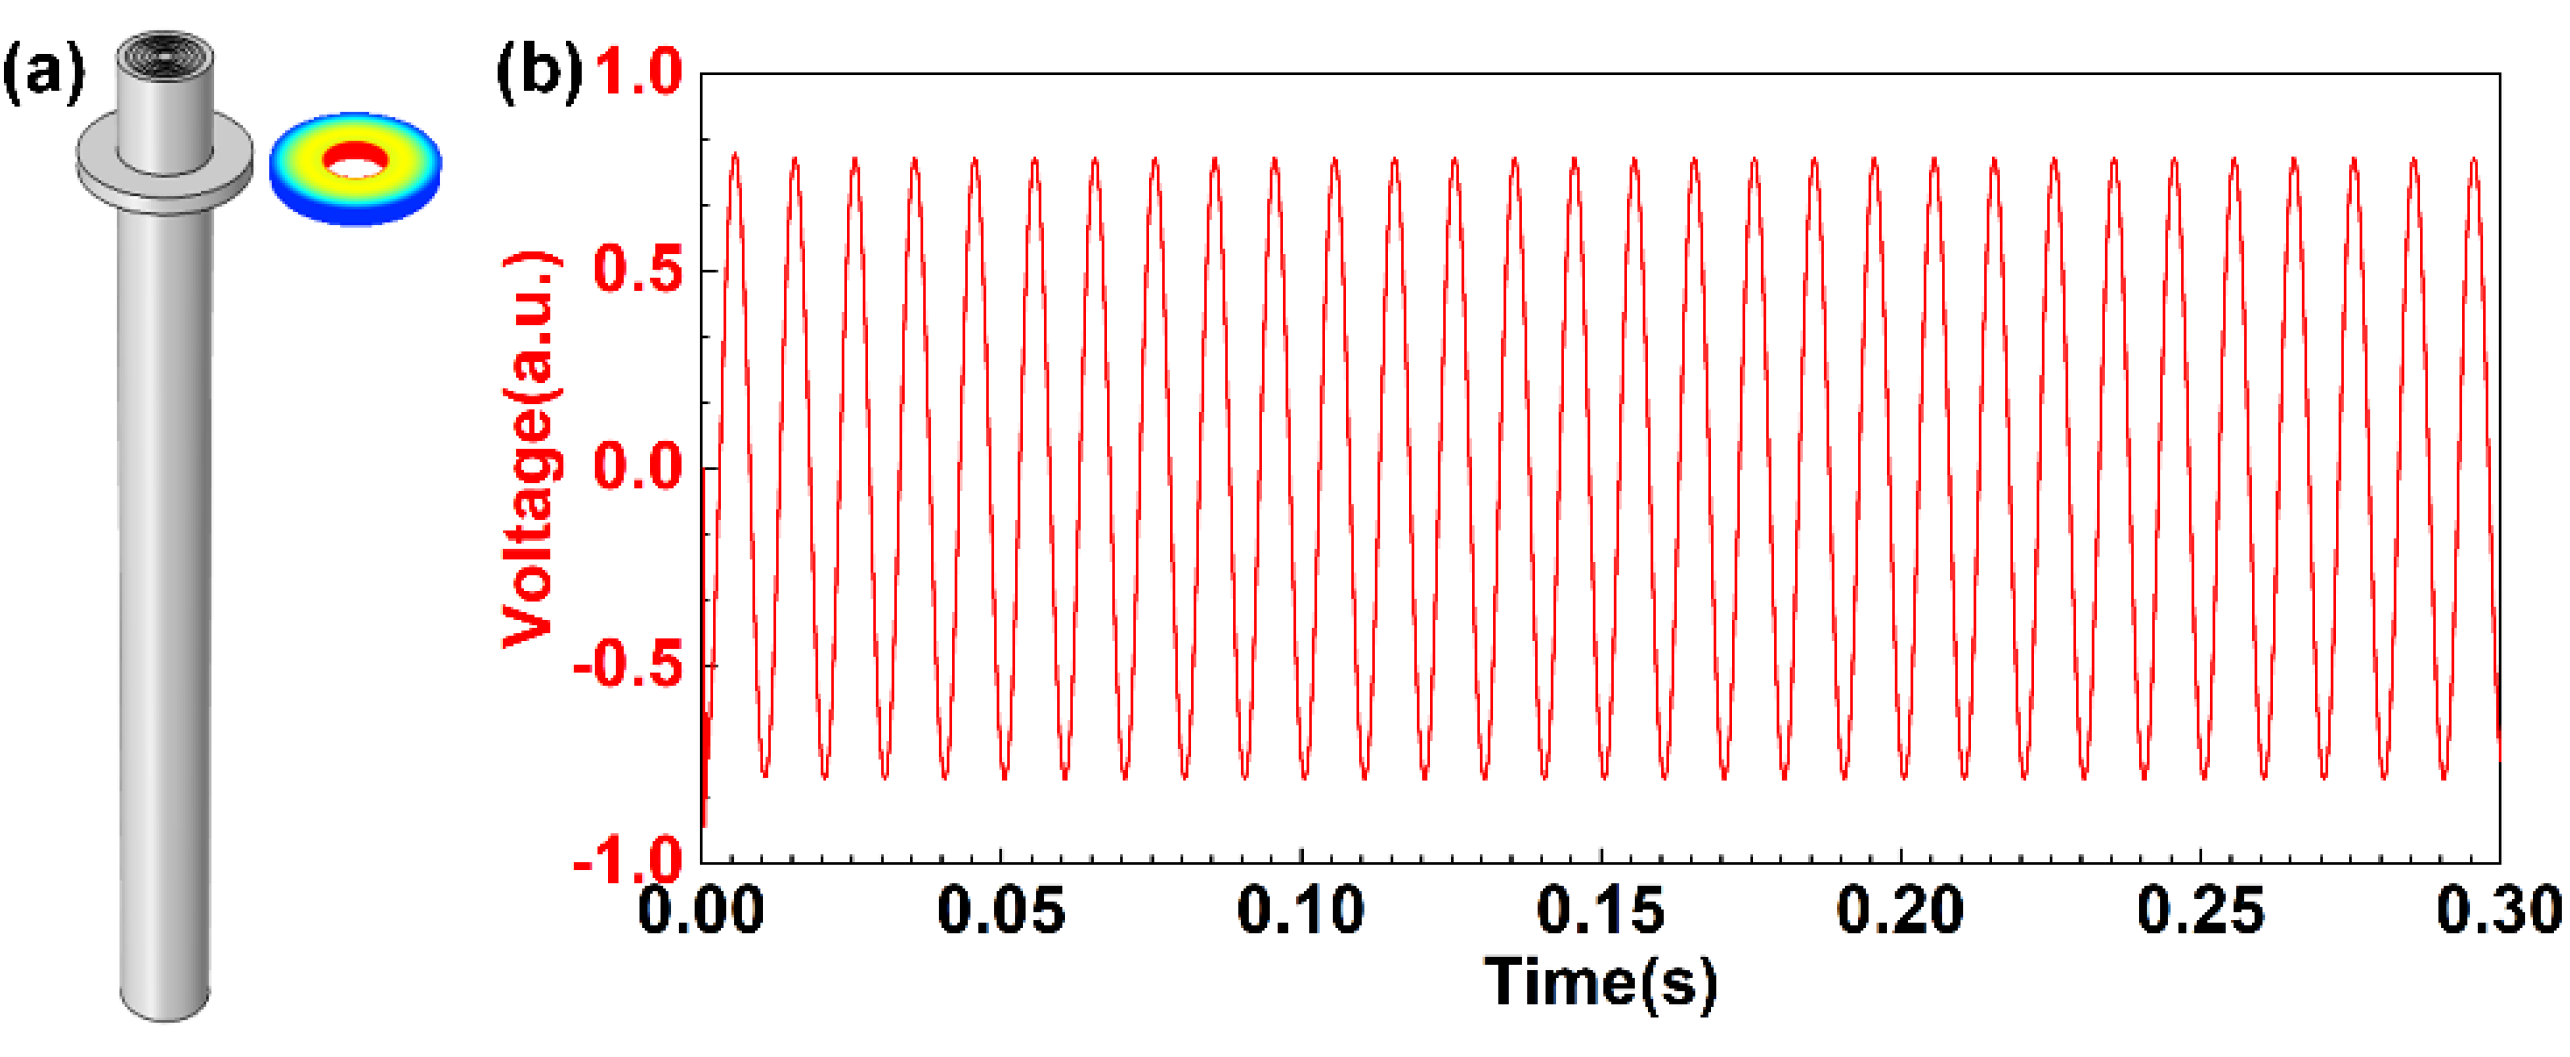
Figure 4a indicates that the acoustic wave possesses the capacity of penetrating the fiber cladding and scattering to the external environment. Therefore, the acoustic pressure can be converted into a measurable voltage value by piezoelectric ceramics on the surface of the BHCF, as denoted in
Figure 7a. The piezoelectric ceramics can take full advantage of sound-sensitive features to transform the pressure to terminal voltage. It can be seen from
Figure 7b that the time domain waveform of the detected voltage reflects the monitoring frequency of 100 Hz. This result is highly consistent with the inset of
Figure 6b. Depending on the acoustic pressure detection ability on the outer surface of the BHCF, the intensity of the frequency can be obtained in real time. Here, the ultra-high sensitivity acoustic sensor can be qualified as the key device to achieve weak signal acquisition, which was presented in our previous research work [
22]. Thus, the gas concentration of the inducing photoacoustic effect can be subjected to inverse analysis. All these findings provide a great prospect for trace gas monitoring.


