Communication

Meta-Surface Slide for High-Contrast Dark-Field Imaging

1
Zhejiang Provincial Key Laboratory of Laser Processing Robotics, College of Mechanical and Electrical Engineering, Wenzhou University, Wenzhou 325035, China
2
International Science and Technology Cooperation Base for Laser Processing Robot, Zhejiang Provincial Key Laboratory of Laser Processing Robot, Wenzhou University, Wenzhou 325035, China
3
Rui’an Graduate College, Wenzhou University, Wenzhou 325206, China
*
Author to whom correspondence should be addressed.
Photonics 2023, 10(7), 775; https://doi.org/10.3390/photonics10070775
Submission received: 7 May 2023 / Revised: 9 June 2023 / Accepted: 28 June 2023 / Published: 4 July 2023

Abstract

:
A label-free microscopy technology, dark-field microscopy, is widely used for providing high-contrast imaging for weakly scattering materials and unstained samples. However, traditional dark-field microscopes often require additional components and larger condensers as the numerical aperture increases. A solution to this is the use of a meta-surface slide. This slide utilizes a multilayer meta-surface and quantum dots to convert incident white light into a red glow cone emitted at a larger angle. This enables the slide to be used directly with conventional biological microscopy to achieve dark-field imaging. This paper focuses on the design and preparation of the meta-surface and demonstrates that using the meta-surface in a standard transmission optical microscope results in a dark-field image with higher contrast than a bright-field image, especially when observing samples with micron-sized structures.

1. Introduction

Micro-imaging technology is a valuable asset for biological and medical research. It enables the efficient tracking of individual particles within cells and allows for non-invasive observation of micro-cellular structures. Recently, various label-free super-resolution microscopy techniques have emerged, super-resolution approaches 1–6 can achieve resolution in cells in the range of 15 to 20 nm [1,2,3,4,5], including near-field scanning optical microscopy (NSOM) [6,7,8,9], photoactivated localization microscopy (PALM) [10,11], structured illumination microscopy (SIM) [12,13], stimulated emission depletion microscopy (STED) [14,15], and stochastic optical reconstruction microscopy (STORM) [16]. Dark-field microscopy, a conventional label-free technique, is known for its high visibility and signal-to-noise ratio [17]. This method employs scattered light to produce images, utilizing the high-frequency component of the scattered light [18,19]. During the imaging process, the illumination light is blocked by a shading ring, and only scattered light is captured by the objective lens [20,21,22]. However, traditional dark-field microscopes can be complex [23,24]. To simplify the equipment and improve image resolution, using optical meta-surfaces to create dark-field imaging may be a feasible solution [25,26]. An optical meta-surface is an artificial two-dimensional material made up of sub-wavelength structures designed to manipulate light in specific ways [27,28,29]. It has the ability to manipulate the phase and amplitude of light waves passing through it, enabling control over the wavefront, polarization, and direction of light. Meta-surfaces have applications in areas such as optics, photonics, and imaging and have the potential to greatly improve existing technologies such as lenses and optical filters [30,31,32].
For example, Balaur developed a pattern phase microscope with a silver coating as the imaging substrate, and the photon meta-surface was applied to the phase microscopy technology [33]. The signal contrast was enhanced by the nonlinear optical response of the amplitude and phase of the transmitted light on the coating surface [34], and the phase contrast of the ultra-thin sample (<100 nm thick) and the unlabeled sample 4μm thick breast tissue was greatly increased [35]. Photonic meta-surface can also be used in dark-field microscopy, using simple and compact instrument configurations to achieve dark-field imaging [36,37,38,39]. For instance, Cécile A. C. Chazot et al. proposed a photonic substrate [40] with a controllable angular emission angle based on a Bragg reflector [41,42], gold nanoparticles, and quantum dots. Under the excitation light source of 405 nm, high-contrast dark-field images of microbial samples were obtained. Yan Kuai et al. proposed a multilayer dielectric film combined with TiO2 nanoparticles to achieve dark-field and total internal reflection imaging at 640 nm and 750 nm excitation wavelengths [43], respectively.
A new dark-field imaging meta-surface has been proposed for use in optical microscopes. This design, made from a combination of a multilayer dielectric film, quantum dots (QDs), and filter, is compact in size and can replace the traditional dark-field condenser lens (Figure 1). Using an objective lens (40x.NA0.65), the meta-surface was able to achieve high-contrast dark-field imaging. In testing, the meta-surface achieved contrasts of 0.786 ± 0.003 when observing silicon carbide (SiC) nanowires under light emitting diode (LED). The contrast is 0.827 ± 0.003 by using 1-μm monodisperse polystyrene microspheres in dark-field imaging compared to 0.149 ± 0.004 in bright-field imaging. This design is easily replaceable and usable in various simple bright-field microscopes, making it a promising solution for portable dark-field microscopy.

2. Preparation and Testing Methods

2.1. Fabrication of the Meta-Surface

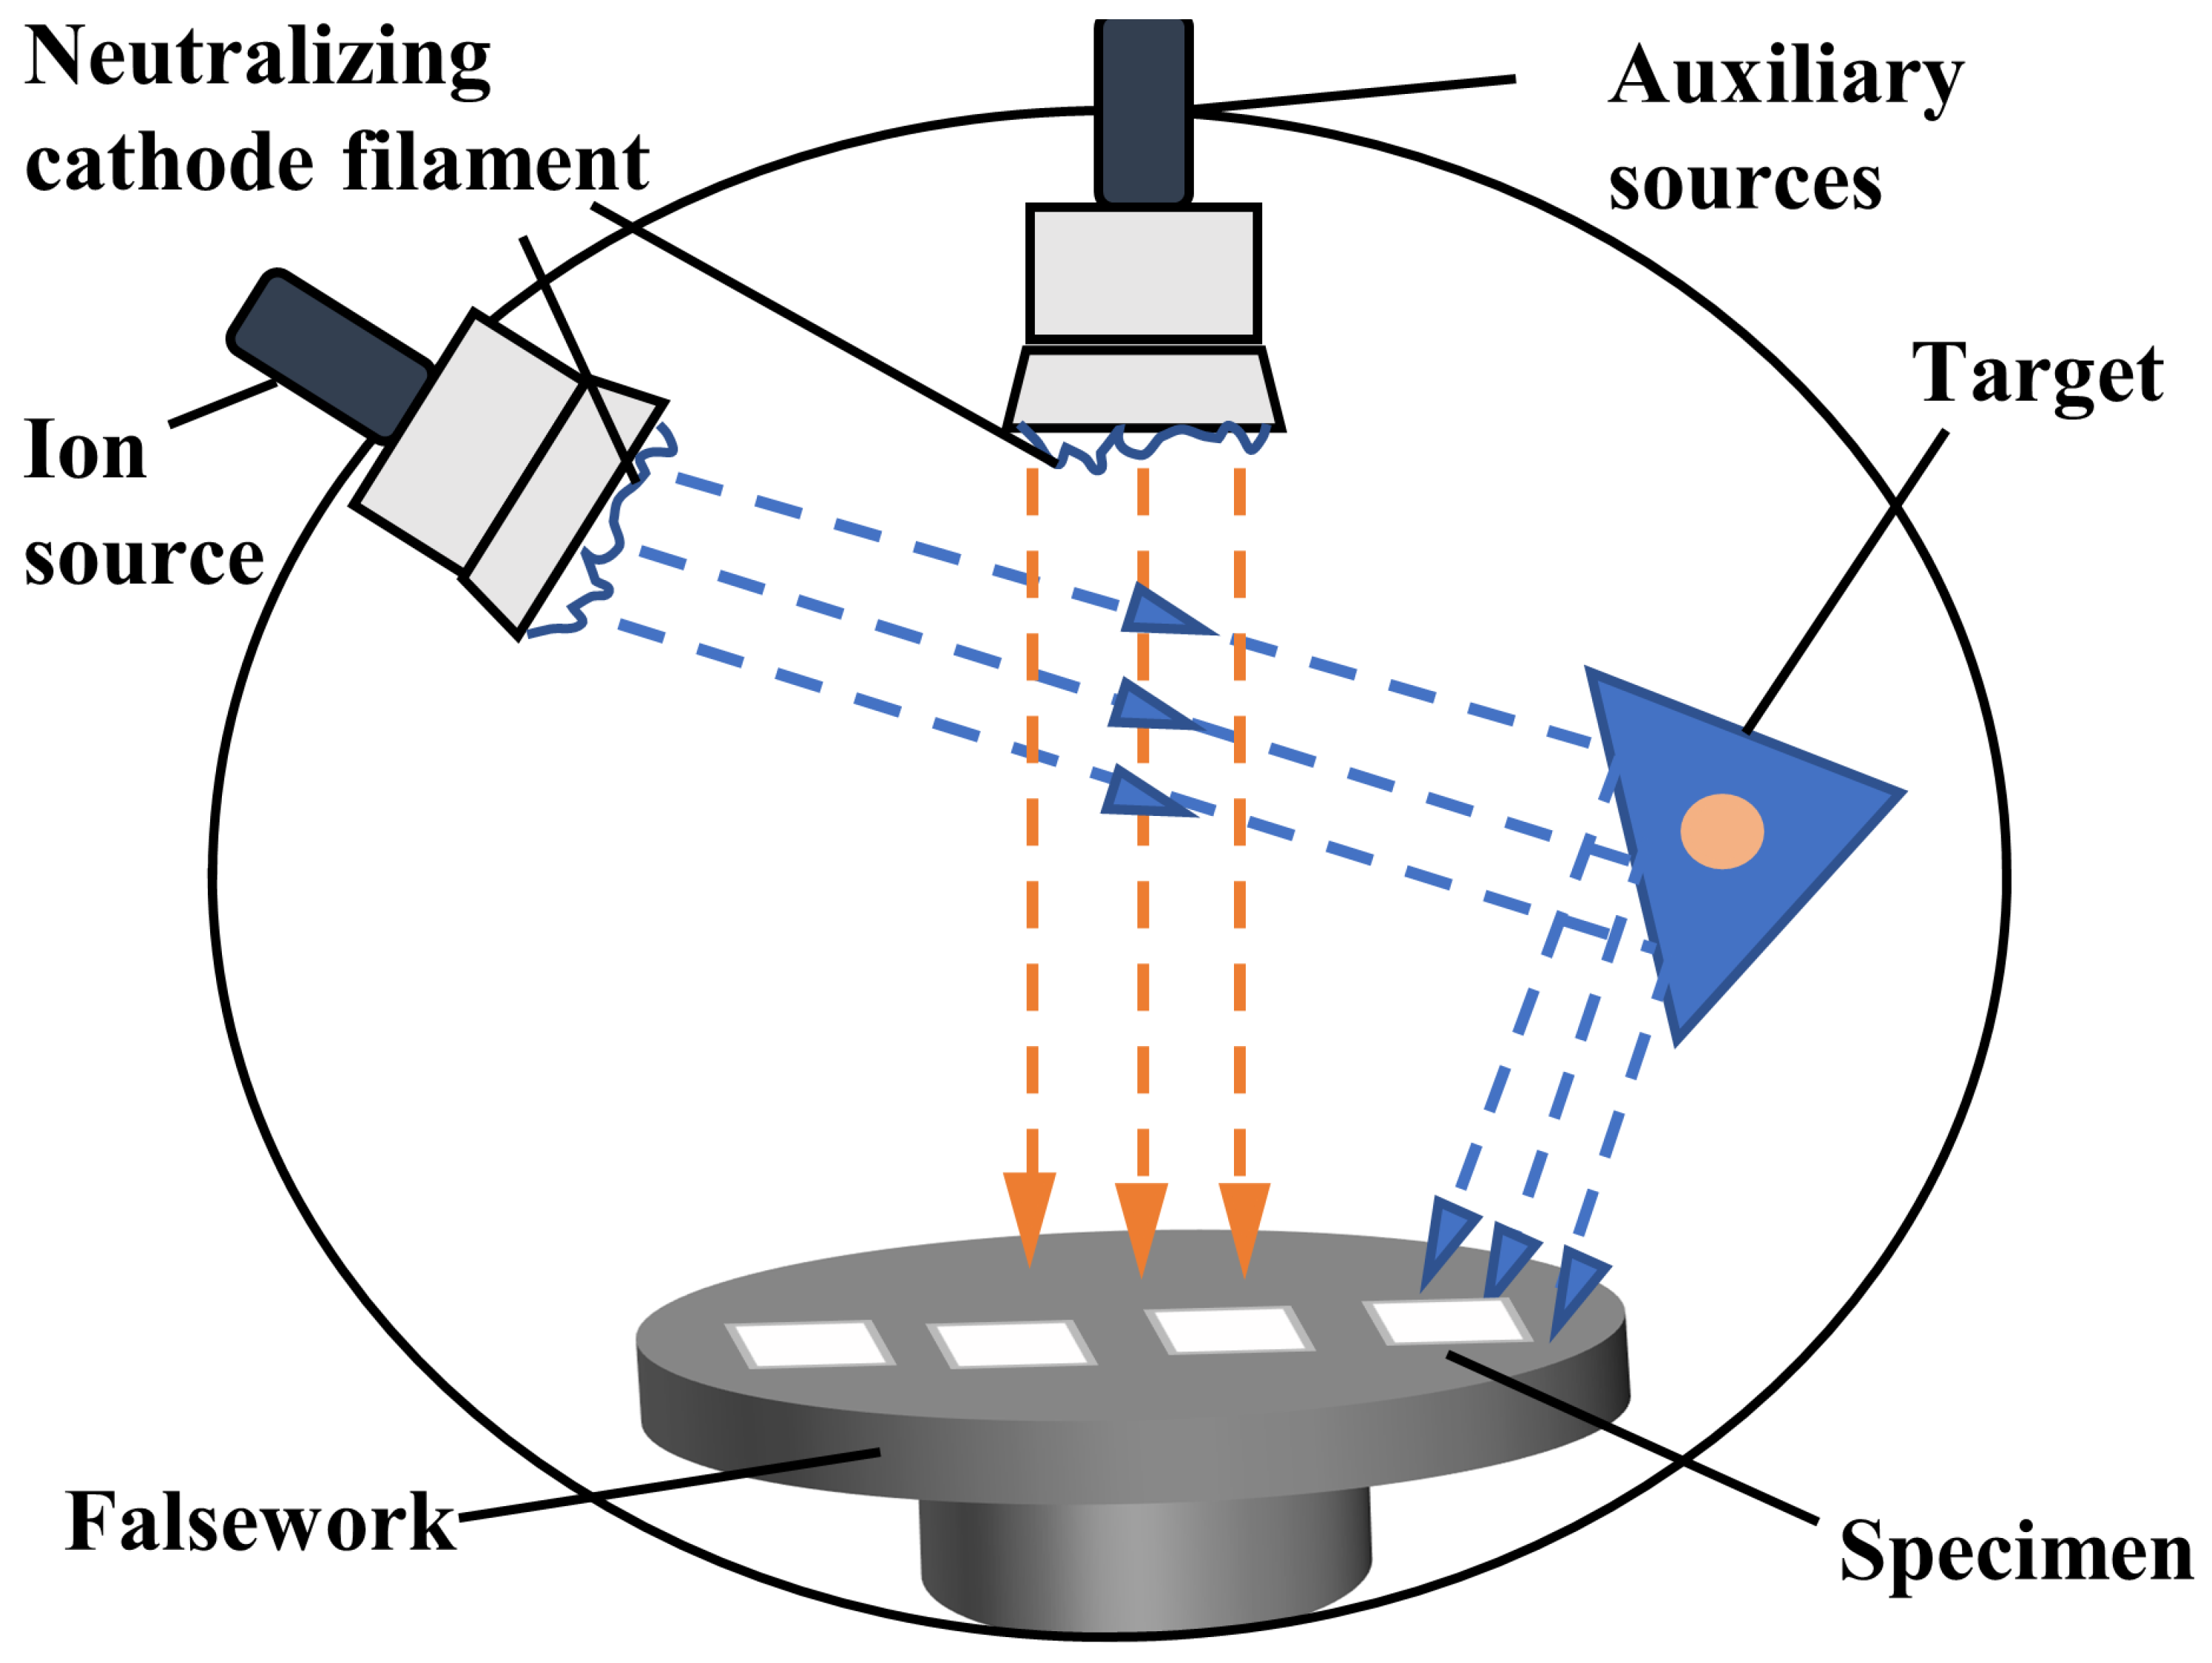
The proposed meta-surface in this paper was made from alternating layers of two materials with differing refractive indices, Nb2O5 (with a refractive index of 2.2) and SiO2 (with a refractive index of 1.49), on a substrate of fused silica glass. The layers were produced using a physical vapor deposition method called double ion beam sputtering (Figure 2), which involved the use of two ion sources and a quartz crystal controller for film thickness monitoring. The main source was used to generate a high-energy ion beam (Argon ion) to sputter and bombard the Nb and SiO2 targets. The final product had 56 layers, with a total thickness of 4615.78 nm and ranging in thickness from 30.27 nm to 283.69 nm.

2.2. Preparation of Optical Frequency Conversion Layer

In this study, the optical frequency conversion layer was equipped with the QDs luminescent layer, which was made from oil-soluble CdSe/ZnS core-shell QDs (1 mg/mL), 500# amount of poly methyl methacrylate (PMMA) powder, and 99.5% acetone solution. As an example, 0.4 mL of the QDs luminescent solution was created by mixing 3 g of acetone solution and 1 g of PMMA powder in a glass bottle. The bottle was sealed and left in a normal temperature environment for 12–14 h to ensure full dissolution of the PMMA powder. This resulted in a colloidal solution. In total, 0.2 mL of the colloidal solution and 0.2 mL of the QDs solution were then combined to create the final 0.4 mL QDs luminescent solution. Then QDs luminescent solution was spin-coated on the filter. Initially, the 25 mm diameter filter was cleaned with a mixture of 99.5% ethanol and deionized water using ultrasonic cleaning. Afterward, the filter was placed on the homogenizer and coated with a mixture of QDs and PMMA through spin coating. This process was repeated three times, each with a spin coating volume of 0.2 mL. For the first spin coating, the rotation speed was set at 7000 r/s for 30 s; for the second spin coating, the rotation speed was 5000 r/s for 30 s; for the third spin coating, the rotation speed was 3000 r/s for 20 s. After each spin coating, the filter was placed in a drying oven at a temperature between 40 and 50 °C for 3 min to dry.

2.3. Characterization and Spectral Testing

The ultraviolet, visible, and near-infrared (0.19–1.1μm) spectral reflectance and transmittance of the meta-surface film were measured using a BeiFen Rayleigh UV-1601 spectrophotometer with a plane grating dispersion element. The transmittance at different angles of the meta-surface films is tested, with only the transmittance in the visible range being recorded. The microstructure of the optical frequency conversion layer is analyzed using a 3D scanning confocal microscope (OLYMPUS OLS4100-SAF), and the changes in the surface of the filter after each coating can be recorded. The size distribution of the layer can be determined through statistical analysis using the Nano Measurer.

3. Structure and Design Principle of the Slide

3.1. Simulation of the Mate-Surface Slide

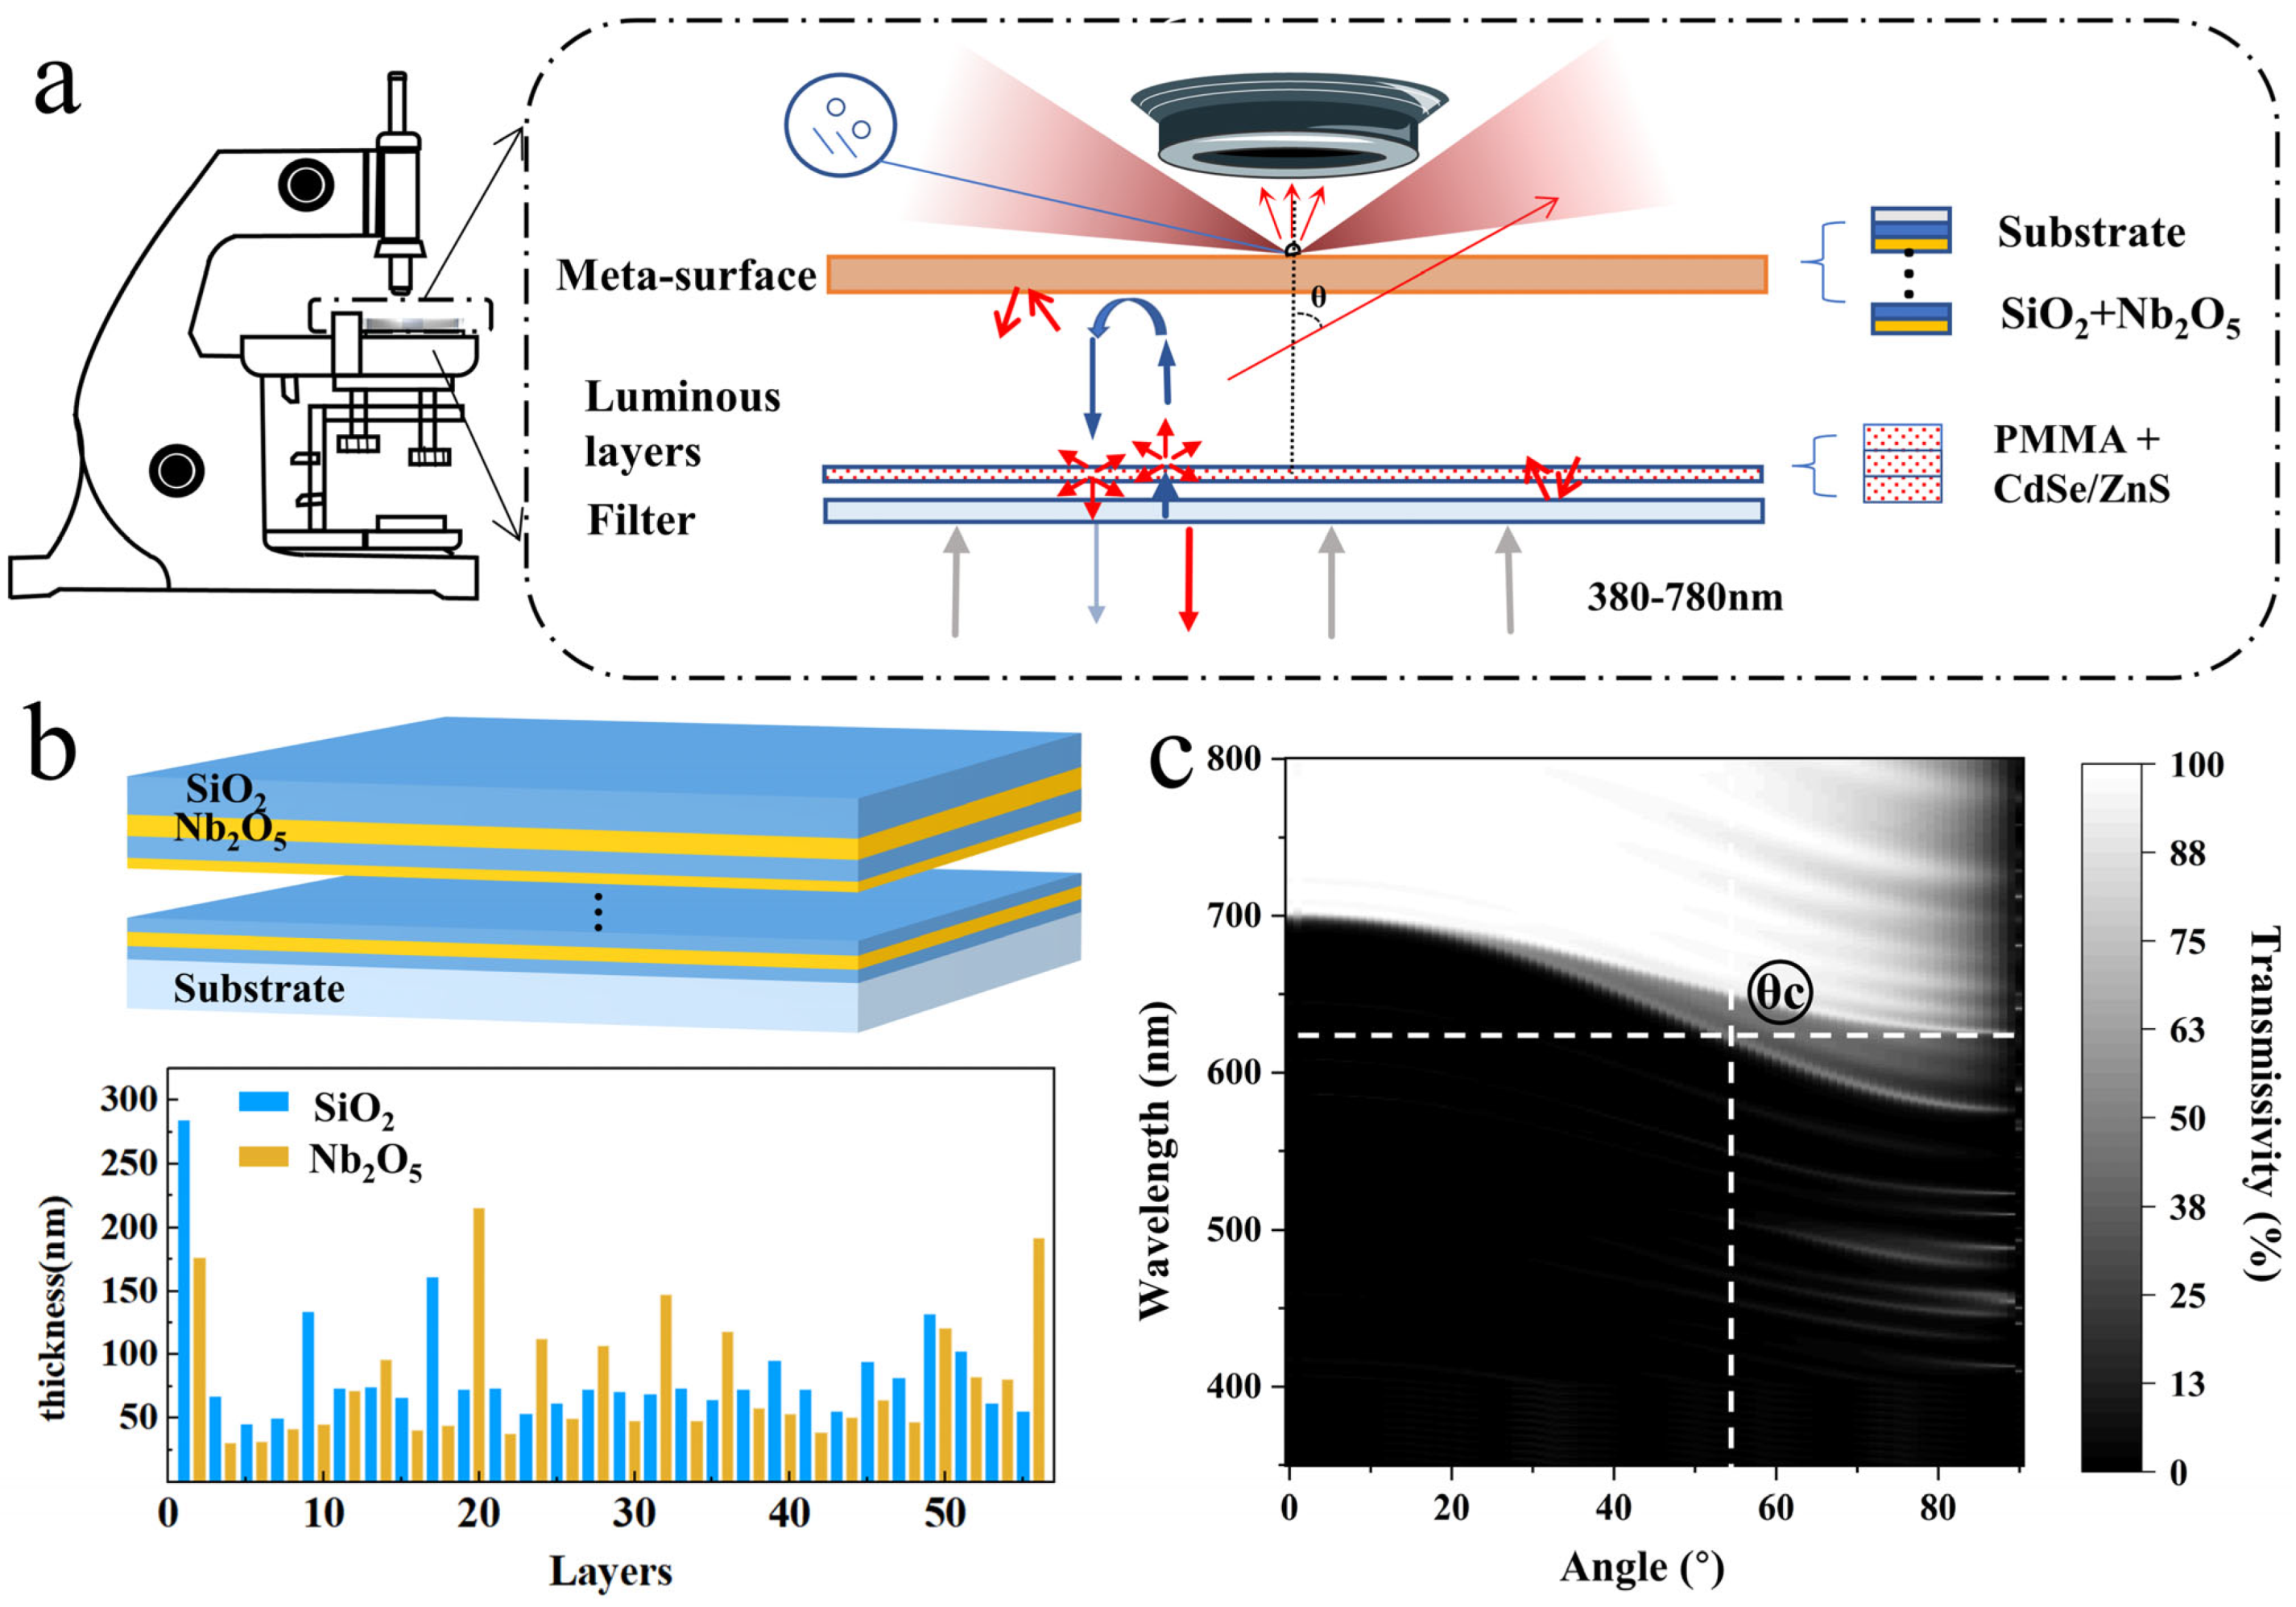
Light stop for dark-field microscope and dark-field condensers are often used to modulate the illumination angle to achieve the desired numerical aperture [23]. This can become complex as the numerical aperture increases. However, using metamaterials simplifies this process. One-dimensional photonic crystals, made up of high and low refractive index materials in a periodic arrangement, are a common form of metamaterials. This arrangement creates specific transmission and forbidden bands for electromagnetic waves, allowing for the creation of a transmission cone with a tailored angular spectrum. This technology has been utilized in various applications, such as bandpass filters [44], highly reflective mirrors [45,46], and dispersive mirrors [47]. In this study, we designed a multi-layer dielectric film with a customized angular spectrum that was coated on quartz glass (Figure 3a). Schematic of the multilayer structure and the layer-thickness profile are shown in Figure 3b. Dielectric films are built on the basis of multi-beam interference, with each layer having a thickness of several hundred nanometers. Through specific combinations, they can achieve enhanced transmission or reflection in specific wavelength ranges, exhibiting properties of metamaterials. The transmissivity characteristic of the meta-surface is shown in Figure 3c. It was designed to have a transmission band for large-angle light and a forbidden band for small-angle light, resulting in a large-angle light cone transmission similar to that of a dark-field condenser. The films were designed with Numerical Apertures (NA) of 0.65 for the peak wavelength of 620 nm. To make the dark-field imaging film widely compatible with various types of transmission microscopes, we proposed a composite structure that combines an optical frequency conversion structure with the film. The composite structure also includes a filter and QDs to convert the incident white light from a LED into outgoing light of 620 nm wavelength. In summary, when the LED light is incident vertically and passes through the composite slide, it first goes through the frequency conversion structure, then the multi-layer dielectric film, and finally is emitted at a controllable large angle. The design of the slide is split into two components that serve the purpose of optical frequency conversion and angle-selective transmission. (1) The optical frequency conversion layer consists of a filter and QDs material. The filter’s transmission band is for light in the wavelength range of 380–600 nm, and light in this band excites the QDs emitting layer. The QDs luminescent layer is mixed with a specific PMMA solution, spin-coated on the filter, and can convert light in the 380–600 nm wavelength range into 620 nm red light, which serves as the scattered light source for the sample. (2) The meta-surface of the multilayer dielectric film is made of high and low refractive index materials and has specific band gaps and transmission bands. The 620 nm red light emitted by the optical frequency conversion layer is directed toward the meta-surface at various angles. Light from small angles is hardly transmitted and reflected back to the optical frequency conversion layer, while light from the lower 600 nm band excites the QDs again, increasing the intensity of the light emitted from the QDs. A small portion of the remaining light passes through the optical frequency conversion layer, and the light from the QDs is adjusted to emit at a large angle, forming the illumination cone needed for dark-field imaging on the surface of the meta-surface slide.
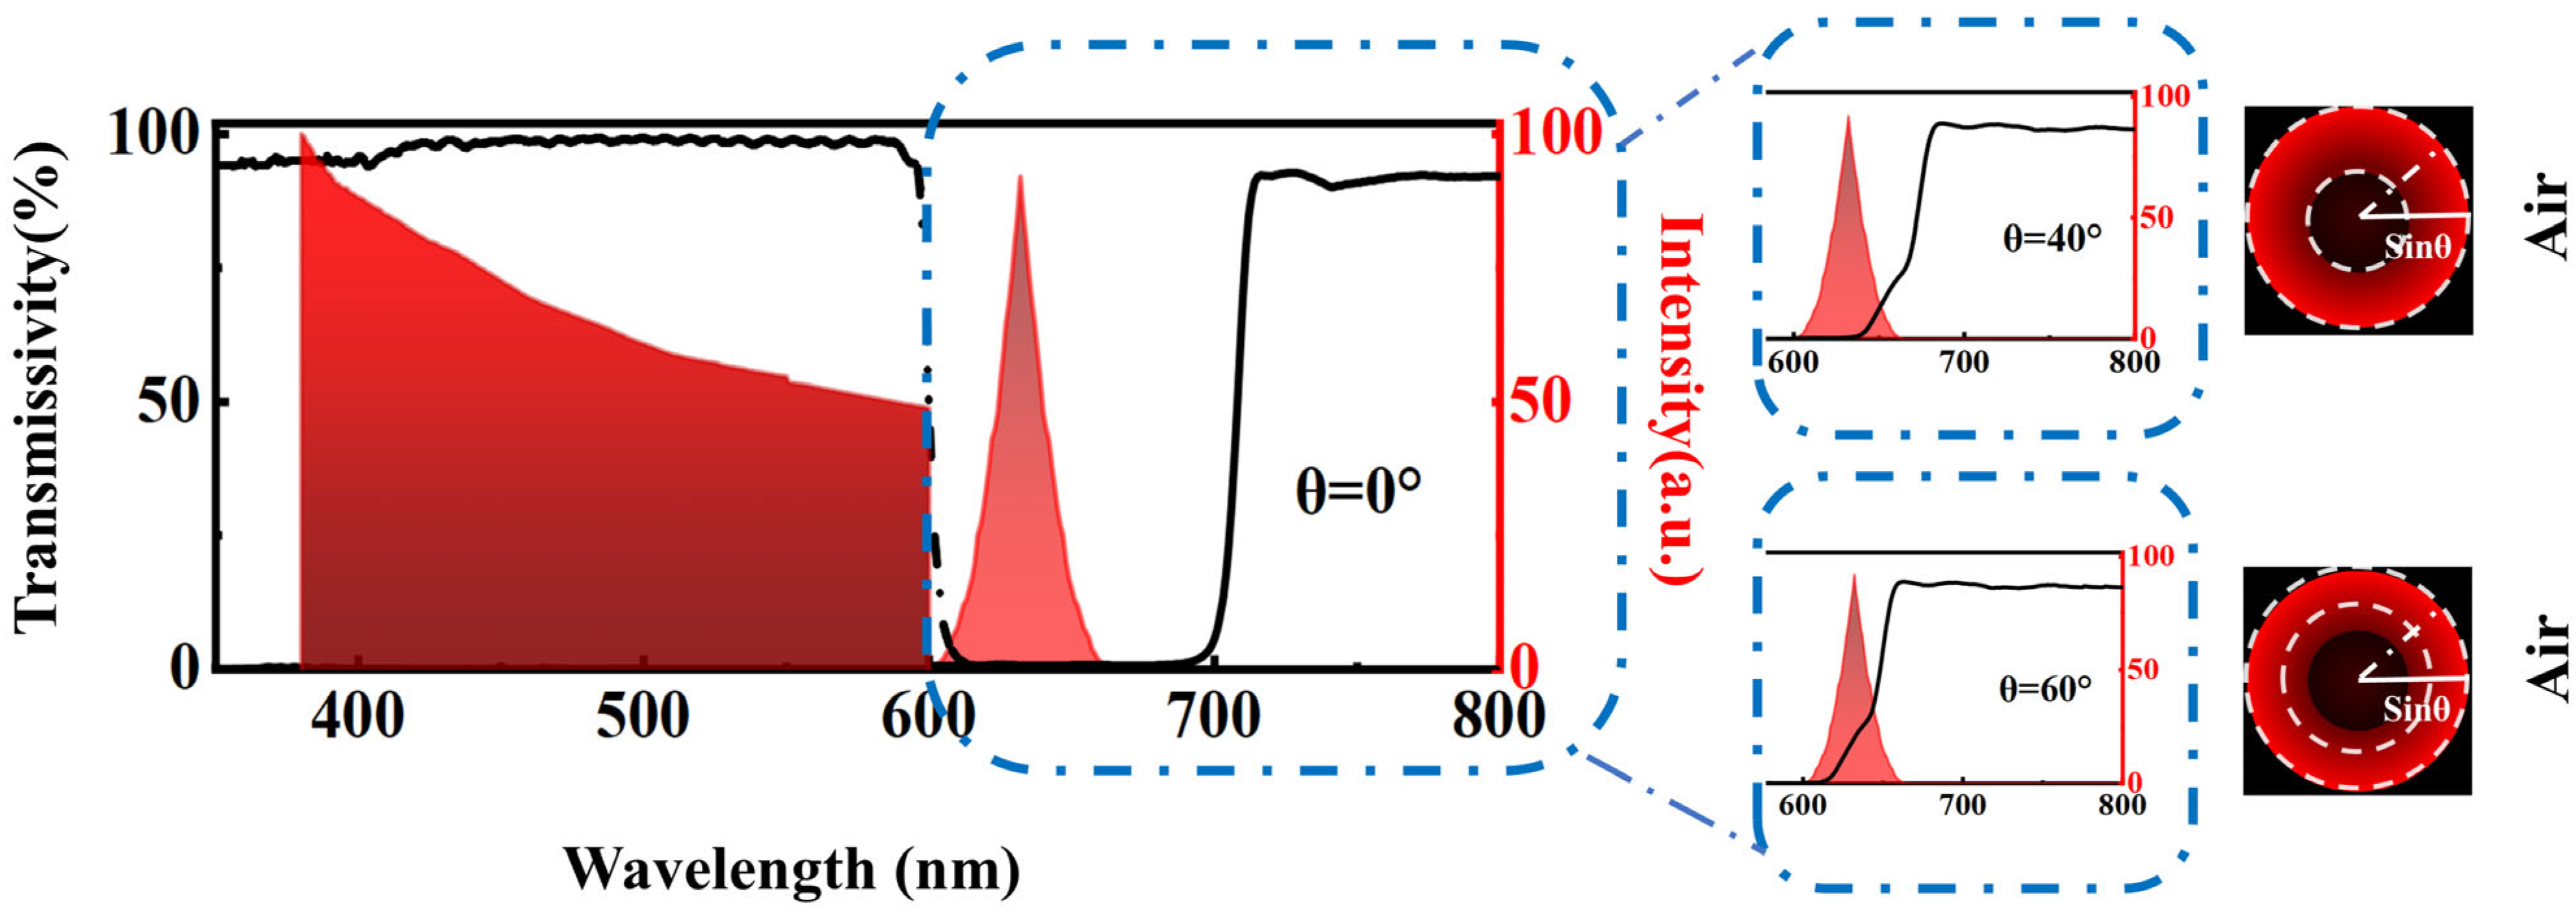
To validate the feasibility of our design, we carried out a series of experiments consisting of three steps. Firstly, we utilized TF-Calc software to optimize the design of the optical meta-surface system and ensure that its transmission angular spectrum matches the peak emission of the QDs. Secondly, we fabricated the integrated slide through experimental preparation. Finally, we used the slide for microscopic imaging of micron-sized samples, captured images for processing and analysis, and compared the results between bright-field and dark-field imaging. The transmittance of a multilayer dielectric meta-surface was simulated using TF-Calc, a thin film design software. To achieve the desired transmitted light cone angle, a meta-surface with a numerical aperture of 0.65 was designed, and its theoretical transmittance distribution at various incident angles in the visible range of 380–780 nm can be seen in Figure 3b. The mate surface was coated on a fused silica substrate through physical vapor deposition. The resulting transmittance was measured using a spectrophotometer (Figure 4). When the 620 nm light from the optical frequency conversion strikes the surfaces, on the 0.65 meta-surface, transmittance remains low for angles 0–40° and increases to over 60% when the angle exceeds 60°. The resulting light cone had a large angle of emission due to the custom transmission angle spectrum of the meta-surface. The 0.65 meta-surface had a low transmittance up to 40°, making it ideal for use with the NA0.65 objective.

3.2. Testing of the Meta-Surface Slide

The QDs and PMMA were spin-coated to form the optical frequency conversion layer on a filter from PHTODE. The filter has a transmission band that cuts off at 600 nm and transmits light from 380 nm to 600 nm, matching the strong absorption spectrum of the QDs. The angle-dependent transmittance of the filter was measured using a spectrophotometer and is shown in Figure 4. The QDs emitted light larger than the critical angle θc can pass through the upper meta-surface film of the multilayer dielectric structure, but light smaller than θc will be reflected and bounce multiple times between the filter and the meta-surface. The rough structure of the optical frequency conversion layer, obtained by spin coating, can change the angle of reflection. Eventually, the light emerges from the meta-surface at an angle greater than θc, resulting in a hollow light cone with a critical angle θc determined by the transmission angle spectrum of the multilayer dielectric meta-surface and the emission wavelength of the QDs. The dark field imaging slide was subjected to LED lighting to evaluate the impact of its components on light transmission and to demonstrate its performance (as seen in Figure 5a–f). The optical frequency conversion layer was initially assembled with glass, and it was observed that under the illumination of vertically incident LED light, red light, and a minimal amount of background light from the QDs were emitted at a large angle, while blue light was the dominant light at small angles, indicating the excellent filtering ability of the filter and the luminescence effect of the QDs. When the optical frequency conversion layer (without the QDs) was assembled with the meta-surface, it was found that there was no light transmission at all angles under the vertical illumination of LED light (Figure 5c,d). Finally, the complete optical frequency conversion layer was assembled with the meta-surface. Under LED light illumination, red light (620 nm) was emitted at a large angle on the meta-surface, creating the cone of light needed for dark field imaging (Figure 5e). When small-angle light is used, the slide surface has no light transmission (Figure 5f) due to the filter removing the low-frequency component of the LED light and the high-frequency component entering the optical frequency conversion layer to excite QDs. The low-frequency component is converted into light with a wavelength of around 620 nm at various angles, while the remaining low-frequency component is reflected back to the optical frequency conversion layer for secondary excitation. Only frequencies that meet the angle condition will be emitted, while the rest will be reflected, scattered between the meta-surface and filter, and finally emitted from the meta-surface or escape from the edge after changing angle (the N.A of the meta-surface in Figure 4 is 0.65).

4. Experiments

In the experiments, an XSP-30 series biological microscope was used. The imaging experiment was with a 0.65 meta-surface slide, using polymer SiC nanowires, 3-μm polystyrene microspheres, and 1-μm polystyrene microspheres as samples. The SiC nanowires had a diameter of 100–600 nm. To prepare the samples, they were diluted in a 1:1 mixture of ethanol and deionized water. Following the dilution, a small quantity of the solution was applied to both the slide and the meta-surface substrate. After allowing the solution to evaporate, standard bright-field and dark-field imaging were conducted using a conventional air objective (×40, NA 0.65) with normal illumination provided by the microscope’s LED light source. The LED was the illumination source, and a conventional air objective (NA 0.65, ×40) was used for bright-field and dark-field imaging, as shown in Figure 6a–f. (white background for bright-field in Figure 6a,c,e and black background for dark-field in Figure 6b,d,f). The LED lamp had a wavelength of 380–640 nm. After passing through the meta-surface slide, the illumination light forms a single wavelength large angle light cone. When the light from the surface of the slide exceeds the NA of the objective lens, the objective lens captures the scattered light from the sample, resulting in dark-field imaging. The results show that the contrast of dark-field images (Figure 6b,d,f) is significantly improved compared to that of the bright-field images (Figure 6a,c,e). The comparison of the light intensity between bright-field and dark-field images (Figure 6a–f) showed that the slides provide high-contrast dark-field images for samples with weak absorption and low refractive index. MATLAB was used to extract the contrast data. To facilitate analysis, a high-magnification electronic eyepiece was employed, connected to a workstation monitor. The captured bright-field and dark-field images from the electronic eyepiece were then converted into a format compatible with MATLAB. Subsequently, code designed for statistical analysis was utilized to extract the values from the images. The image contrast, calculated as the difference between the maximum and minimum image intensity values divided by their sum, was significantly improved when the nanowire and polystyrene nanosphere were imaged with a meta-surface slide (Figure 6b,d,f). Adding the meta-surface slide to the nanowire sample (Figure 6a,b) resulted in an image contrast of 0.786, compared to a contrast of only 0.261 ± 0.004 in the bright field. The contrast of the bright-field image of the 3-μm polystyrene nanosphere sample was 0.149 ± 0.004 without the slide (Figure 6c) but improved to 0.812 ± 0.003 with the addition of the meta-surface (Figure 6d). Dark-field imaging of 1-μm polystyrene microspheres showed a high contrast of 0.827 ± 0.003. The previous literature has proposed similar structures. For instance, Chatzot et al. developed a luminescent photonic substrate that incorporated a Bragg mirror, a light-emitting layer, and a micropatterned concave reflector substrate [40]. They demonstrated its capability to generate a dark-field imaging contrast three times greater than that of bright-field imaging. Additionally, in Yan Kuai’s research [43], their proposed planar photonic chip yielded a dark-field image contrast that was eight times higher than the contrast of bright-field images. Comparatively, our design achieves a dark-field image contrast four to five times greater than the contrast of bright-field images. It should be noted that the observed contrast is also influenced by the sample being examined and the objective used. The experiments demonstrate the effectiveness of using the meta-surface slide in a simple transmission bright-field microscope to resolve samples with weak absorption or low refractive index, which are challenging to image due to their small difference in refractive index with the surrounding medium. The slide can also be paired with different NA objective lenses to obtain high-contrast dark-field imaging with varying magnifications.

5. Conclusions

In conclusion, our experiments have demonstrated the effectiveness of the 25 mm diameter and 2.2 mm thick meta-surface slide. This slide can convert small-angle white light into a larger incident red light cone and replace the traditional dark-field focusing lens in a simple transmission biological microscope, resulting in high-contrast dark-field imaging. The slide’s structure includes a custom transmission angle spectrum multilayer dielectric film meta-surface and an optical frequency conversion layer based on filters and QDs. The designed slide boasts a custom NA and has been proven to enhance resolution in experiments. It is economical to produce, easy to handle and store, and has the potential for widespread use in various bright-field microscopes after improvement, making it a commercially valuable product. In this study, we created meta-surface slides with NA 0.65. If a different NA or one greater than 0.65 is needed, the band gap range of the meta-surface film and the choice of QDs can be adjusted to attain the desired product. This study provides a new approach for future dark-field microscopy technology research, and future optimization can further improve dark-field microscopy capabilities.

Author Contributions

R.C. conceived and supervised the project. J.S. fabricated the meta-surface slide, performed the image analysis, and wrote the manuscript. R.C. advised multiple repetitions of the experiment. D.Z., Y.C., W.L. and W.X. obtained the funding for the project and supervised the project. In addition, R.C. took lead roles in organizing the review contents, editing the entire document for consistency across sections. R.C. and J.S. prepared the figures. All authors have read and agreed to the published version of the manuscript.

Funding

Zhejiang Provincial Natural Science Funds of China (LZ20E050003); Wenzhou Science and Technology Projects (H2020003, G20220015); the National Natural Science and Foundation of China (NSFC) (No.11704285); 2022 Wenzhou Major Science and Technology Innovation Tackling Project (ZG2022009).

Institutional Review Board Statement

Not applicable.

Informed Consent Statement

Not applicable.

Data Availability Statement

Not applicable.

Conflicts of Interest

The authors declare no conflict of interest.

References

  1. Reinhardt, S.C.; Masullo, L.A.; Baudrexel, I.; Steen, P.R.; Kowalewski, R.; Eklund, A.S.; Strauss, S.; Unterauer, E.M.; Schlichthaerle, T.; Strauss, M.T. Ångström-resolution fluorescence microscopy. Nature 2023, 617, 711–716. [Google Scholar] [CrossRef] [PubMed]
  2. Cnossen, J.; Hinsdale, T.; Thorsen, R.Ø.; Siemons, M.; Schueder, F.; Jungmann, R.; Smith, C.S.; Rieger, B.; Stallinga, S. Local-ization microscopy at doubled precision with patterned illumination. Nat. Methods 2020, 17, 59–63. [Google Scholar] [CrossRef]
  3. Weber, M.; Leutenegger, M.; Stoldt, S.; Jakobs, S.; Mihaila, T.S.; Butkevich, A.N.; Hell, S.W. MINSTED fluorescence localization and nanoscopy. Nat. Photonics 2021, 15, 361–366. [Google Scholar] [CrossRef] [PubMed]
  4. Masullo, L.A.; Szalai, A.M.; Lopez, L.F.; Pilo-Pais, M.; Acuna, G.P.; Stefani, F.D. An alternative to MINFLUX that ena-bles nanometer resolution in a confocal microscope. Light Sci. Appl. 2022, 11, 199. [Google Scholar] [CrossRef] [PubMed]
  5. Lelek, M.; Gyparaki, M.T.; Beliu, G.; Schueder, F.; Griffié, J.; Manley, S.; Jungmann, R.; Sauer, M.; Lakadamyali, M.; Zimmer, C. Single-molecule localization microscopy. Nat. Rev. Methods Prim. 2021, 1, 39. [Google Scholar] [CrossRef]
  6. Synge, E. London, Edinburgh Dublin Philos. Mag. J. Sci. 1928, 6, 356. [Google Scholar] [CrossRef]
  7. Pohl, D.W.; Denk, W.; Lanz, M. Optical stethoscopy: Image recording with resolution λ/20. Appl. Phys. Lett. 1984, 44, 651–653. [Google Scholar] [CrossRef]
  8. Betzig, E.; Trautman, J.K.; Harris, T.D.; Weiner, J.S.; Kostelak, R.L. Breaking the Diffraction Barrier: Optical Microscopy on a Nanometric Scale. Science 1991, 251, 1468–1470. [Google Scholar] [CrossRef]
  9. Anger, P.; Bharadwaj, P.; Novotny, L. Enhancement and Quenching of Single-Molecule Fluorescence. Phys. Rev. Lett. 2006, 96, 113002. [Google Scholar] [CrossRef] [Green Version]
  10. Betzig, E.; Patterson, G.H.; Sougrat, R.; Lindwasser, O.W.; Olenych, S.; Bonifacino, J.S.; Davidson, M.W.; Lippincott-Schwartz, J.; Hess, H.F. Imaging Intracellular Fluorescent Proteins at Nanometer Resolution. Science 2006, 313, 1642–1645. [Google Scholar] [CrossRef] [Green Version]
  11. Hess, S.T.; Girirajan, T.P.; Mason, M.D. Ultra-High Resolution Imaging by Fluorescence Photoactivation Localization Microscopy. Biophys. J. 2006, 91, 4258–4272. [Google Scholar] [CrossRef] [PubMed] [Green Version]
  12. Gustafsson, M.G. Surpassing the lateral resolution limit by a factor of two using structured illumination microscopy. J. Microsc. 2000, 198, 82–87. [Google Scholar] [CrossRef] [Green Version]
  13. Gustafsson, M.G. Nonlinear structured-illumination microscopy: Wide-field fluorescence imaging with theoretically unlim-ited resolution. Proc. Natl. Acad. Sci. USA 2005, 102, 13081–13086. [Google Scholar] [CrossRef] [PubMed]
  14. Hell, S.W.; Wichmann, J. Breaking the diffraction resolution limit by stimulated emission: Stimulated-emission-depletion fluorescence microscopy. Opt. Lett. 1994, 19, 780–782. [Google Scholar] [CrossRef] [PubMed]
  15. Klar, T.; Hell, S.W. Subdiffraction resolution in far-field fluorescence microscopy. Opt. Lett. 1999, 24, 954–956. [Google Scholar] [CrossRef]
  16. Rust, M.J.; Bates, M.; Zhuang, X. Sub-diffraction-limit imaging by stochastic optical reconstruction microscopy (STORM). Nat. Methods 2006, 3, 793–796. [Google Scholar] [CrossRef] [Green Version]
  17. Murphy, D.B.; Davidson, M.W. Fundamentals of Light Microscopy and Electronic Imaging; John Wiley & Sons: Hoboken, NJ, USA, 2012. [Google Scholar]
  18. Diekmann, R.; Helle, Ø.I.; Øie, C.I.; McCourt, P.; Huser, T.R.; Schüttpelz, M.; Ahluwalia, B.S. Chip-based wide field-of-view nanoscopy. Nat. Photon. 2017, 11, 322–328. [Google Scholar] [CrossRef]
  19. Helle, Ø.I.; Dullo, F.T.; Lahrberg, M.; Tinguely, J.-C.; Hellesø, O.G.; Ahluwalia, B.S. Structured illumination microscopy using a photonic chip. Nat. Photon. 2020, 14, 431–438. [Google Scholar] [CrossRef]
  20. Ruh, D.; Mutschler, J.; Michelbach, M.; Rohrbach, A. Superior contrast and resolution by image formation in rotating coherent scattering (ROCS) microscopy. Optica 2018, 5, 1371–1381. [Google Scholar] [CrossRef]
  21. Noda, N.; Kamimura, S. A new microscope optics for laser dark-field illumination applied to high precision two dimensional measurement of specimen displacement. Rev. Sci. Instrum. 2008, 79, 023704. [Google Scholar] [CrossRef]
  22. Hu, H.; Ma, C.; Liu, Z. Plasmonic dark field microscopy. Appl. Phys. Lett. 2010, 96, 113107. [Google Scholar] [CrossRef] [Green Version]
  23. Gage, S.H. Modern Dark-Field Microscopy and the History of Its Development. Trans. Am. Microsc. Soc. 1920, 39, 95. [Google Scholar] [CrossRef]
  24. Hecht, E. Optics, 3rd ed.; Addison-Wesley: Boston, TX, USA, 1998; p. 330. [Google Scholar]
  25. Sabri, L.; Huang, Q.; Liu, J.-N.; Cunningham, B.T. Design of anapole mode electromagnetic field enhancement structures for biosensing applications. Opt. Express 2019, 27, 7196–7212. [Google Scholar] [CrossRef] [PubMed]
  26. Yesilkoy, F.; Arvelo, E.R.; Jahani, Y.; Liu, M.; Tittl, A.; Cevher, V.; Kivshar, Y.; Altug, H. Ultrasensitive hyperspectral imaging and biodetection enabled by dielectric metasurfaces. Nat. Photon. 2019, 13, 390–396. [Google Scholar] [CrossRef] [Green Version]
  27. Soukoulis, C.M.; Wegener, M. Past achievements and future challenges in the development of three-dimensional pho-tonic metamaterials. Nat. Photonics 2011, 5, 523–530. [Google Scholar] [CrossRef] [Green Version]
  28. Tong, X.C. Photonic Metamaterials and Metadevices. In Functional Metamaterials and Metadevices; Springer: Bolingbrook, IL, USA, 2018; pp. 71–106. [Google Scholar] [CrossRef]
  29. Iwanaga, M. Photonic metamaterials: A new class of materials for manipulating light waves. Sci. Technol. Adv. Mater. 2012, 13, 053002. [Google Scholar] [CrossRef] [Green Version]
  30. Salim, A.; Lim, S. Review of Recent Metamaterial Microfluidic Sensors. Sensors 2018, 18, 232. [Google Scholar] [CrossRef] [Green Version]
  31. Xu, W.; Xie, L.; Ying, Y. Mechanisms and applications of terahertz metamaterial sensing: A review. Nanoscale 2017, 9, 13864–13878. [Google Scholar] [CrossRef]
  32. Ahmadivand, A.; Gerislioglu, B.; Ahuja, R.; Mishra, Y.K. Terahertz plasmonics: The rise of toroidal metadevices towards immunobiosensings. Mater. Today 2020, 32, 108–130. [Google Scholar] [CrossRef]
  33. Balaur, E.; Cadenazzi, G.A.; Anthony, N.; Spurling, A.; Hanssen, E.; Orian, J.; Nugent, K.A.; Parker, B.S.; Abbey, B. Plasmon-induced enhancement of ptychographic phase microscopy via subsurface nanoaperture arrays. Nat. Photonics 2021, 15, 222–229. [Google Scholar] [CrossRef]
  34. Popescu, G. Quantitative Phase Imaging of Cells and Tissues; McGraw-Hill Education: New York, NY, USA, 2011. [Google Scholar]
  35. Kwon, H.; Arbabi, E.; Kamali, S.M.; Faraji-Dana, M.; Faraon, A. Single-shot quantitative phase gradient microscopy using a system of multifunctional metasurfaces. Nat. Photon. 2020, 14, 109–114. [Google Scholar] [CrossRef] [Green Version]
  36. Zheng, G.; Cui, X.; Yang, C. Surface-wave-enabled darkfield aperture for background suppression during weak signal detection. Proc. Natl. Acad. Sci. 2010, 107, 9043–9048. [Google Scholar] [CrossRef]
  37. Zhang, J.; Pitter, M.C.; Liu, S.; See, C.; Somekh, M.G. Surface-plasmon microscopy with a two-piece solid immersion lens: Bright and dark fields. Appl. Opt. 2006, 45, 7977–7986. [Google Scholar] [CrossRef]
  38. Balci, S.; Karademir, E.; Kocabas, C.; Aydinli, A. Direct imaging of localized surface plasmon polaritons. Opt. Lett. 2011, 36, 3401–3403. [Google Scholar] [CrossRef]
  39. Wei, F.; Li, G.; Cheah, K.W.; Liu, Z. Organic light-emitting-diode-based plasmonic dark-field microscopy. Opt. Lett. 2012, 37, 4359–4361. [Google Scholar] [CrossRef] [PubMed] [Green Version]
  40. Chazot, C.A.; Nagelberg, S.; Rowlands, C.J.; Scherer, M.R.J.; Coropceanu, I.; Broderick, K.; Kim, Y.; Bawendi, M.G.; So, P.T.C.; Kolle, M. Luminescent surfaces with tailored angular emission for compact dark-field imaging devices. Nat. Photon. 2020, 14, 310–315. [Google Scholar] [CrossRef]
  41. Vukusic, P.; Sambles, J.R.; Lawrence, C.R. Colour mixing in wing scales of a butterfly. Nature 2000, 404, 457. [Google Scholar] [CrossRef] [PubMed]
  42. Vukusic, P.; Sambles, J.R.; Lawrence, C.R.; Wakely, G. Sculpted-multilayer optical effects in two species of Papilio butterfly. Appl. Opt. 2001, 40, 1116–1125. [Google Scholar] [CrossRef] [Green Version]
  43. Kuai, Y.; Chen, J.; Fan, Z.; Zou, G.; Lakowicz, J.R.; Zhang, D. Planar photonic chips with tailored angular transmission for high-contrast-imaging devices. Nat. Commun. 2021, 12, 1–9. [Google Scholar] [CrossRef] [PubMed]
  44. Magnusson, R.; Wang, S.S. New principle for optical filters. Appl. Phys. Lett. 1992, 61, 1022–1024. [Google Scholar] [CrossRef]
  45. Wang, S.S.; Magnusson, R. Theory and applications of guided-mode resonance filters. Appl. Opt. 1993, 32, 2606–2613. [Google Scholar] [CrossRef] [PubMed]
  46. Wang, S.S.; Magnusson, R. Design of waveguide-grating filters with symmetrical line shapes and low sidebands. Opt. Lett. 1994, 19, 919–921. [Google Scholar] [CrossRef] [PubMed]
  47. Chen, R.; Wang, Y.; Guo, K.; Zhang, Y.; Wang, Z.; Zhu, M.; Yi, K.; Leng, Y.; Shao, J. Angle-adjustment-based tunable chirped mirrors with continuous dispersion compensation. Opt. Lett. 2019, 44, 6053–6056. [Google Scholar] [CrossRef] [PubMed]
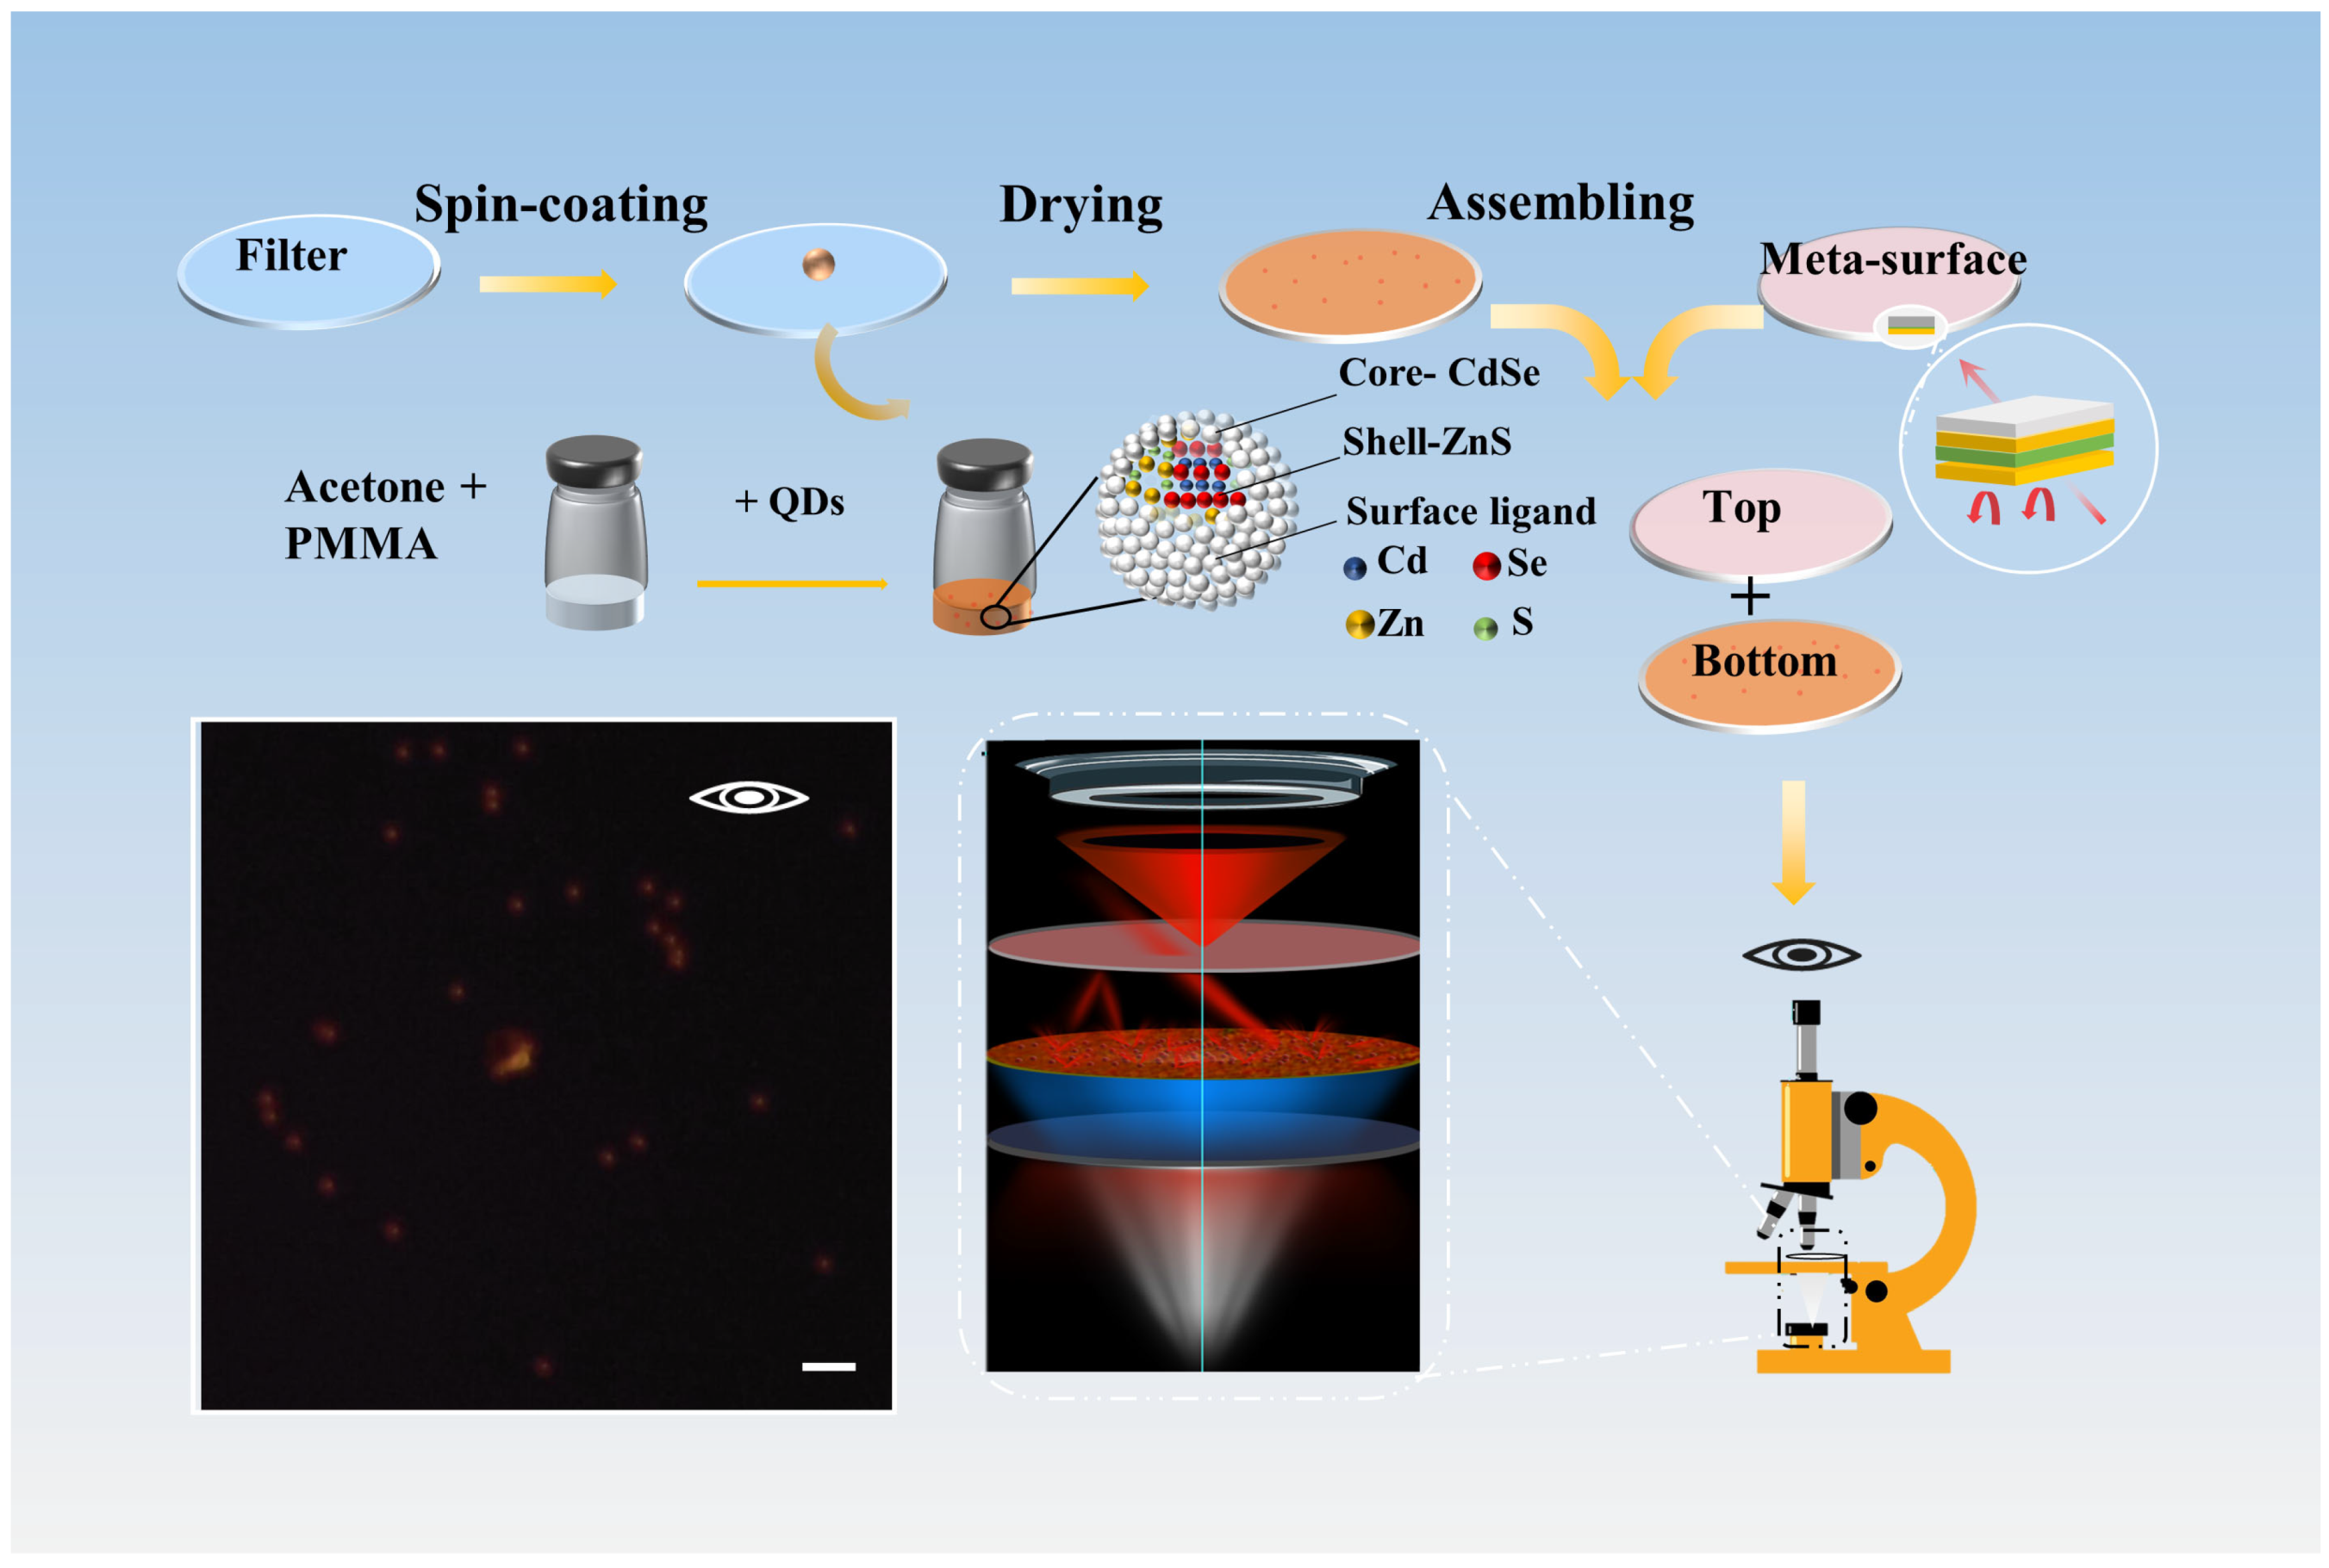
Figure 1. The CdSe/ZnS QDs + PMMA mixture was spin-coated onto the filter surface to form an optical frequency conversion layer capable of absorbing blue light in the 380–600 nm range and converting it to 620 nm red light. The optical meta-surface with a custom transmission angle spectrum was created from a multilayer dielectric film structure alternating high and low refractive index materials. As a result, the meta-surface reflects 620 nm light at small angles while letting it pass through at larger angles. The optical frequency conversion layer was combined with the optical meta-surface to produce a controlled-angle light cone. The slide is used for transparent bright-field microscopy, serving as a substitute for the bulky dark-field mirror and achieving high-contrast dark-field imaging even for 1-μm monodisperse polystyrene microspheres under LED illumination. Scale bars, 5 µm.
Photonics 10 00775 g001
Figure 2. Fabrication of the meta-surface using dual ion-beam sputtering meta-surface is produced by dual-ion-beam sputtering (SPECTOR, Veeco) with two ion sources (16 cm main source and 12 cm assistant source).
Photonics 10 00775 g002
Figure 3. (a) The incident light is filtered to allow only light below 600 nm to pass. This filtered light excites CdSe/ZnS QDs and converts it into 620 nm red light emitted in all directions. The optical meta-surface has a specific transmission angle spectrum for 620 nm light, with high transmission for large angles and reflection for small angles. The angle is changed by multiple reflections and scatterings between the filter and meta-surface, resulting in the required illumination light cone for dark-field imaging. (b) Schematic of the multilayer structure and the layer-thickness profile. (c) the transmission angle spectrum and band for a numerical aperture of 0.65 meta-surface, with light after 700 nm not transmitted at 0° and the transmission bandwidth also moving towards the short wave with increasing angle. Light emitted at a small angle (<θc) will be reflected and scattered several times between the filter and meta-surface until it is greater than the transmission angle θc, allowing light greater than θc to be transmitted.
Photonics 10 00775 g003
Figure 4. Measure transmittance of the 0.65 meta-surface at 0°, 40° and 60° (black solid line). Measured transmittance of the filter (black dashed line). QDs have a strong absorption spectrum at 380–600 nm with an emission peak of 620 ± 10 nm. Emission angle spectrum of the meta-surface at 650 nm incident light (top right), shows that the aperture angle of the 0.65 meta-surface is greater than 40°, the graph next to it is modeled in 3Dmax from the test data. Emission angle spectrum of the meta-surface at 650 nm incident light (bottom right), shows that the aperture angle of the 0.65 meta-surface is greater than 60°, the graph next to it is modeled in 3Dmax from the test data.
Photonics 10 00775 g004
Figure 5. (a,b) Combination of the optical frequency conversion layer (filter + QDs) and blank slide (without the meta-surface). (c,d) Combination of the filter and meta-surface slide. (e,f) The complete structure, combination of optical frequency conversion layer (filter + QDs) and meta-surface slide.
Photonics 10 00775 g005
Figure 6. (af), Scale bars, 5 µm. Bright-field images (a,c,e), dark-field images (b,d,f), (i) the images the of SiC nanowires (a,b), 3-µm polystyrene microspheres (c,d) and 1-µm polystyrene microspheres (e,f). (ii) intensity profiles diagram. (iii) the contrast plot extracted along the black dashed lines on ii, with more than 99% of the intensity values in the bright-field images distributed above, while for the dark-field images, around 90% of the intensity values are distributed below and around 10% below, fully demonstrating the significant high contrast imaging of the 0.65 meta-surface slide applied to this microscope.
Photonics 10 00775 g006
Disclaimer/Publisher’s Note: The statements, opinions and data contained in all publications are solely those of the individual author(s) and contributor(s) and not of MDPI and/or the editor(s). MDPI and/or the editor(s) disclaim responsibility for any injury to people or property resulting from any ideas, methods, instructions or products referred to in the content.