1. Introduction
The study of optics has been long-standing and strong and is necessary to enhance technology. The possibility that optical circuits can replace the electronic circuits used for communication is increasing. Unlike electronic states, light states have superpositions with linear properties. The importance of light states may increase when the states have quantum coherence and the said superposition is maintained with fluctuations below what is predicted with Poissonian statistics. Quantum cryptography protocols may require different quantum state statistics to be analyzed so that information can be transmitted [
1,
2,
3,
4] or to protect the information [
5]. For example, Poissonian statistics are the most commonly used statistics to analyze these states [
6,
7], but subpoissonian and chaotic statistics can also be used [
8]. Even protocols that include different simultaneous statistics have been proposed [
9,
10].
However, to reach the efficiency that electronic circuits currently have, implementing new manufacturing techniques that allow light to be guided through optical circuits in a more reliable, robust, and portable way is necessary. Investigating the use of new materials that minimize the absorption and scattering of light is necessary, and investigating new manufacturing techniques that can be used to create optical circuits with different portability levels, such as circuits on a chip, is also necessary. Until now, optical fibers that were fabricated with silicon were analogs of electronic transport cables, but analogs of electronic circuits on a chip with electronic guides require stronger materials and manufacturing techniques. One option that has been explored for more than 10 years is the production and propagation of quantum states through waveguides [
11] and, particularly, waveguided beam splitters [
12,
13]. In this article, we demonstrate a technique that can be used to fabricate beam splitter (BS)-type circuits, whereby hybrid coupling techniques are utilized. We used laser manufacturing on materials with a particular refractive index and directly spliced the optical fiber. The BS transmission (
T) and reflection (
R) coefficients were controlled instead of the phases, which has been performed by other scholars [
14,
15,
16]. This technique is novel, due to its manufacturing speed and the possibility of including different manufacturing materials and geometries. As an application of, and test of, this fabrication technique, we studied the photon statistics produced by these fabricated beam splitter circuits. Thus, circuits as simple as those manufactured here can be directly used for both the analysis of fluctuations and quantum encryption.
2. Theoretical Considerations
Light can be classified according to the statistics measured in photon counters. These can be Poissonian, superpoissonian, or subpoissonian statistics, which are used to measure attenuated lasers, thermal light, and quantum light sources, respectively [
17].
All these distributions have well-defined relationships between the standard deviation
and the average value
. Therefore, the Fano factor (defined in Equation (
1)), is a strong indicator of the same classification, as shown in
Table 1.
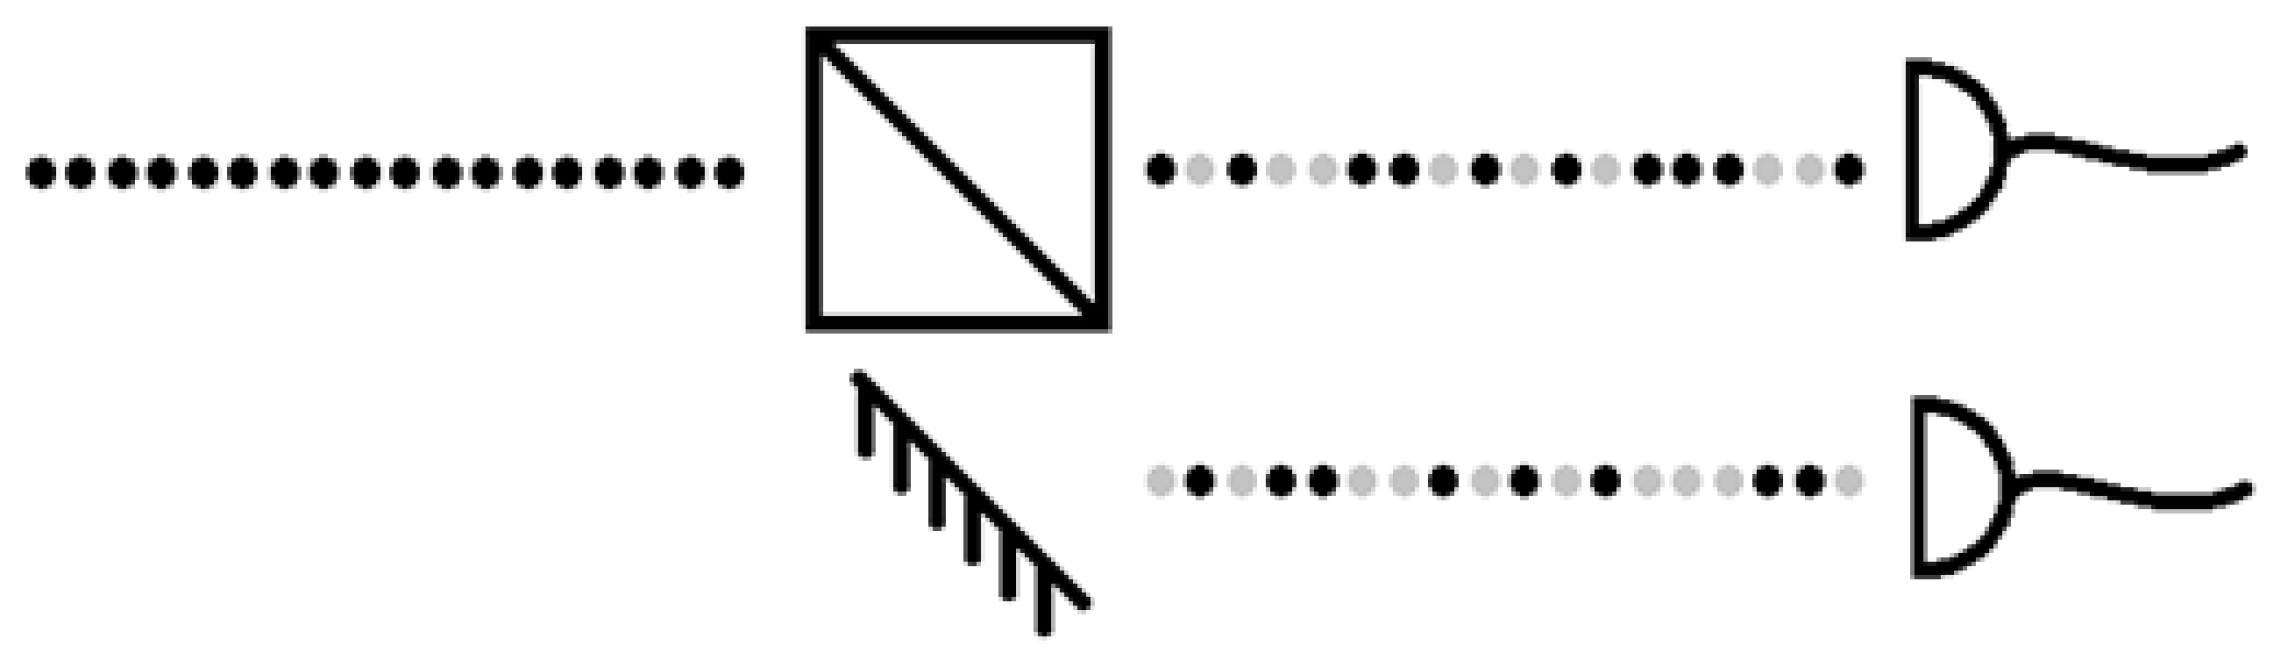
Moreover, the Fano factor can be used to differentiate between statistics within the quantum regime. For example, a BS is a linear optics element that can modify the statistics of a photon series. To show this, let us start with an ideal quantum light (in particular, single photons that are analyzed with subpoissonian statistics) towards a 50:50 BS. When the photon sequence leaves the beam splitter, we have an anticorrelated random sequence of photons in both of the output ports (
Figure 1).
The same amount of 0 s and 1 s are present. Thus, the average of the time series is
, and the standard deviation is also
. So, using (
1),
. Now, if the transmission (
T) and reflection (
R) parameters of the BS are controlled, the
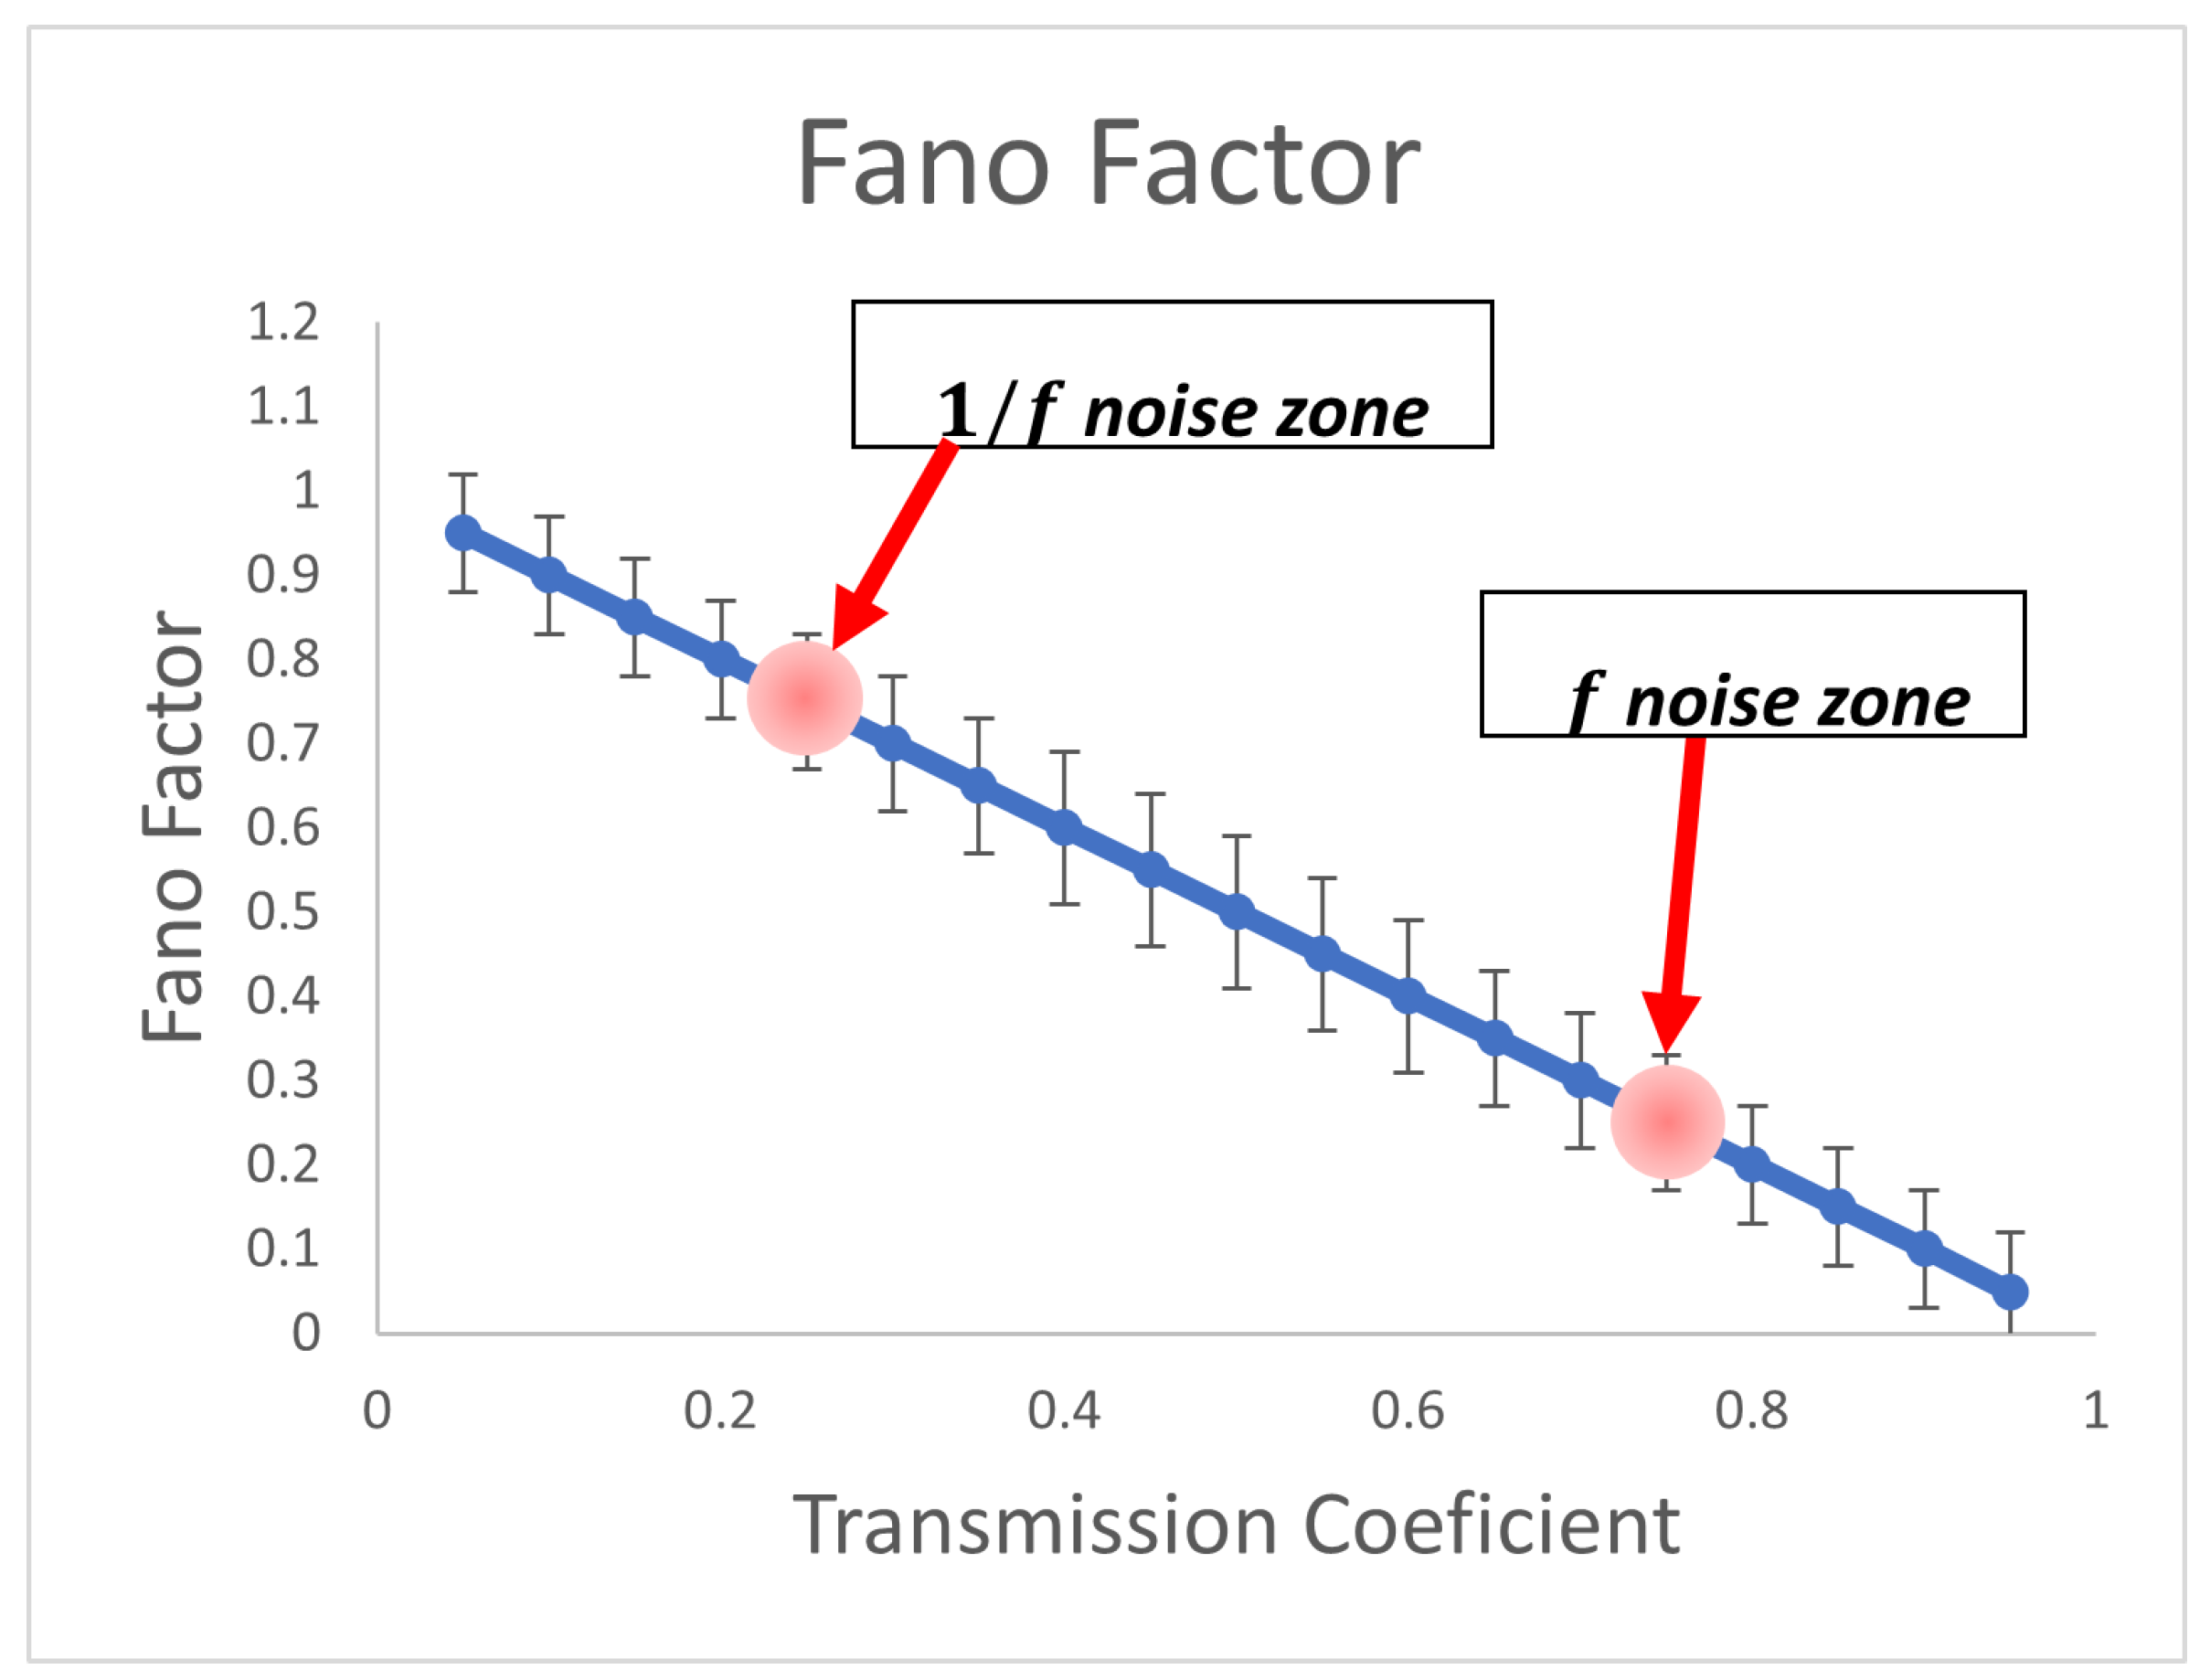
randomness of the output statistics can be controlled too, so the Fano factor should change, based on those statistics. Additionally, two interesting cases exist: those that are between
(random 1 s and 0 s) and the extreme case with only 1 s or 0 s (
or
, respectively) because they can produce 1/f or f noises [
8]. These opposed noises
and
f come through the beam splitter with a probability of
and
, respectively. Both noises become equivalent if we interchange the detected photon with no detected photons for both of the time series obtained (
and vice versa).
A numerical simulation is presented where we controlled the
T and
R factors and a number of photons. Additionally, we added a random variation factor to simulate the stochastic experimental situations (see
Figure 2). Since the random variations are reflected by the transmission and reflection coefficients, the effects were slightly smaller at values close to
and
.
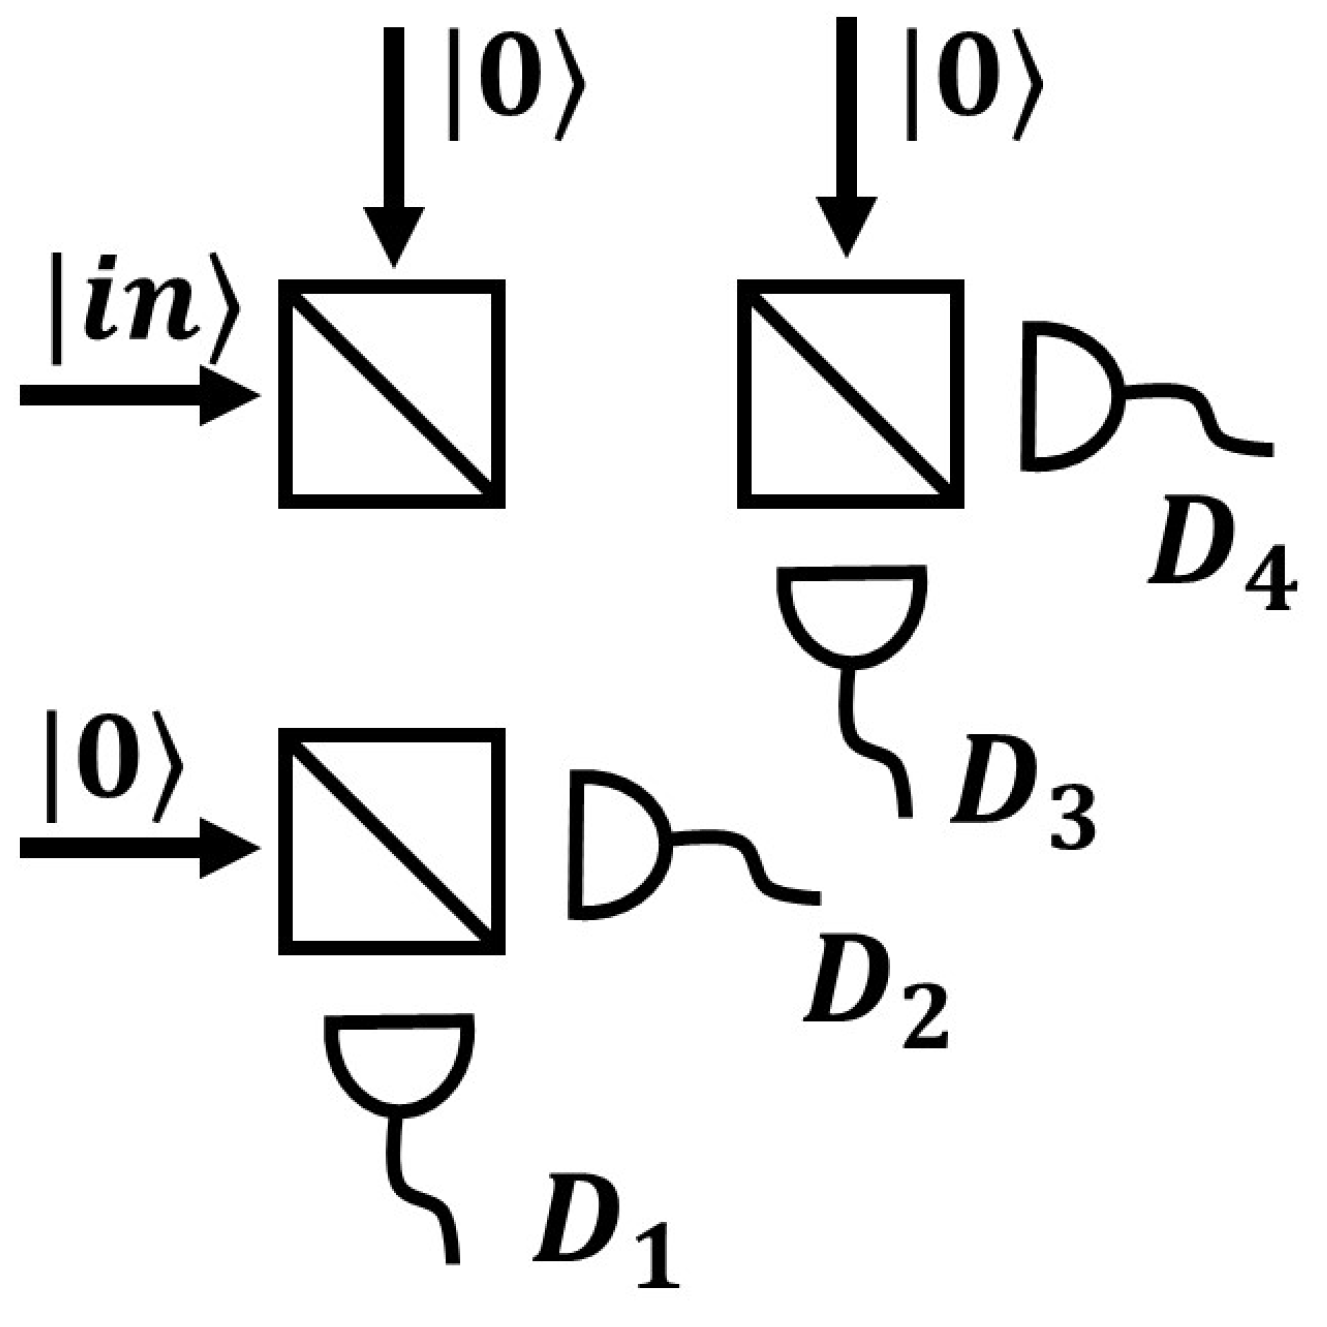
If the photons only pass through one BS, the output statistics are always anticorrelated. So, to obtain different simultaneous statistics, we can redirect each of the outputs of the first BS to another.
Figure 3 shows the corresponding conceptual setup. Now, by controlling the
T and
R factors, we could produce different statistics in the outputs.
3. Beam Splitter Fabrication
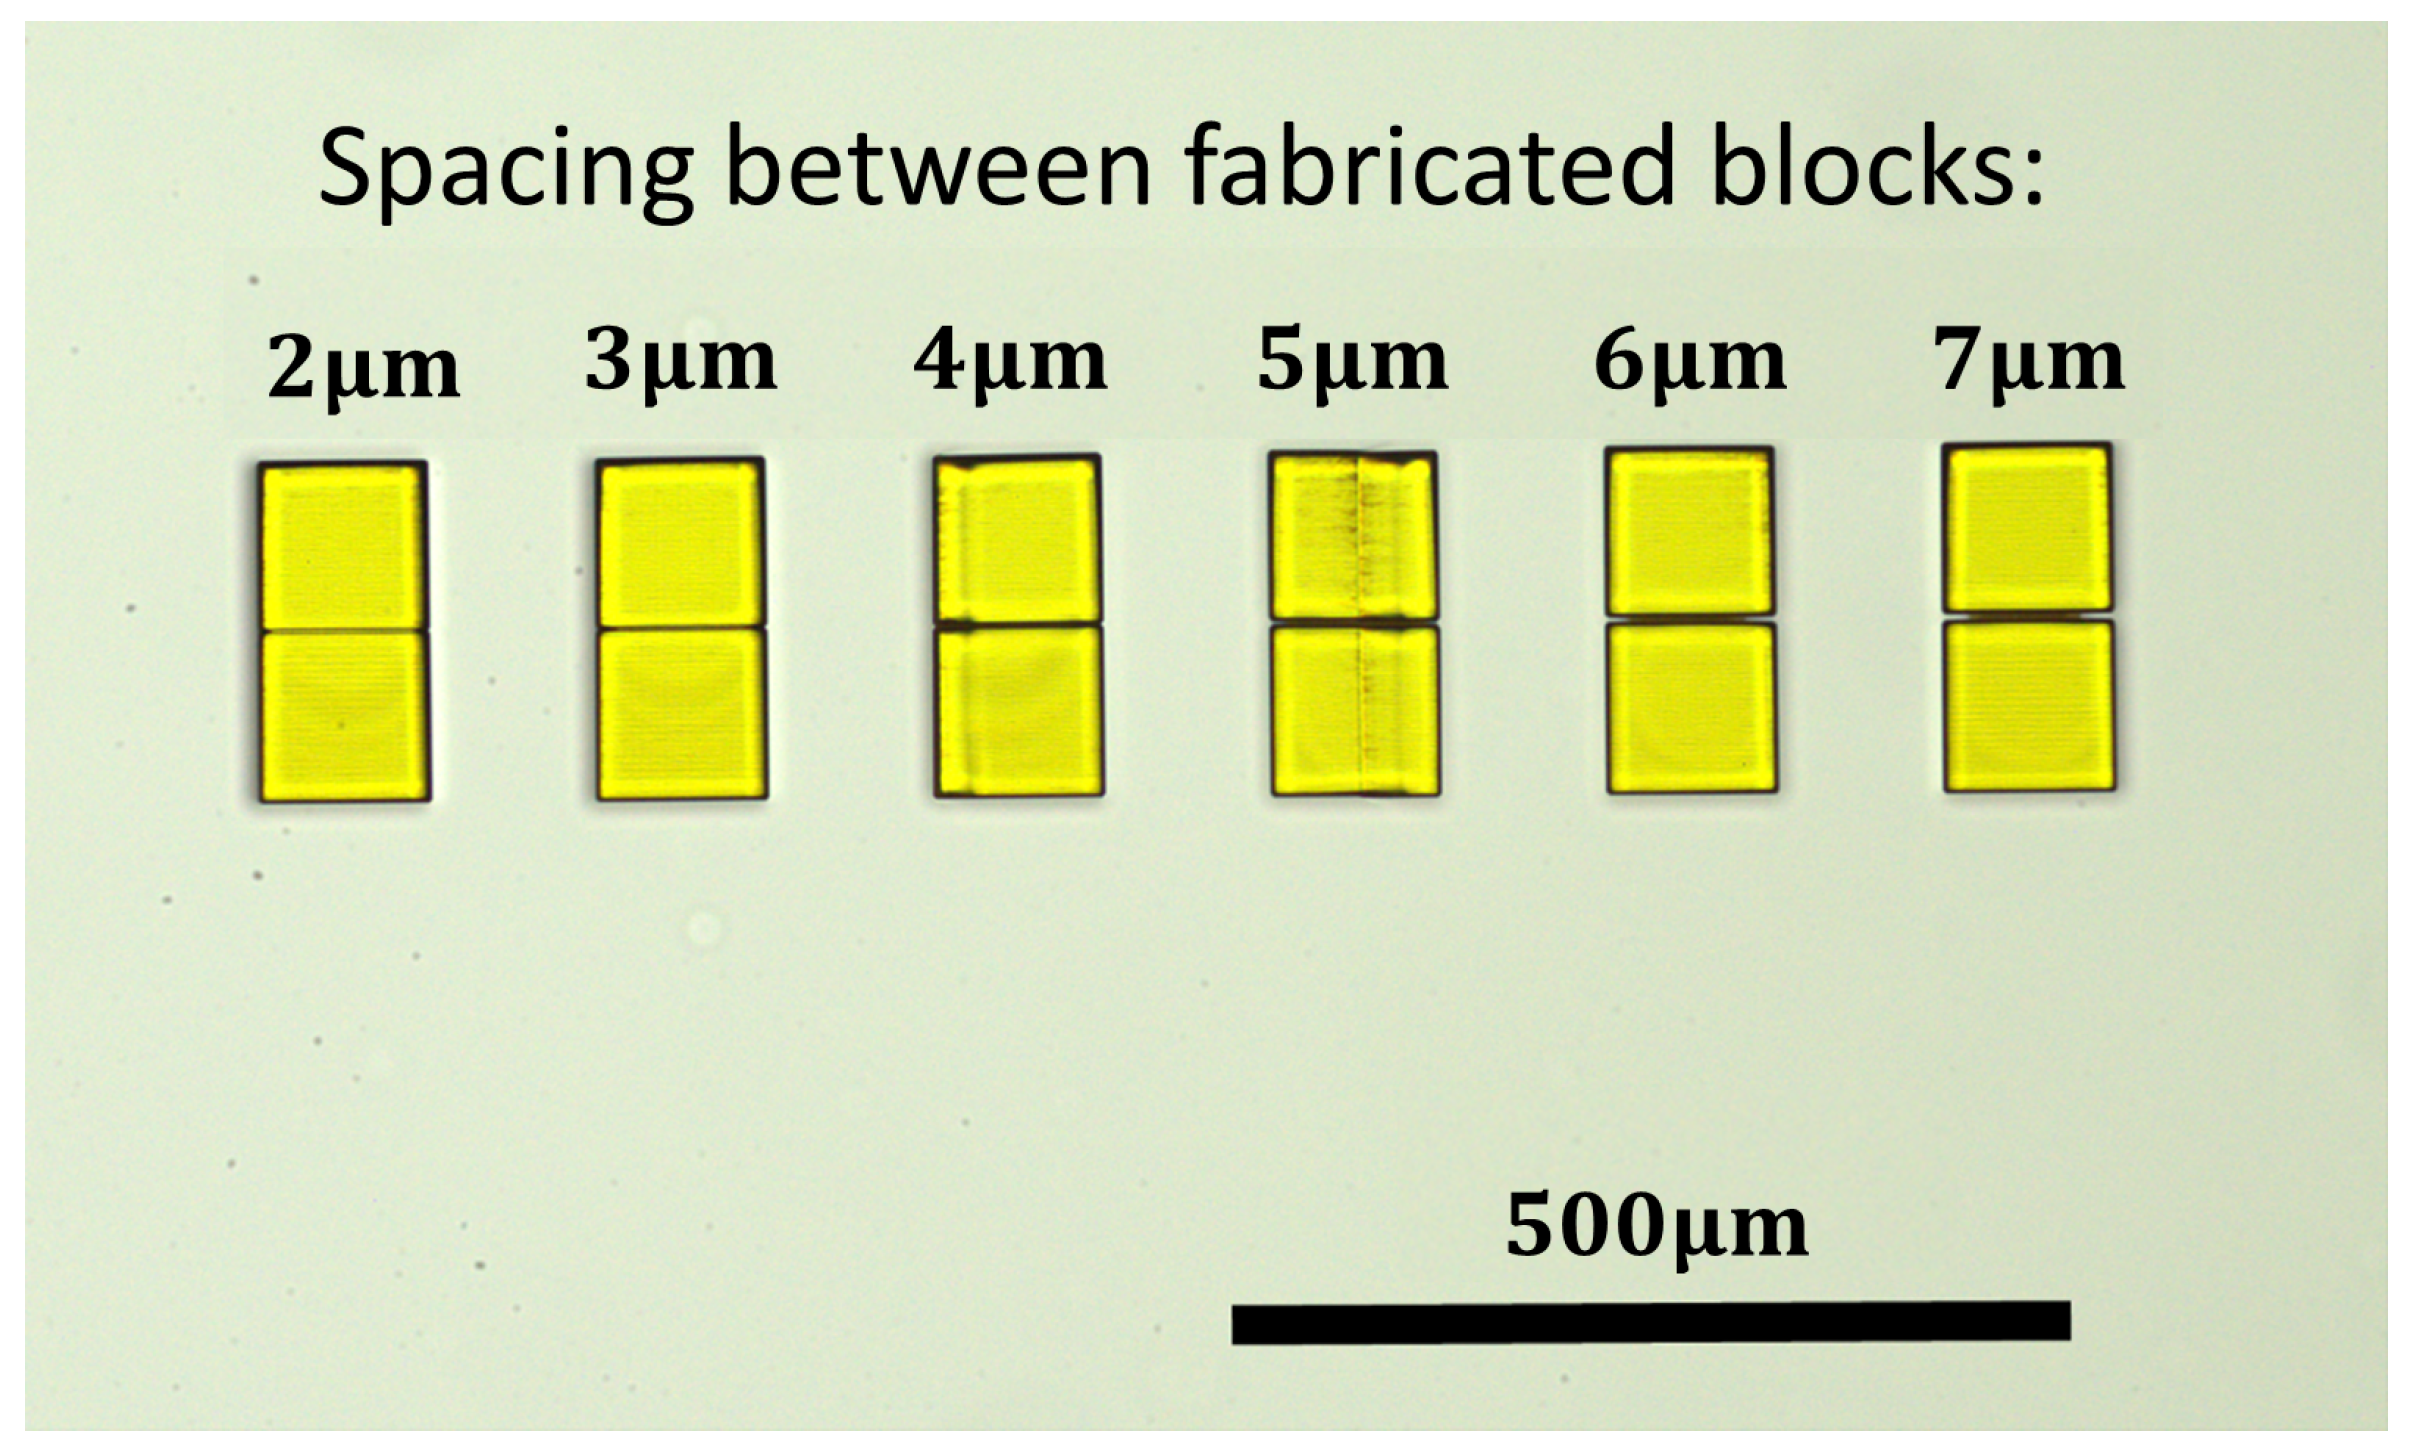
BSs were fabricated by using a commercial direct laser printing system (Nanoscribe, equipped with a 25× microscope objective lens) that used a two-photon absorption process to fabricate 3D objects. The necessary photons were provided by a laser that scanned the design structure by each layer but in
m blocks with up to a
m error. Therefore, because the design was larger than one block, the waveguides were manufactured one block at a time, which caused the block boundaries to be visible (see the upper image in
Figure 4). However, due to the dimensions of the waveguide and the manufacturing method, the guides could not be fabricated as close as desired. We tested the minimum separation distance that we could reach in the interaction zone by fabricating blocks that were similar to the waveguides with different separation distances. We determined that the blocks were not fused when the separation was greater than
m (see
Figure 5).
The waveguides were created in photoresin Ip-Dip (
for
nm [
18]) by using a fused silica substrate (
for
nm [
19]). Then, the structures were spliced by using a multimode optical fiber with an FC connection (Pigtail FC Multimode
), which facilitated the connection between the coupler lenses and APDs (avalanche photodiode detectors), which were single photon detectors. To position and align the optical fibers, a USB microscope and XYZ platforms with microdisplacers were used. Beforehand, the edges of the optical fibers were checked to ensure that they were as perpendicular as possible, as we intended to optimize the splicing and prevent other material from entering the interface (even air). Next, the optical fiber–waveguide–optical fiber setup was covered by using Loctite AA 3525 (
for
nm [
20]). To optimize the alignment before the Loctite was cured, laser light (635 nm,
mW) was sent into the system to monitor the output power and search for the maximum transmission. Finally, an led lamp (405 nm) was applied for 15 min to cure the Loctite and fix the setup. In total, 15 single BSs were fabricated, 10 with a
m gap and 5 with a
m gap between every waveguide.
These materials and methods allowed the waveguide geometry to be so rigid that its properties were not affected during and after the splicing process, which is contrary to what occurs with other options, such as PDMS, which is very flexible [
21,
22]. These materials and methods were strong enough to allow us to place the chip (with the fused silica substrate) in a common microscope slide and safely transport it.
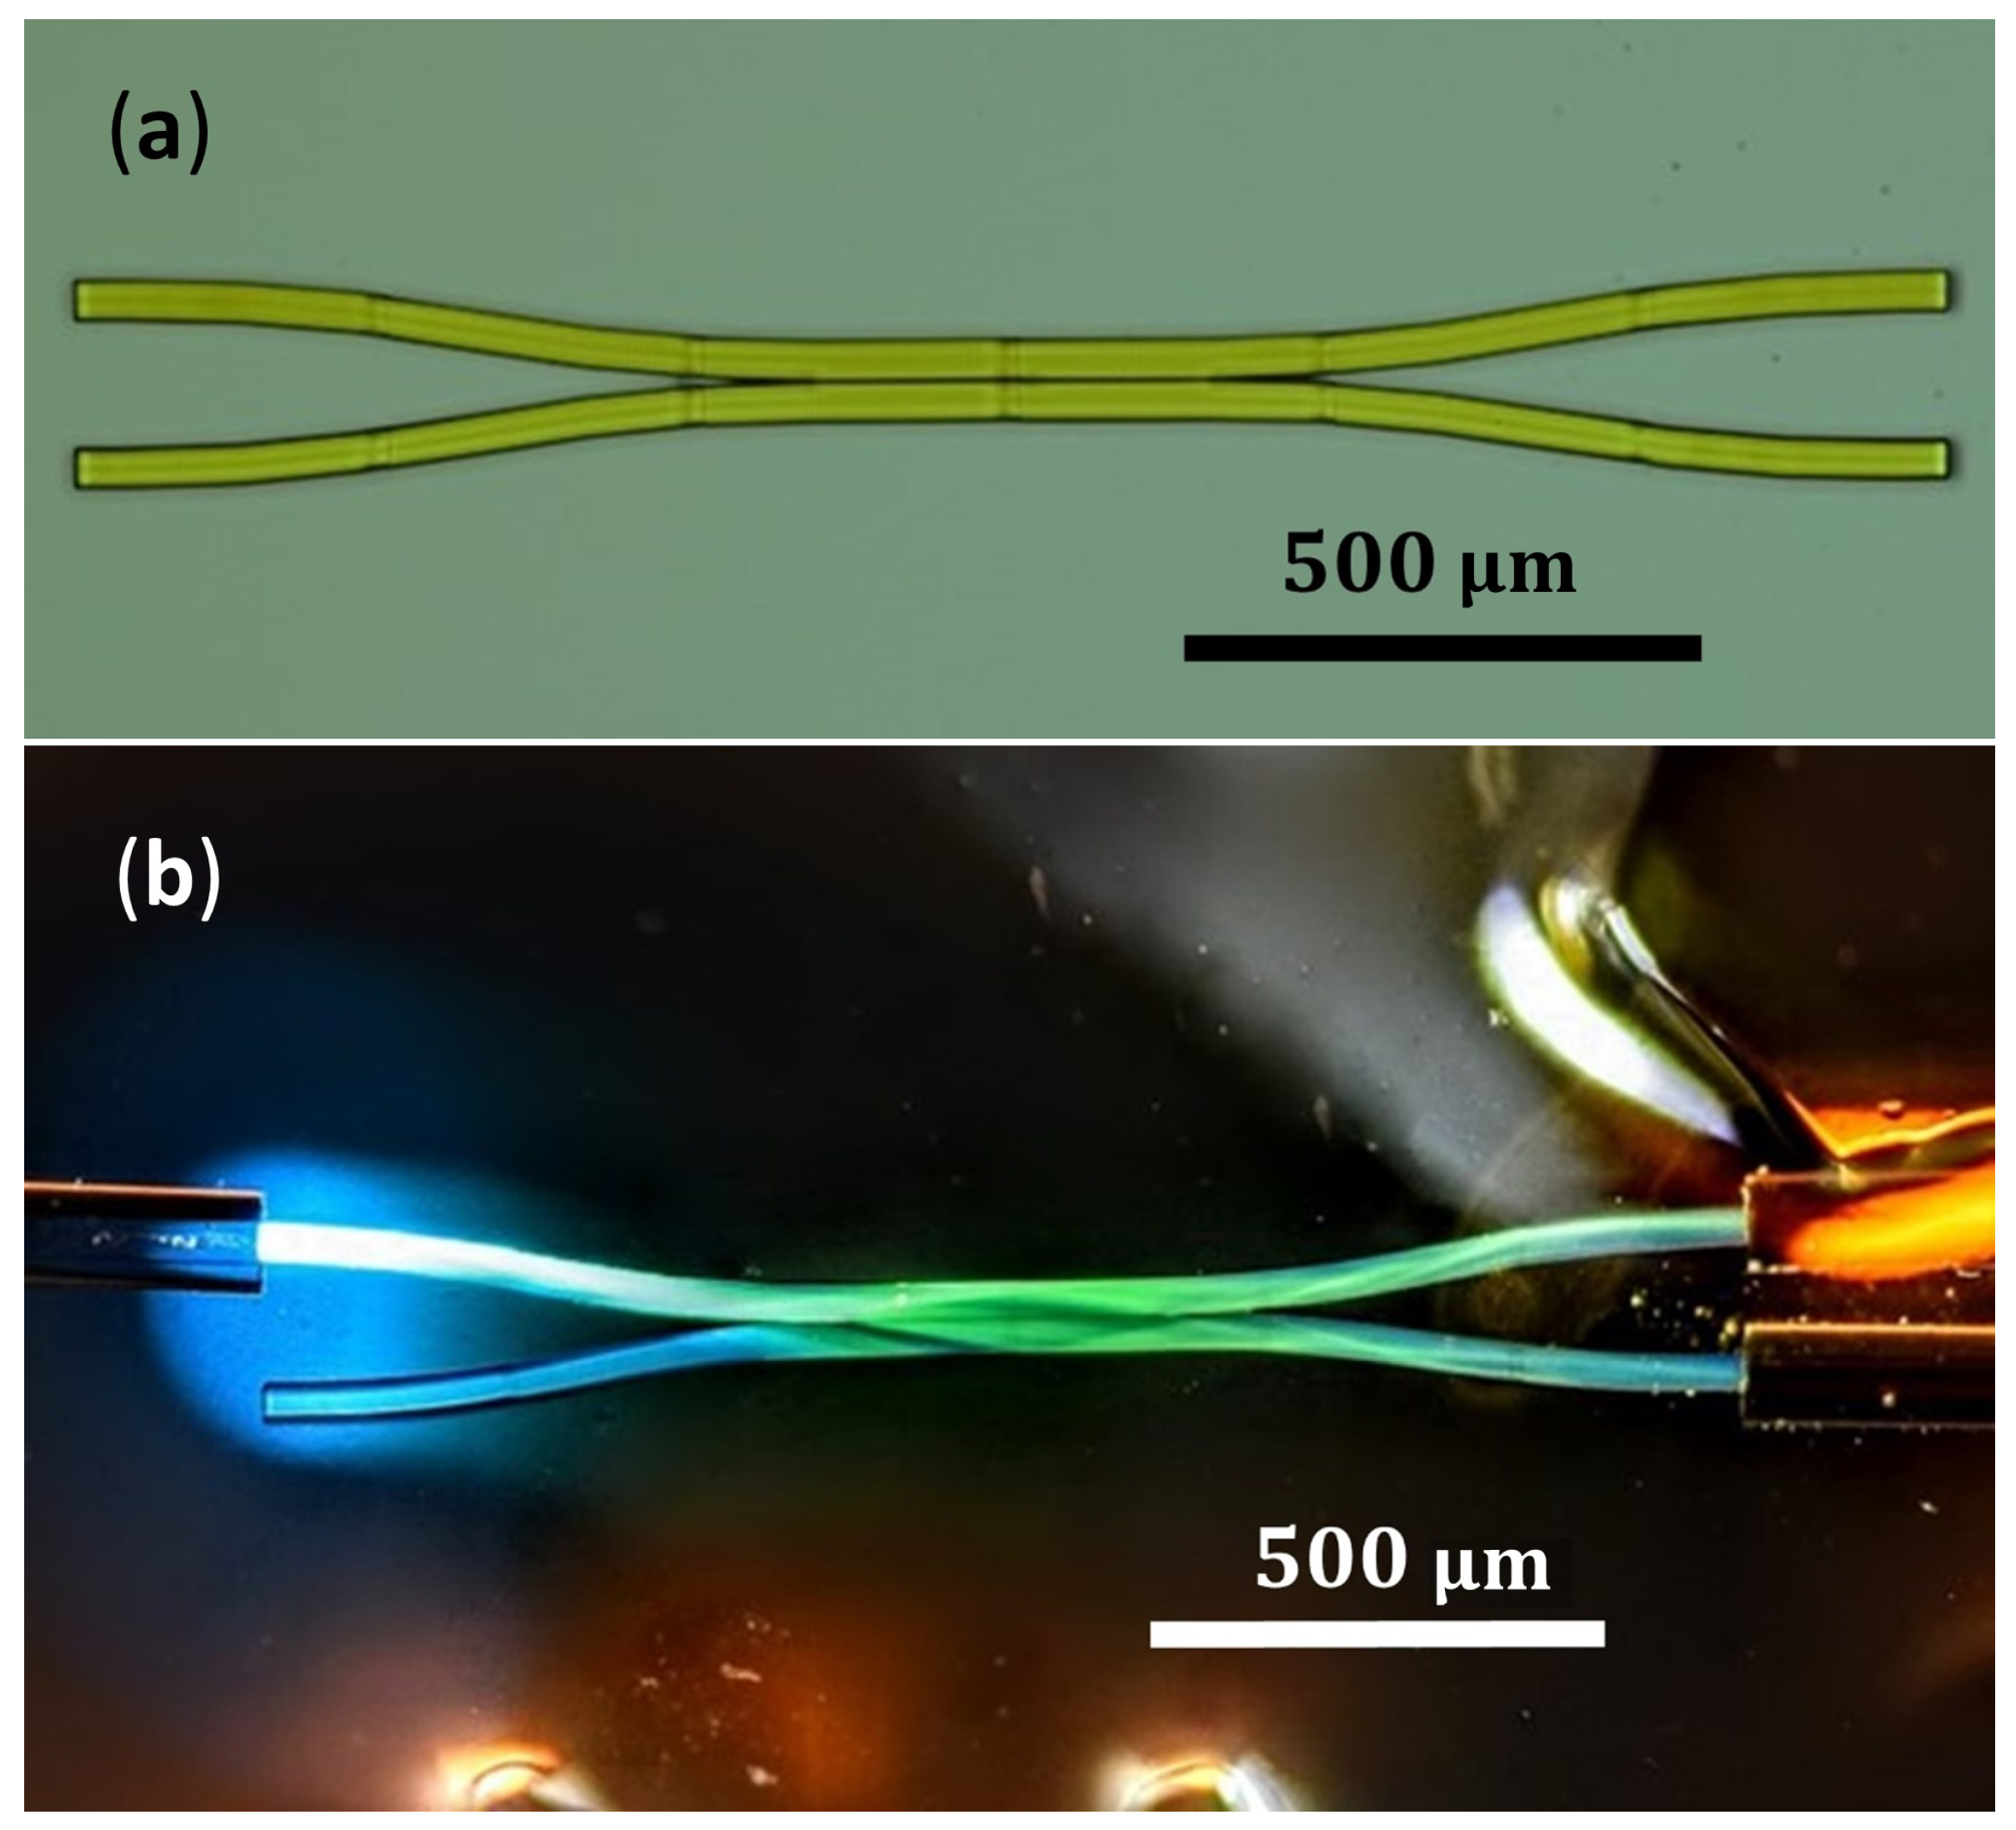
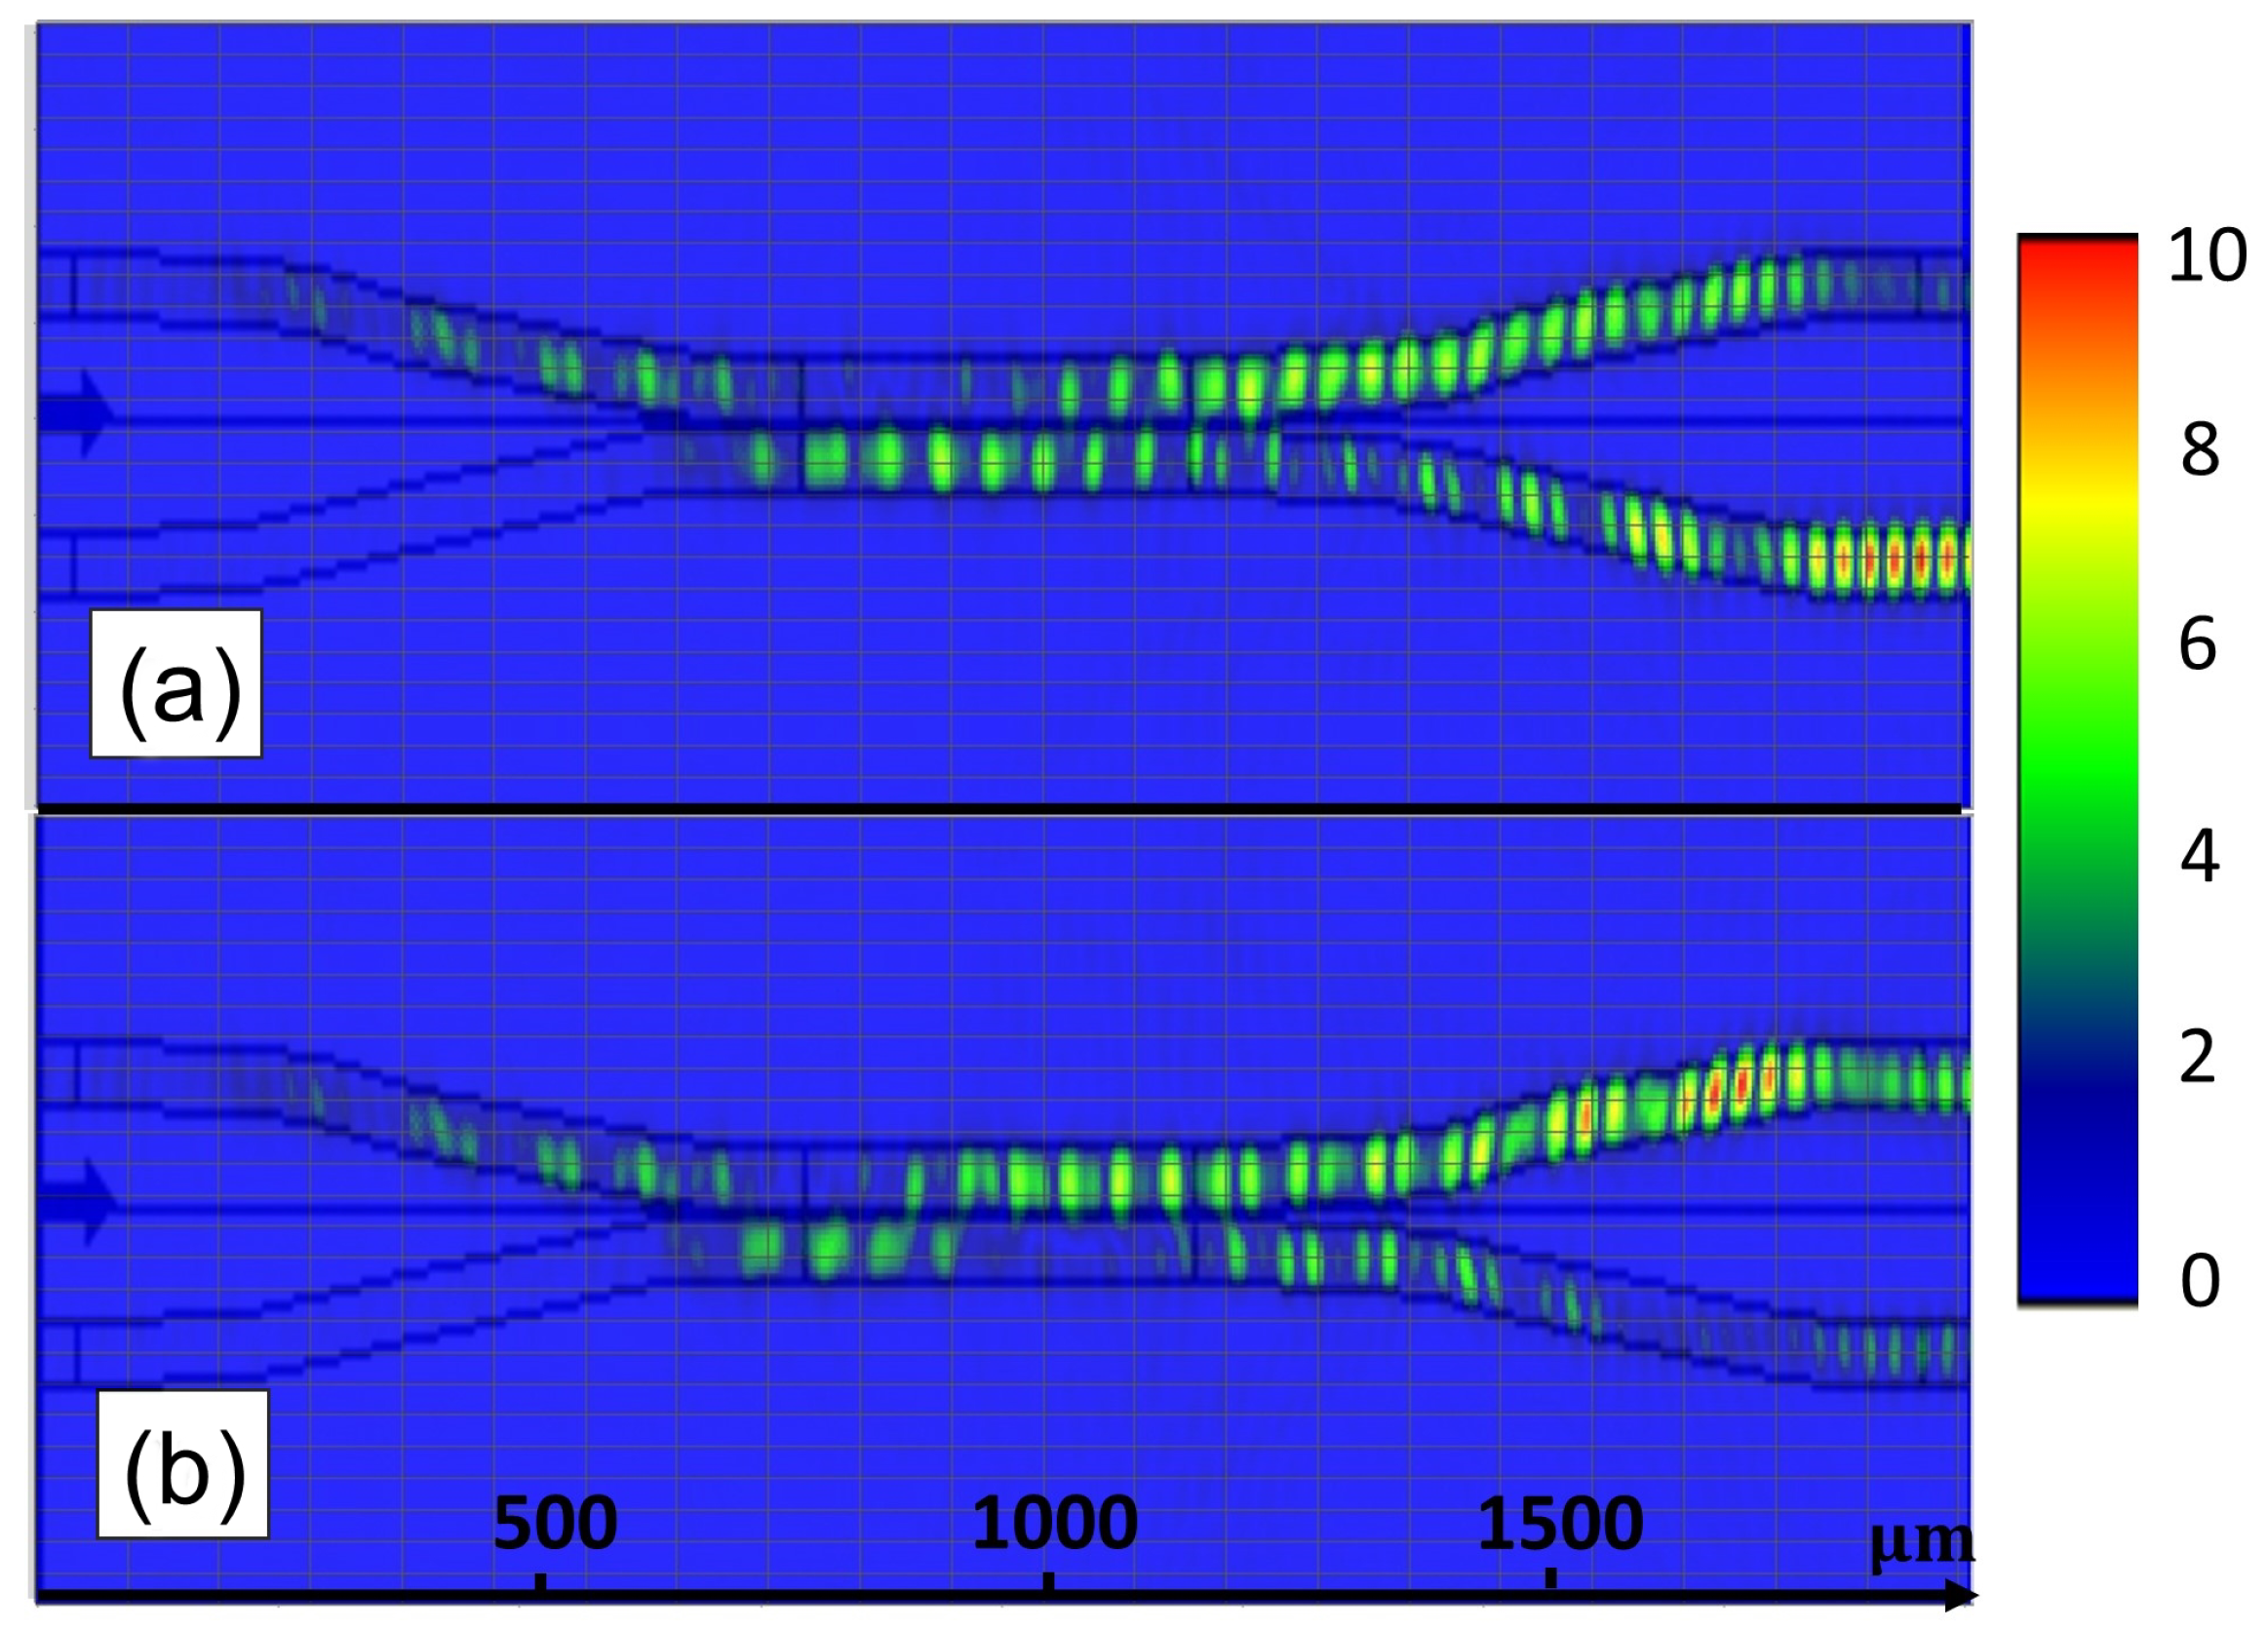
The waveguide geometry was designed by using OptiFDTD software. According to the waveguide dimensions and the materials refractive index, these waveguides were multimode and could support 33 modes. Simulations of the fundamental mode are shown in
Figure 6. With both examples, we used some equal parameters, such as the positions of the input light (left upper port propagated to the right), the
m beam width, and the 0° incident angle of the light. The difference between the simulations was the gap that separated the waveguides:
m for the upper one and
m for the lower one. If we observed the BS outputs, which are far right in both images, we found that the intensities were different and depended on the separation distance between the waveguides. Therefore, the transmission and reflection coefficients, which can be understood as the upper and lower waveguide outputs, respectively, could be controlled through this geometry parameter, due to its design.
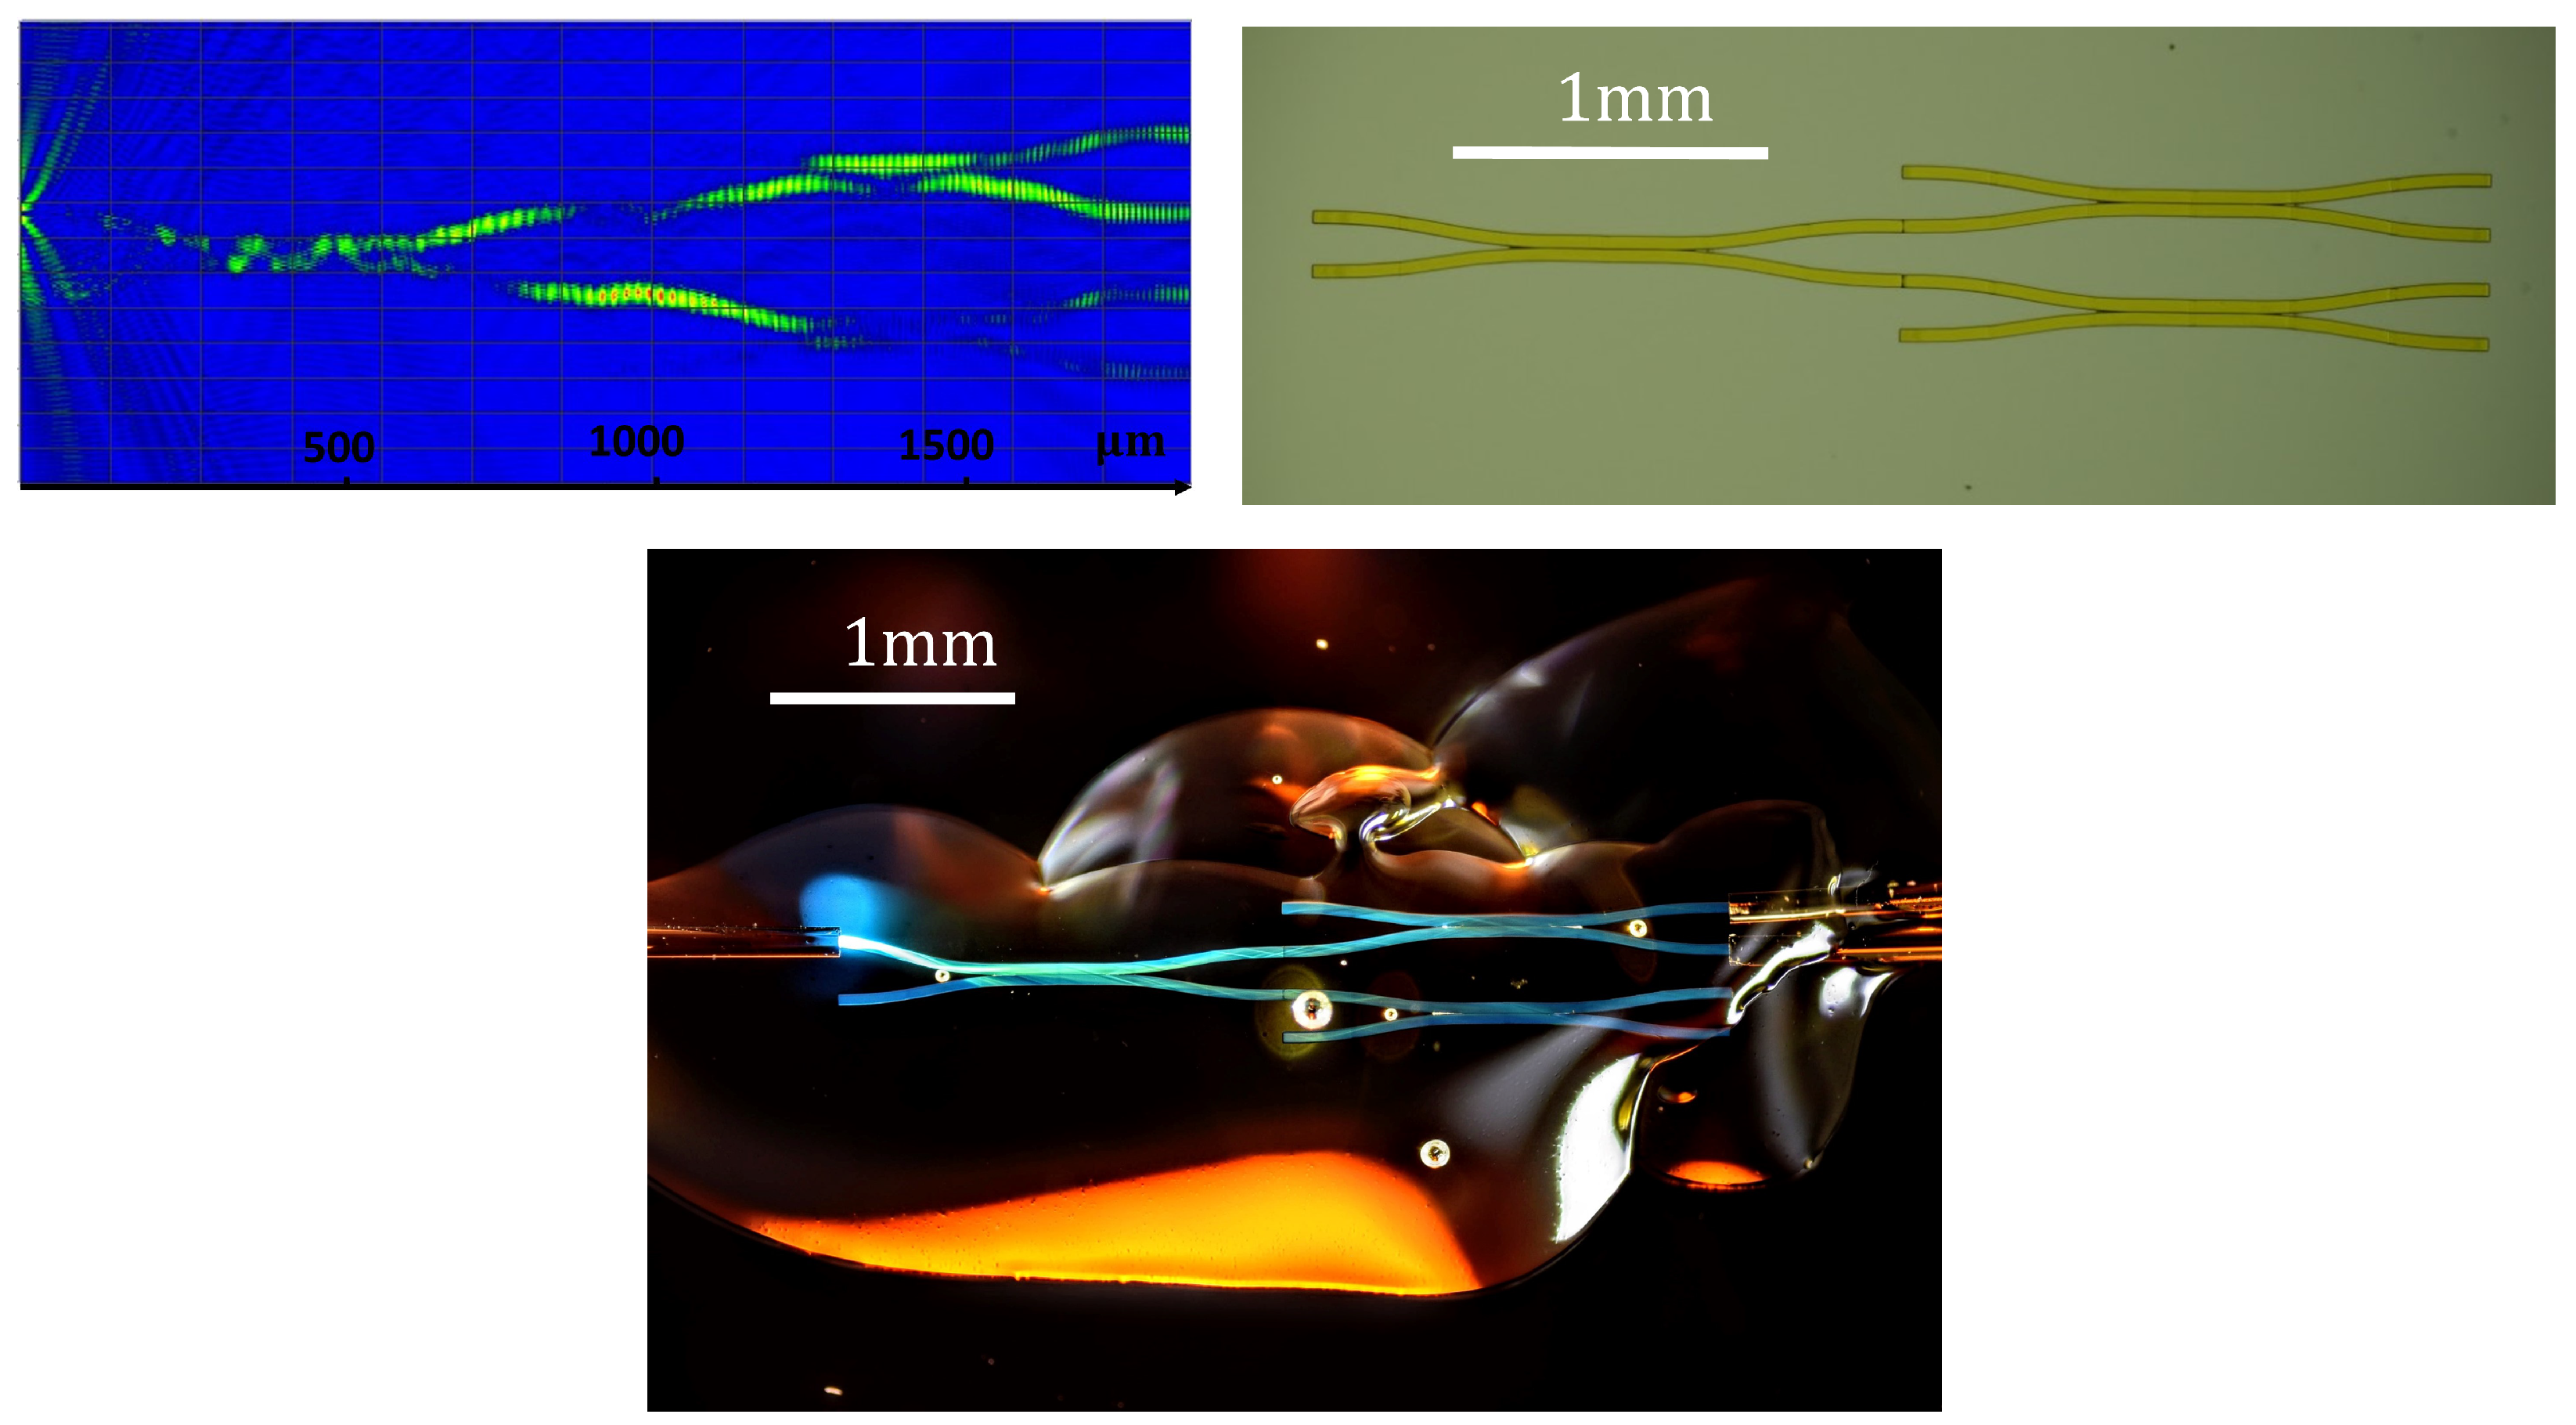
Then, based on the results of the simple BS, a multiple BS was designed and fabricated. The simulation in OptiWave and the microscope images taken before and after the splicing with optical fibers are shown in
Figure 7. This multiple BS consisted of a single BS with a
m gap between the waveguides and, in each output, there was another identical waveguide, analogous to the one shown in
Figure 3. Each single BS was fabricated one at a time so that the piece was segmented as little as possible during the fabrication. The gap in every single BS was chosen in such a way that a result that was similar to the upper simulation in
Figure 6 was obtained:
T:
R ≈ 40–60 BS. This meant that the expected intensities at the outputs of the BS, from top to bottom, were
,
,
, and
. The behavior of the intensities was demonstrated in the simulation (upper left in
Figure 7) and the microscope image when white light was sent through the chip (lower image in
Figure 7).
4. Experimental Statistical Measurements
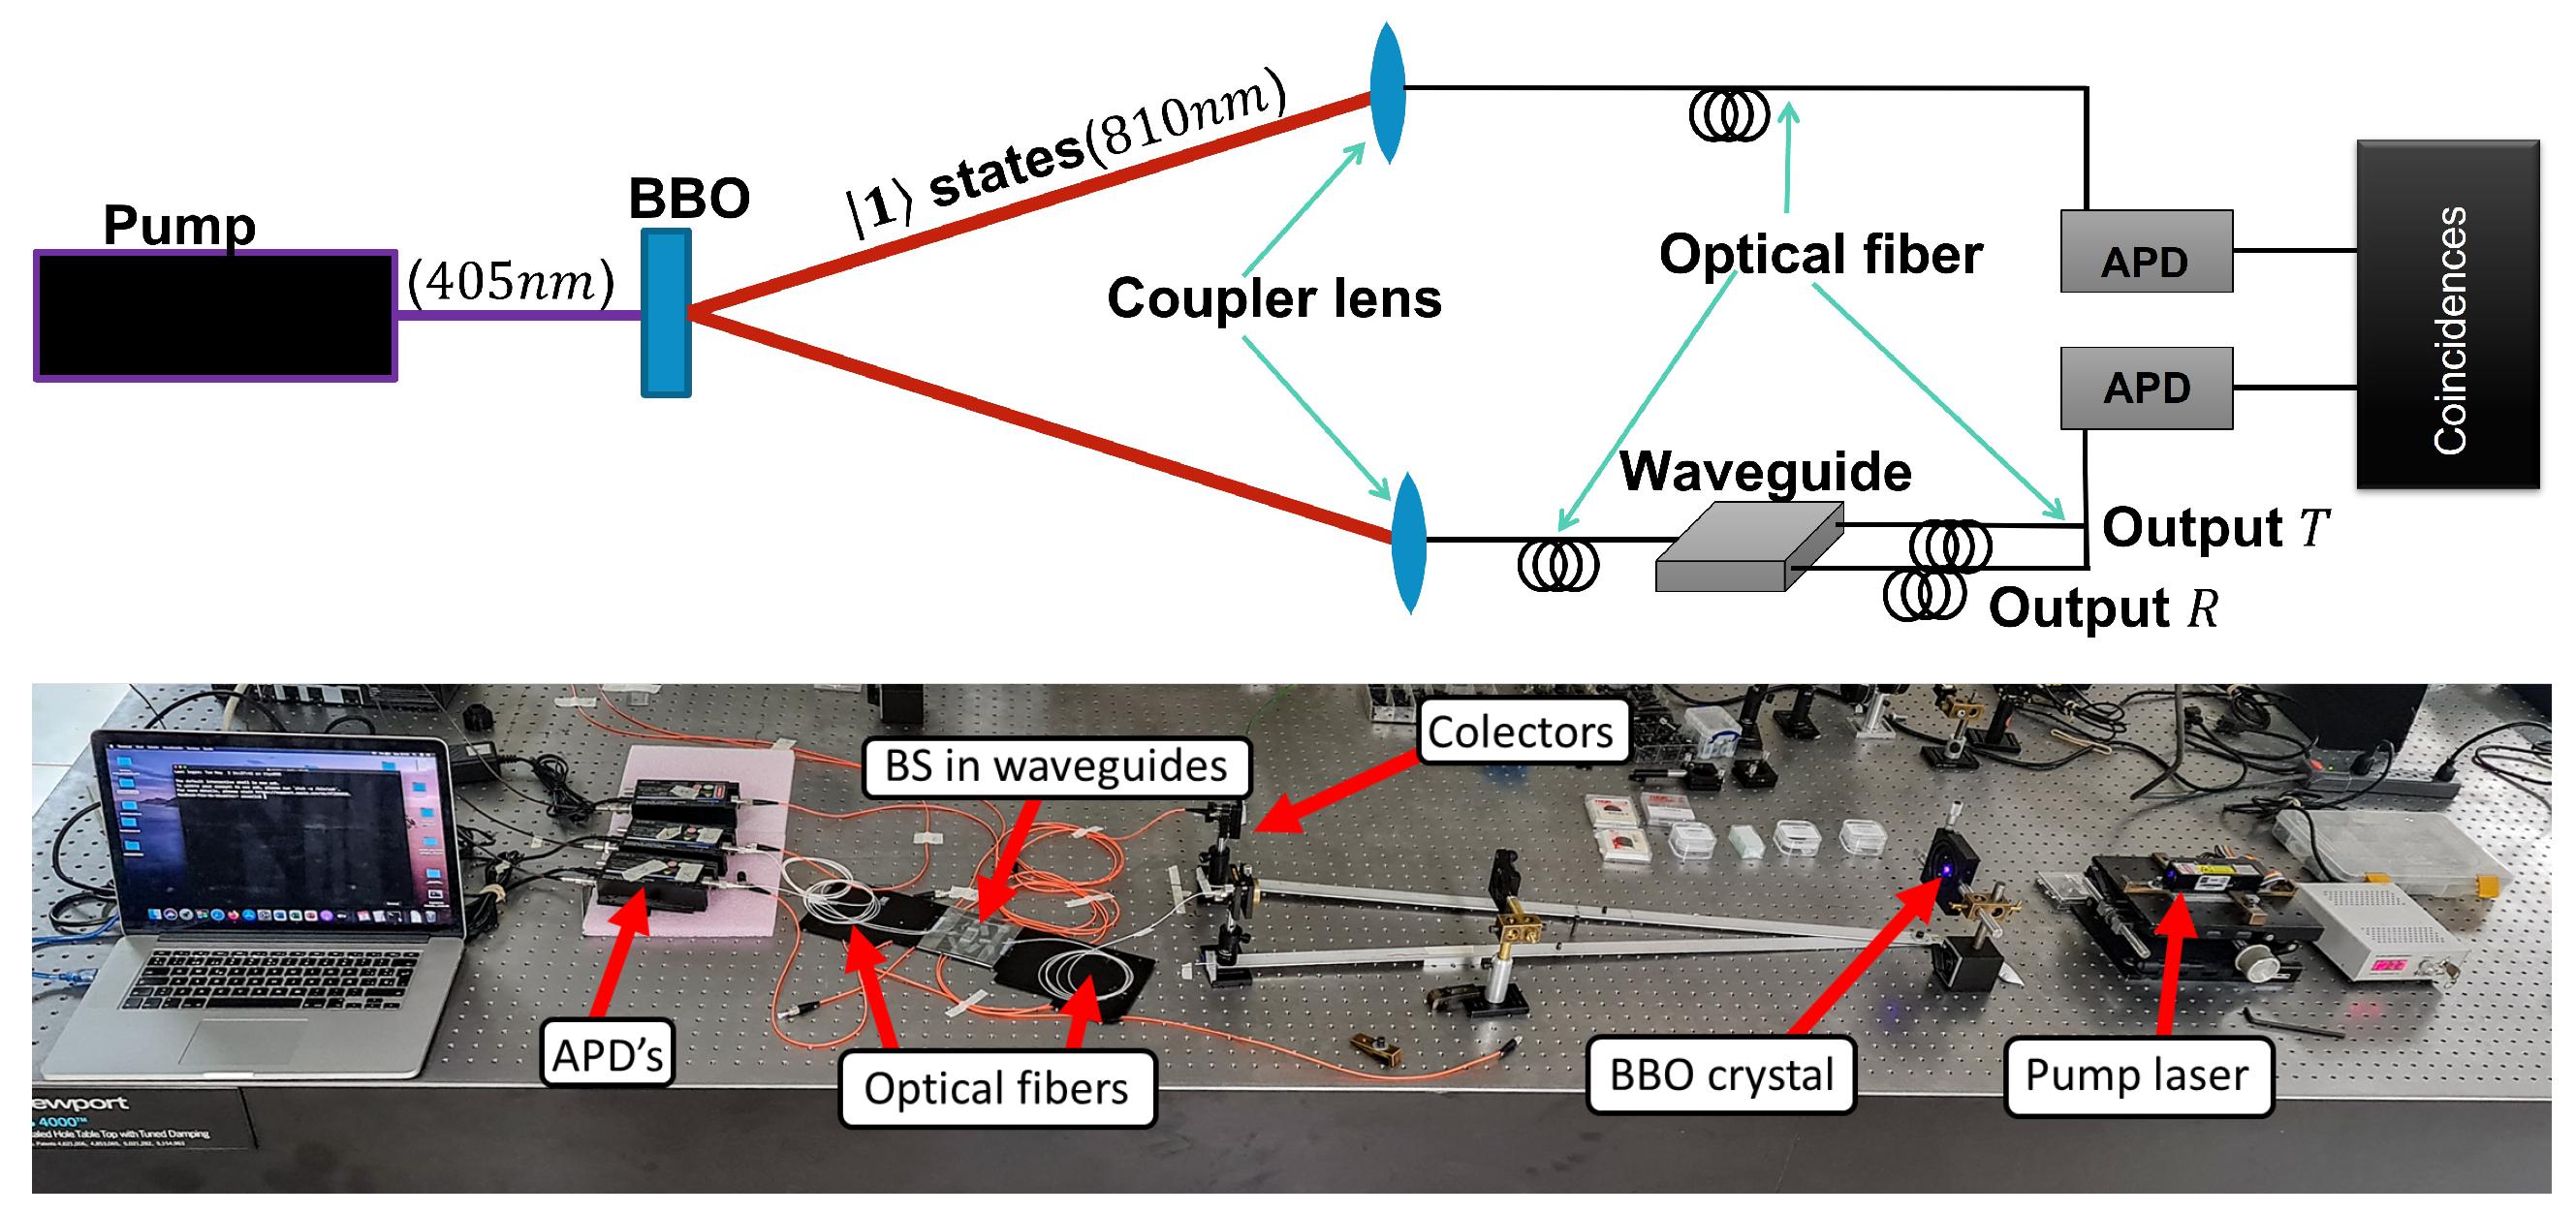
The single photon source was prepared by exciting a type 1 BBO crystal (3 mm width) by using a 405 nm continuous laser (107 mW) that produced photon pairs, as shown in
Figure 8. To ensure that we obtained these quantum states, we measured the second order correlation function (
). We found that
, which means that we had a single photon source. The output optical fibers of the chip were connected to an APD detector with a quantum efficiency of 60% for 810 nm. To differentiate the individual photon states and detection system noise, only idler and signal coincidences within a 5 ns time window were recorded. The maximum number of coincidences measured per
s was, on average, 8600 (without the chip), with a standard deviation of
. These measurements were recorded by using multimode optical fibers that were similar to those that were spliced according to the waveguides.
The transmission efficiency of waveguides with the same design is highly dependent on the splicing technique used. However, other sources of intensity loss exist, such as the difference between the modes supported by the waveguide and the optical fiber, the reflections for the fiber–waveguide interfaces, and imperfections within the guide material. Even so, the highest power measured at the exit when using the 635 nm laser was 36% and 15% for the single photon source.
The time series were created as follows: every idler and output
T coincidence was recorded as a 1, and the idler and output
R were recorded as a 0. Triple coincidence cases (idler,
T, and
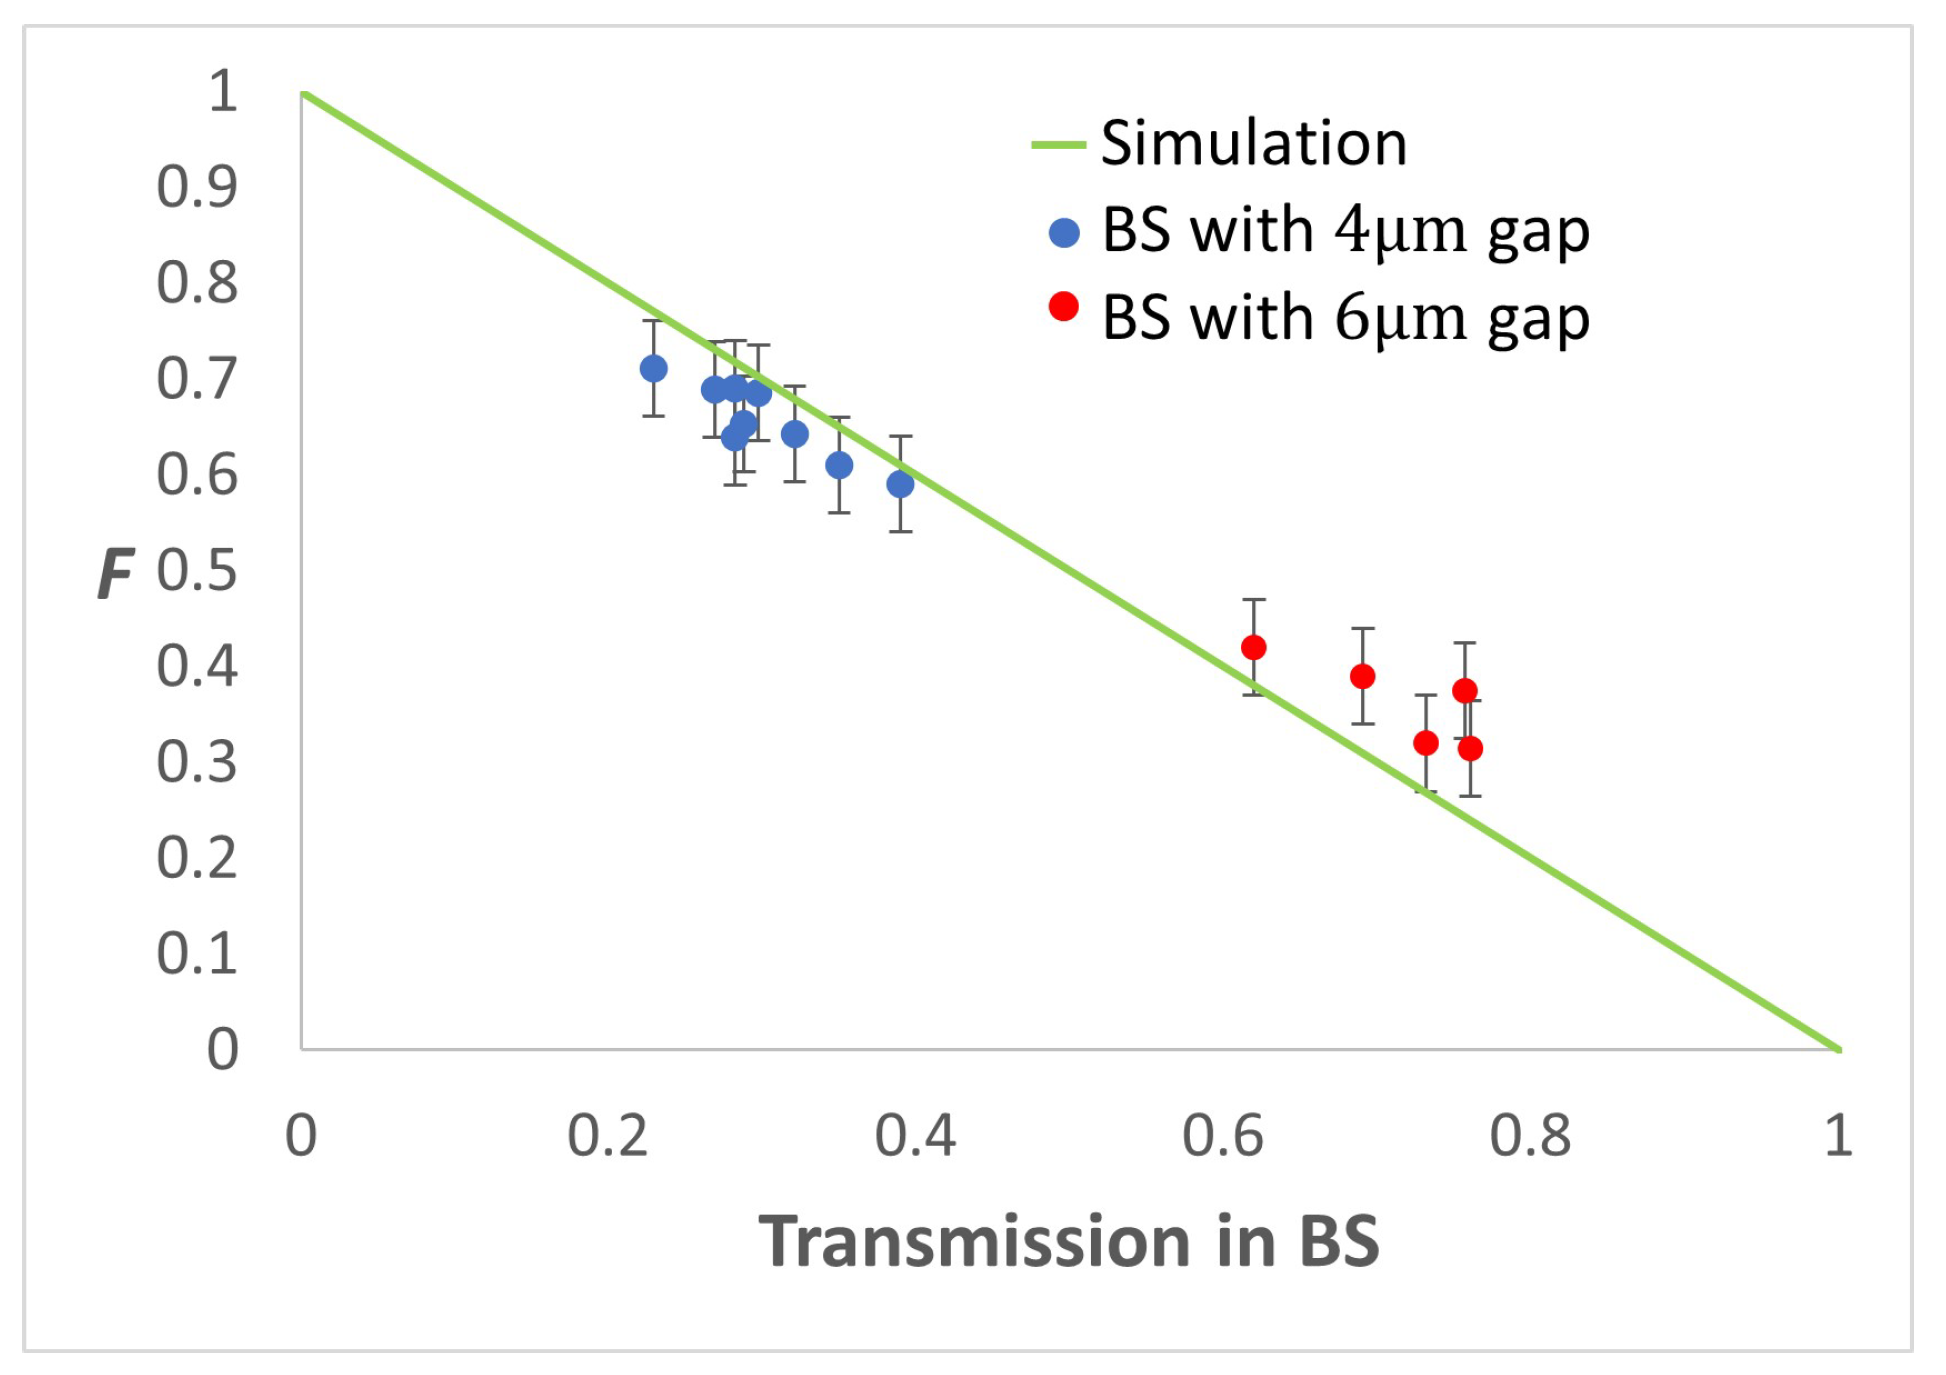
R) were not registered as a 1 or 0 because that signal did not come from the SPDC. Every analyzed time series corresponded to the 100 s detection; then, the Fano factor was calculated for the time series that was produced by every fabricated BS. The transmission factor
T was calculated for every case according to the total photons detected in the
T and output
R for every case. All the Fano factors were measured with the single BS, and the comparison with the simulation results is shown in
Figure 9.
Of the 15 beam splitters that were fabricated with a m gap between the waveguides (the minimum possible gap), we observed that at least two of them complied with the chaotic statistic ( noise). Moreover, the five beam splitters were manufactured with a m gap, of which one complied with the chaotic statistic (f noise).
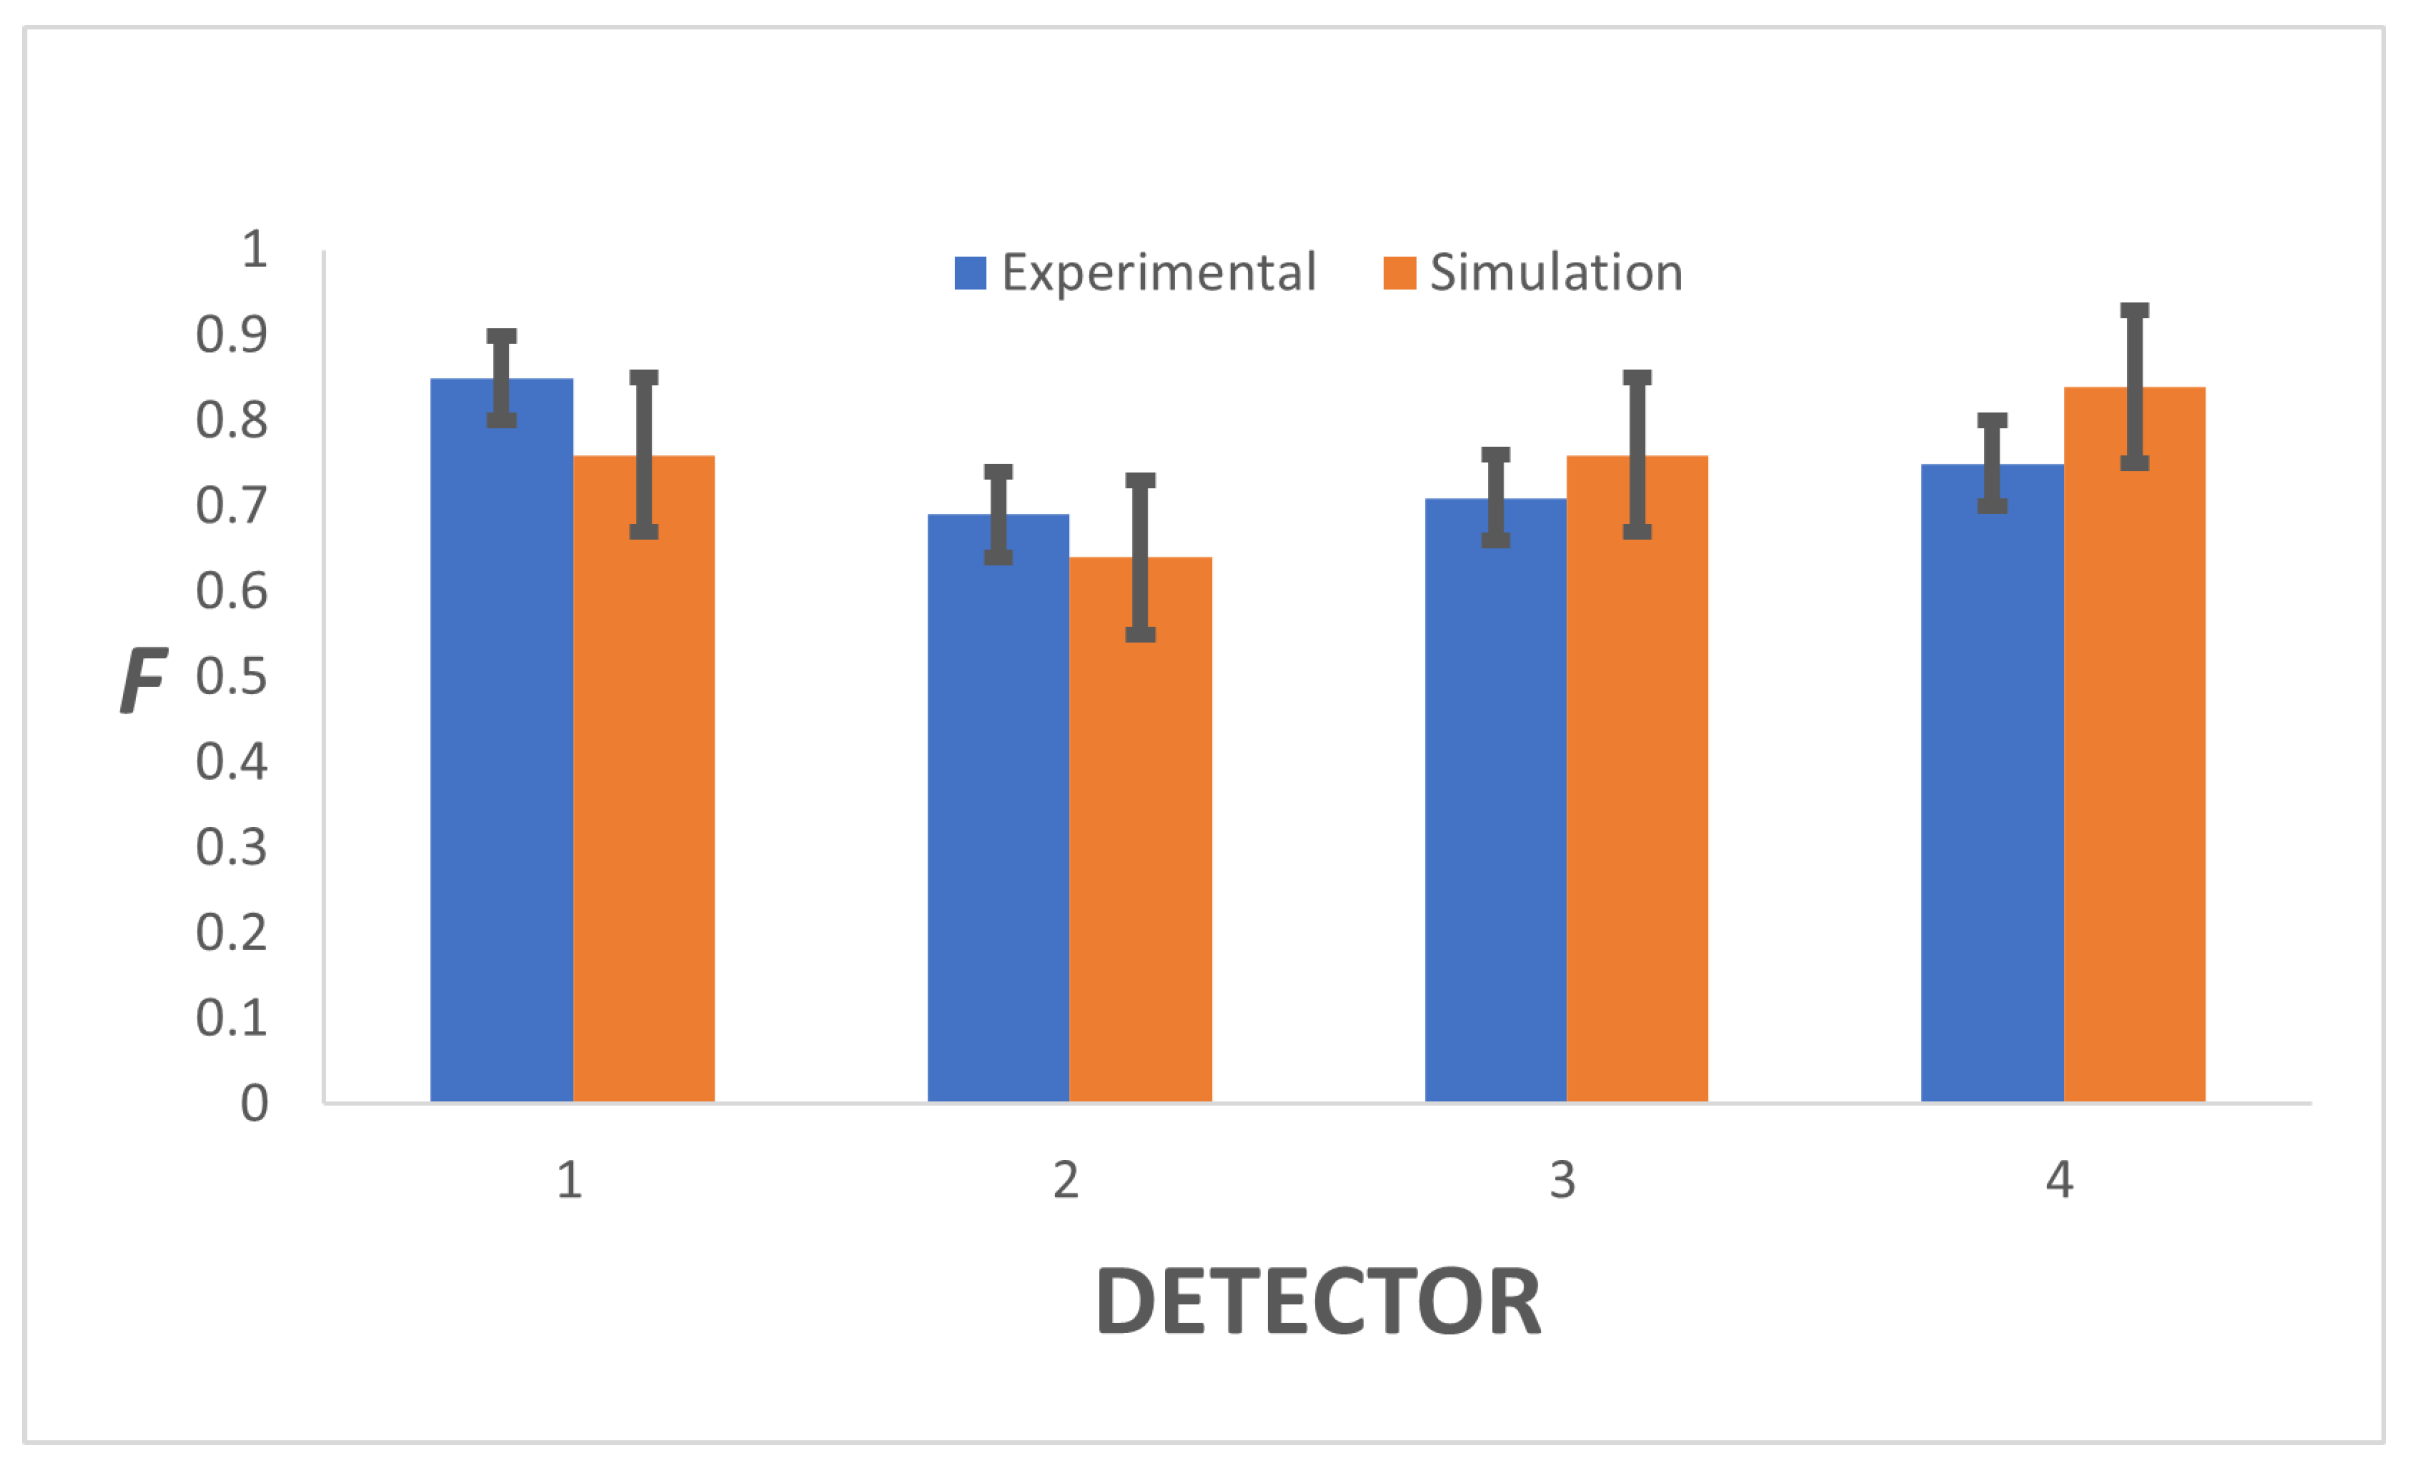
Figure 10 shows the experimental results of the multi-BS. For every output, the measured Fano factor, with its standard deviation, was compared with the results of the numerical simulation at
T = 0.4 and 0.1 with random fluctuations. The general behavior and measured statistics corresponded with the expected values of the simulations with fluctuations. The expected effect on the photon statistics was that the Fano factor would trend towards
F = 1 when we increased the number of beam splitters with the same 60:40 ratio. However, obtaining statistics on demand in the nth BS output was possible by controlling the
T:
R ratio for each beam splitter in the array.
For this specific case with three beam splitters with 60:40 ratios, we found that detectors 3 and 4 had a statistic close to noise, even though detectors 1 and 3 should have had this type of noise. Most of the variances in the transmission coefficient of the same designs were mainly due to fabrication imperfections or the optical fiber slipping over the waveguide during the fixing process. Loctite slightly shrinks when it hardens, so its alignment can be affected. However, once the Loctite was totally cured, the statistical results of the single and multiple BS remained constant, despite promoting different propagation modes through optical fibers and, thus, waveguides. This was tested by varying the tilt of the single photon-collecting lens.
5. Conclusions
A method to manufacture microfabricated multimode waveguide beam splitters coupled to multimode optical fibers is presented. The chip that contained the waveguide system that was coupled to the optical fibers was quite robust, and could easily be handled within a laboratory or transported without altering its transmission properties. The size of the waveguides showed that they were multimode. Some of the main supported modes could be seen when white light was sent from the input optical fiber into the chip (shown in the lower image in
Figure 4 and
Figure 7). In addition, these beam splitters showed that they could produce different quantum statistics from defined quantum states, such as single photons. The results showed that the Fano factor that was measured for the beam splitter waveguides aligned with the numerical simulation predictions with 10% random fluctuations in the transmission coefficient.
Additionally, the properties of the manufacturing equipment and the novel methodology allow them to be applied to create a wide variety of geometries of classical optics and quantum technologies. For example, for interference purposes, a simple BS can be used as a Hong–Ou–Mandel interferometer or multiple BS (two BSs one after the other), which can be used as the base of an integrated Mach–Zehnder biosensor. Another potential application for a multiple BS is the quantum random walk (QRW) in a setup that is similar to the Galton board, which is used in classical physics. Regarding cryptography, for example, binary time series can be employed to generate OTPs (one-time passwords), where each part of the time series represents a distinct one-time password. By using a secure mechanism to synchronize the time series between the sender and receiver, OTPs can be generated and used for secure authentication [
23]. Moreover, these waveguides could be used as a binary time series to generate random binary sequences that cryptographic protocols often require. Additionally, even though 1/f noise is not as random as shot noise, 1/f noise is more robust when transmitting information because its autocorrelation preserves the memory beyond other noise [
24]. Moreover, these beam splitters can be part of a quantum computing setup because only linear optical components, such as single photons, phase shifters, and beam splitters (polarizing and nonpolarizing), are needed for efficient quantum computing. Additionally, despite the fact that this method can be applied with almost any type of optical fiber, using the FC connection is an advantage because it can easily be used for many experiments wherein commercial equipment, such as coupler lenses and APD detectors, are required.


