Article

Characterization of Grid Lines Formed by Laser-Induced Forward Transfer and Effect of Laser Fluence on the Silver Paste Transformation

1
Institute of Mechanics, Chinese Academy of Sciences, Beijing 100190, China
2
Guangdong Aerospace Research Academy (Nan Sha), Guangzhou 511458, China
3
School of Engineering Science, University of Chinese Academy of Sciences, Beijing 100049, China
4
Center of Materials Science and Optoelectronics Engineering, University of Chinese Academy of Sciences, Beijing 100049, China
*
Authors to whom correspondence should be addressed.
Photonics 2023, 10(7), 717; https://doi.org/10.3390/photonics10070717
Submission received: 28 April 2023 / Revised: 15 June 2023 / Accepted: 15 June 2023 / Published: 22 June 2023
(This article belongs to the Special Issue Fiber Laser and Their Applications)

Abstract

:
The investigation of novel approaches for forming solar cell grid lines has gained importance with the rapid development of the photovoltaic industry. Laser-induced forward transfer (LIFT) is a very promising approach for microstructure fabrication. In this work, the morphology of grid lines deposited by LIFT was investigated. A characterization scheme for solar cell grid lines was proposed. The shape of grid lines was described, combined with confocal imaging. The evolution process of grid lines from no forming to single-peak and double-peak with a variation of laser fluence was observed. According to experimental conditions, different types of grid line morphology were obtained and transfer mechanisms of silver paste were proposed based on fluid dynamics. The influence of laser fluence on the morphology of formed grid lines was explained through phenomenology and analysis. This can provide a guide for morphology control in forming the process of grid lines.

1. Introduction

Laser-induced forward transfer (LIFT) is one of the most promising approaches for contactless device fabrication at the microscale or nanoscale levels [1]. In classical LIFT, the laser beam irradiates a thin film of an absorbing material (the donor), which is usually deposited onto a transparent substrate. A pulsed laser is used to ablate a small portion of the donor film and deposit it onto a receiver substrate. The donor material can be solid or liquid and is transferred in the solid phase or as small droplets in the liquid phase onto the receiver substrate. The donor material can be a solid or liquid material, and is transferred in the solid phase or as small droplets in the liquid phase onto the receiver substrate. The flexibility, simplicity, and high speed of laser-induced microfabrication and nanofabrication techniques give them advantages over traditional device manufacturing techniques [2,3,4]. LIFT is used to print metal contacts [5] and patterned solder paste [6] for microwave interconnects in microelectronics or coplanar waveguides [7].
With the development of solar cell technology [8], reducing cost and increasing efficiency have become the goals of industry development. As an important part of the solar cell, a grid line is used to transmit the generated photogenerated carriers. Therefore, the formation of grid lines (metallization of cells) is a necessary process in the fabrication of solar cells. Additionally, the amount of silver paste used in the grid line is the second-largest cost for solar cell production. The morphological characteristics of grid lines greatly influence the performance of solar cells. To reduce cost and improve efficiency, the width of grid lines needs to be much thinner, and the aspect ratio needs to be much larger. This will reduce the amount of silver paste and the shielding of grid lines on the solar cell surface. Screen printing is usually used to form grid lines in the industry. The process is mature and the production rate is fast. However, as a kind of contact printing technology, screen printing inevitably exerts certain pressure on the silicon wafer during the printing process, which may cause the silicon wafer to break. In addition, the use of high-viscosity silver paste particles in front metallization will lead to screen blocking, affecting the quality of printing. Non-contact printing methods, such as aerosol jetting [9], inkjet [10], microprinting [11], and dispensing printing [12,13] are studied. As a very promising approach, LIFT is being tried for the front metallization of solar cells [14]. Benefiting from being non-contact and maskless, the damage to the fragile silicon wafer and accuracy reduction caused by the blockage of high-viscosity paste are avoided. Moreover, due to the high controllability of laser, the morphology of grid lines could be controlled more flexibly, and the electrical properties could be improved.
The electrical properties, such as conductivity and contact resistivity, of the grid line depend not only on the material properties themselves but also on the morphology of the grid line. Currently, parameters for the cross-sectional characterization of grid lines mainly focus on the cross-sectional area, shielding area, the effective width of the core [15], and aspect ratio. However, there is no uniform standard, and these parameters are not sufficient to fully characterize the morphology of grid lines. To more completely characterize the morphology of grid lines and more accurately judge forming quality, parameters such as average shading line width, conductivity line width, line height, cross-sectional area and aspect ratio, valley height, and peak separation of grid lines are proposed for the analysis of the influence of laser fluence.
The transfer process of silver paste and the morphology, as well as the quality of the formed grid line, will be strongly affected by the specific rheology of the silver paste used [16], making the transfer mechanism different from that previously observed in conductive inks or nano pastes [17]. Continuous lines with high aspect ratios have been printed at high speeds [18]; however, in this research, the influence of the interaction on adjacent pulses is not considered. The grid line obtained is wavy, which greatly affects the conduction efficiency. Both P.Sopeña [19] and Muñoz Martin [20] focused on the interaction between adjacent pulses. A non-uniform donor film surface was generated. Different events [21], such as bubble expansion, bubble burst, or no expansion at all, can randomly develop depending on the donor film state at the moment of irradiation, which causes transmission failure. To improve grid line quality and avoid non-uniformities or other defects, researchers have proposed many methods. Multiple line printing [22] was studied, which consists of printing several lines on top of the previous line. In this case, the donor was moved after each voxel transfer, and each pulse irradiated a new area without interfering with the others. Finally, a grid line with a width of 65 μm was obtained. However, the printing speed of this approach is slow due to the limitation of the donor’s movement speed. Y. Chen [18] and Muñoz Martin [20] both increased the laser spot pitch to reduce the influence of the interaction between adjacent pulses. However, the increase in the spot pitch caused the overlapping area of voxels to shrink, which resulted in significant fluctuations in the line width. Muñoz Martin [20] solved this problem by using a higher laser fluence to obtain larger voxels, which could increase the overlapping area of voxels. Nevertheless, this method resulted in a significant increase in the width of the obtained line, reaching 134 μm. Pattern transfer printing (PTP) [23] is also a non-contact laser printing technique similar to LIFT. A transparent polymer with narrow grooves is applied as the transparent substrate in PTP, and silver paste can only be filled into the grooves. Laser beam will scan along the grooves and the silver paste is transferred from the grooves to the silicon wafer. The width and aspect ratio of the grid lines could be controlled by adjusting the size of the grooves. The latest research [24] shows that PTP could obtain grid lines with a width of 20 μm and an aspect ratio of 0.6. Compared with LIFT, PTP can obtain grid lines with a width of 20 μm and an aspect ratio of 0.6. Compared with LIFT, PTP has a higher printing resolution. However, the transparent substrate must be customized to the printed pattern before transferring. Additionally, as processing time extends, drying silver paste may clog narrow grooves, leading to the invalidation of this method. Thus, it remains a big challenge to print high-resolution grid lines with the merits of non-contact and non-masking methods. To avoid interaction and achieve successful transfer, a larger distance between laser points was used. However, in cases of large spot spacing, it is difficult to obtain continuous grid lines or even thinner lines. Therefore, analyzing transfer mechanisms at high repetition frequencies for forming grid lines is very important. In this paper, the interaction between pulses is considered, and the grid line is formed under a small gap and high overlap rate with a high repetition frequency (1000 kHz).
In this paper, grid lines are formed by a non-contact laser forming method. Two typical morphologies of grid lines, namely single-peak, and double-peak, were observed using high-viscosity silver paste in the LIFT forming process. The typical morphology was characterized and the influences of laser fluence on the morphology of transferred paste and grid lines were studied. Based on characterization of grid lines and transfer analysis, the transfer mechanism of LIFT for high-viscosity silver paste was proposed in forming grid lines.

2. Materials and Methods

A self-built LIFT system was employed. As shown in Figure 1, a pulsed laser (532 nm; 12 ps; 1 MHz) was used as the laser source, a galvanometric mirror system as a scanning head, high precision fused quartz as the donor substrate, high-viscosity silver paste as the donor film, and monocrystalline silicon wafer as the receiving substrate. With a galvanometric mirror system, the system can scan at speeds up to 5 m/s along a predetermined path. An f-theta lens was applied to focus the laser beam reflected from the galvanometer scanner onto the donor. The distance from the donor to the receiving substrate could be electrically adjusted from 15~50 μm. The laser fluence can be calculated using Equation (1).
F 0 = E 0 A
where F 0 is the laser fluence. E 0 is the single pulse energy. A is the beam area. By adjusting the output power of the laser, the fluence can be controlled, when the laser spot size, speed and frequency rate are fixed. Different laser fluences (4.91 to 11.04 J/cm2) were used to form grid lines.
The parameters of the silver paste used as the donor material for LIFT are shown in Table 1. With a high-viscosity paste of 157 Pa·s at a shear rate of 20 rpm/3 min, the silver paste exhibits non-Newtonian thixotropic fluid with pseudoplastic (viscosity decreases with increasing shear rate until an equilibrium value is reached) and thixotropic (viscosity at a constant shear rate decreases and eventually steadies out to an equilibrium value) behavior. In other words, thixotropy is the thinning of shear force during usage and a rapid rebound to the initial structure after force is no longer applied. Relevant parameters of silver paste were obtained through HAAKE Rheostress 6000 with shear rates from 0.01 to 1000 s−1, at 25 °C. The viscosity curve and flow curve present basic information on paste rheological properties. From the viscosity curve, it can be seen that when fluid is subjected to shear strain, its viscosity decreases with increasing shear rate. From the flow curve, shear stress increases with increasing shear rate, meaning silver paste has the characteristic of shear thinning. The effect of shear thinning is to reduce the flow resistance and friction to improve the fluidity and lubricity of the fluid. The thickness of the paste layer on the donor substrate is 16.9 μm, as shown in Figure 2. As a kind of non-Newtonian fluid, silver paste was stirred for approximately 10–15 min to attain equilibrium viscosity before use. To avoid viscosity changes caused by the evaporation of liquid components from the film, printing should be completed within 10 min after sample preparation. Otherwise, a change in viscosity will seriously affect transfer results.
The monocrystalline silicon wafer was chosen as the acceptor under the silver paste, with an average line roughness of 0.2 μm. The distance between the donor and acceptor could be adjusted from 0 μm to 100 μm. After experiments, to evaporate solvents and bond silver powders, silicon wafers were subsequently dried and sintered at 200 °C and 750 °C separately. The morphology of transferred lines was measured by an optical microscope and laser scanning confocal microscope Olympus LEXT OLS5100 (LSCM).

3. Results

3.1. Characterization

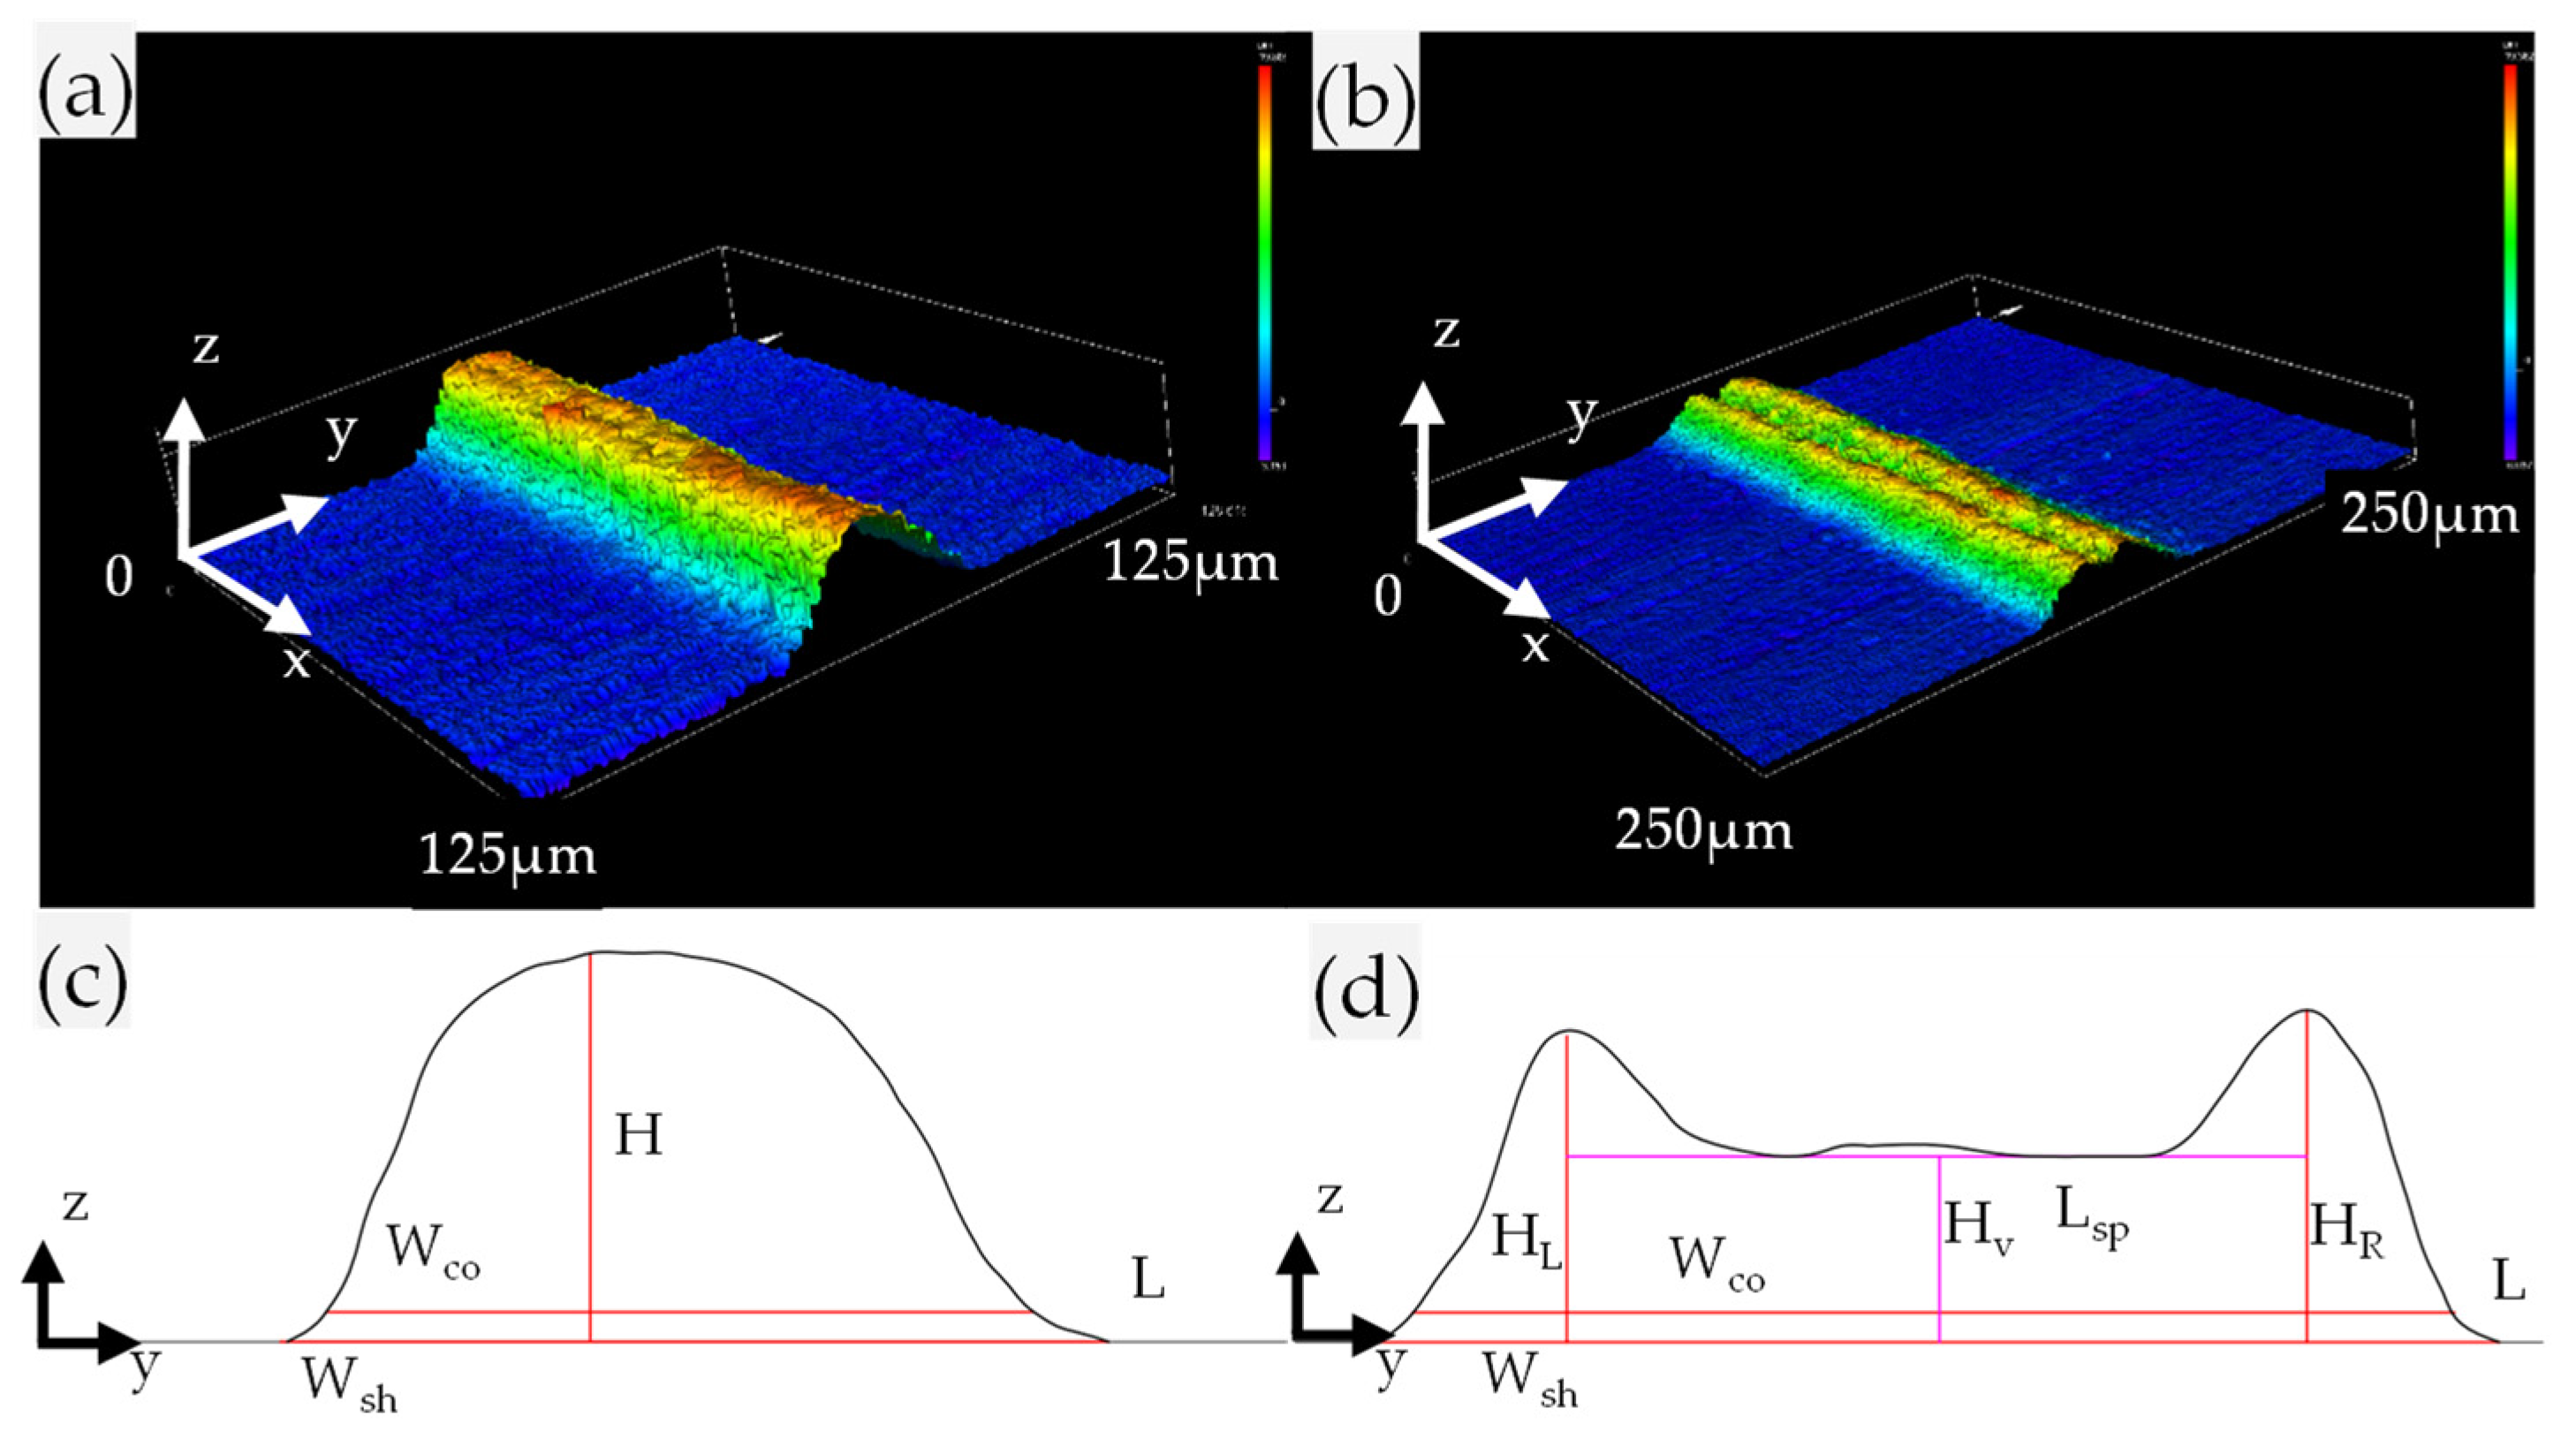
The conductivity of the grid line is greatly affected by its geometry. Therefore, it is very important to evaluate the 3D geometry of contacting grids with sufficient measurement methods and statistical evaluation. With LIFT, two typical morphologies of grid lines were formed, they have a cross section with a single-peak and double-peak, respectively. As shown in Figure 3, to ensure adequate statistical evaluation and repeatability, measurements of each x-axis are averaged to avoid subjective effects and measurement errors from manual measurements. The obtained data are also averaged across the y-axis to determine the wafer datum and avoid pyramidal effects.
Ideally, a grid line with a larger cross-sectional area, a larger height, and a smaller width is needed to maximize the optical and electrical properties of the grid line and increase using the efficiency of silver paste. A representation system was defined to evaluate grid line geometry from the cross-section direction. According to a grid line with single-peak and double-peak, respectively, the average shading line-width, conductivity line-width, line height, cross-sectional area and aspect ratio, valley height, and peak separation of grid lines are defined, as shown in Figure 4 and Table 2.
To separate silver paste drift from the amount of silver paste that contributes to the conductivity of the grid line, average shading width is defined as the length of the line segment at a height of 2 μm from the horizontal baseline (silicon wafer fluctuation ± 2 μm). From Figure 3b and Figure 4a,b, it can be seen that when the relative height difference is 2 μm, there is a coherent grating edge (conductive grid edges). A horizontal baseline with an average length of 50 μm on both sides of the measurement result is selected to eliminate the tilt error of the measurement. The average shading line-width is the intersection of the cross-section curve and horizontal baseline. The conducting line-width is 2 μm above the horizontal baseline. Line height is the maximum distance between the cross-section curve and the horizontal baseline. Line height is also the maximum distance of the left peak between cross-section curve and the horizontal baseline and maximum distance of the right peak between the cross-section curve and the horizontal baseline. Cross-sectional area is the area enclosed by the horizontal baseline and cross-sectional curve. Aspect ratio is the ratio of line height H to conductive line width Wco. Valley height is valley height at the fitted line, distance from the horizontal baseline. Peak separation is the horizontal distance between two highest peaks.

3.2. Effect of Laser Fluence on Cross-Sectional Morphology

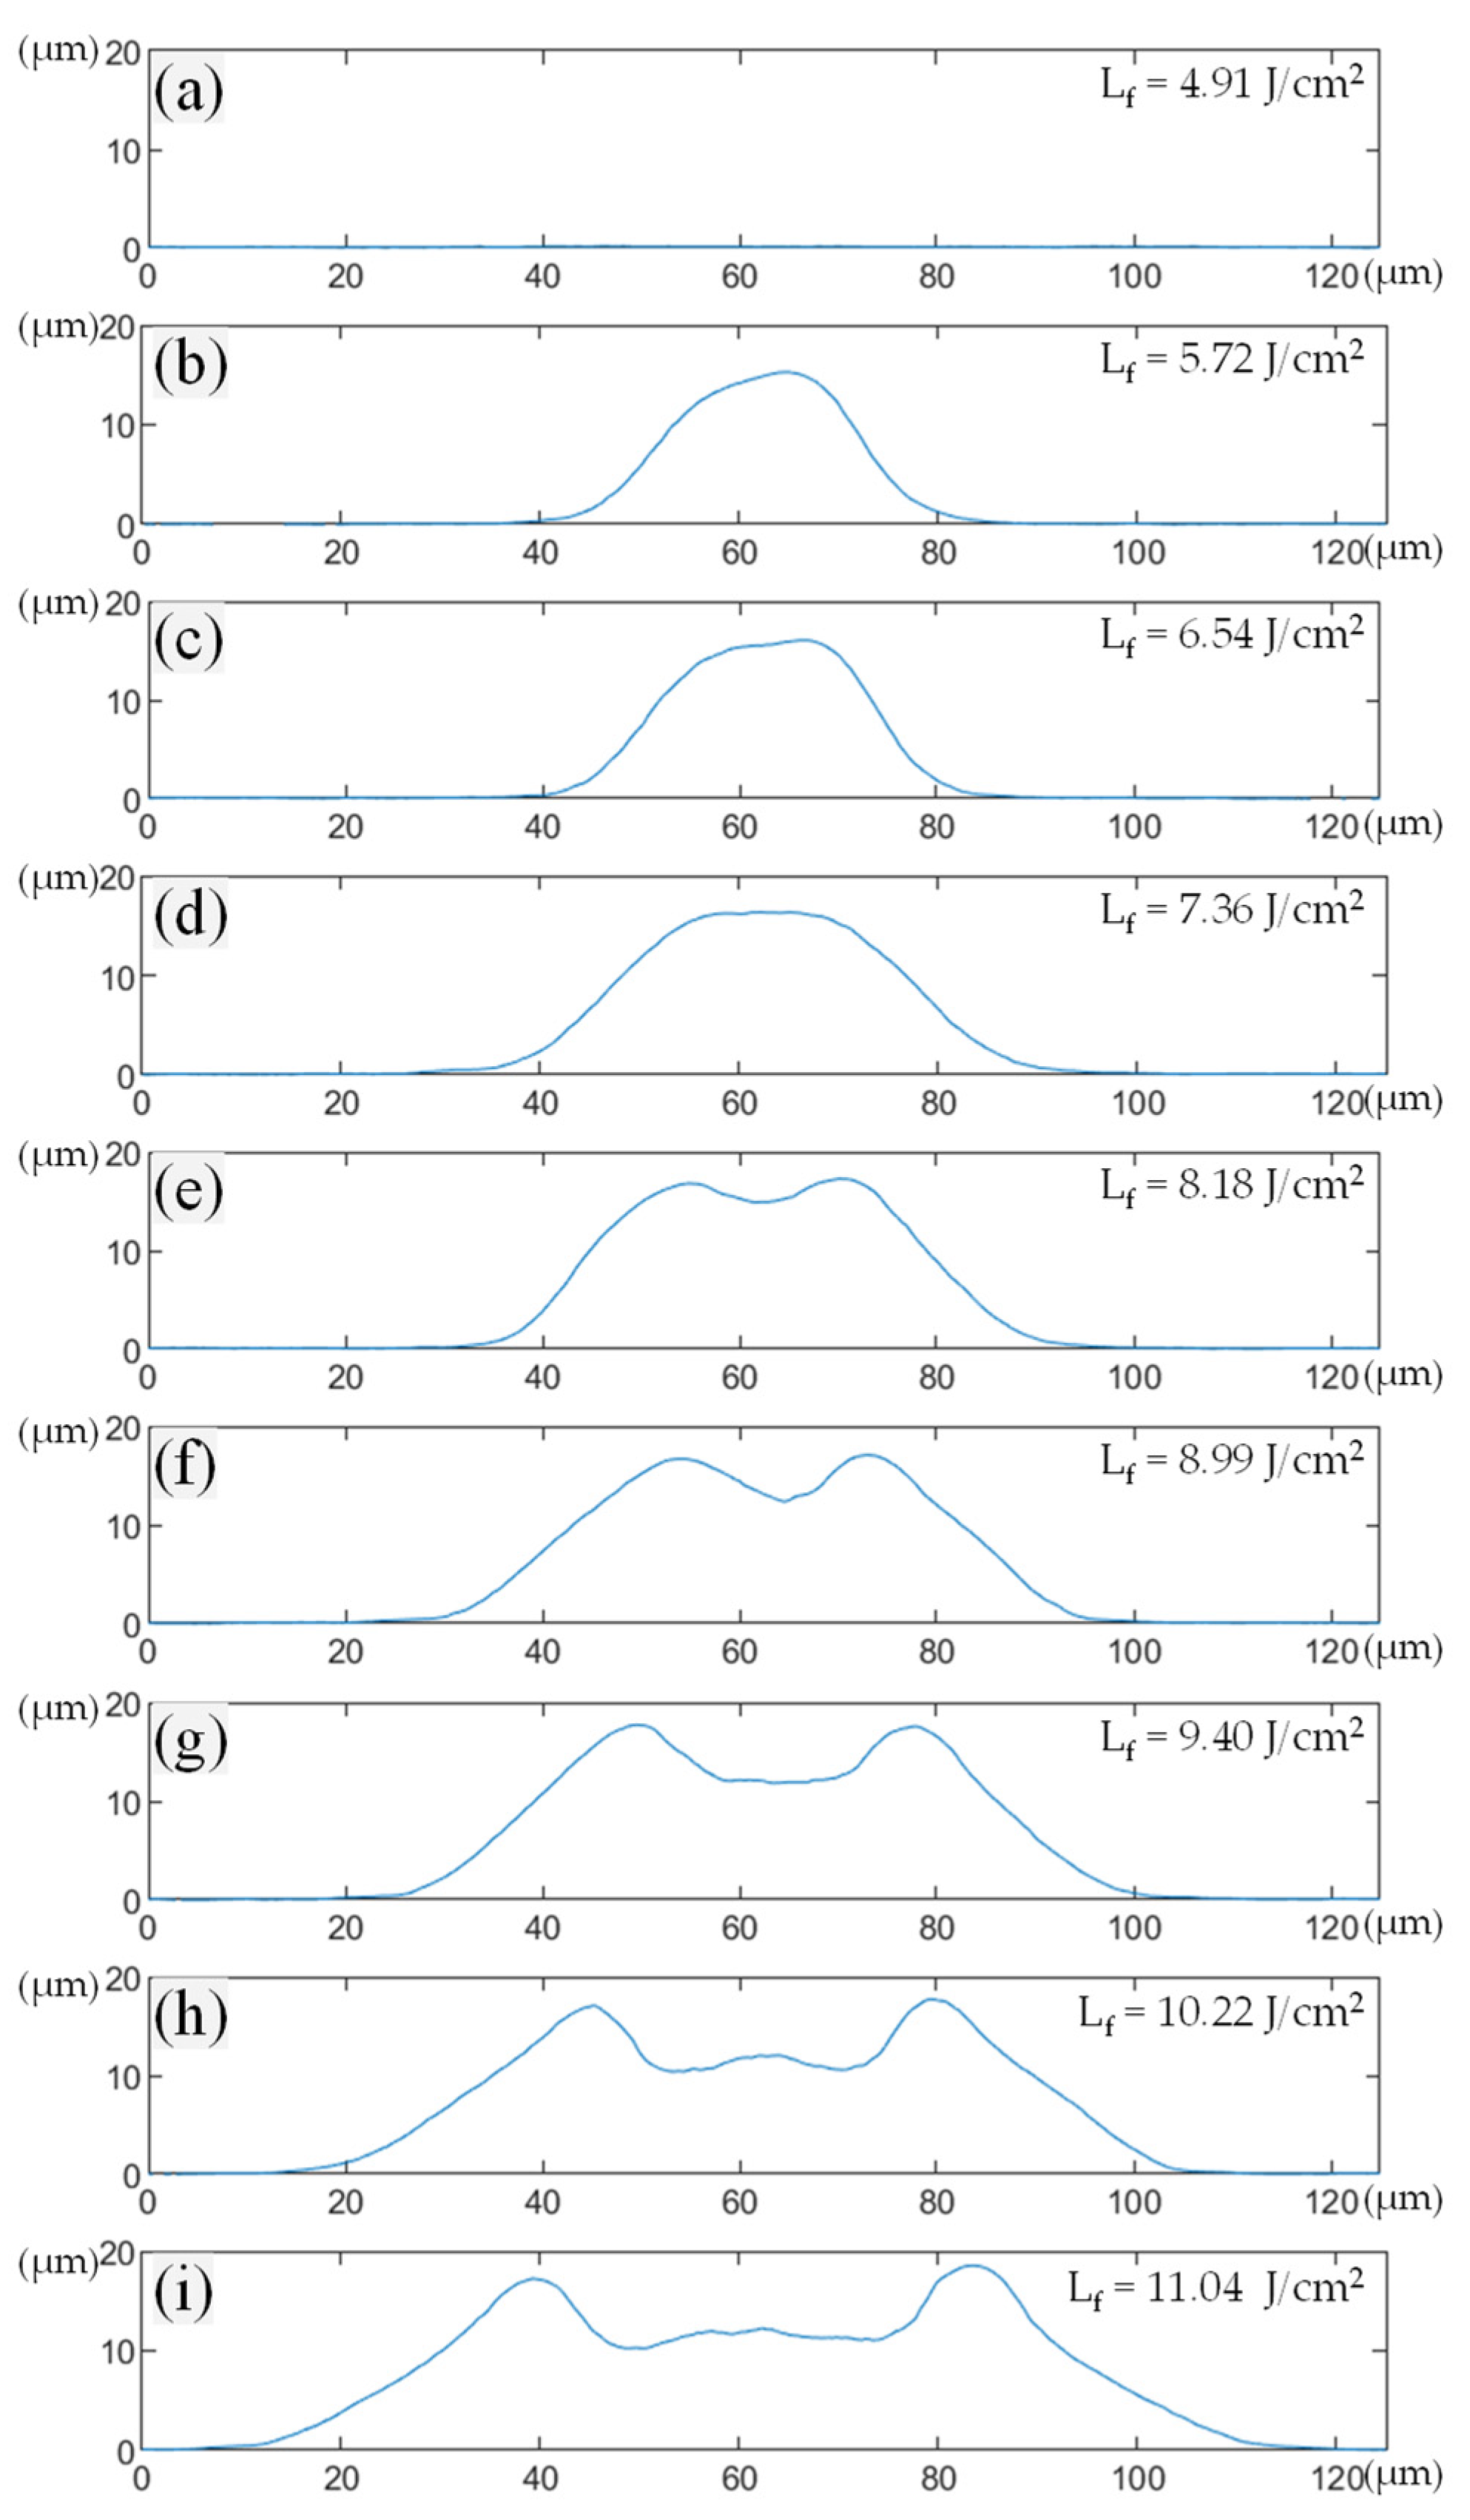
Based on the above experimental system, a variety of grid lines with different morphologies were formed under different laser fluences. After laser irradiation, the donor was removed from the acceptor substrate, leaving transferred lines. Grid line morphology at different laser fluences measured by LSCM is shown in Figure 5. When using the lowest fluence, there is no transfer, as shown in Figure 5a, suggesting the existence of a laser fluence transfer threshold. When laser fluence increases, paste transfer occurs, with wider lines at higher laser fluences. Subgraphs highlighted in the red solid line box are 3D profiles of grid lines with a single-peak, as shown in Figure 5b–d. Subgraphs highlighted in red dotted frames are 3D profiles of grid lines with a double-peak, as shown in Figure 5e–i. There are several grid lines with different morphologies, and only single-peak grid lines exhibit characteristics of a high aspect ratio.
Under different laser fluences, the cross-sectional morphologies of grid lines are significantly different, as shown in Figure 6. With increasing laser fluence, line width increases, and the distance between two peaks also increases. However, no matter the grid line with single-peak or double-peak, the heights of the peaks remain basically the same.
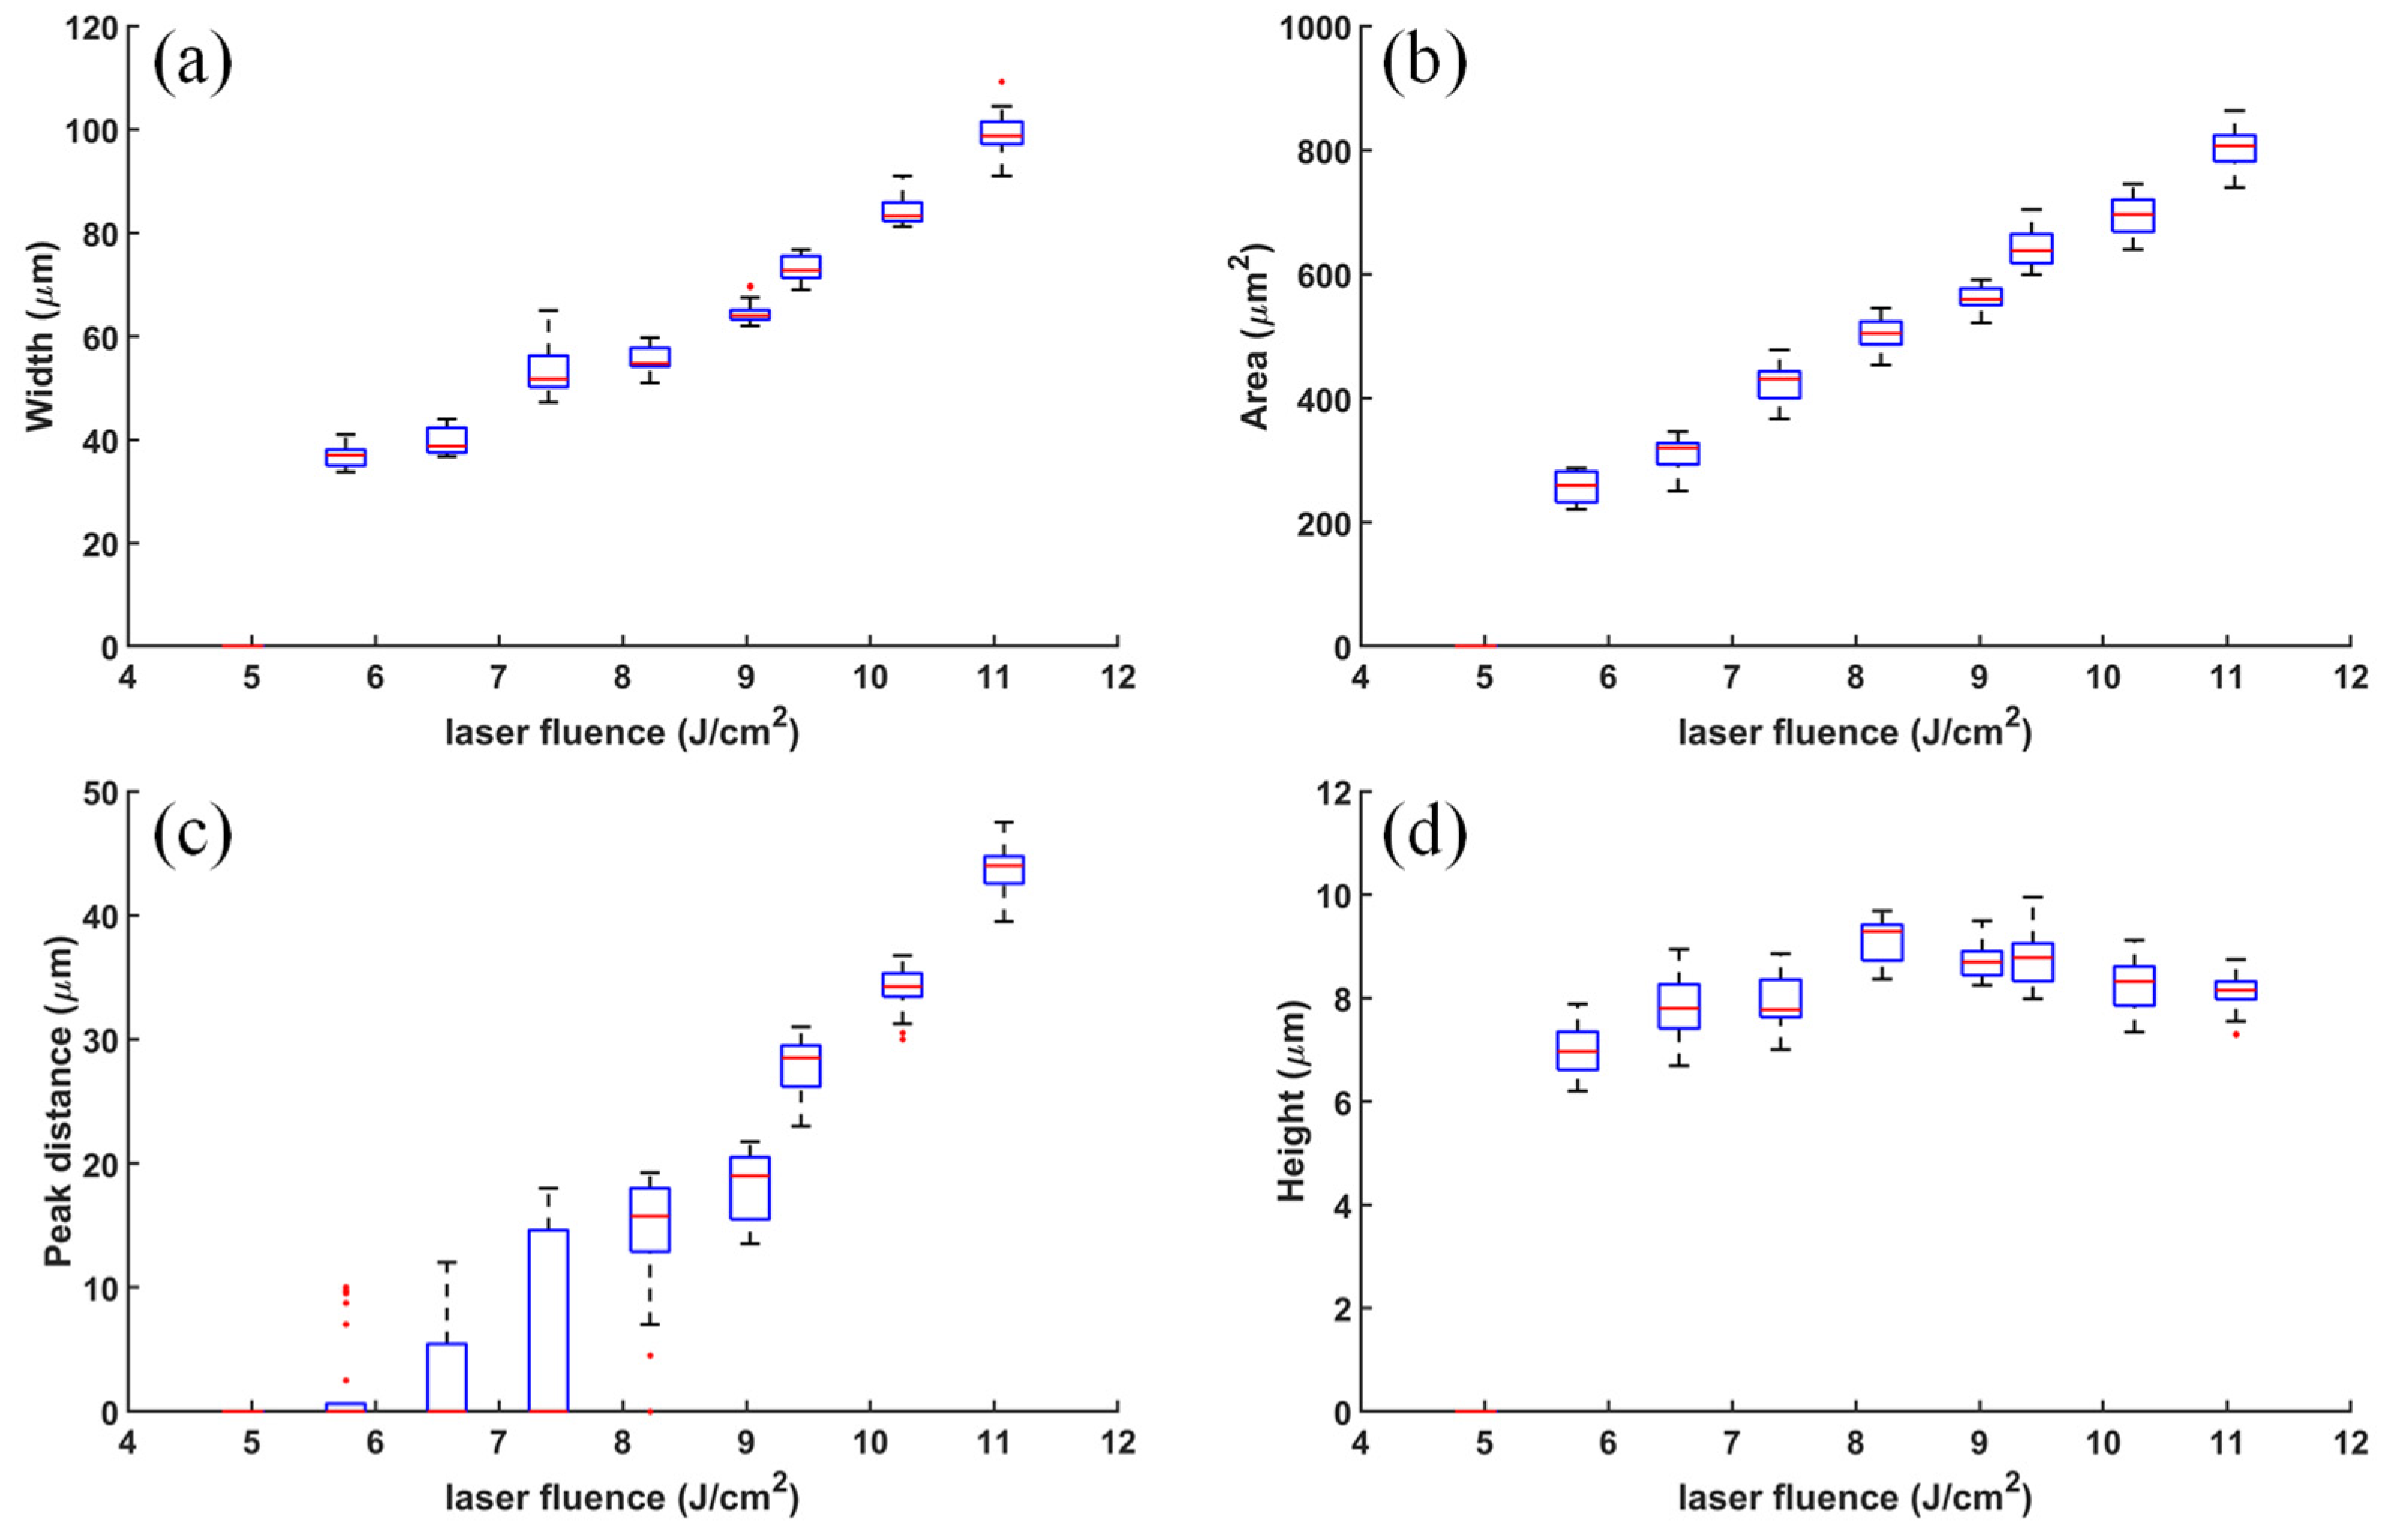
Figure 7 shows the results of transferred lines under different laser fluences. Specifically, the effect of laser fluence on line width, cross-sectional area, distance between two peaks, and line height is studied. Conductive line width, cross-sectional area, and double-peak distance increase with increasing laser fluence, and the increasing trend is essentially approximately linear, as shown in Figure 7a–c and Figure 8. For single-peak lines, the default distance between two peaks is zero. The effect of laser fluence on height of the grid line is also shown in Figure 7d.
With changes in laser fluence, the height of the grid line can be considered basically the same, as shown in Figure 8. Line height is basically consistent with the thickness of the paste layer on the donor substrate (16.9 μm), as shown in Figure 2.
Therefore, it is reasonable to assume that there is only a vertical overall movement of paste at the peak but no horizontal flow during silver paste transfer. Based on the results shown in Figure 8, with increasing laser fluence, the aspect ratio shows a downward trend.

4. Discussion

We assume that the laser fluence is deposited at the interface between the donor substrate and that the silver paste film and the laser-induced plasma is generated. Plasma induces the shock wave propagating inside.
It is noted that the maximum pressure is independent of the pulse duration and is proportional to the square root of the laser fluence density [25]. Therefore, it is reasonable to analyze the evolution of the grid line morphology with the laser fluence.
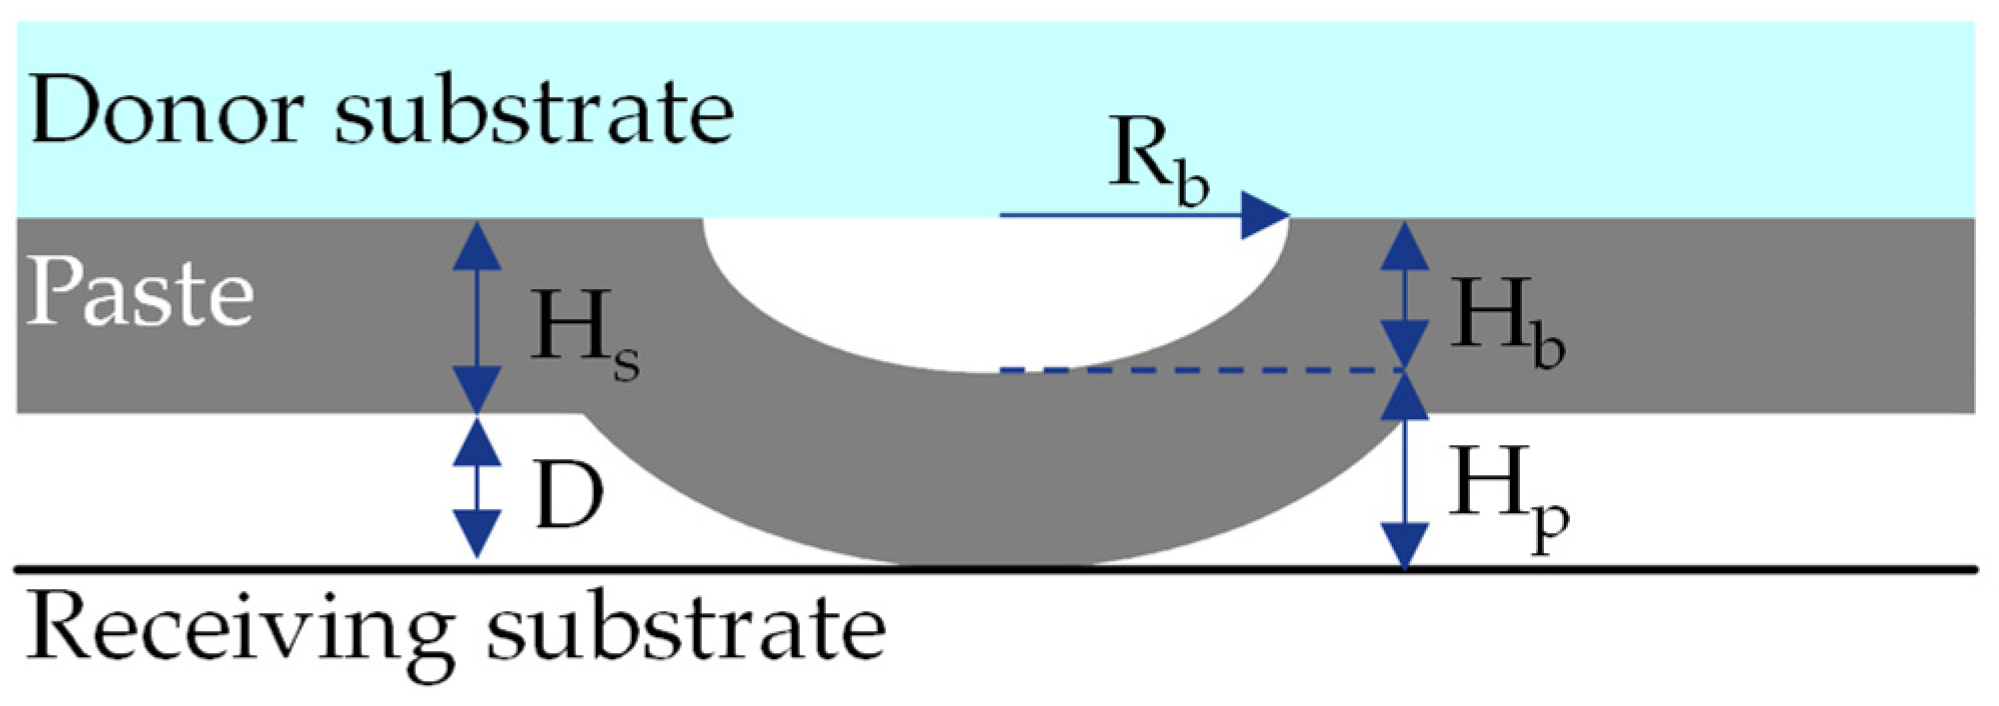
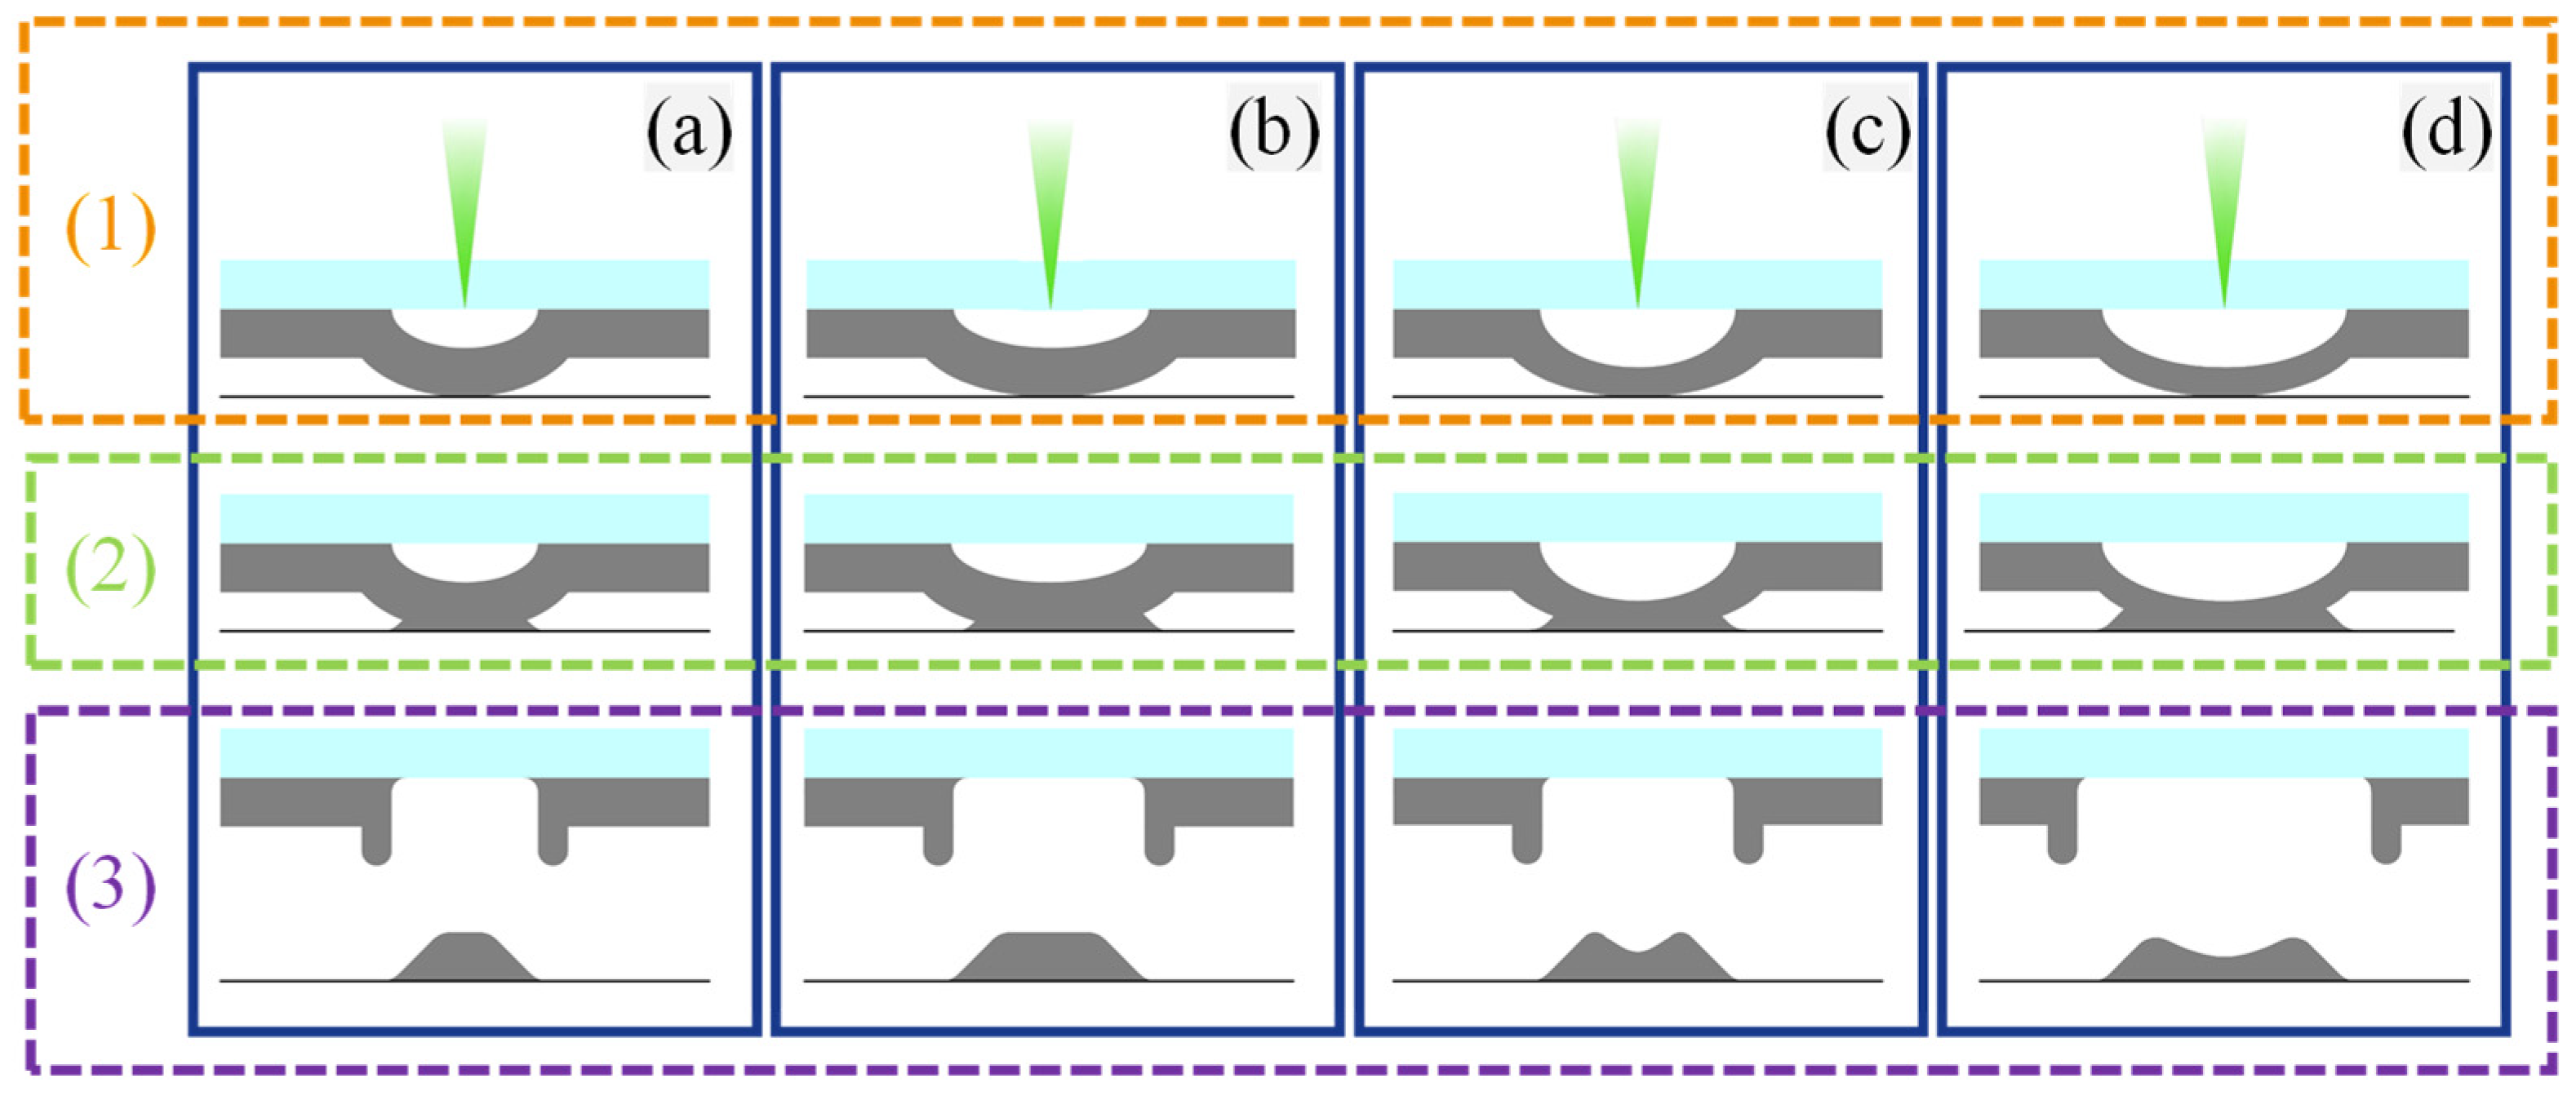
When laser fluence just exceeds the transfer threshold, silver paste flows and bubbles form and develop until they come into contact with the silicon wafer. The silver paste and silicon wafer are separated and the grid line is formed, as shown in Figure 9 and Figure 10. In Figure 9, Hs is the thickness of silver paste, D is the gap between silver paste and receiving substrate, Rb is bubble radius, Hb is bubble expansion height, and Hp is peak height. It is speculated that there is no transverse flow of silver paste when a single-peak appears. When laser fluence is larger, a portion of laser fluence is used to compress silver paste, which flows vertically and develops into peaks and valleys as laser fluence increases. Interaction between adjacent pulses is essentially a diffusion process between high-pressure bubbles and cavities. It usually takes about 20 μs from the expansion of high-pressure bubbles to the formation of cavities. A repetition rate as high as 1000 kHz means that the laser pulse interval is 1 μs and adjacent pulses interact with each other. A cavity is formed in the next laser pulse irradiation and the previous pulse irradiation area. The influence of pulse interaction is reduced by the constraint of a small gap. To summarize, experimental results on transferred lines show that three different regimes can be considered depending on laser fluence: no transfer, single-peak transfer, and double-peak transfer.
Before laser action, paste is almost unstressed and basically in a static state. First, the incident laser pulse is focused on the interface between glass and paste, rapidly heating and evaporating organic components of the silver paste. Molecules or particles in paste are rearranged or oriented under the action of shear force. A high-pressure and high-temperature vapor bubble is formed, as shown in Figure 10(1). There is a corresponding material transfer threshold for a given paste layer thickness. The laser fluence threshold of silver paste is attributed to the balance of internal and external forces. When paste is subjected to shear strain, its viscosity decreases with increasing shear rate. Flow resistance and friction of paste reduce, and both fluidity and lubricity of paste improve, manifested as bubble expansion. Then, due to the small gap, silver paste is pushed by the bubble to contact the receiving silicon wafer and continues to expand due to wettability. However, the bubble remains closed, and its original height is maintained after contacting the receptor, as shown in Figure 10(2). Finally, the paste is no longer stressed and tends to rebound to its initial structure until an external force is broken. Due to the thixotropy of the non-Newtonian fluid of the silver paste, the existing shape is maintained after stabilization. The silver paste at the joint is pulled off by a vertical upward pull, and the grid line is formed after separation, as shown in Figure 10(3).
As shown in Figure 10a, silver paste expands, contacts and infiltrates the receiving substrate, and finally the grid line forms. The vertical direction of the silver paste is not squeezed, so the peak height is the same as the thickness of the silver paste, which means Hp = Hs. As shown in Figure 10b, as laser fluence increases, a larger internal pressure overcomes ambient pressure and surface tension, and the bubble expands to a larger size. Silver paste is still not squeezed in the vertical direction, maintains its original height after contacting the acceptor, and expands horizontally along the substrate, showing an increase in line width. As shown in Figure 10c, with a further increase of laser fluence, the silver paste in the laser-action center is squeezed in the vertical direction, which results in local transverse flow, manifested as a decrease in the thickness in the middle position, that is, the valley between two peaks. However, the bubble size does not change much, and contact with the receiving substrate is not affected, and the original line width is still maintained. As laser fluence further increases, bubble size increases, and the contact area of the substrate increases too, extrusion becomes more obvious, and line width becomes bigger. With further increases in laser fluence, the transverse flow area becomes larger, showing a larger peak spacing, as shown in Figure 10d.

5. Conclusions

In this work, laser-induced forward transfer (LIFT) of high-viscosity silver paste was studied using a picosecond pulsed laser. Continuous grid lines with a high aspect ratio were formed, and 3D morphologies were measured by LSCM. It was found that there were two typical morphologies of grid lines: single-peak cross-section and double-peak cross-section. In order to better characterize the obtained grid lines for two typical morphologies, parameters such as shielding line width, effective line width, area, and height of the grid line were proposed and defined. The transfer mechanism was proposed, and the influence of laser fluence on paste flow was analyzed. Transfer modes according to the two typical morphologies were observed and defined. For single-peak transfer mode, when laser fluence just exceeds the transfer threshold, silver paste flows, then the bubble generates and develops until it makes contact with the silicon wafer and separates from the donor film, then forming a single-peak grid line. When laser fluence is relatively large, part of the laser fluence is used for silver paste compression and vertical flow. It develops into a peak valley as laser fluence increases, which results in a double-peak transfer mode. Research on the forming process could be a guide for future studies on morphology control in the forming process of grid lines and its application in solar cells.

Author Contributions

Conceptualization, Y.Y., C.T., Y.Z., S.L., X.H. and G.Y.; methodology, Y.Y., C.T., Y.Z., S.L., X.H. and G.Y.; software, Y.Y.; validation, S.L. and G.Y.; formal analysis, Y.Y.; investigation, Y.Y., C.T., Y.Z. and S.L.; resources, C.T.; data curation, Y.Y., C.T. and Y.Z.; writing original draft, Y.Y.; writing—review & editing, Y.Y. and S.L.; visualization, Y.Y.; supervision, S.L., X.H. and G.Y.; project administration, S.L. and G.Y.; funding acquisition, S.L. and G.Y. All authors have read and agreed to the published version of the manuscript.

Funding

This research was funded by High-Level Innovation Research Institute Program of Guangdong Province, grant number No. 2020 B0909010003 and Research Project of Guangdong Aerospace Research Academy, grant number GARA2022001000.

Institutional Review Board Statement

Not applicable.

Informed Consent Statement

Not applicable.

Data Availability Statement

The data presented in this study are available upon reasonable request.

Conflicts of Interest

The authors declare no conflict of interest.

References

  1. Rehman, Z.U.; Yang, F.; Wang, M.; Zhu, T. Fundamentals and Advances in Laser-Induced Transfer. Opt. Laser Technol. 2023, 160, 109065. [Google Scholar] [CrossRef]
  2. del Campo, A.; Arzt, E. Fabrication Approaches for Generating Complex Micro- and Nanopatterns on Polymeric Surfaces. Chem. Rev. 2008, 108, 911–945. [Google Scholar] [CrossRef] [PubMed]
  3. Zhang, Y.; Liu, C.; Whalley, D. Direct-Write Techniques for Maskless Production of Microelectronics: A Review of Current State-of-the-Art Technologies. In Proceedings of the 2009 International Conference on Electronic Packaging Technology & High Density Packaging, Beijing, China, 10–13 August 2009; pp. 497–503. [Google Scholar]
  4. Vaezi, M.; Seitz, H.; Yang, S. A review on 3D micro-additive manufacturing technologies. Int. J. Adv. Manuf. Technol. 2013, 67, 1721–1754. [Google Scholar] [CrossRef]
  5. Florian, C.; Caballero-Lucas, F.; Fernández-Pradas, J.; Artigas, R.; Ogier, S.; Karnakis, D.; Serra, P. Conductive silver ink printing through the laser-induced forward transfer technique. Appl. Surf. Sci. 2015, 336, 304–308. [Google Scholar] [CrossRef]
  6. Mathews, S.A.; Charipar, N.A.; Auyeung, R.C.Y.; Kim, H.; Piqué, A. Laser Forward Transfer of Solder Paste for Microelectronics Fabrication. In Proceedings of the Photonics West—Lasers and Applications in Science and Engineering, San Francisco, CA, USA, 7–12 February 2015. [Google Scholar]
  7. Breckenfeld, E.; Kim, H.; Auyeung, R.; Charipar, N.; Serra, P.; Piqué, A. Laser-induced forward transfer of silver nanopaste for microwave interconnects. Appl. Surf. Sci. 2015, 331, 254–261. [Google Scholar] [CrossRef]
  8. Acciari, G.; Adamo, G.; Ala, G.; Busacca, A.; Caruso, M.; Giglia, G.; Imburgia, A.; Livreri, P.; Miceli, R.; Parisi, A.; et al. Experimental Investigation on the Performances of Innovative PV Vertical Structures. Photonics 2019, 6, 86. [Google Scholar] [CrossRef] [Green Version]
  9. Hörteis, M.; Glunz, S. Fine line printed silicon solar cells exceeding 20% efficiency. Prog. Photovolt. Res. Appl. 2008, 16, 555–560. [Google Scholar] [CrossRef]
  10. Gizachew, Y.; Escoubas, L.; Simon, J.; Pasquinelli, M.; Loiret, J.; Leguen, P.; Jimeno, J.; Martin, J.; Apraiz, A.; Aguerre, J. Towards ink-jet printed fine line front side metallization of crystalline silicon solar cells. Sol. Energy Mater. Sol. Cells 2011, 95, S70–S82. [Google Scholar] [CrossRef]
  11. Li, Q.; Grojo, D.; Alloncle, A.-P.; Chichkov, B.; Delaporte, P. Digital laser micro- and nanoprinting. Nanophotonics 2019, 8, 27–44. [Google Scholar] [CrossRef]
  12. Pospischil, M.; Kuchler, M.; Klawitter, M.; Lacmago, I.; Tepner, S.; Efinger, R.; Linse, M.; Witt, D.; Gutscher, S.; Brand, A.; et al. High Speed Dispensing—A High-Throughput Metallization Technology for >21% PERC Type Solar Cells. In Proceedings of the 32nd European Photovoltaic Solar Energy Conference and Exhibition, Munich, Germany, 20–24 June 2016; pp. 403–406. [Google Scholar] [CrossRef]
  13. Pospischil, M.; Riebe, T.; Jimenez, A.; Kuchler, M.; Tepner, S.; Geipel, T.; Ourinson, D.; Fellmeth, T.; Breitenbücher, M.; Buck, T.; et al. Applications of parallel dispensing in PV metallization. AIP Conf. Proc. 2019, 2156, 020005. [Google Scholar] [CrossRef]
  14. Morales, M.; Chen, Y.; Muñoz, D.; Lauzurica, S.; Molpeceres, C. High volume transfer of high viscosity silver pastes using laser direct-write processing for screen printing of c-Si cells. In Proceedings of the Laser-based Micro- and Nanoprocessing IX, San Francisco, CA, USA, 1 March 2015; Volume 9351, p. 93510B. [Google Scholar] [CrossRef]
  15. Strauch, T.; Demant, M.; Lorenz, A.; Haunschild, J.; Rein, S. Two Image Processing Tools to Analyse Alkaline Texture and Contact Finger Geometry in Microscope Images. In Proceedings of the 29th European Photovoltaic Solar Energy Conference and Exhibition, Amsterdam, The Netherlands, 23–25 September 2014; pp. 1132–1137. [Google Scholar] [CrossRef]
  16. Zhang, Y.; Tian, C.; Yu, Y.; He, X.; Bian, Y.; Li, S.; Yu, G. Morphological Characteristics and Printing Mechanisms of Grid Lines by Laser-Induced Forward Transfer. Metals 2022, 12, 2090. [Google Scholar] [CrossRef]
  17. Munoz-Martin, D.; Brasz, C.; Chen, Y.; Morales, M.; Arnold, C.; Molpeceres, C. Laser-induced forward transfer of high-viscosity silver pastes. Appl. Surf. Sci. 2016, 366, 389–396. [Google Scholar] [CrossRef]
  18. Chen, Y.; Munoz-Martin, D.; Morales, M.; Molpeceres, C.; Sánchez-Cortezon, E.; Murillo-Gutierrez, J. Laser Induced Forward Transfer of High Viscosity Silver Paste for New Metallization Methods in Photovoltaic and Flexible Electronics Industry. Phys. Procedia 2016, 83, 204–210. [Google Scholar] [CrossRef] [Green Version]
  19. Sopeña, P.; Fernández-Pradas, J.; Serra, P. Laser-induced forward transfer of conductive screen-printing inks. Appl. Surf. Sci. 2020, 507, 145047. [Google Scholar] [CrossRef]
  20. Munoz-Martin, D.; Chen, Y.; Morales, M.; Molpeceres, C. Overlapping Limitations for ps-Pulsed LIFT Printing of High Viscosity Metallic Pastes. Metals 2020, 10, 168. [Google Scholar] [CrossRef] [Green Version]
  21. Unger, C.; Gruene, M.; Koch, L.; Koch, J.; Chichkov, B. Time-resolved imaging of hydrogel printing via laser-induced forward transfer. Appl. Phys. A 2011, 103, 271–277. [Google Scholar] [CrossRef]
  22. Sanchez-Aniorte, M.I.; Mouhamadou, B.; Alloncle, A.P.; Sarnet, T.; Delaporte, P. Laser-induced forward transfer for improving fine-line metallization in photovoltaic applications. Appl. Phys. Mater. Sci. Process. 2016, 122, 595. [Google Scholar] [CrossRef]
  23. Lossen, J.; Matusovsky, M.; Noy, A.; Maier, C.; Bähr, M. Pattern Transfer Printing (PTPTM) for c-Si Solar Cell Metallization. Energy Procedia 2015, 67, 156–162. [Google Scholar] [CrossRef]
  24. Adrian, A.; Rudolph, D.; Willenbacher, N.; Lossen, J. Finger Metallization Using Pattern Transfer Printing Technology for c-Si Solar Cell. IEEE J. Photovolt. 2020, 10, 1290–1298. [Google Scholar] [CrossRef]
  25. Fabbro, R.; Fournier, J.; Ballard, P.; Devaux, D.; Virmont, J. Physical study of laser-produced plasma in confined geometry. J. Appl. Phys. 1990, 68, 775–784. [Google Scholar] [CrossRef]
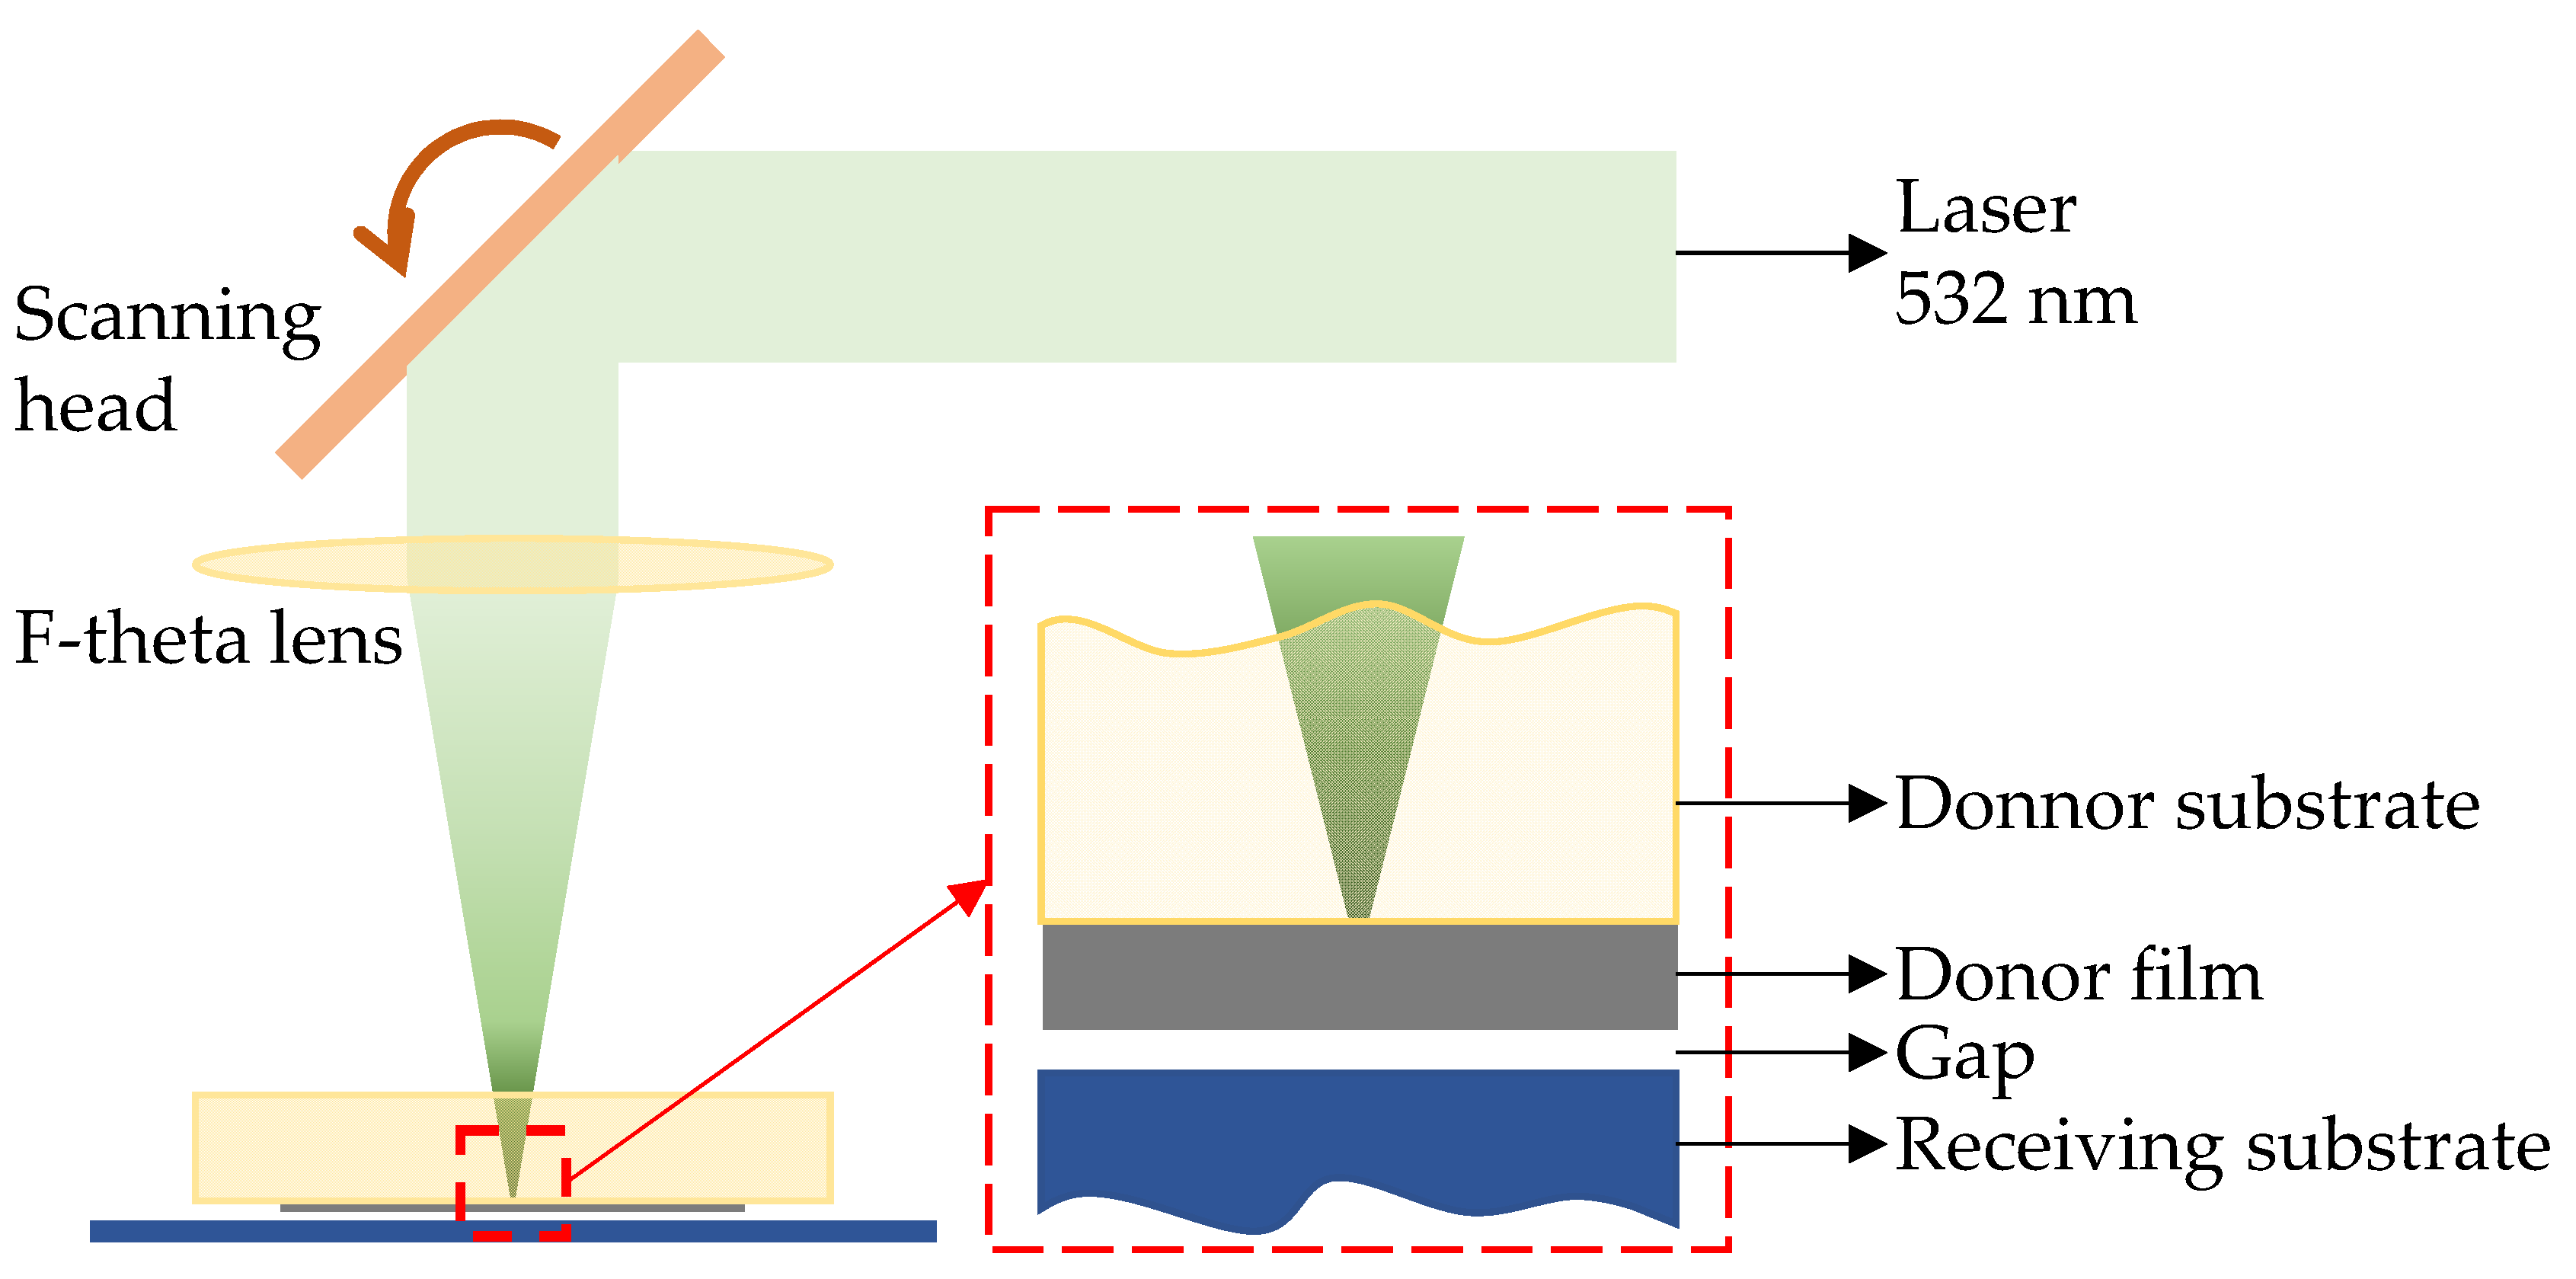
Figure 1. LIFT schematic diagram.
Photonics 10 00717 g001
Figure 2. Thickness of paste layer on the donor substrate measured by laser scanning confocal microscope.
Photonics 10 00717 g002
Figure 3. (a) The 3D geometry of the grid line measured by Laser Scanning Confocal Microscope; (b) Top view contour map of grid line measured by Laser Scanning Confocal Microscope.
Photonics 10 00717 g003
Figure 4. Morphology of grid lines with single-peak (a), and double-peak (b); Parameters defined for grid lines with single-peak (c), and double-peak (d).
Photonics 10 00717 g004
Figure 5. Grid line morphology at different laser fluences measured by LSCM, from (ai), with the increase of the laser fluence.
Photonics 10 00717 g005
Figure 6. Contour of cross-sectional morphologies, from (ai), with the increase of the laser fluence.
Photonics 10 00717 g006
Figure 7. (a) The effect of laser fluence on width; (b) The effect of laser fluence on cross-sectional area; (c) The effect of laser fluence on distance between two peaks; (d) The effect of laser fluence on height.
Photonics 10 00717 g007
Figure 8. Effect of the laser fluence on aspect ratio of the grid line.
Photonics 10 00717 g008
Figure 9. Bubble generation by laser induced.
Photonics 10 00717 g009
Figure 10. Forming process of line with single-peak (a,b), line with double-peak (c,d). (1) Silver paste foams and expands under pressure. (2) Silver paste contacts the receptor substrate and remains closed. (3) An external force causes the bubble to rupture and separate from the receptor substrate.
Photonics 10 00717 g010
Table 1. Sliver paste properties.
PropertiesValue
Solid content91.68 wt%
Particle size<3~5 μm
Viscosity157 pa·s(20 rpm/3 min)
Table 2. Morphologies of grid lines with single-peak and double-peak.
MorphologiesSingle-PeakDouble-Peak
Horizontal baselineLL
Average shading line-widthWshWsh
Conducting line-widthWcoWco
Line heightHHL; HR
Cross-sectional areaAcrsctAcrsct
Aspect ratioARAR
Valley height/Hv
Peak separation/Lsp
Disclaimer/Publisher’s Note: The statements, opinions and data contained in all publications are solely those of the individual author(s) and contributor(s) and not of MDPI and/or the editor(s). MDPI and/or the editor(s) disclaim responsibility for any injury to people or property resulting from any ideas, methods, instructions or products referred to in the content.