Communication

SNR Model of Optical Fiber Acoustic Sensing System Based on F-P Structure

1
Laboratory of Optoelectronics and Sensor (OES Lab), School of Science, Hubei University of Technology, Wuhan 430068, China
2
School of Science, Hubei University of Technology, Wuhan 430068, China
3
AOV Energy LLC, Wuhan 430068, China
*
Authors to whom correspondence should be addressed.
Photonics 2023, 10(6), 676; https://doi.org/10.3390/photonics10060676
Submission received: 29 April 2023 / Revised: 7 June 2023 / Accepted: 9 June 2023 / Published: 11 June 2023
(This article belongs to the Topic Fiber Optic Communication)

Abstract

:
The signal-to-noise ratio (SNR) is a crucial parameter for assessing audio transmission quality and fiber optic acoustic sensors. This study presents a model for predicting the SNR of a fiber optic F-P acoustic sensing system using the Fabry–Perot (F-P) cavity length modulation principle, considering noise and line loss in the optical path. To validate the model, we constructed an F-P acoustic sensor system and measured the SNR in a semi-anechoic room. Additionally, we used MATLAB to simulate the SNR model and compared the results with experimental data. The model accurately predicted the SNR of the fiber optic F-P acoustic sensor system. Our results offer valuable guidance and theoretical support for optimizing system performance.

1. Introduction

Compared to traditional electronic acoustic sensors, fiber optic acoustic sensors are better suited for environments with strong electromagnetic interference and flammable/explosive conditions due to their passive nature and anti-electromagnetic interference capabilities. A variety of fiber optic acoustic sensor technologies have been proposed in recent years, which can be classified as distributed and quasi-distributed sensing according to different sensor configurations. Distributed acoustic sensors (DAS) utilize Rayleigh backscattering (RBS) to detect the acoustic wave along the fiber optic [1]. Fiber optic Fabry–Perot acoustic sensors are often used as quasi-distributed sensors [2], as they have a small size, simple structure, and high sensitivity, and the probe is passive, making them ideal for audio signal detection in special situations. The F-P sensor plays a key role in fiber optic acoustic sensing technology applications, such as petroleum exploration and medical ultrasonic detection.
The research based on fiber optic F-P acoustic sensors has made significant progress. For instance, the work of Yu et al. [3,4] focused on studying the F-P acoustic sensor system’s ability to detect weak acoustic waves of partial discharge, analyzing its measurement sensitivity, and demonstrating the passive and high-frequency response of the fiber optic acoustic sensor. Similarly, Akkaya, Jo et al. [5,6] investigated F-P acoustic sensors utilizing a photonic crystal film as the acoustic-sensitive film, analyzing its displacement sensitivity, and proposing an electromechanical model for the sensor. Recently, Zhang et al. [7] proposed a four-wavelength demodulation technology for F-P acoustic sensors, resulting in a higher noise ratio in the demodulated signal. These studies primarily focused on sensor and algorithm design and the front-end and back-end research in the sensing system but rarely discussed the sensing link and its signal-to-noise ratio.
The signal-to-noise ratio is a crucial performance metric for acoustic transmission systems [8,9]. The algorithm demodulation of the fiber optic F-P acoustic sensor system is based on the optimization of the acoustic signal output by the system. The acoustic signal is mainly affected by the sensing link and devices, thus forming the foundation of the optimization of the demodulation algorithm. Additionally, when building a fiber optic sensor system, the impact of device parameters on the signal-to-noise ratio is often not clear, leading to higher selection costs. Predicting the output signal-to-noise ratio level during the selection stage can greatly reduce costs and facilitate the development of a high-cost performance fiber optic F-P acoustic sensor system.
Therefore, this study analyzed the noise of the optical path components, considered the path loss, and proposed a signal-to-noise ratio model for a fiber optic acoustic sensor system based on the F-P cavity structure. This model can quantify the system components and directly predict the signal-to-noise ratio, providing theoretical support and optimization directions for the study of fiber optic F-P sensor systems. Starting from the cavity length modulation principle of the F-P cavity, this paper addresses the influence of various factors on the signal-to-noise ratio, providing valuable insights for future research in this field.

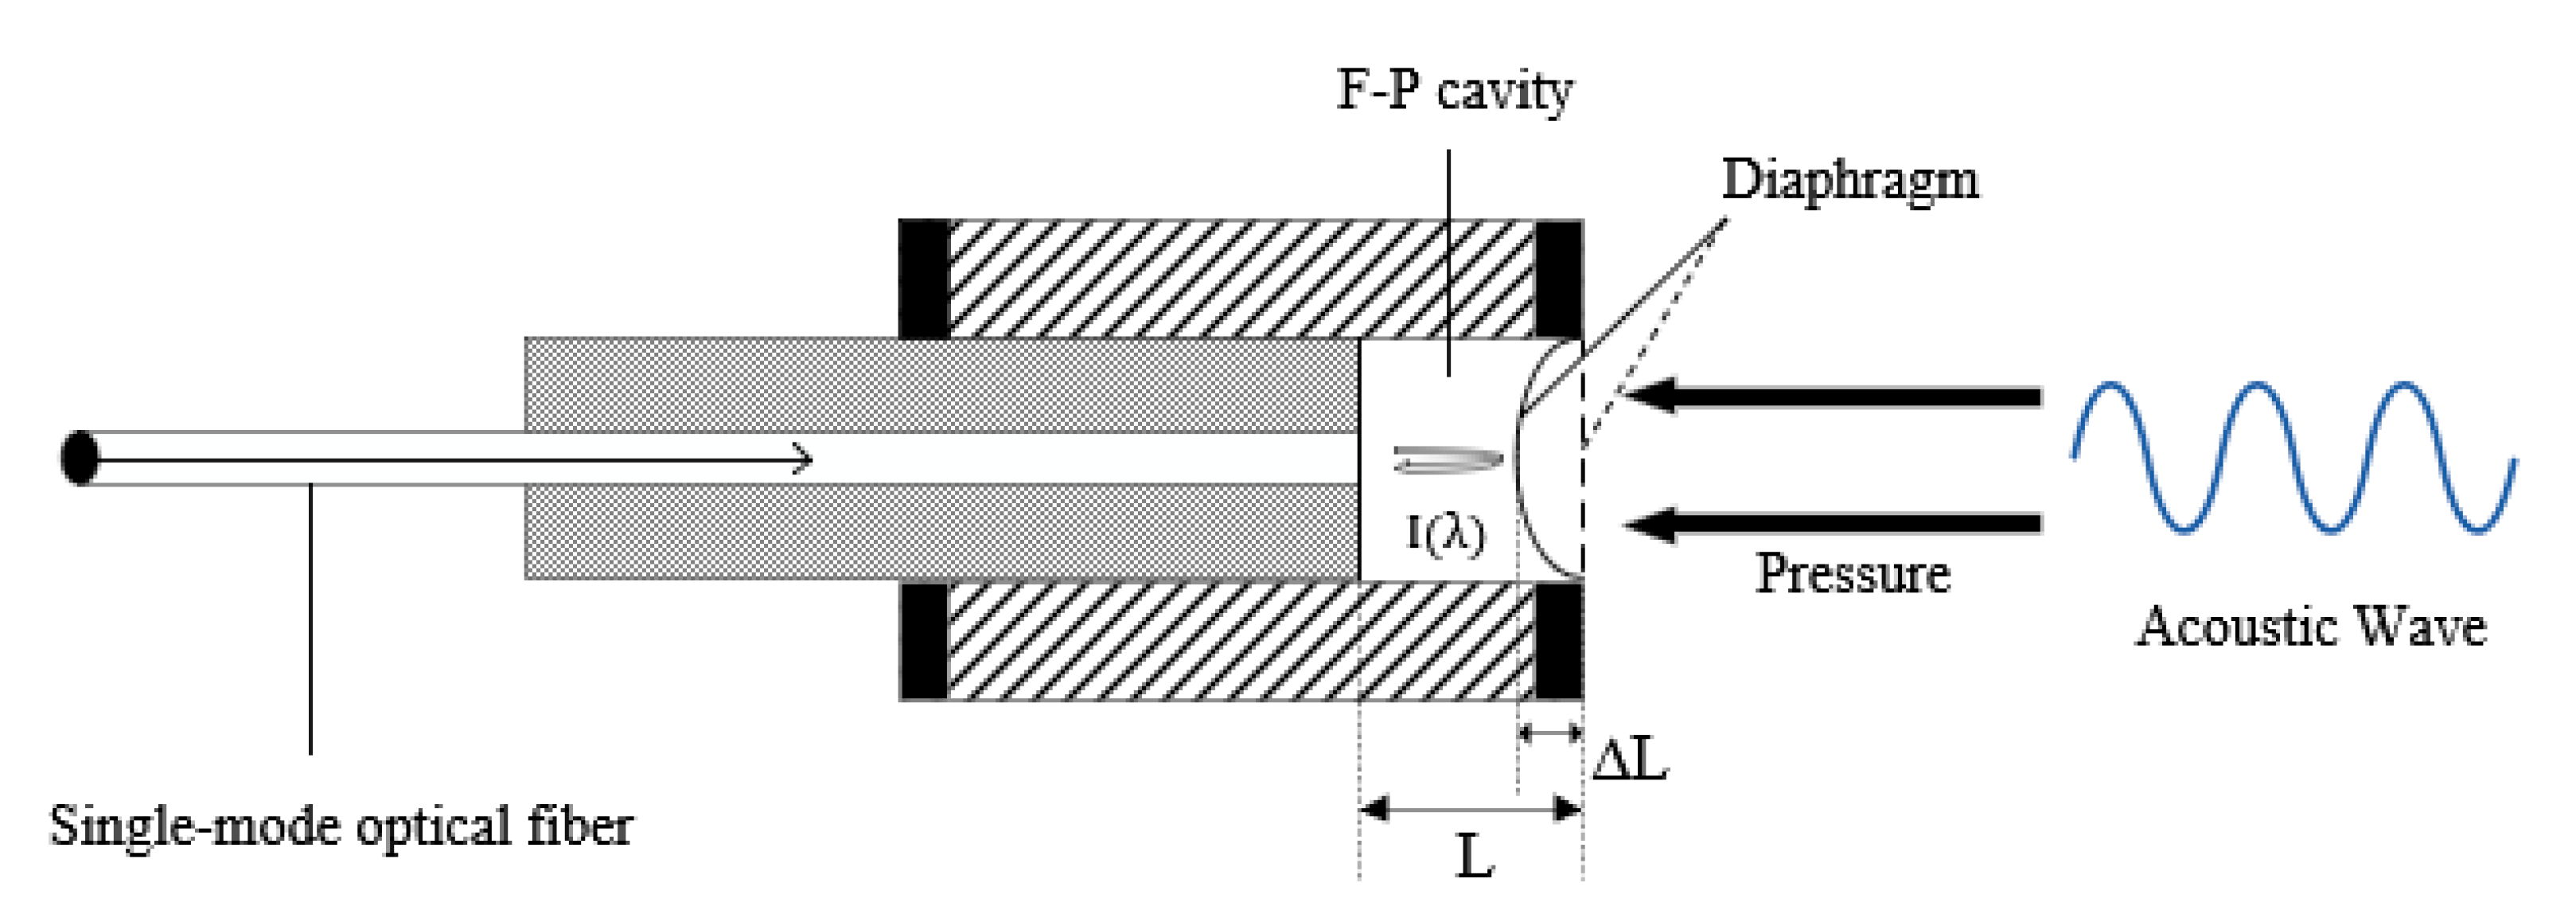
2. Theoretical Analysis

The fiber optic F-P acoustic sensing system (shown in Figure 1) uses an ASE laser emitting 1550 nm light that travels through a circulator to reach the F-P acoustic sensor. When acoustic vibration displaces the acoustic-sensitive membrane at one end of the F-P cavity, the cavity length between the end face of the optical fiber in the F-P cavity and the membrane is modulated. This modulation is converted into an optical signal, which is then detected by a photodetector and demodulated to restore the sound signal. The laser, photodetector, F-P acoustic sensor, and optical fiber line in the acoustic sensing system collectively affect the sound transmission. However, the F-P cavity’s sound transmission structure is the core of the system, directly affecting signal reception and modulation.
Figure 2 shows the schematic diagram of the fiber optic acoutisc sensor based on the F-P structure. When there is no sound wave pressure, the sound-sensitive film remains still, and the length of the cavity remains unchanged. The light beam undergoes multiple reflections and transmissions within the F-P cavity, which ultimately produces interference fringes on the spectrum. However, high-order reflections result in significant energy loss and the end faces have low reflection coefficients; thus, the intensity of high-order reflections can be neglected. Consequently, the interference model in the F-P cavity can be approximated as a two-beam interference model [10]:
I λ = I 1 + I 2 + 2 I 1 I 2 cos 4 π L λ
where I λ is the interference light intensity reflected to the end face of the fiber, I 1 is the reflection light intensity of the fiber end face, I 2 is the reflection light intensity of the sound-sensitive film, and L is the length of the cavity. Differentiating the above equation considering the cavity length yields [10]:
Δ I λ = 8 π I 1 I 2 λ sin 4 π L λ Δ L
Equations (1) and (2) show that the deformation of the film caused by the sound wave causes a change in cavity length Δ L , which modulates the output interference signal.

3. Signal-to-Noise Ratio Model

The signal-to-noise ratio (SNR) is a crucial metric for measuring audio quality in audio-related systems. In an acoustic sensor system, SNR is defined as the ratio of the output sensitivity under a 1 kHz sinusoidal output to the A-weighted noise in the audio frequency [11]. Based on the structural characteristics and sound sensing mechanism of the F-P cavity discussed in the previous section, it is evident that the diaphragm sensitivity (measured in nm/Pa) of the sound-sensitive film directly impacts the degree of cavity length change. Furthermore, diaphragm sensitivity is also an essential parameter for measuring the fiber optic F-P sensor. By substituting the diaphragm sensitivity into the SNR equation, we can obtain:
S N R = 20 log 10 S a c o N E D
The diaphragm sensitivity of the sound-sensitive film in the F-P cavity is denoted by S a c o , and NED is the equivalent noise displacement, which represents the film displacement equivalent to the system’s output noise. NED can be calculated based on the optical line and optical noise, where the noise of the optical path can be expressed as the current signal after photodiode conversion. Therefore, the current signal-to-noise ratio can be obtained after photodiode conversion:
S N R P D = i s 2 i s h o t 2 + i R I N 2 = i s 2 2 q i s B + 1 2 10 R I N 10 i s 2 B
Here, i s = η · P P D represents the electrical signal obtained by converting the optical signal reflected by the F-P cavity into an electrical signal. η is the sensitivity of the photodiode (PD), while P P D represents the optical power entering the PD. The path loss of P P D = 10 P A S E L 10 mW is mainly caused by the fiber optic F-P acoustic sensor, photoelectric converter, and optical path loss. The effective reflectivity of the light is related to the optical path loss, and it is affected by the film material, manufacturing process, and packaging process of the F-P cavity probe. i s h o t 2 is the shot noise current generated by the random noise caused by the impact of photocarriers on the PD. i R I N 2 is the relative intensity noise (RIN) current of the light source.
Assuming the diaphragm displacement is d , the signal-to-noise ratio produced by the diaphragm deformation can be expressed as follows:
S N R d = S N R P D · 2 d λ 2
Based on the concept of equivalent noise, when the signal and noise are equal, the signal can be equivalent to the noise output, so that S N R d = 1 can be deduced from NED as:
N E D = λ 2 S N R P D
By combining Equations (3)–(5), the signal-to-noise ratio can be expressed as:
S N R = 20 log 10 2 · i s · S a c o λ 2 q i s B + 1 2 10 R I N 10 i s 2 B

4. Experimental Results and Discussion

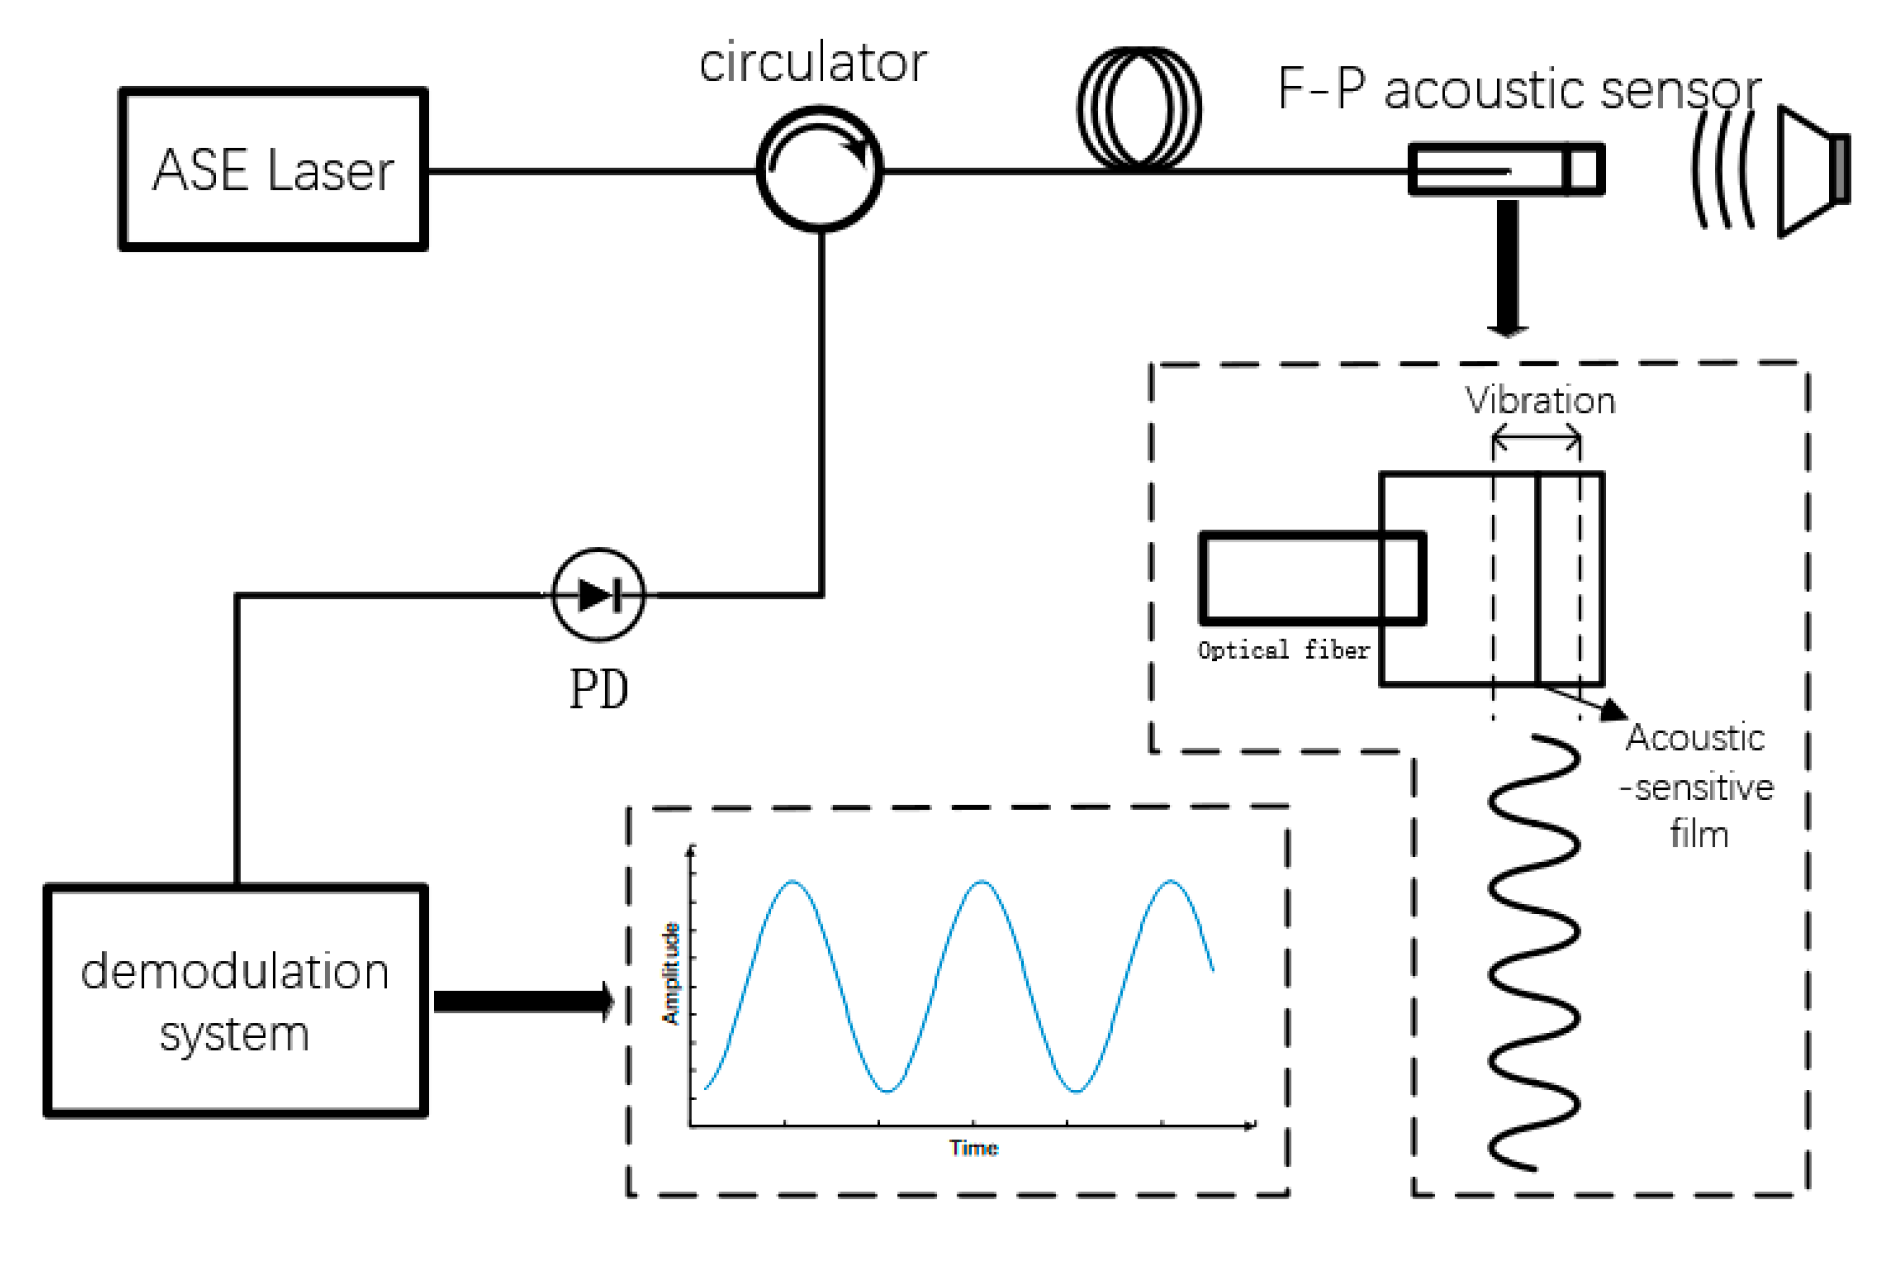
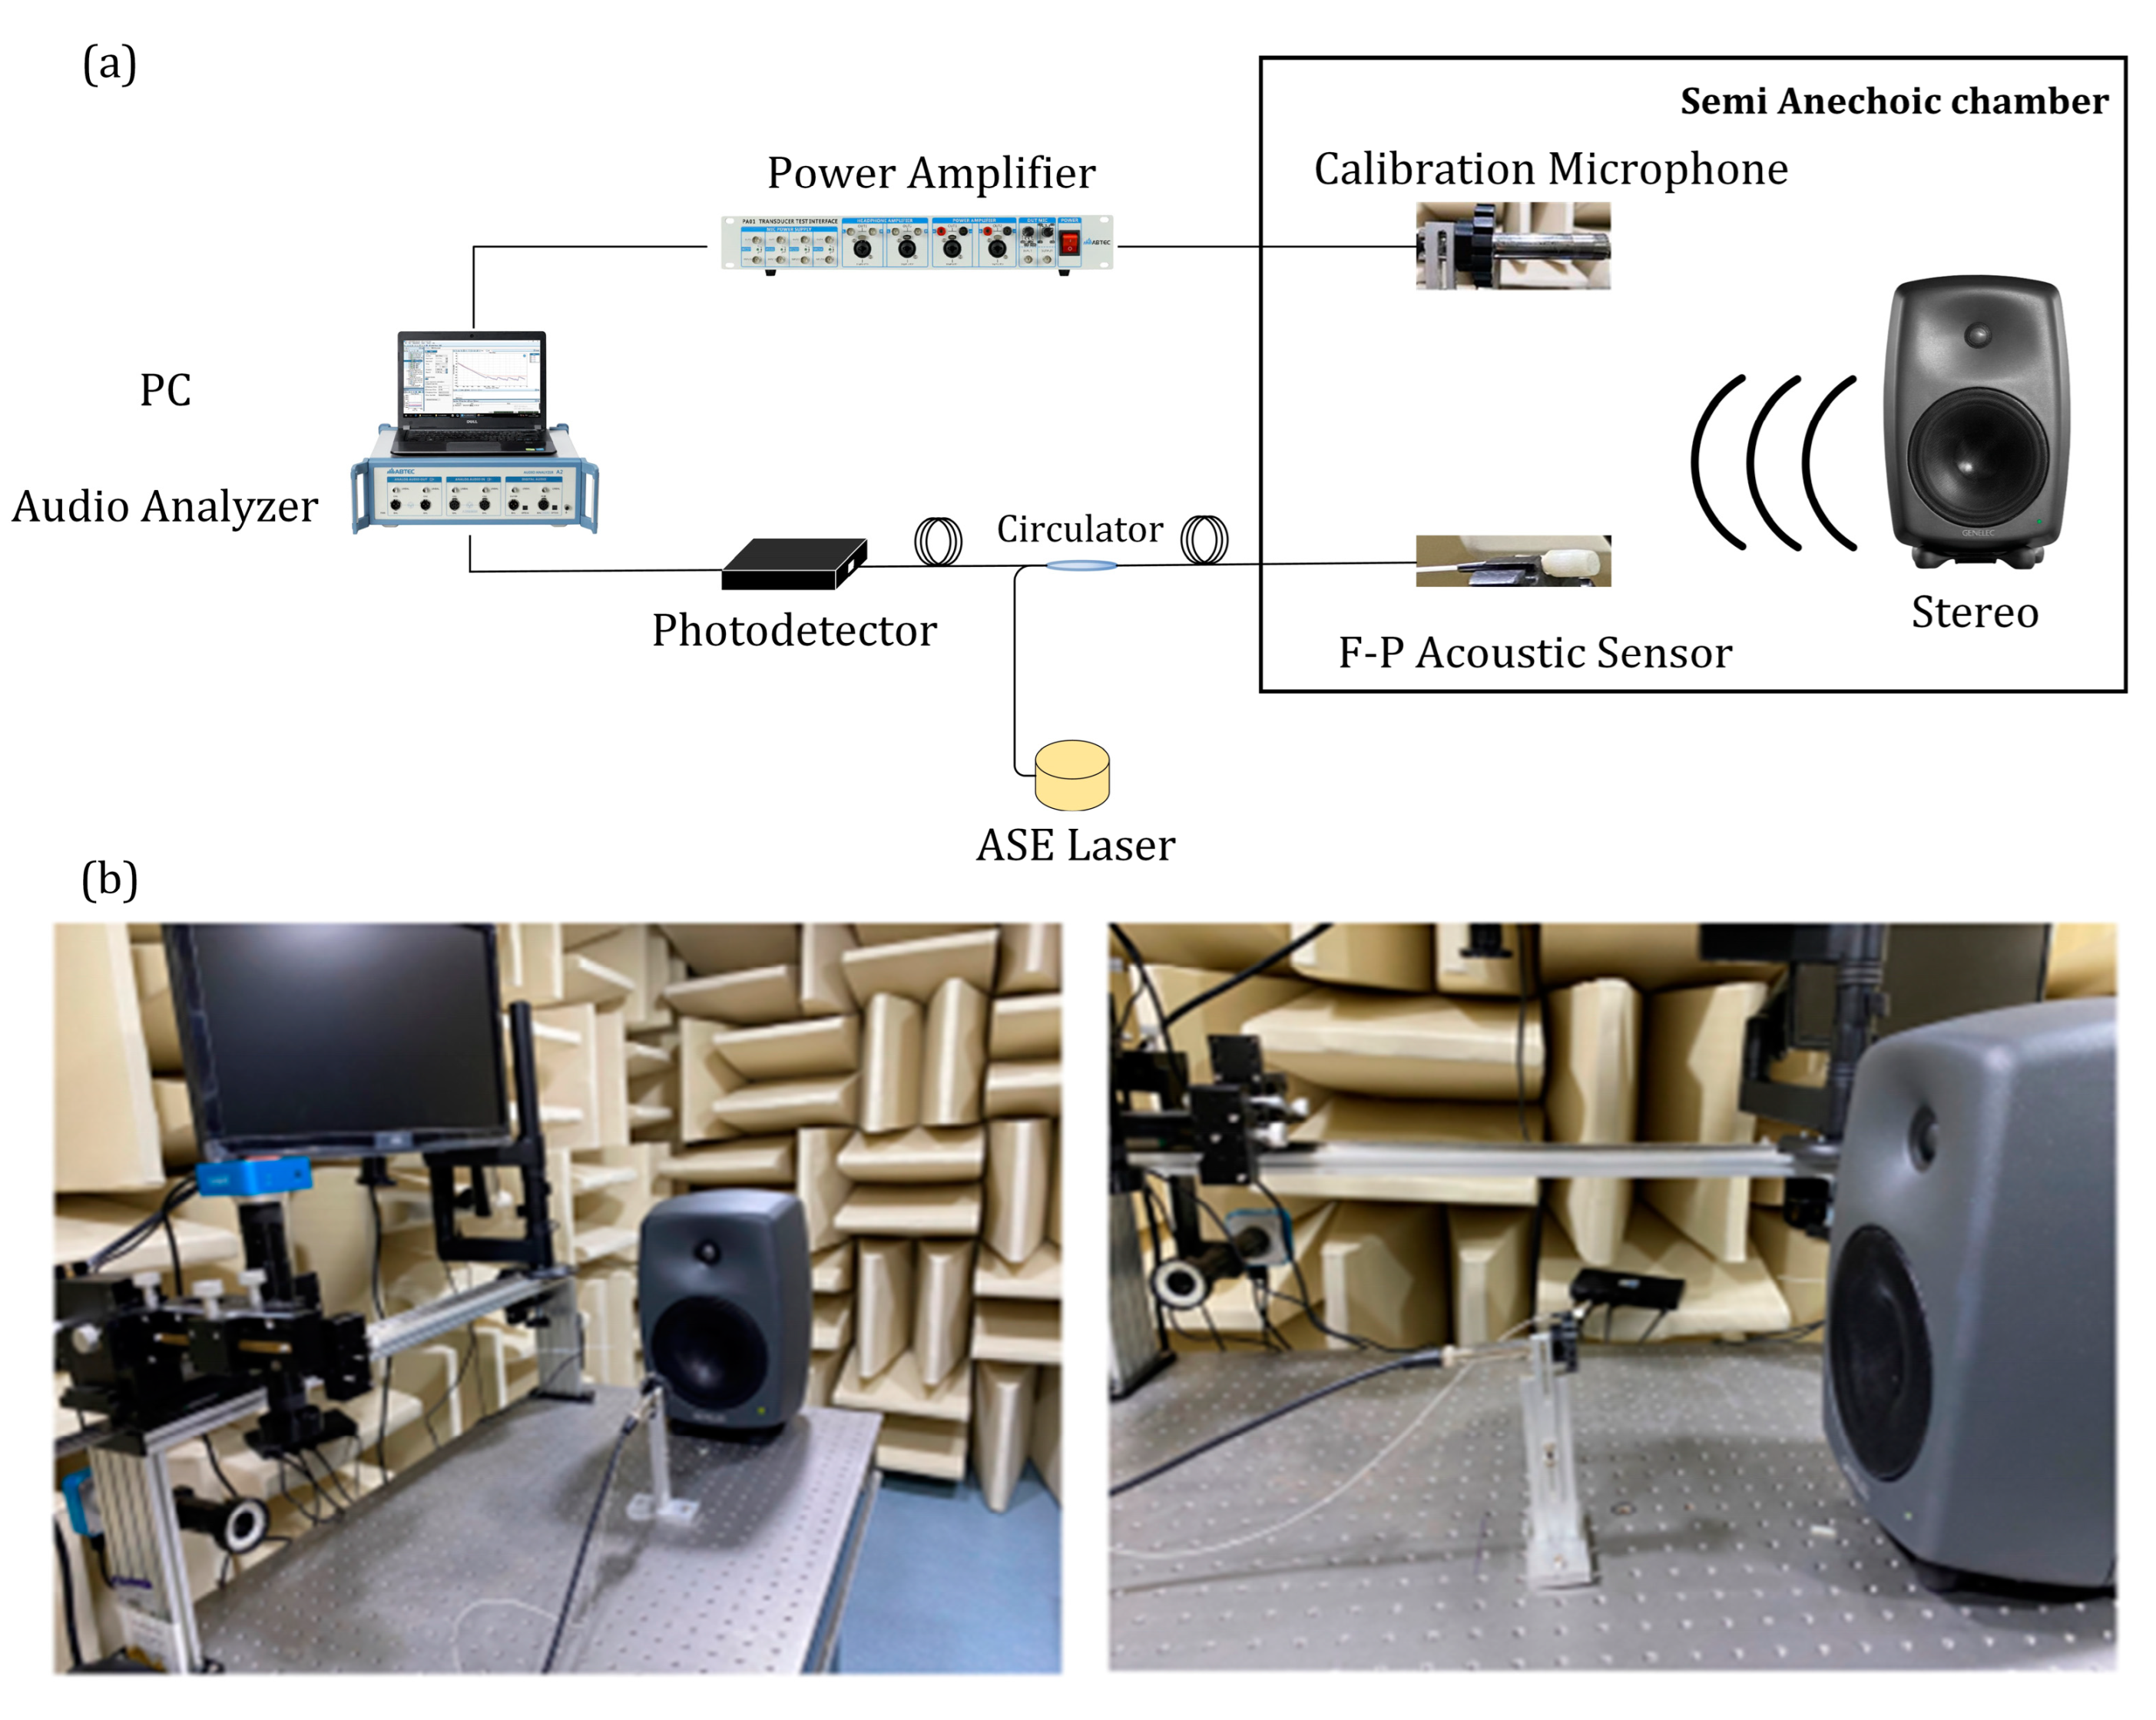
4.1. Experiments Setup

In Figure 3, a schematic diagram of the experimental setup for the fiber optic F-P acoustic sensing system is presented. Acoustic testing requires a strict anechoic environment [11] to ensure accurate signal-to-noise ratio measurements. To avoid external noise interference, the experiment was conducted in a semi-anechoic chamber (ABTEC, 15 dB), with the speakers (GENELEC, SAM8040), acoustic transducers, and standard electrical microphones (ABTEC, AX-MIX 01) placed inside. The sound field emitted by the speaker was hemispherical, and the fiber optic F-P acoustic sensor was placed at the same distance from the speaker as the standard electrical microphone. Both were symmetrical along the speaker’s central axis to ensure consistent sound pressure measurements. The signal-to-noise ratio experimental test system consisted of an ASE wide-spectrum light source, a circulator, a photoelectric converter, and a fiber optic F-P acoustic sensor. The light emitted by the light source entered the fiber optic F-P acoustic sensor through the circulator. After the acoustic wave was modulated by the sensor, the returned interference light was converted into an electrical signal by the photoelectric converter and connected to the audio analyzer for measurement and analysis.
In acoustic testing, a sine standard signal of 1 kHz is usually used. To measure the signal-to-noise ratio, first the signal generator (SG) that controls the stereo is turned on. Next, the output voltage of the system is recorded at different sound pressures, and the acoustic response sensitivity S v o l is obtained within the linear range. Then, the SG is turned off, the system’s noise voltage output V n is recorded, and finally, the values are substituted into the following equation to obtain the signal-to-noise ratio:
S N R = 20 log 10 S v o l V n
From Equation (7), it is known that different optical powers lead to different system signal-to-noise ratio outputs for a fixed device. The optical power was adjusted during the test to facilitate comparison with the model simulation results.
Figure 4 depicts the output voltage of the fiber optic F-P acoustic sensing system at 11 different laser powers, compared to a standard electrical microphone with a sensitivity of 45 mV/Pa. When increasing the sound pressure, if the voltage no longer increases or even decreases, it indicates that the system output is out of the linear range and this part of the output should not be taken into account. It is evident that as the input optical power increased, the acoustic response sensitivity S v o l also increased. However, the linear range became smaller at high optical powers. Figure 5 shows the output voltage of the sensing system when there is no sound, which can be considered as the inherent noise V n of the system. Increasing the optical power also led to an increase in scattered noise, which increased the overall system noise [12]. After substitution into Equation (8), the obtained signal-to-noise ratio was compared with the model simulation results in Figure 6.
The acoustic response sensitivity was also used to determine the membrane sensitivity of the fiber optic F-P acoustic sensor. The fiber optic F-P acoustic sensor used here approximates a double-beam interferometer. In this case, the measured acoustic response sensitivity can be expressed by the following equation [4,13]:
S v o l = · I 0 · S · S a c o
where is the responsivity of the photoelectric converter, I 0 is the optical power of the light source entering the photoelectric converter at the operating point, S a c o is the membrane sensitivity that changes under the influence of sound pressure, and S is the normalized intensity change generated by membrane vibration [13], which can be expressed as:
S = d I / I 0 d L = 2 R 1 R 2 4 π λ
In the acoustic test system, the sensor used in this paper is a MEMS silica diagram, a 1.9 × 1.9 mm square diaphragm with a film thickness of 400 nm and a 5-ring sensitization structure. R 1 = 2.1 % is the reflectance of the fiber end and R 2 = 5.9 % is the reflectance of the membrane; the responsivity of the photoelectric converter is = 8.4 × 10 5   V / W , and the path loss from the light source to the photoelectric converter is 17 dB. The membrane sensitivity calculated from the acoustic response sensitivity under different light source power outputs is shown in Table 1.
Taking the average of 11 sets of membrane sensitivity values, the actual membrane sensitivity of the fiber optic F-P acoustic sensor probe was determined to be 246.6553 nm/Pa. This result represents the actual performance of the sensor.

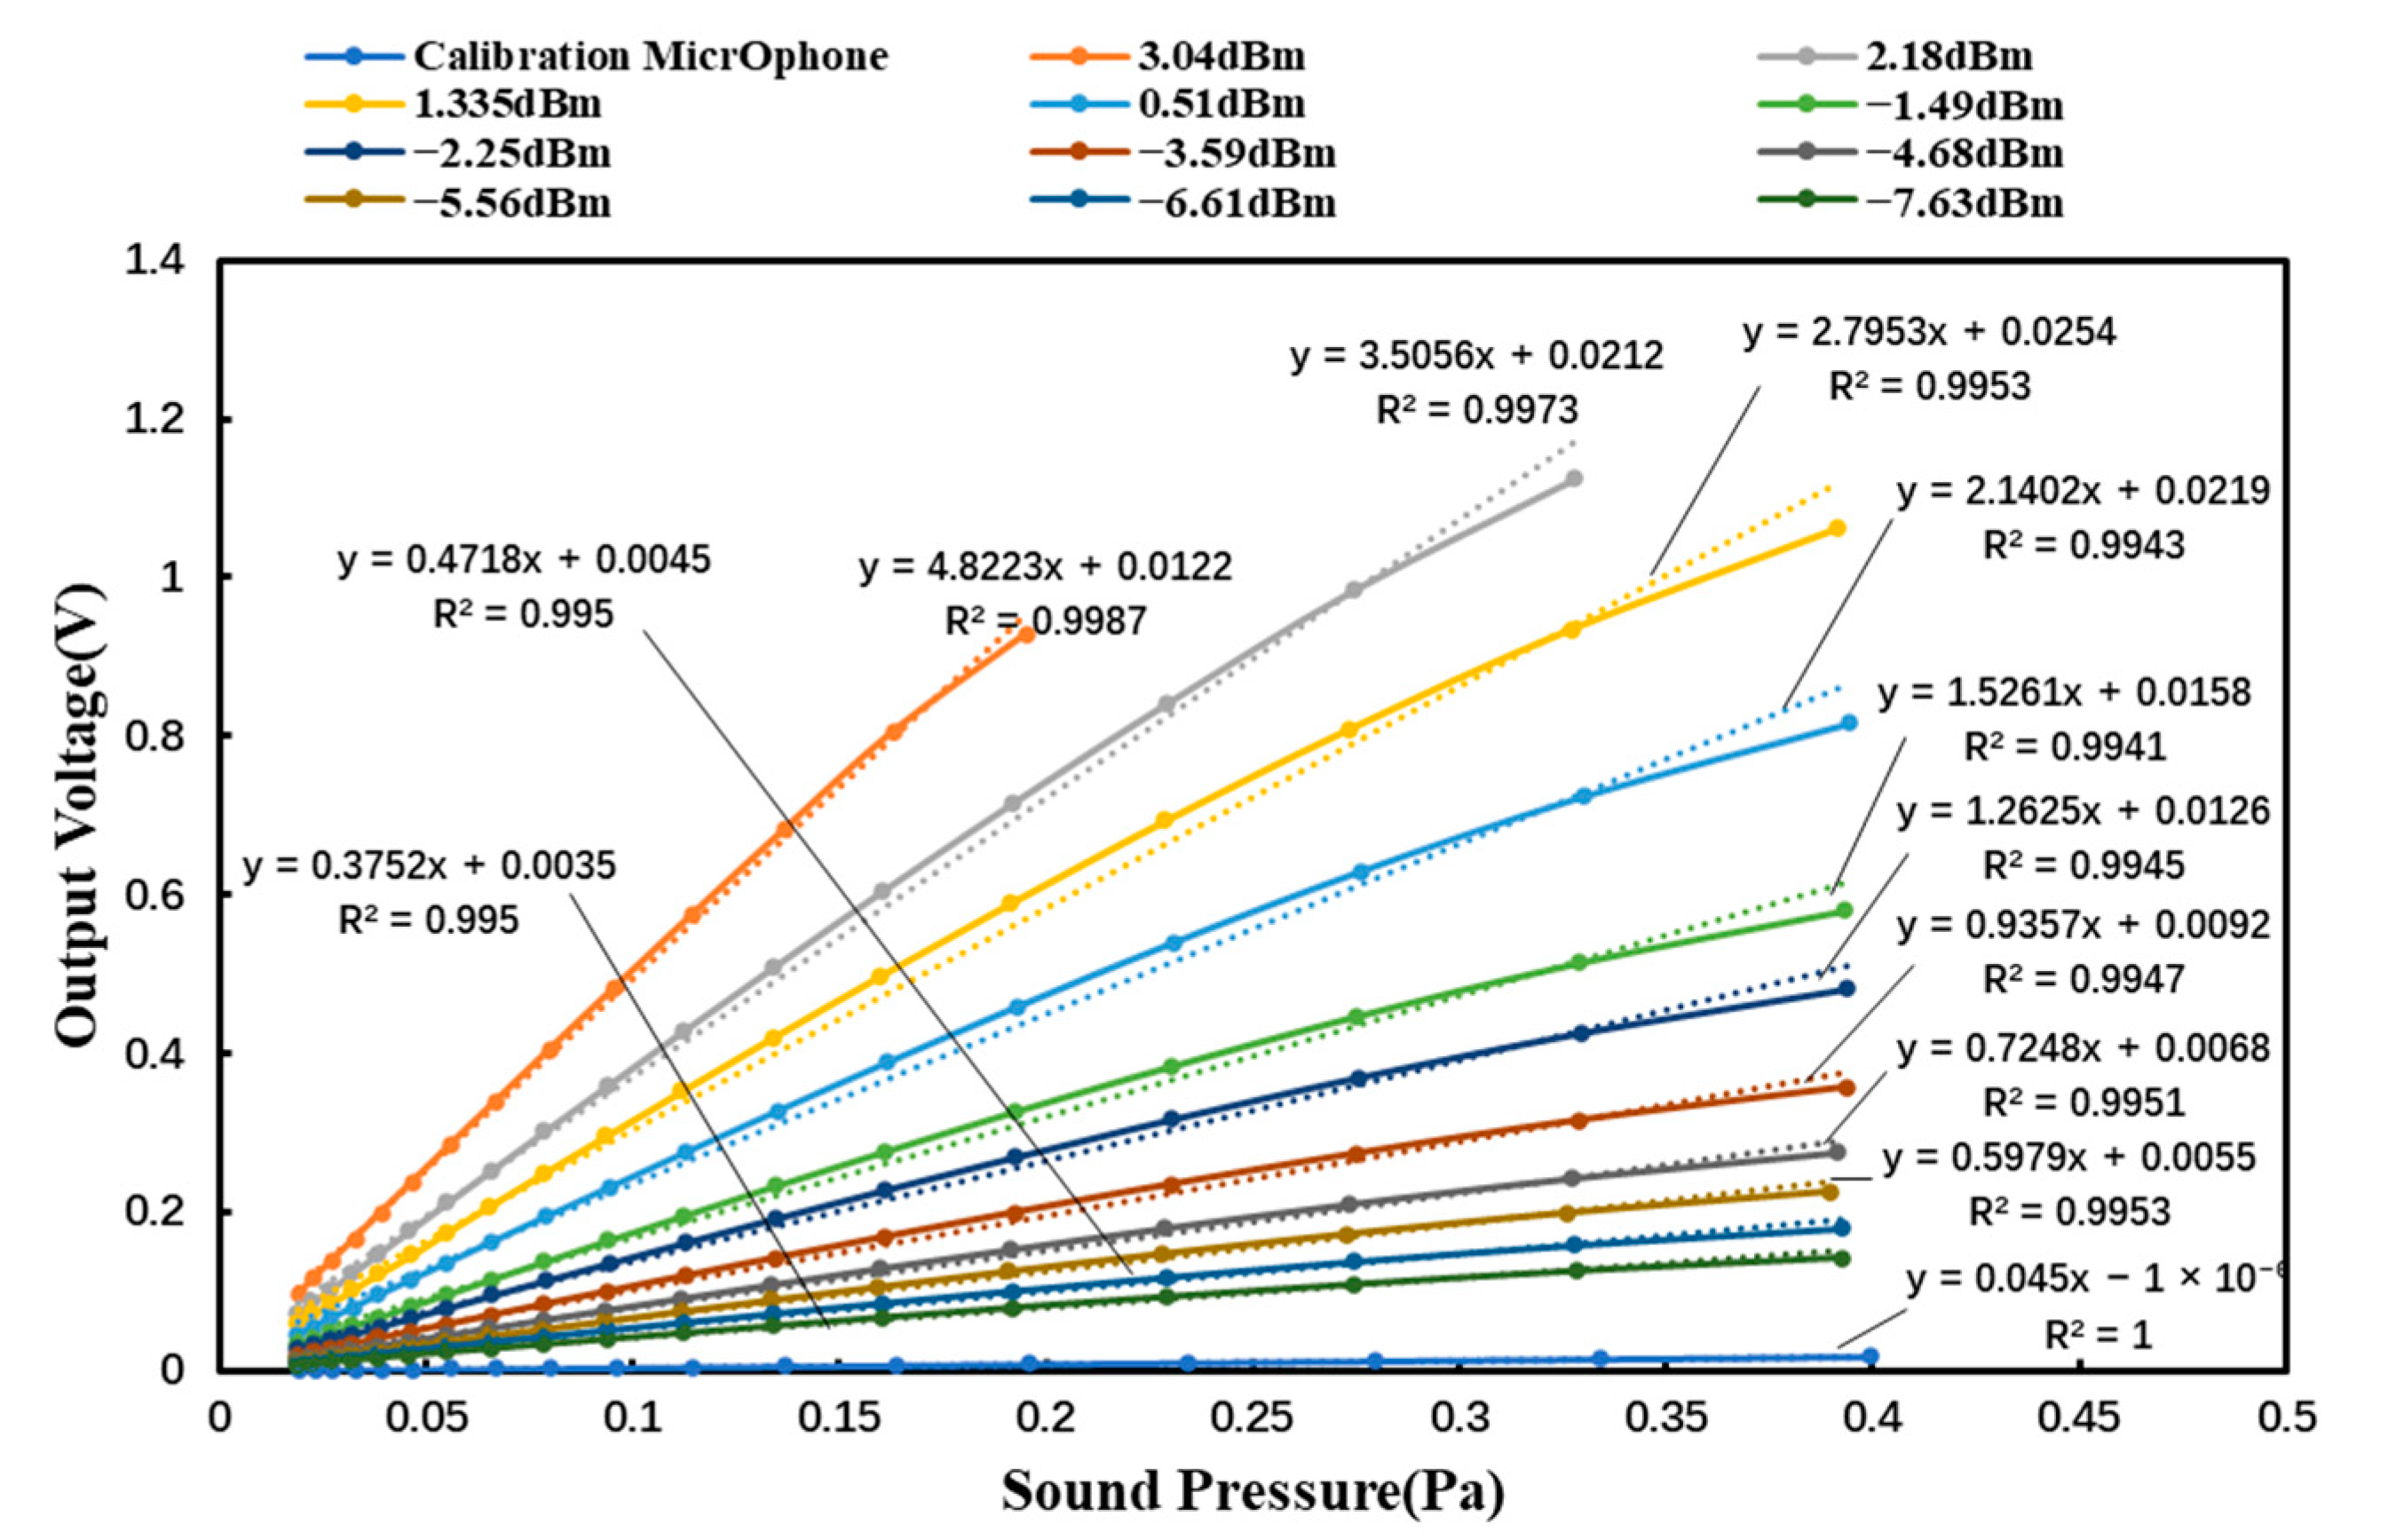
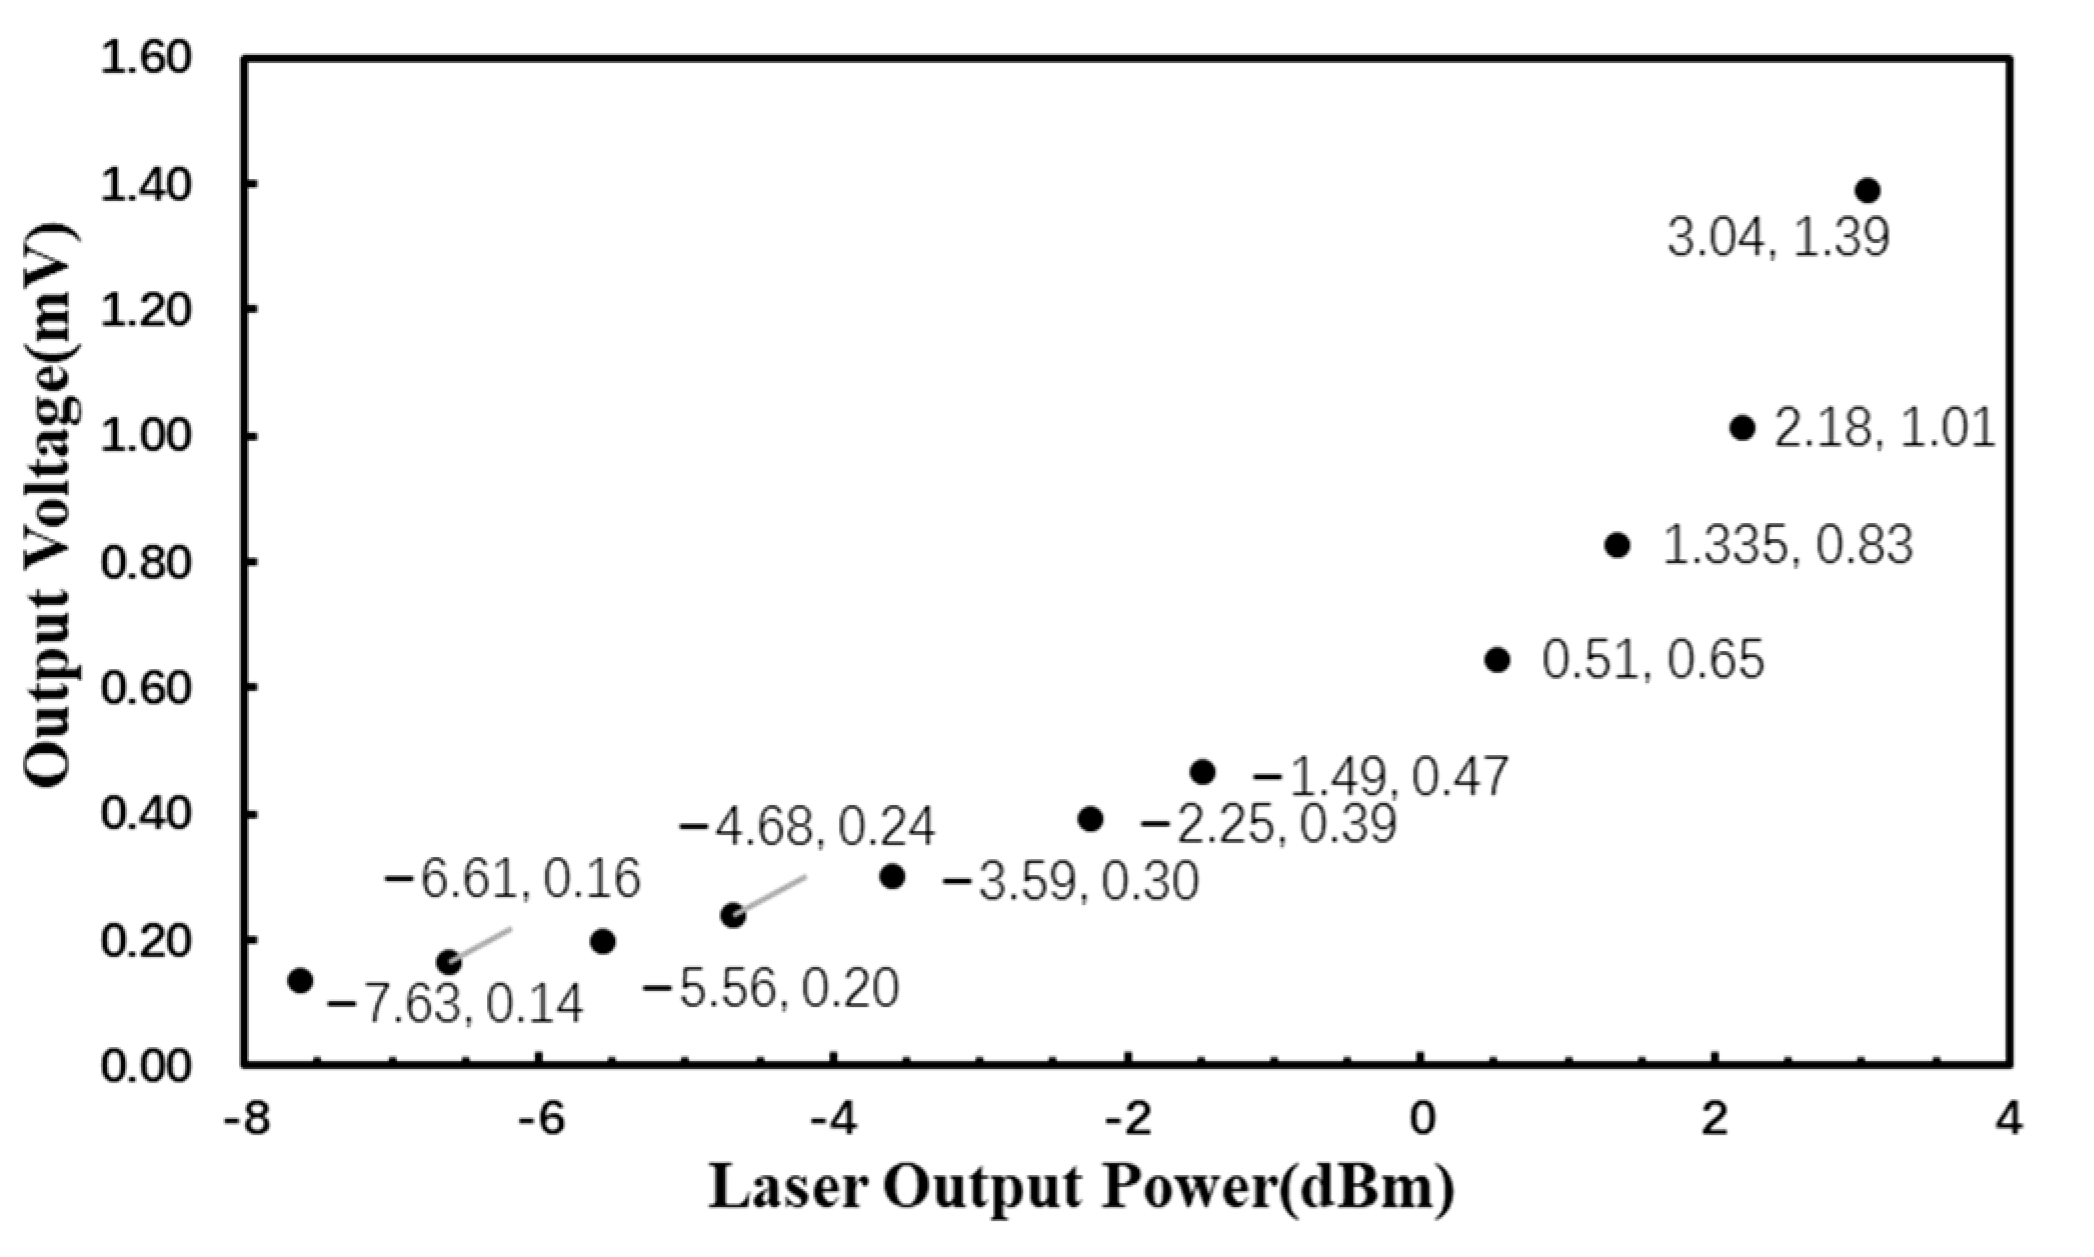
4.2. Comparison of SNR Model to Experiment

According to Equation (7), we know that the device main parameters originate from the ASE laser, the F-P acoustic sensor, and the PD. The key parameters of the fiber optic acoustic sensor, S a c o , and the loss of the optical path were given as test results in the previous section. The parameters of the light source and PD can be obtained by testing with professional instruments, and the specific parameters are shown in Table 2.
To verify the correctness of the model, a MATLAB simulation was performed by substituting the parameters of the signal-to-noise ratio measurement system into the model with the light source output power as the variable, and the simulation results were compared with the actual experimental results.
The fiber optic F-P acoustic sensing system showed consistent signal-to-noise ratios between the experimental and simulated results within a specific light power range. The maximum error observed was 2.52% at 2.05 dBm, with a minimum difference of only 0.06 dB and a maximum difference of 0.35 dB. However, as the light power increased, the signal-to-noise ratio improvement gradually decreased. The photodiode was found to be in a saturation state at the maximum light power, resulting in increased nonlinear noise with further light power input. This led to decreased output signal-to-noise ratios. Due to the experimental environment’s limitations, the semi-anechoic chamber could not eliminate noise completely. Therefore, acoustic measurements require a strictly silent environment, and the sensor’s sensitivity is affected by the fluctuation caused by environmental influences [14,15].

5. Conclusions

This study conducted a theoretical analysis of the structure of a fiber optic F-P acoustic sensor and established a signal-to-noise ratio model based on the F-P cavity and the sensing component. The experimental results of the signal-to-noise ratio are in good agreement with the simulation results of the model, which has been optimized. The maximum error of the signal-to-noise ratio model was only 2.52%, and it can effectively predict the signal-to-noise ratio of the fiber optic F-P acoustic sensing system.
The signal-to-noise ratio model developed in this study provides a better understanding of the bottlenecks in signal transmission so that methods of optimization can be found. When building or optimizing an optical fiber F-P acoustic sensing system and using this model for prediction, people can choose devices with a higher signal-to-noise ratio or more cost-effective light sources, PDs, etc. when considering the cost. In further research, the noise brought by the amplification gain after PD and the more complex system link can be considered. The model can also be further refined by analyzing the parameters of different components.

Author Contributions

Conceptualization, Y.L., C.G., Y.T., W.C., R.Z. and Y.Z.; methodology, Y.L., C.G., Y.T., W.C., R.Z. and Y.Z.; software, Y.L., C.G. and Y.T.; validation, Y.L., W.C., R.Z. and Y.Z.; formal analysis, Y.L. and Y.T.; investigation, Y.L. and C.G.; resources, C.G. and Y.T.; data curation, Y.L., C.G., R.Z. and W.C.; writing—original draft preparation, Y.L., C.G., Y.T., W.C., R.Z. and Y.Z.; writing—review and editing, Y.L., C.G., Y.T., W.C. and R.Z.; visualization, Y.L., W.C., R.Z. and Y.Z.; supervision, C.G. and Y.T.; project administration, C.G. All authors have read and agreed to the published version of the manuscript.

Funding

This research received no external funding.

Institutional Review Board Statement

Not applicable.

Informed Consent Statement

Not applicable.

Data Availability Statement

No new data were created or analyzed in this study. Data sharing is not applicable to this article.

Acknowledgments

The authors thank OES Laboratory from the Hubei University of Technology for helpful discussions regarding this work and AOV Energy Inc. for their financial and technological support. The authors also thank the Hubei Collaborative Innovation Center and Hubei University of Technology for the opportunity to use their clean room and equipment. Finally, the authors thank the reviewers for their helpful suggestions.

Conflicts of Interest

The authors declare no conflict of interest.

References

  1. He, Z.; Liu, Q. Optical fiber distributed acoustic sensors: A review. J. Light. Technol. 2021, 39, 3671–3686. [Google Scholar] [CrossRef]
  2. Chunming, G.; Feng, N.; Ping, Z.; Binxing, Z.; Jing, W.; Bincheng, L. Optical fiber acoustic sensors. Opto-Electron. Eng. 2018, 45, 180050-1–180050-10. [Google Scholar]
  3. Deng, J.; Xiao, H.; Huo, W.; Luo, M.; May, R.; Wang, A.; Liu, Y. Optical fiber sensor-based detection of partial discharges in power transformers. Opt. Laser Technol. 2001, 33, 305–311. [Google Scholar] [CrossRef]
  4. Yu, B.; Kim, D.W.; Deng, J.; Xiao, H.; Wang, A. Fiber Fabry-Perot sensors for detection of partial discharges in power transformers. Appl. Opt. 2003, 42, 3241–3250. [Google Scholar] [CrossRef] [PubMed]
  5. Akkaya, O.C.; Akkaya, O.; Digonnet, M.J.F.; Kino, G.S.; Solgaard, O. Modeling and demonstration of thermally stable high-sensitivity reproducible acoustic sensors. J. Microelectromech. Syst. 2012, 21, 1347–1356. [Google Scholar] [CrossRef]
  6. Jo, W.; Akkaya, O.C.; Solgaard, O.; Digonnet, M.J.F. Miniature fiber acoustic sensors using a photonic-crystal membrane. Opt. Fiber Technol. 2013, 19, 785–792. [Google Scholar] [CrossRef]
  7. Zhang, W.; Lu, P.; Qu, Z.; Zhang, J.; Liu, D. Four-wavelength quadrature phase demodulation technique for extrinsic Fabry–Perot interferometric sensors. Opt. Lett. 2022, 47, 2406–2709. [Google Scholar] [CrossRef] [PubMed]
  8. Downie, J.D.; Liang, X.; Ivanov, V.; Sterlingov, P.; Kaliteevskiy, N. SNR model for generalized droop with constant output power amplifier systems and experimental measurements. J. Light. Technol. 2020, 38, 3214–3220. [Google Scholar] [CrossRef]
  9. Guo, M.; Chen, K.; Yang, B.; Li, C.; Zhang, B.; Yang, Y.; Wang, Y.; Li, C.; Gong, Z.; Ma, F.; et al. Ultrahigh sensitivity fiber-optic Fabry–Perot interferometric acoustic sensor based on silicon cantilever. IEEE Trans. Instrum. Meas. 2021, 70, 1–8. [Google Scholar] [CrossRef]
  10. Wu, Y.; Yu, C.; Wu, F.; Li, C.; Zhou, J.; Gong, Y.; Rao, Y.; Chen, Y. A highly sensitive fiber-optic microphone based on graphene oxide membrane. J. Light. Technol. 2017, 35, 4344–4349. [Google Scholar] [CrossRef]
  11. Dehé, A.; Wurzer, M.; Füldner, M.; Krumbein, U. Design of a poly silicon MEMS microphone for high signal-to-noise ratio. In Proceedings of the 2013 European Solid-State Device Research Conference (ESSDERC), Bucharest, Romania, 16–20 September 2013; IEEE: Piscataway, NJ, USA, 2013; pp. 292–295. [Google Scholar]
  12. Karim, A.; Devenport, J. Noise figure reduction in externally modulated analog fiber-optic links. IEEE Photonics Technol. Lett. 2007, 19, 312–314. [Google Scholar] [CrossRef]
  13. Xiang, Z.; Dai, W.; Rao, W.; Cai, X.; Fu, H. A Gold Diaphragm-Based Fabry-Perot Interferometer with a Fiber-Optic Collimator for Acoustic Sensing. IEEE Sens. J. 2021, 21, 17882–17888. [Google Scholar] [CrossRef]
  14. Ma, J.; Xuan, H.; Ho, H.L.; Jin, W.; Yang, Y.; Fan, S. Fiber-optic Fabry–Pérot acoustic sensor with multilayer graphene diaphragm. IEEE Photonics Technol. Lett. 2013, 25, 932–935. [Google Scholar] [CrossRef]
  15. Macedo, L.; Pedruzzi, E.; Avellar, L.; Castellani, C.E.S.; Segatto, M.E.V.; Frizera, A.; Marques, C.; Leal-Junior, A. High-Resolution Sensors for Mass Deposition and Low-Frequency Vibration Based on Phase-Shifted Bragg Gratings. IEEE Sens. J. 2022, 23, 2228–2235. [Google Scholar] [CrossRef]
Figure 1. Fiber optic F-P acoustic sensing system.
Photonics 10 00676 g001
Figure 2. F-P acoustic sensor structure diagram.
Photonics 10 00676 g002
Figure 3. (a) Fiber optic F-P acoustic sensor system signal-to-noise ratio experimental test system; (b) semi-anechoic chamber, fiber-optic F-P acoustic sensor, calibration microphone, and stereo.
Photonics 10 00676 g003
Figure 4. Voltage output response and sensitivity of the fiber optic F-P acoustic sensing system.
Photonics 10 00676 g004
Figure 5. Inherent noise of the fiber optic F-P acoustic sensing system.
Photonics 10 00676 g005
Figure 6. Results of signal-to-noise ratio obtained from simulation and experimentation.
Photonics 10 00676 g006
Table 1. Results of membrane sensitivity test.
P (dBm) S v o l (V/Pa) S a c o (nm/Pa)
3.044.8223250.3405
2.183.5056236.6855
1.3352.7953237.4239
0.512.1402245.7801
−1.491.5261251.2925
−2.251.2625246.6651
−3.590.9357248.5624
−4.680.7248246.2618
−5.560.5979248.3989
−6.610.4718250.2916
−7.6270.3752251.5058
Table 2. Simulation parameters.
ParameterSymbolValue
Wavelength λ 1550   nm
Relative Intensity Noise R I N 125   dBc / Hz
Membrane Sensitivity S a c o 246.66   nm / Pa
Detector Sensitivity η 1   A / W
Bandwidth B 50   kHz
Elementary Charge q 1.6 × 10 19 C
Loss L 17   dB
Disclaimer/Publisher’s Note: The statements, opinions and data contained in all publications are solely those of the individual author(s) and contributor(s) and not of MDPI and/or the editor(s). MDPI and/or the editor(s) disclaim responsibility for any injury to people or property resulting from any ideas, methods, instructions or products referred to in the content.

