1. Introduction
Extensive research studies on the model and experimental investigation of stable and narrow linewidth erbium-doped fiber lasers (EDFL) have been reported. EDFLs have many important applications, primarily in the fields of scientific research, medical procedures, and industrial manufacturing [
1,
2,
3]:
Scientific research [
1,
2,
3,
4]: EDFLs are used in a wide range of scientific research applications, including optical fiber sensors, spectroscopy, metrology, and nonlinear optics. The narrow linewidth of EDFLs is particularly important in these applications, as it allows for precise control over the output wavelength.
Medical procedures [
5]: EDFLs are used in a variety of medical procedures, such as ophthalmology, dermatology, and surgery. In these applications, the narrow linewidth of EDFLs is important for precise targeting and manipulation of biological tissues.
Industrial manufacturing [
6]: EDFLs are used in industrial manufacturing applications such as cutting, welding, and drilling. The stable output of EDFLs is particularly important in these applications, as it ensures consistent results over long periods of operation.
Lidar [
7]: EDFLs can be used in lidar (light detection and ranging) systems, which are used for remote sensing and atmospheric monitoring. The narrow linewidth of EDFLs is important in these systems, as it allows for precise measurements of atmospheric properties.
Communications [
8]: EDFLs are also used in optical communications systems, particularly in wavelength-division multiplexing (WDM) applications. The narrow linewidth of EDFLs allows for precise control over the output wavelength, which is critical for maintaining signal integrity and minimizing signal crosstalk.
The stable and narrow linewidth properties of EDFLs make them important components in a wide range of scientific, medical, industrial, and communications applications.
The originality of our work lies in the following aspects: First, for the control of the mode competition associated with the multi-wavelength fiber laser, we proposed the use of the variable coupler to balance the output power of the two spectral wavelengths as opposed to other conventional techniques, such as using an adjustable tapered fiber to modulate intensity [
9], the polarization hole burning method [
10], or using polarization to maintain fiber [
11]. Secondly, we investigated the linewidth behavior of the two spectral wavelengths by selective tuning using a tunable filter and when the saturable absorber was incorporated. Thirdly, we proposed and simulated a numerical model for both telecommunication bands, where simulations agreed with the experimental validation.
The remainder of the paper is organized as follows. After the present introduction,
Section 2 will expose related works.
Section 3 details the proposed model. An experimental configuration is proposed in
Section 4. Fiber laser optimization is conducted in
Section 5.
Section 6 is devoted to linewidth measurement. Finally, the article is concluded in
Section 7.
2. Related Works
There are some characteristics that make EDFLs of interest, such as its coherence length, high signal-to-noise ratio, stability, and single longitudinal mode (SLM) operation. Single longitudinal mode (SLM) is achieved by suppressing the unwanted mode in the fiber laser such that only a single mode is transmitted from the output. The SLM erbium-doped fiber laser has been demonstrated in both the linear [
12] and ring [
13] cavity configurations, respectively.
Ring cavities are often used to force the unidirectional operation of a laser. In the case of fiber lasers, an additional advantage is that a ring cavity can be made without using mirrors, resulting in an all-fiber cavity [
13]. The design of the erbium-doped fiber ring laser (EDFRL) will involve a numerical model and experimental investigation.
For the numerical model of EDFRL, we consider different phenomena inside the laser’s gain medium, namely the interaction between optical fields and the rare-earth ions. The gain medium is a fiber doped with erbium ions radially distributed along the axis of the fiber core. The electrons in the ground state of the erbium ion absorbs energy in the presence of an incident pump. The pump intensity absorbed by EDFRL causes electrons to be excited from the ground state to the excited state until population inversion is achieved.
From the excited state, the electron decays to the metastable state, emitting random photons. This process is known as spontaneous emission. In the metastable state, the propagating pump field intensity stimulates the electron to the ground state, emitting photons that have the same direction and phase and that are nearly monochromatic. Optical field built up in this process interacts with the fiber laser cavity at a resonant frequency [
14]. Simulating the EDFRL enables us to understand the performance characteristics of the laser before the experiment.
Notably, erbium-doped fiber lasers are susceptible to changes influenced by environmental perturbation, such as temperature and vibration, making it very unstable [
15]. These instabilities, caused by external perturbations, are dependent on the inhomogeneous behavior of erbium ions at room temperature [
15]. There are also intrinsic events that occur in an erbium-doped fiber, which are homogeneous and are due to the excited-state lifetime and the dephasing time. Both the homogeneous and the inhomogeneous events cause broadening of the erbium fiber laser spectrum, which influences the linewidth of the fiber laser and must be controlled to achieve a narrow linewidth. The narrow linewidth erbium-doped fiber laser has been reported in multi-wavelength [
16] and single wavelength [
13] fiber lasers operating in single longitudinal mode.
In the design of both multi-wavelength and single wavelength fiber lasers operating in single-longitudinal mode and with stable output power, various techniques to address the challenge highlighted above are expounded below and have been implemented [
17,
18,
19,
20,
21]. For numerous applications that need stable output, single-longitudinal mode, and narrow linewidth, overcoming some of these drawbacks associated with the erbium-doped fiber laser is a necessary requirement.
One of the examples of linear laser cavity is the Fabry–Perot cavity, which is made by placing the gain medium between two high-reflecting mirrors [
22]. The reflective mirror can be a fiber Bragg grating (FBG), which is printed using UV light radiation [
22]. FBG is a reflective mirror that reflects a portion of the laser wavelength while being transparent to the other wavelengths. The fiber Fabry–Perot laser has two FBGs cascaded in an all-fiber form. The distributed feedback (DFB) [
23] and distributed Bragg reflector (DBR) [
24] are also linear cavity fiber lasers built with an FBG filter.
Ring fiber lasers are also known to be susceptible to power fluctuations caused by mode hopping, due to the long length of the cavity, resulting in multi-mode operation [
18]. These power instabilities can significantly degrade the performance of a sensor when used as a sensor interrogator [
12]. The laser output power stability usually depends on many parameters, such as the EDF lengths, the coupling ratio of the output, and the total cavity length [
16]; it can be improved through an appropriate choice of laser design parameters and optimization. Achieving single longitudinal mode, stable output power, and narrow fiber laser linewidth were achieved by using techniques discussed below. A narrow linewidth ring cavity fiber laser was reported using Rayleigh scattering in fiber [
25,
26,
27]. The scattering effect was achieved by using the tapered fiber, which also contributed to the narrow linewidth operation of the laser [
9]. Although this technique showed an ultra-narrow linewidth operation, the length of the tapered fiber greatly influenced its stability [
9]. Single longitudinal mode and narrow linewidth operation were achieved using a microfiber knot resonator (MKR) [
28,
29]; the MKR was used to suppress multiple oscillating modes. A photonics crystal fiber-based F-P interferometer [
30] was reported for narrowing the linewidth of the erbium-doped ring cavity fiber laser. The techniques showed different dual wavelength lasing and single longitudinal mode, but fabricating the PCF F-P interferometer could be complex. A ring cavity erbium-doped fiber laser using an F-P interferometer was fabricated using the chemical etching method, and it enabled switchable wavelength selection. The saturable absorber was used to ensure stable fiber laser output by suppressing unwanted modes. Three output wavelengths of 1529.2 nm, 1545.1 nm, and 1560.2 nm, with output power stabilities of 0.39 dB, 0.33 dB, and 0.64 dB, respectively, were achieved [
31]. Recently, a single wavelength erbium-doped fiber laser with a narrow linewidth operation and a stable output was used with a saturable absorber and a tunable filter [
12,
13]. The F-P tunable filter and a saturable absorber were used to suppress unwanted modes and achieve a stable laser output [
13].
We proposed a numerical model and an experiment to investigate a selective wavelength-tunable fiber laser operating at 1530.18 nm and 1550.08 nm, using a saturable absorber and an F-P tunable filter. First, the laser configuration was optimized to balance the two FBG reflections that gave the laser output power. To measure the linewidth, we used a F-P tunable filter as the wavelength selective filter in place of the CWDM used in [
9]. The linewidth was measured twice with and without a saturable absorber.
3. Description of Model
Considering the phenomena absorption and spontaneous and stimulated emission, modeling a fiber laser often results in systems of first-order differential equations, such as rate equations and propagation equations, which are clearly described in reference [
22]. The rate equations describe the interaction between optical fields and rare-earth ions as a function of time [
22,
32,
33,
34,
35,
36,
37], and the propagation equations describe the optical field propagating inside the cavity as a function of longitudinal position.
Equations (1) and (2) are the propagation equations for both the pump and signal powers propagating in the optical cavity. The propagation equations are solved with the appropriate boundary condition that relates the optical fields at the input and output of the laser cavity [
38].
The numerical methods of the solution often involve resolving the rate equations and propagation equations. By so doing, simulating the characteristics of the EDFRL under investigation can be performed. We have the parameter that is known as the gain coefficient, which describes how the density of the emitted photon changes as it propagates along the axis of the fiber gain medium. This parameter is represented in Equation (3).
The gain coefficient
is influenced by the numerical aperture relating to the overlap factor
of the erbium-doped fiber profile [
15,
39]. The gain coefficient will increase if the signal power grows within the gain medium, but when reabsorption is higher than emission, the result will be a negative gain.
The laser simulation and optimization of the parameters will involve pump absorption, signal propagation, and slope efficiency, with respect to different erbium-doped fiber lengths. The effect of the fiber length on the slope efficiency and the effect of pump power on the output power will also be considered.
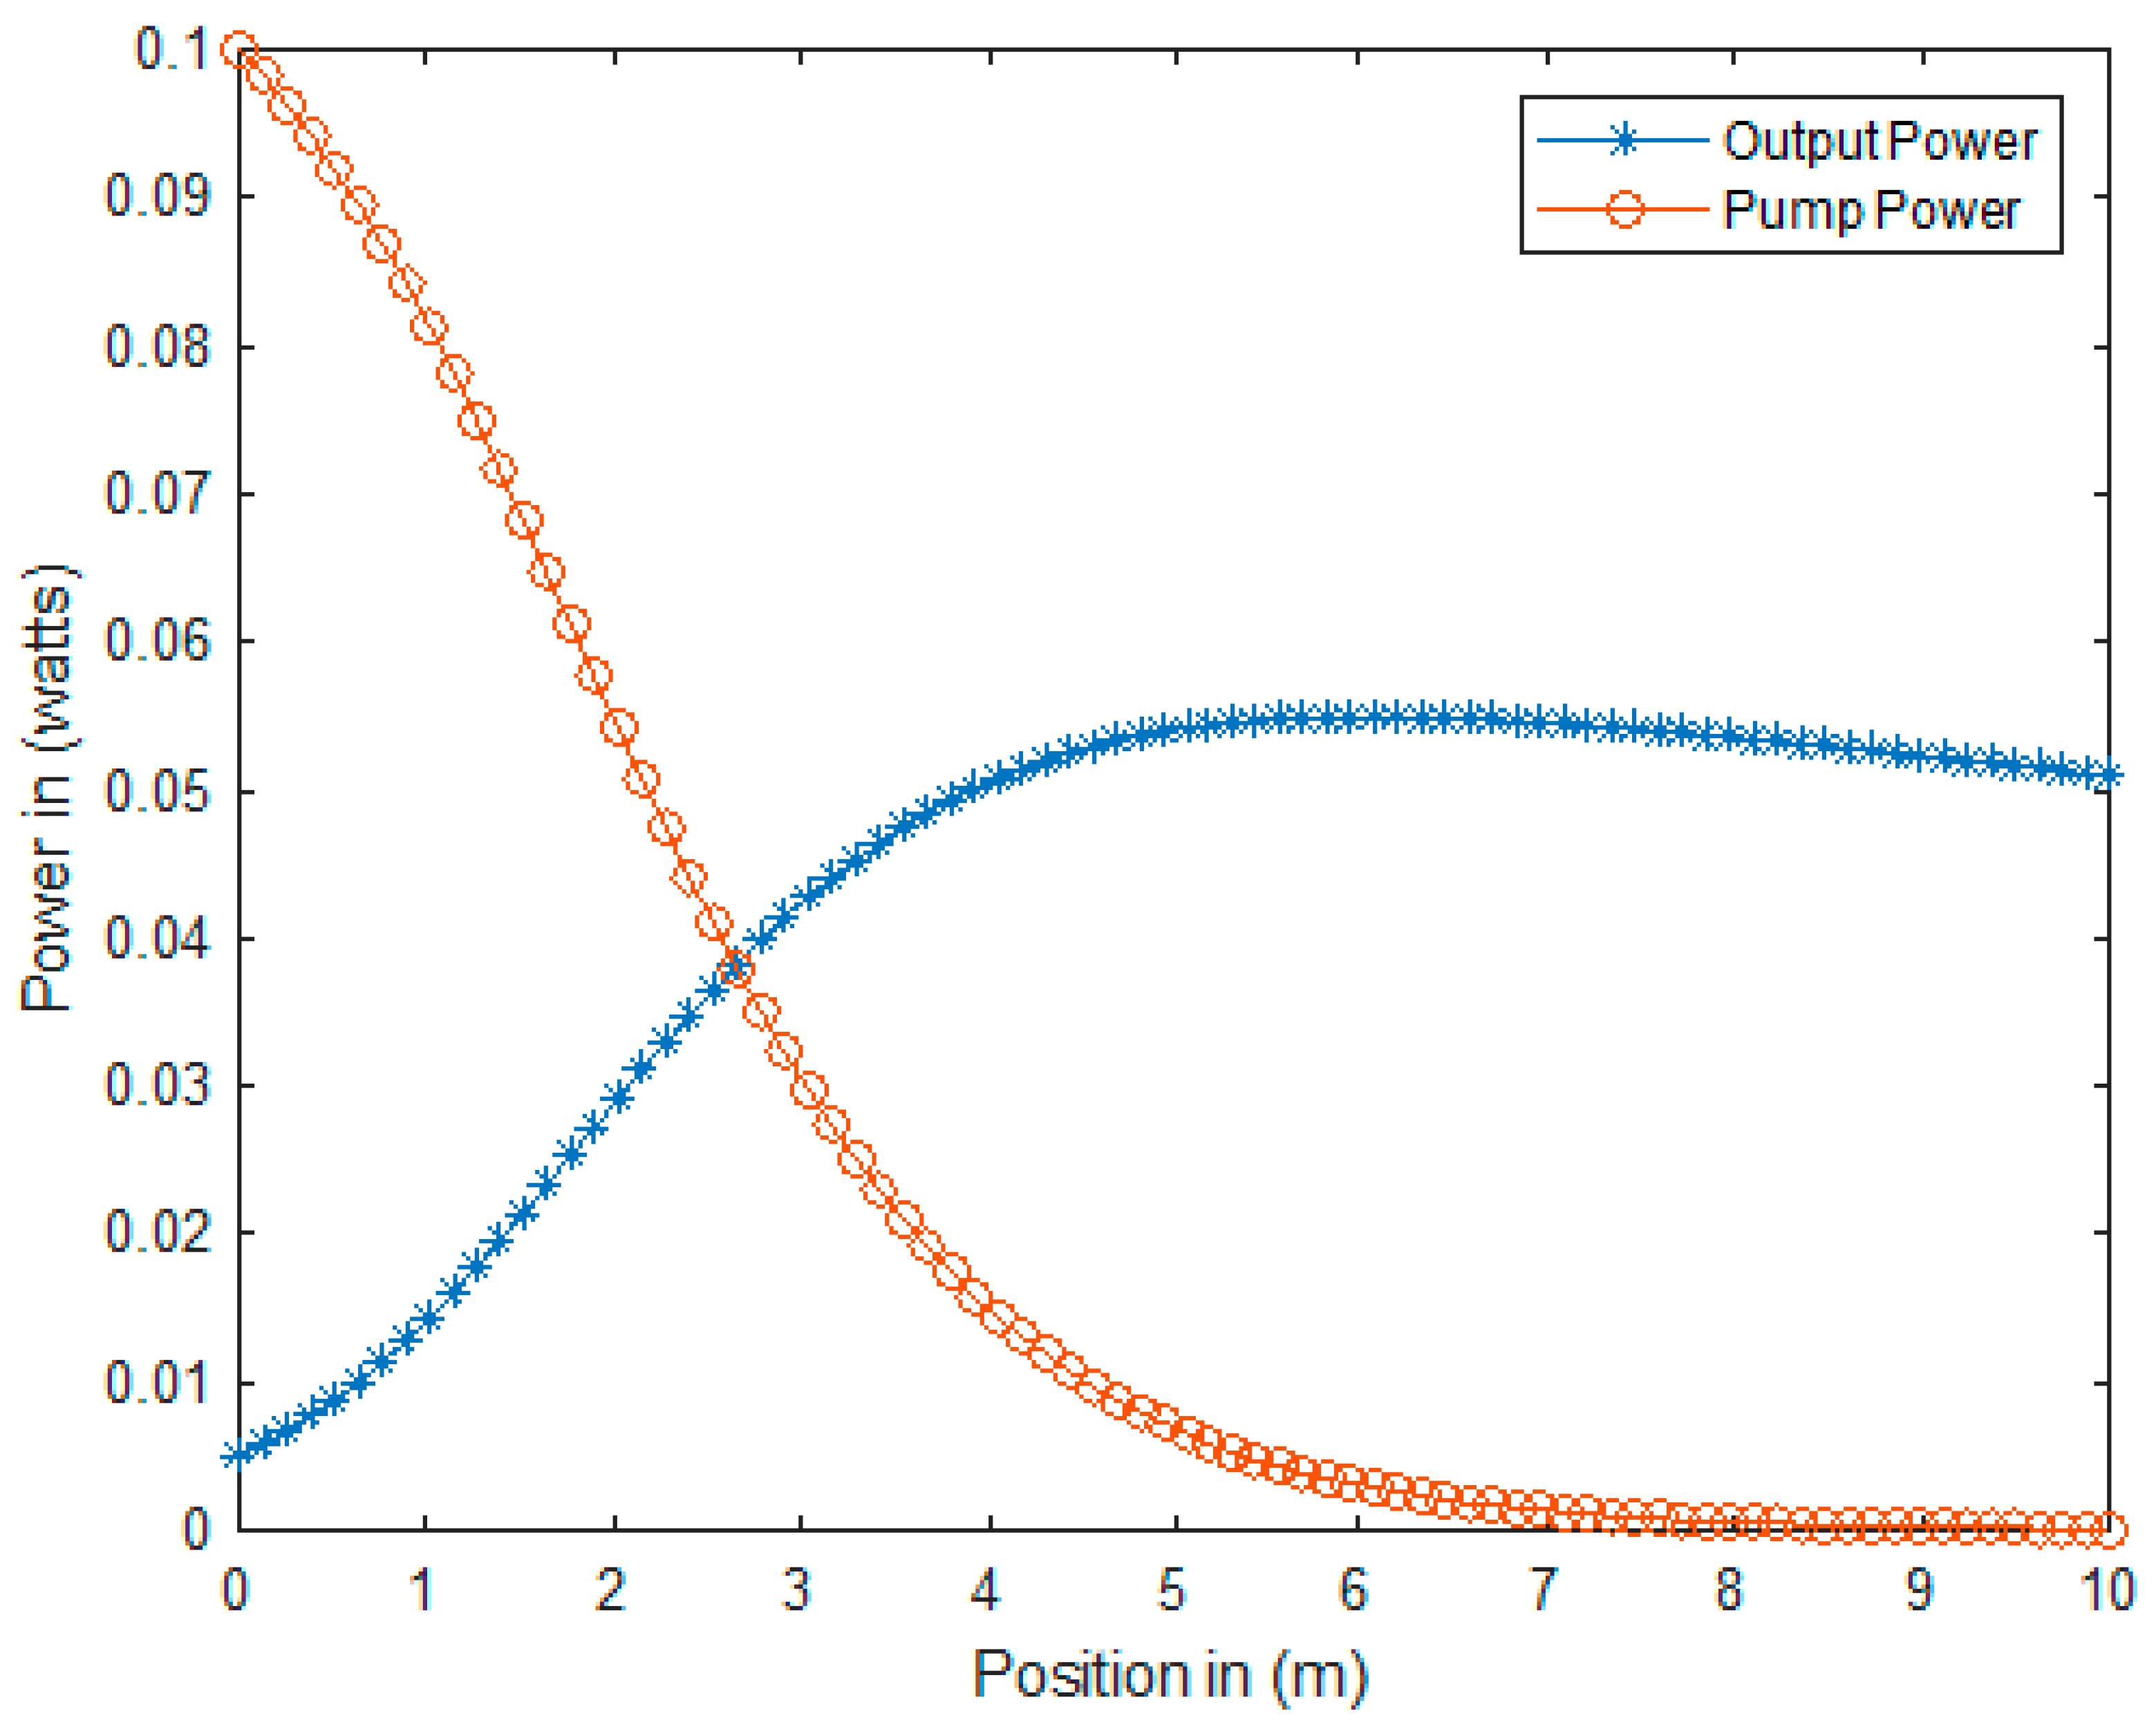
The graph in
Figure 1 shows the optical power distribution inside the erbium-doped fiber gain medium that makes up the cavity as a function of position in meters. The pump source of 980 nm was coupled into the gain medium through the wavelength division multiplexer. As it propagated through the gain medium, the pump decayed exponentially, as seen on the red plot with circles in
Figure 1 from left to right, resulting from strong pump saturation. As shown in
Figure 1, for a pump power of 100 mW and a coupling coefficient of 10%, using a doped fiber length of 10 m, 60% of the pump power was absorbed in the first 3 m of the doped fiber [
40]. The pump power absorbed created stimulated emission, which corresponded with a rapid increase in laser output power, as shown in the blue plot with asterisks in
Figure 1.
Figure 1 shows the graphic representation of the pump and signal powers propagating in the optical cavity, as shown in Equations (1) and (2).
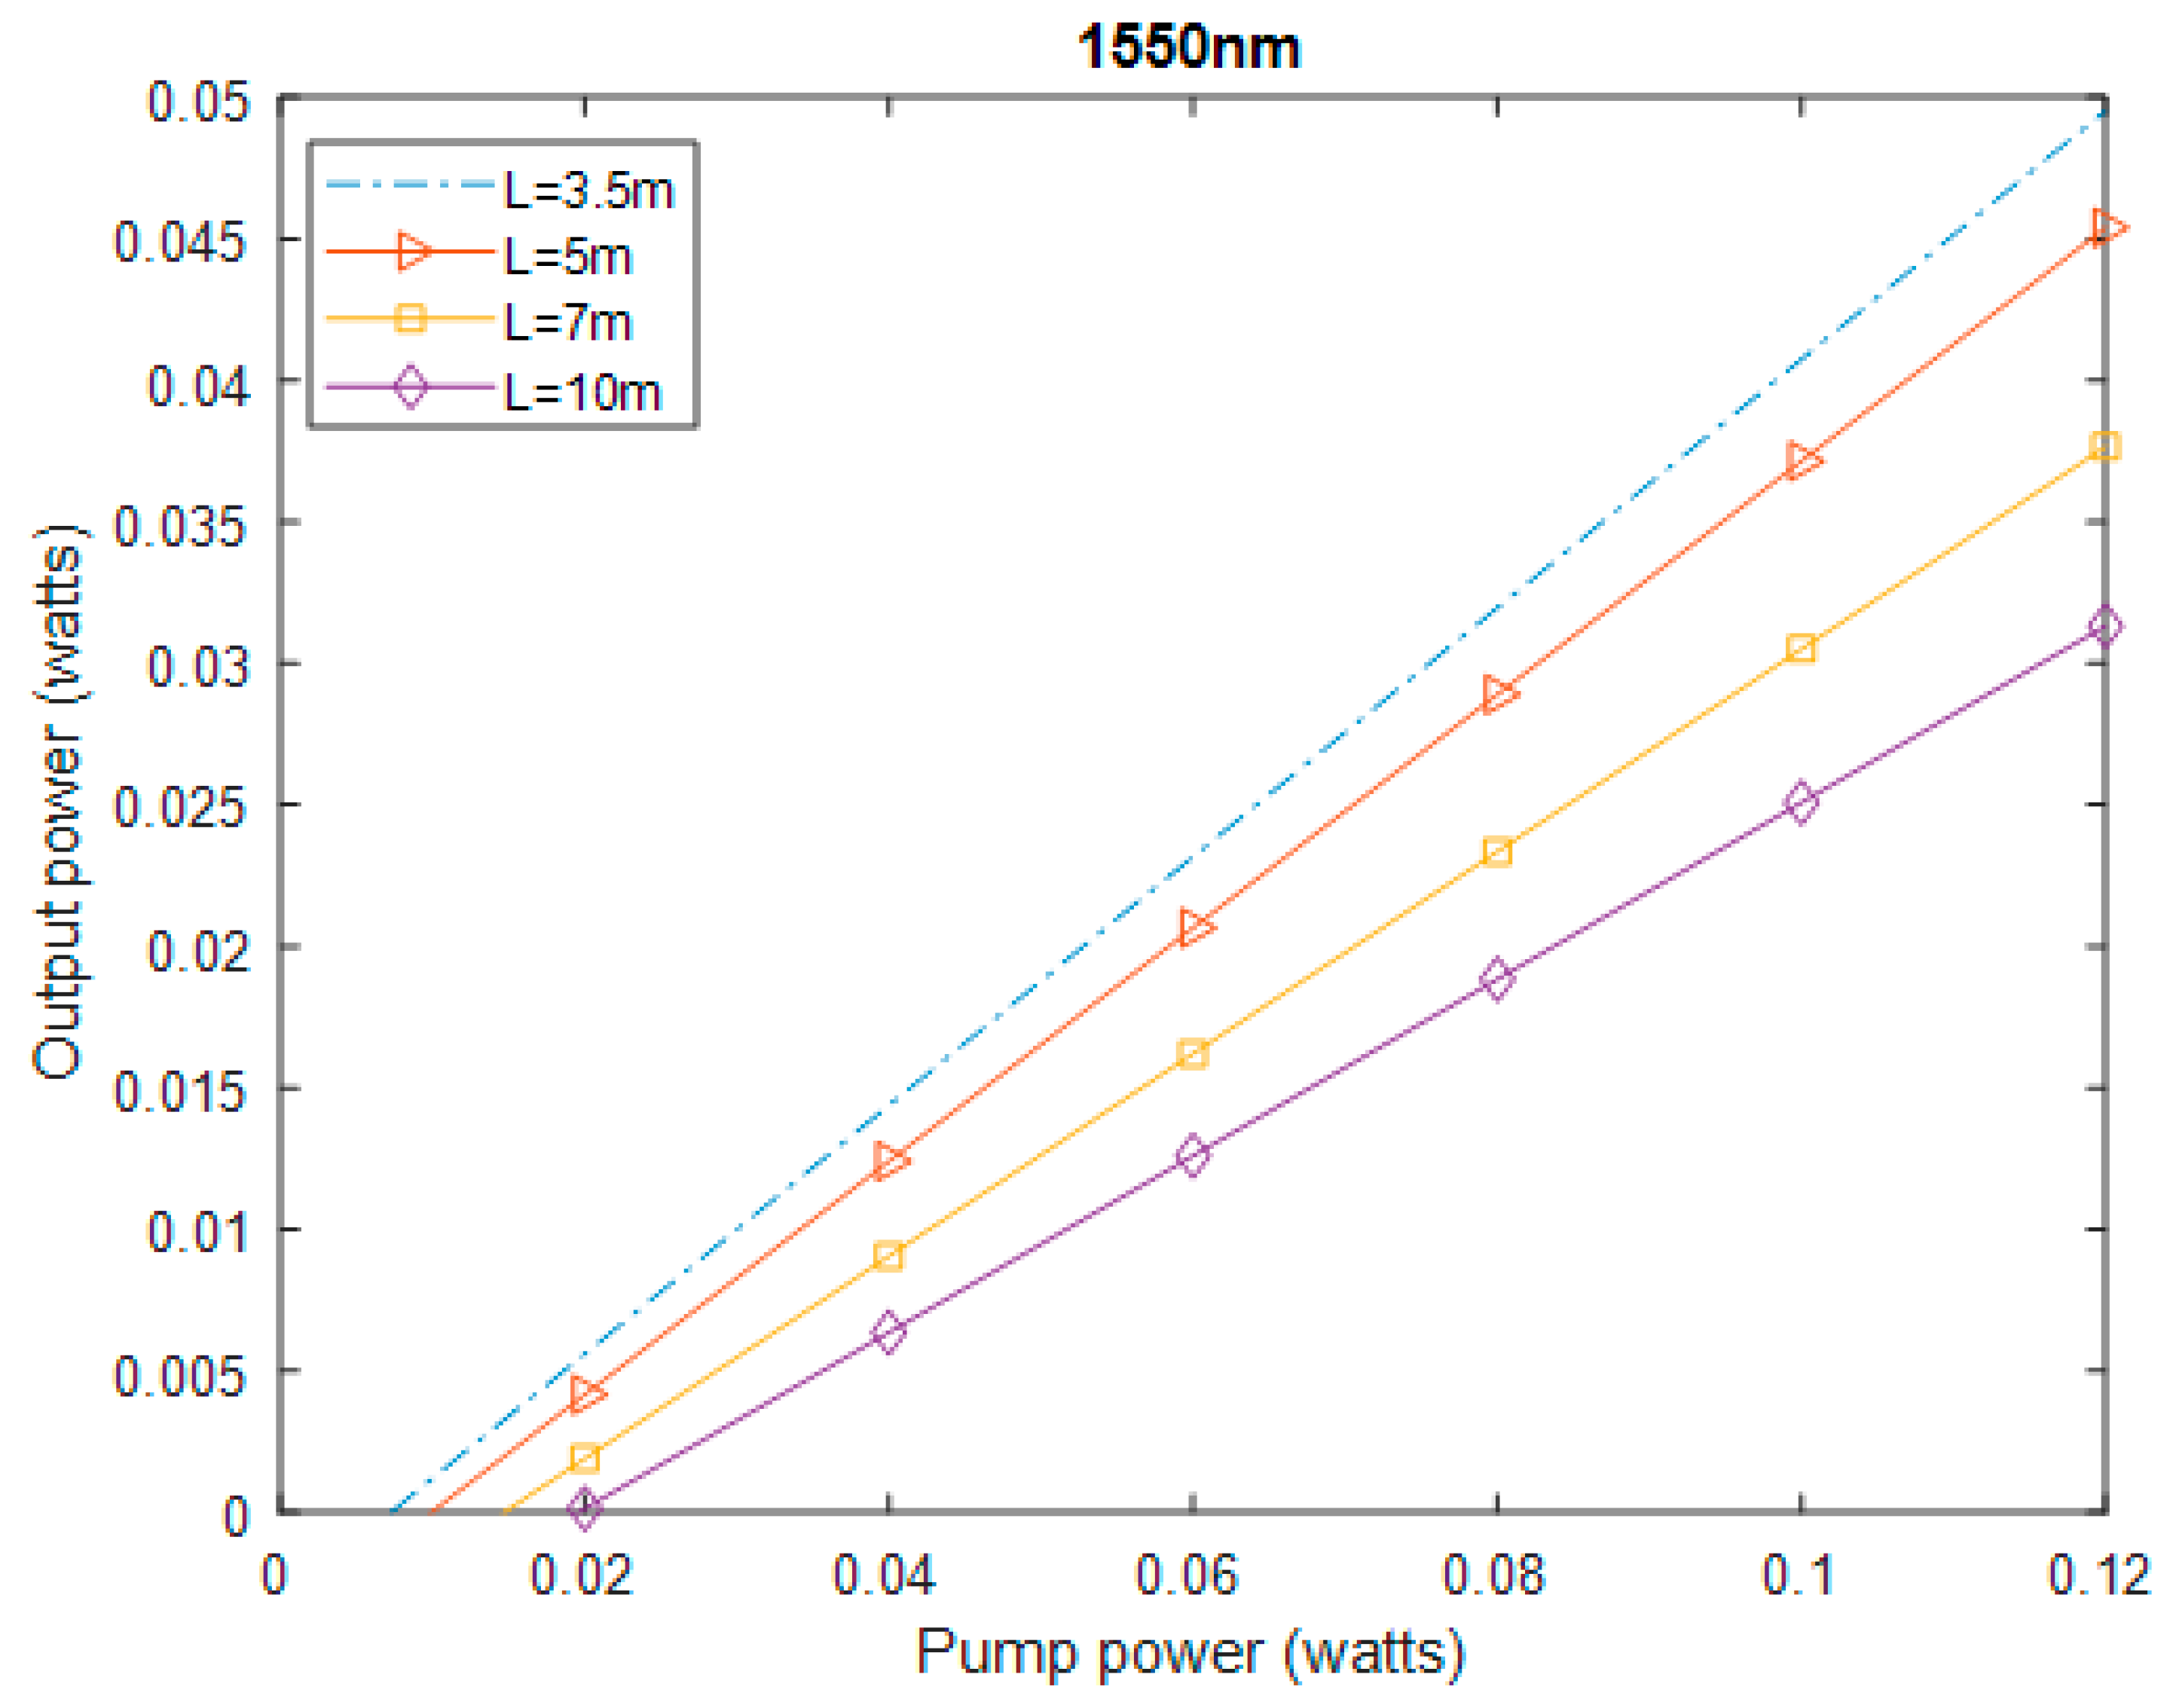
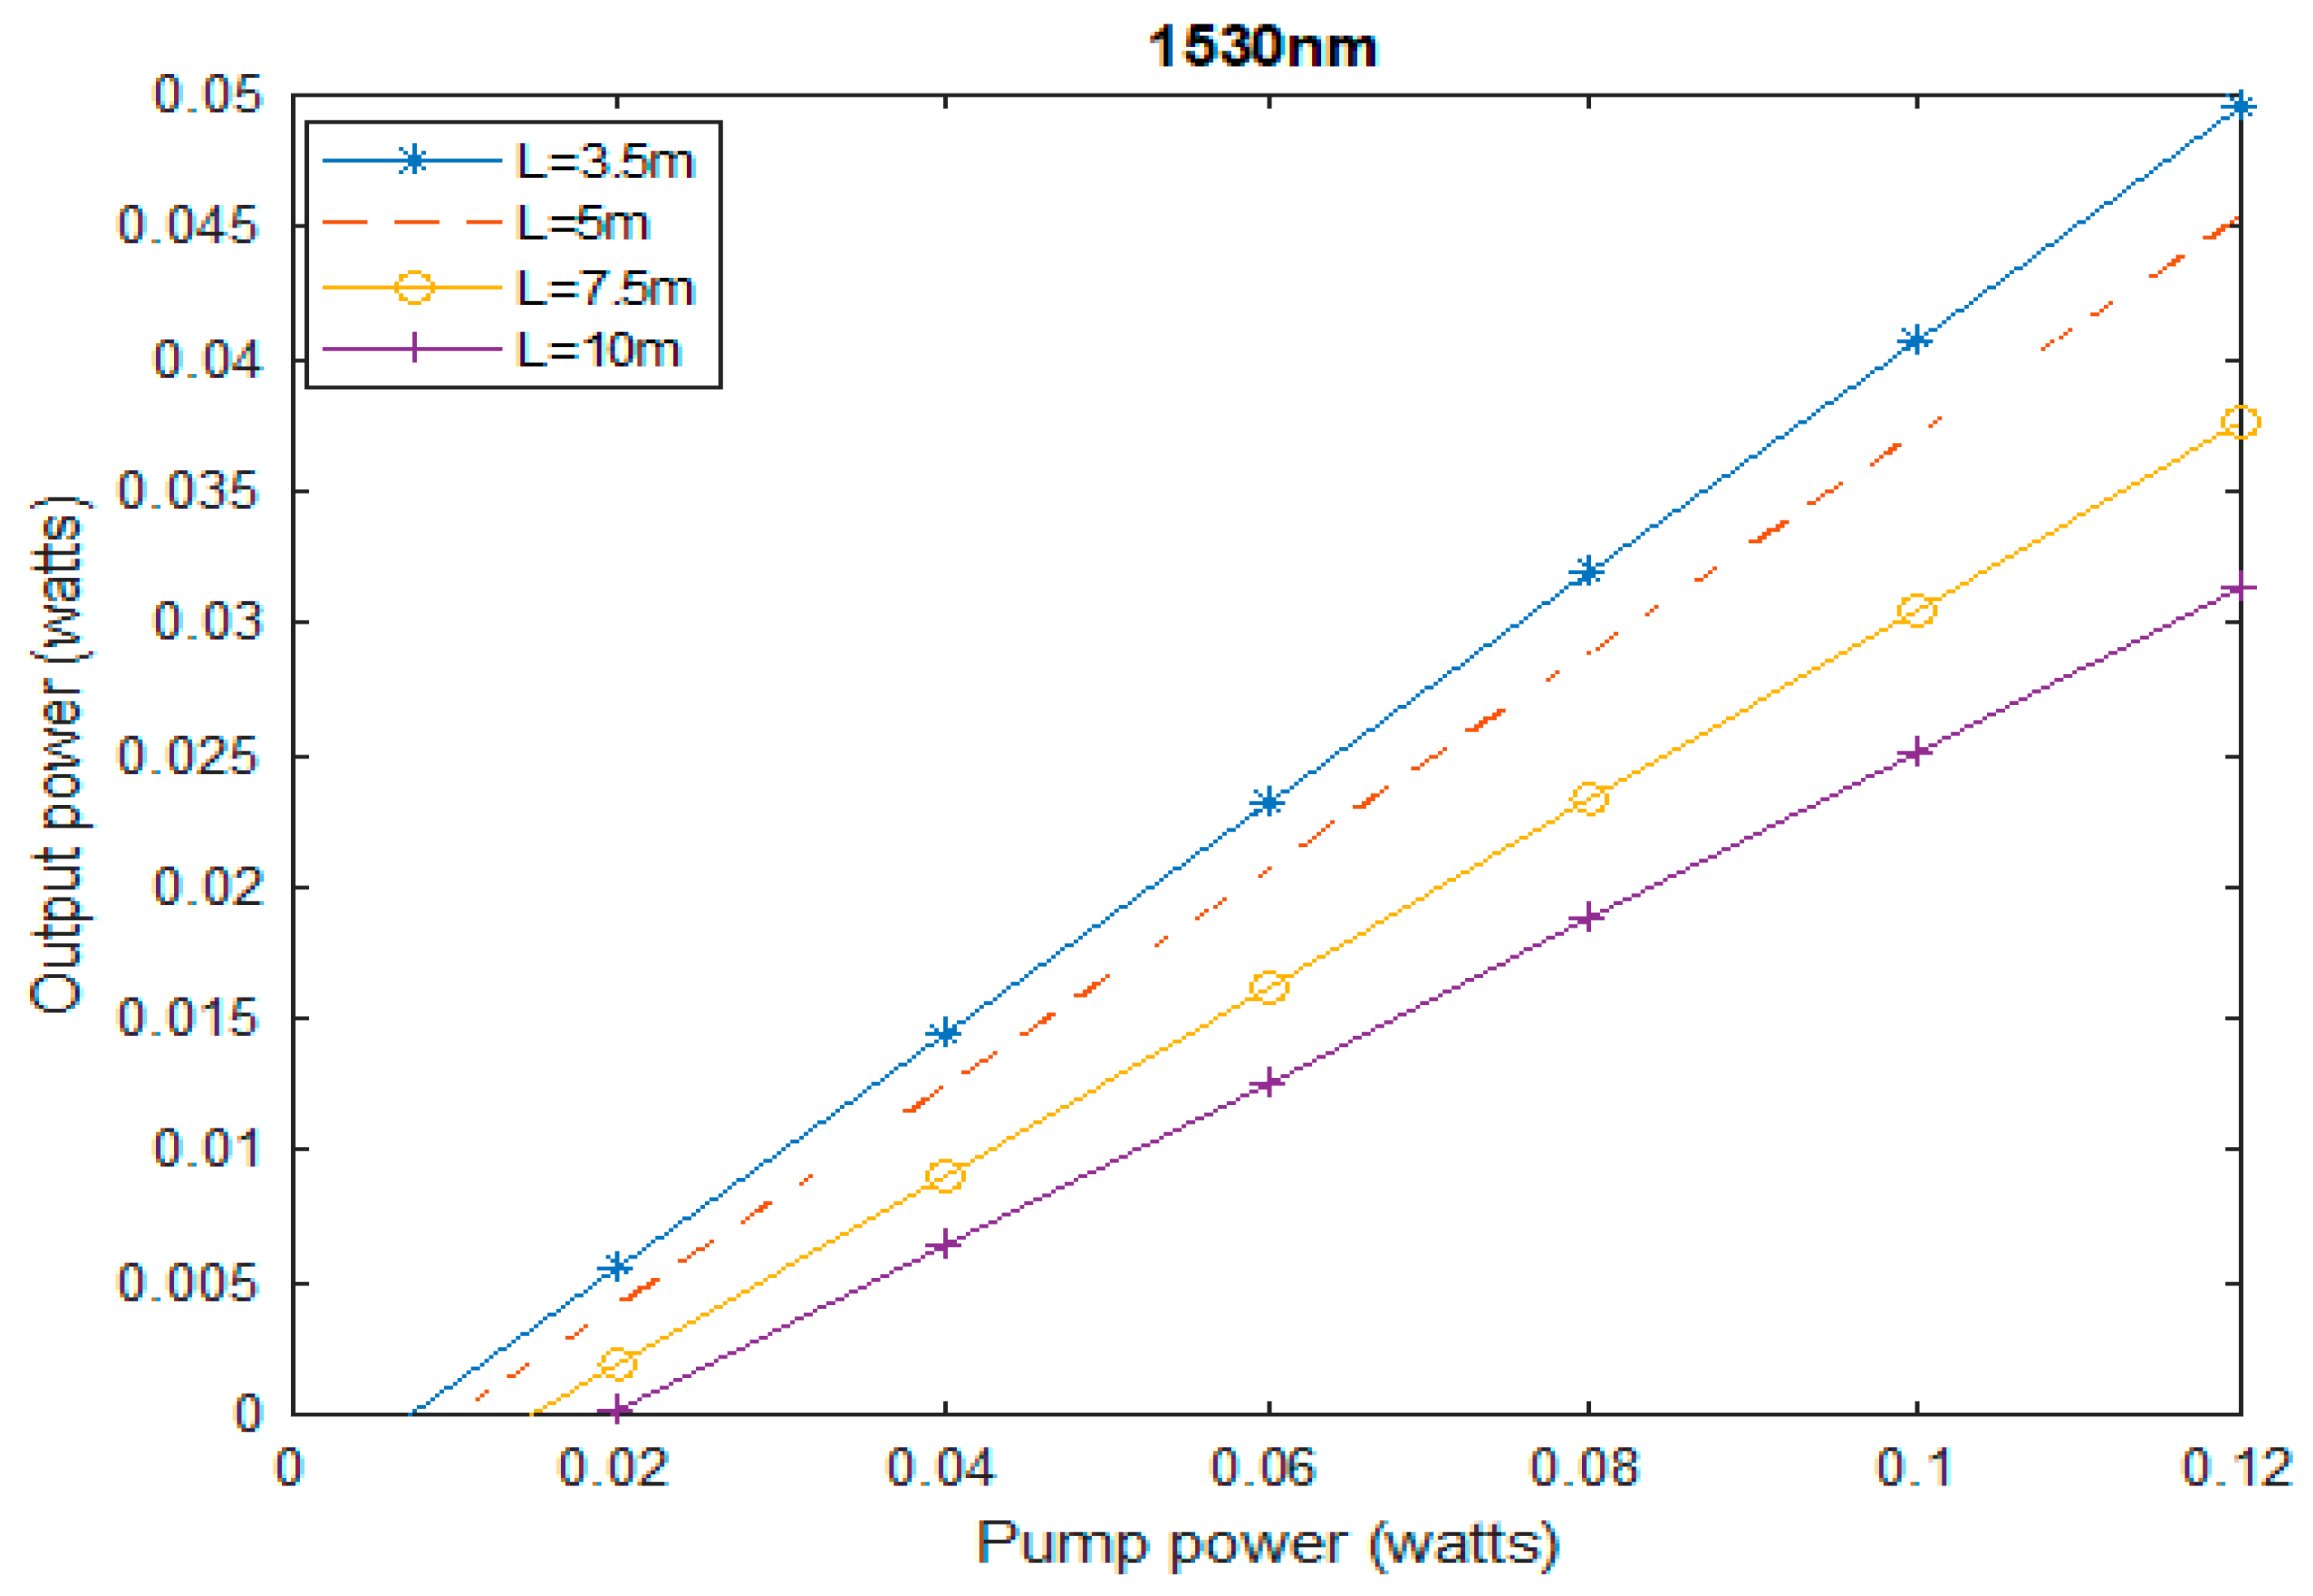
Using different lengths of the gain medium at varying pump powers, the relation between the output power and the pump power was simulated and plotted for both 1550 nm and 1530 nm wavelengths, respectively. Their respective output powers produced the optimal value of the gain medium with the slope efficiency in relation to the length of the erbium-doped fiber, which varied from 3.5 to 10 m.
The threshold of the fiber laser depended on the fiber length, with a value of less than 40 mW for lengths of 7.5 m and 10 m. This can be explained by the pump absorption in the gain medium: the longer the length of the fiber in gain medium, the greater the pump power required to create population inversion and the greater the threshold.
This behavior explains the optimum efficiency of the fiber laser as a function of the optimal length of the fiber gain medium and the output power as a function of pump power for different fiber lengths.
The optimal slope efficiency and output power, which were obtained for a fiber length of 3.5 m, are represented in
Figure 2 and
Figure 3. In other words, the maximum output power for a given pump power was obtained for a doped fiber length of 3.5 m. The output power for both 1550 nm and 1530 nm showed similar results.
4. Proposed Experimental Configuration
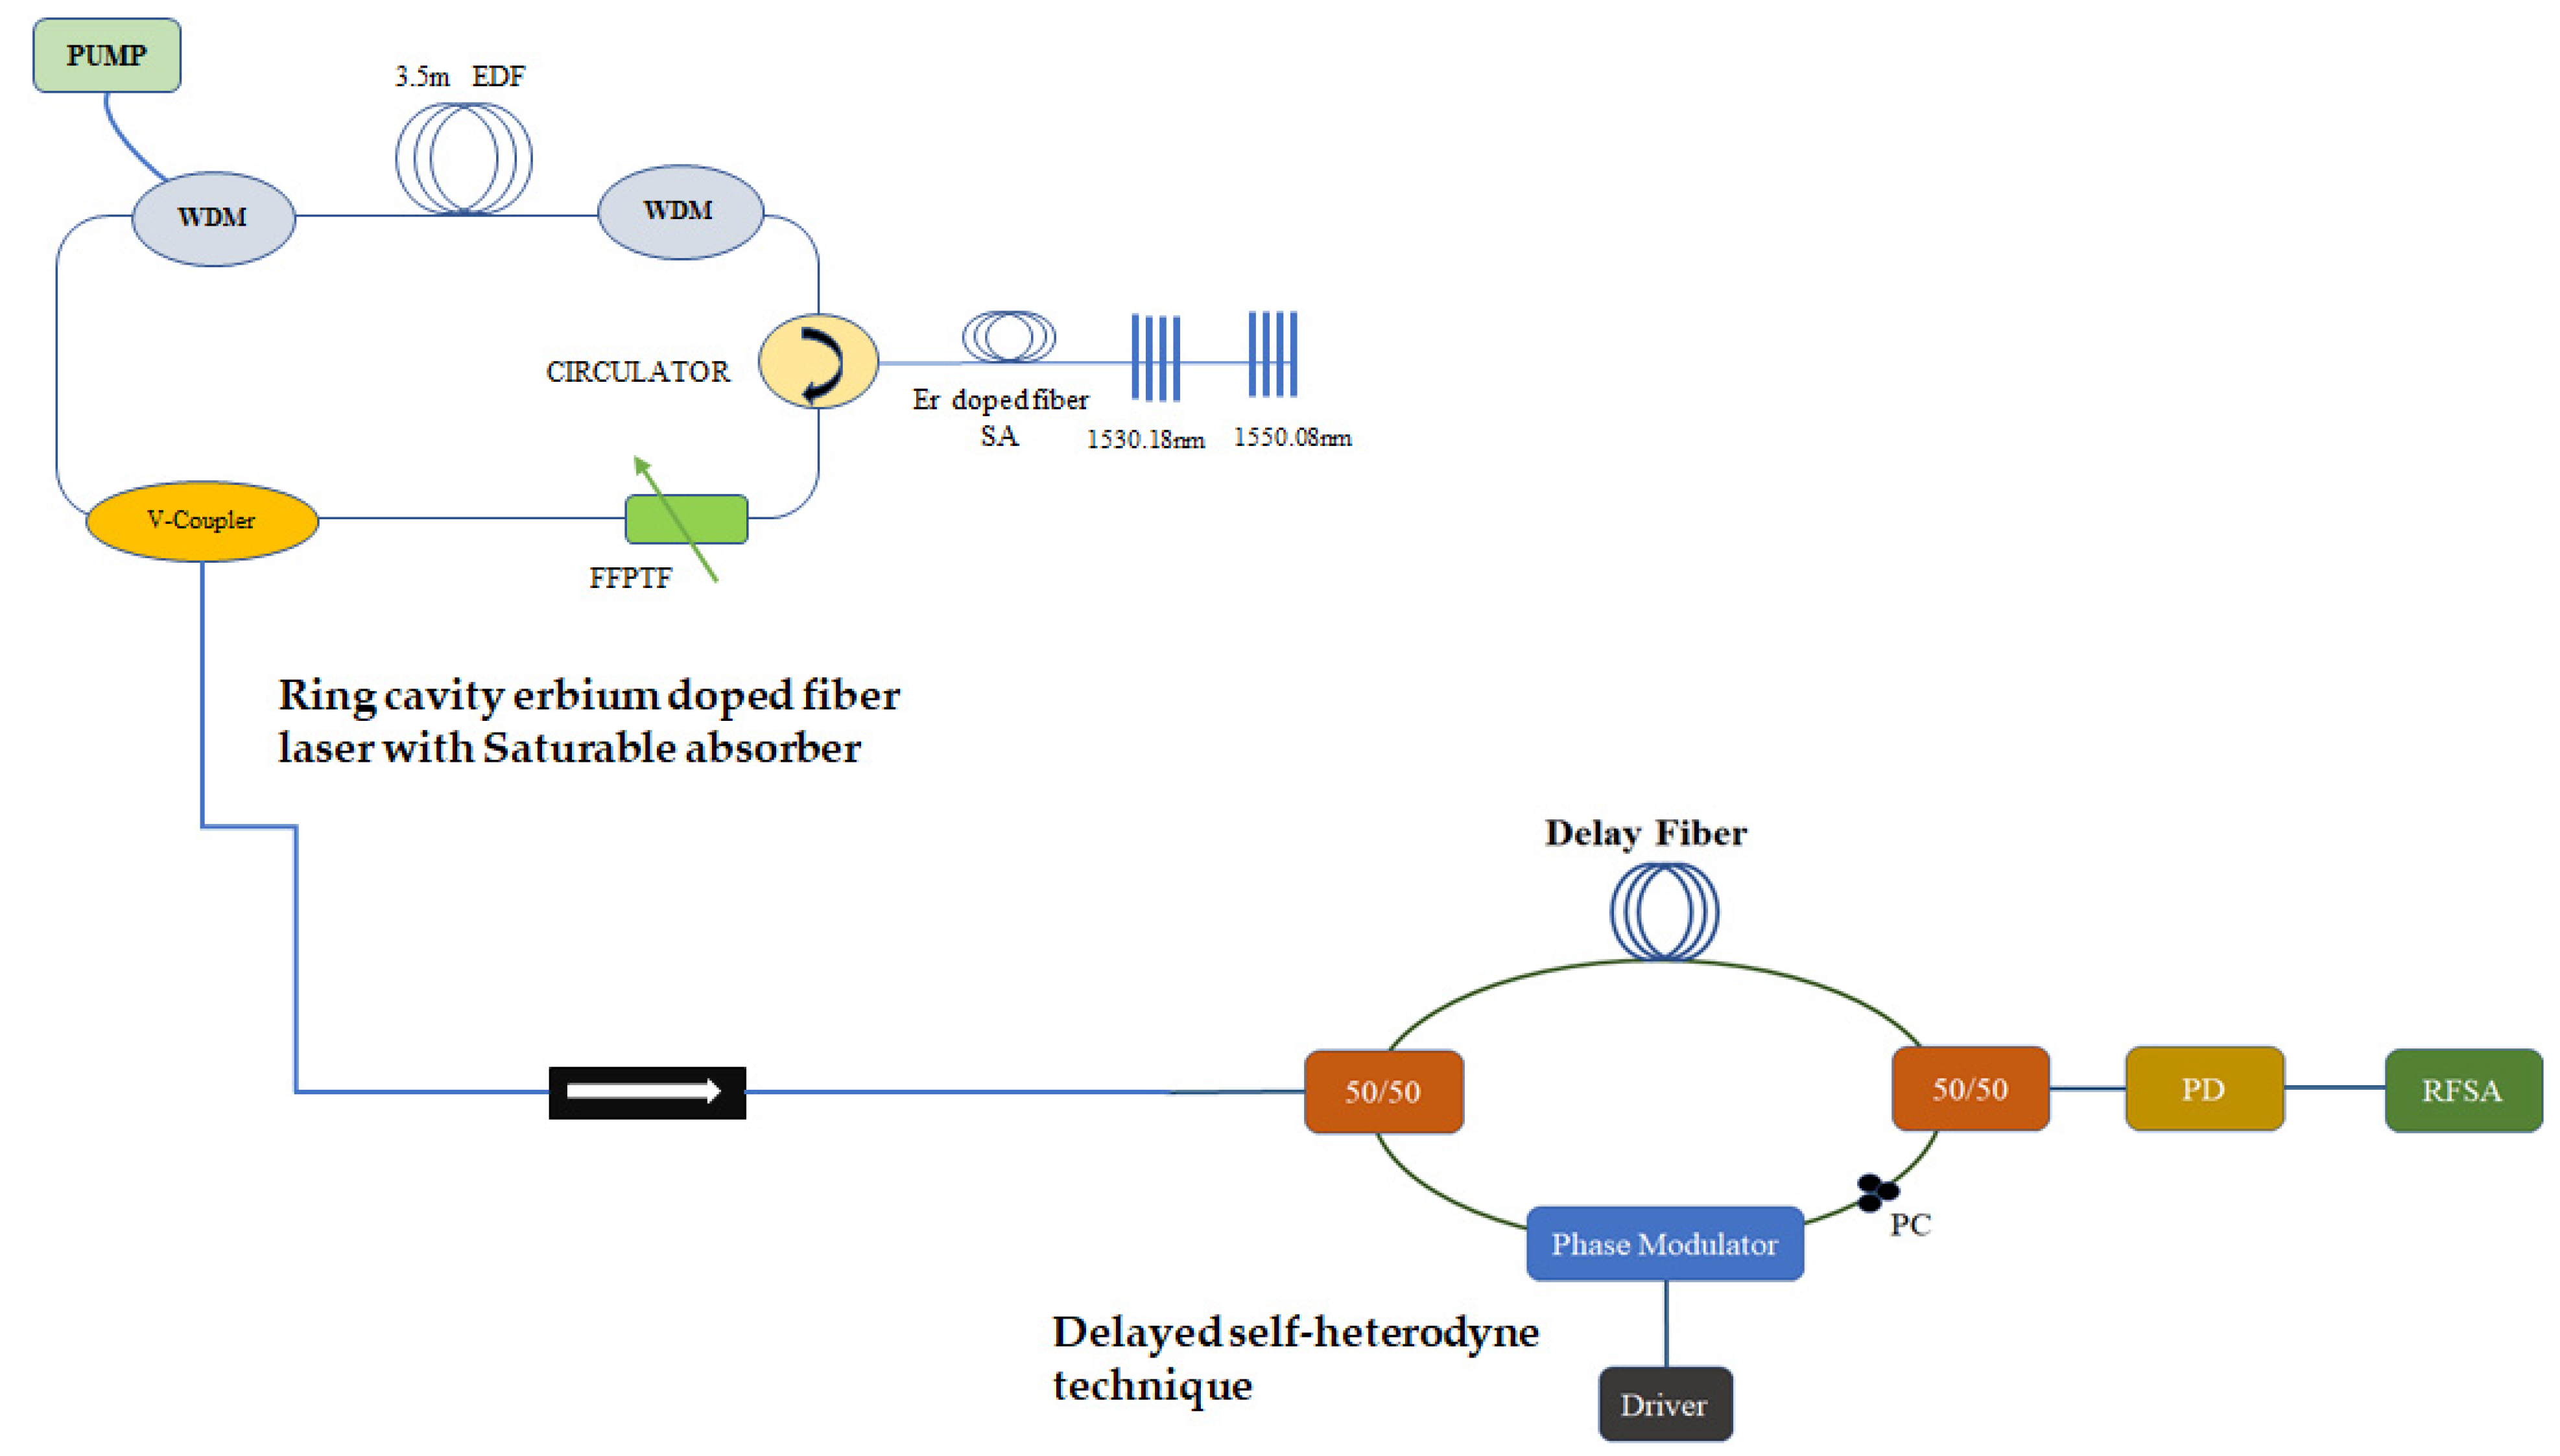
The proposed experimental configuration, as shown in
Figure 4, had a 976 nm pump diode, a 976/1550 nm WDM, a 3.5 m erbium-doped fiber, a circulator, two fiber Bragg gratings, a tunable filter, a saturable absorber (SA), and a variable coupler. The fiber Bragg grating had a bandwidth of 385 pm, wavelengths of 1530.18 nm and 1550.08 nm, and a reflectivity of 96.5%, respectively. The bandwidth of the tunable filter was 200 pm, and the free spectral range was 40 nm. The erbium was doped in M12 fiber, with an absorption of 11.38 dB/m at 976 nm and a nominal peak absorption of 17.16 dB/m at 1550 nm. The 976 nm pump laser diode was characterized to obtain the pump power in milliwatts for each equivalent controller current in mA. The variable coupler, tunable filter, FBG, and the circulator were all characterized to ensure each component or device was operating optimally before they were incorporated into the configuration. This was achieved by ensuring that the characteristics of each component corresponded with specifications on the manufacturer data sheet; we also ensured that we knew the value of loss introduced by each device in the configuration.
The pump power was introduced by considering the absorption coefficient of the erbium-doped fiber per unit meter. For 3.5 m of erbium with an absorption coefficient of 11.38 dB/m, the peak pump power had to be >39.83 dB to achieve population inversion of the fiber laser. The pump was applied to the erbium-doped fiber laser through the 980/1550 nm wavelengths, and the spectrum was absorbed by the erbium-doped fiber-generated spontaneous emission spectrum, while the residual pump power was transmitted through the second WDM. An optimal total cavity length was achieved at the length of 9.7 m; this was discovered by carefully inserting the component per time and measuring the cavity length.
The optical circulator ensured unidirectional operation of the fiber laser by taking the optical spectrum into the circulator through the unidirectional port 1. Port 2 of the circulator was a bidirectional port linking the two FBGs of 1530.18 nm and 1550.08 nm. A total of 96.5% of the laser spectrum was reflected from both FBGs into port 2 of the circulator and then transmitted from unidirectional port 3. The unidirectional port 1 and port 3 ensured clockwise propagation of the spectrum in and out of bidirectional port 2 of the circulator. The initial setup was performed without the tunable filter and the saturable absorber to enable the optimization of the laser in stages while building the setup. The variable coupler was used to couple the output of the laser to the output measuring equipment, such as OSA or the power meter. The variable coupler was used to balance the output power for the two wavelengths shown in
Figure 5 by adjusting the cavity loss.
5. Fiber Laser Optimization
To optimize the ring cavity erbium-doped fiber laser in our configuration, we needed to systematically build our setup and ensure optimal power budgeting. The systematic approach was achieved by adding to our setup one device after another and determining the loss in each step. Power budgeting gave us the amount of pump power that enabled laser output to be transmitted without the losses exceeding the laser gain.
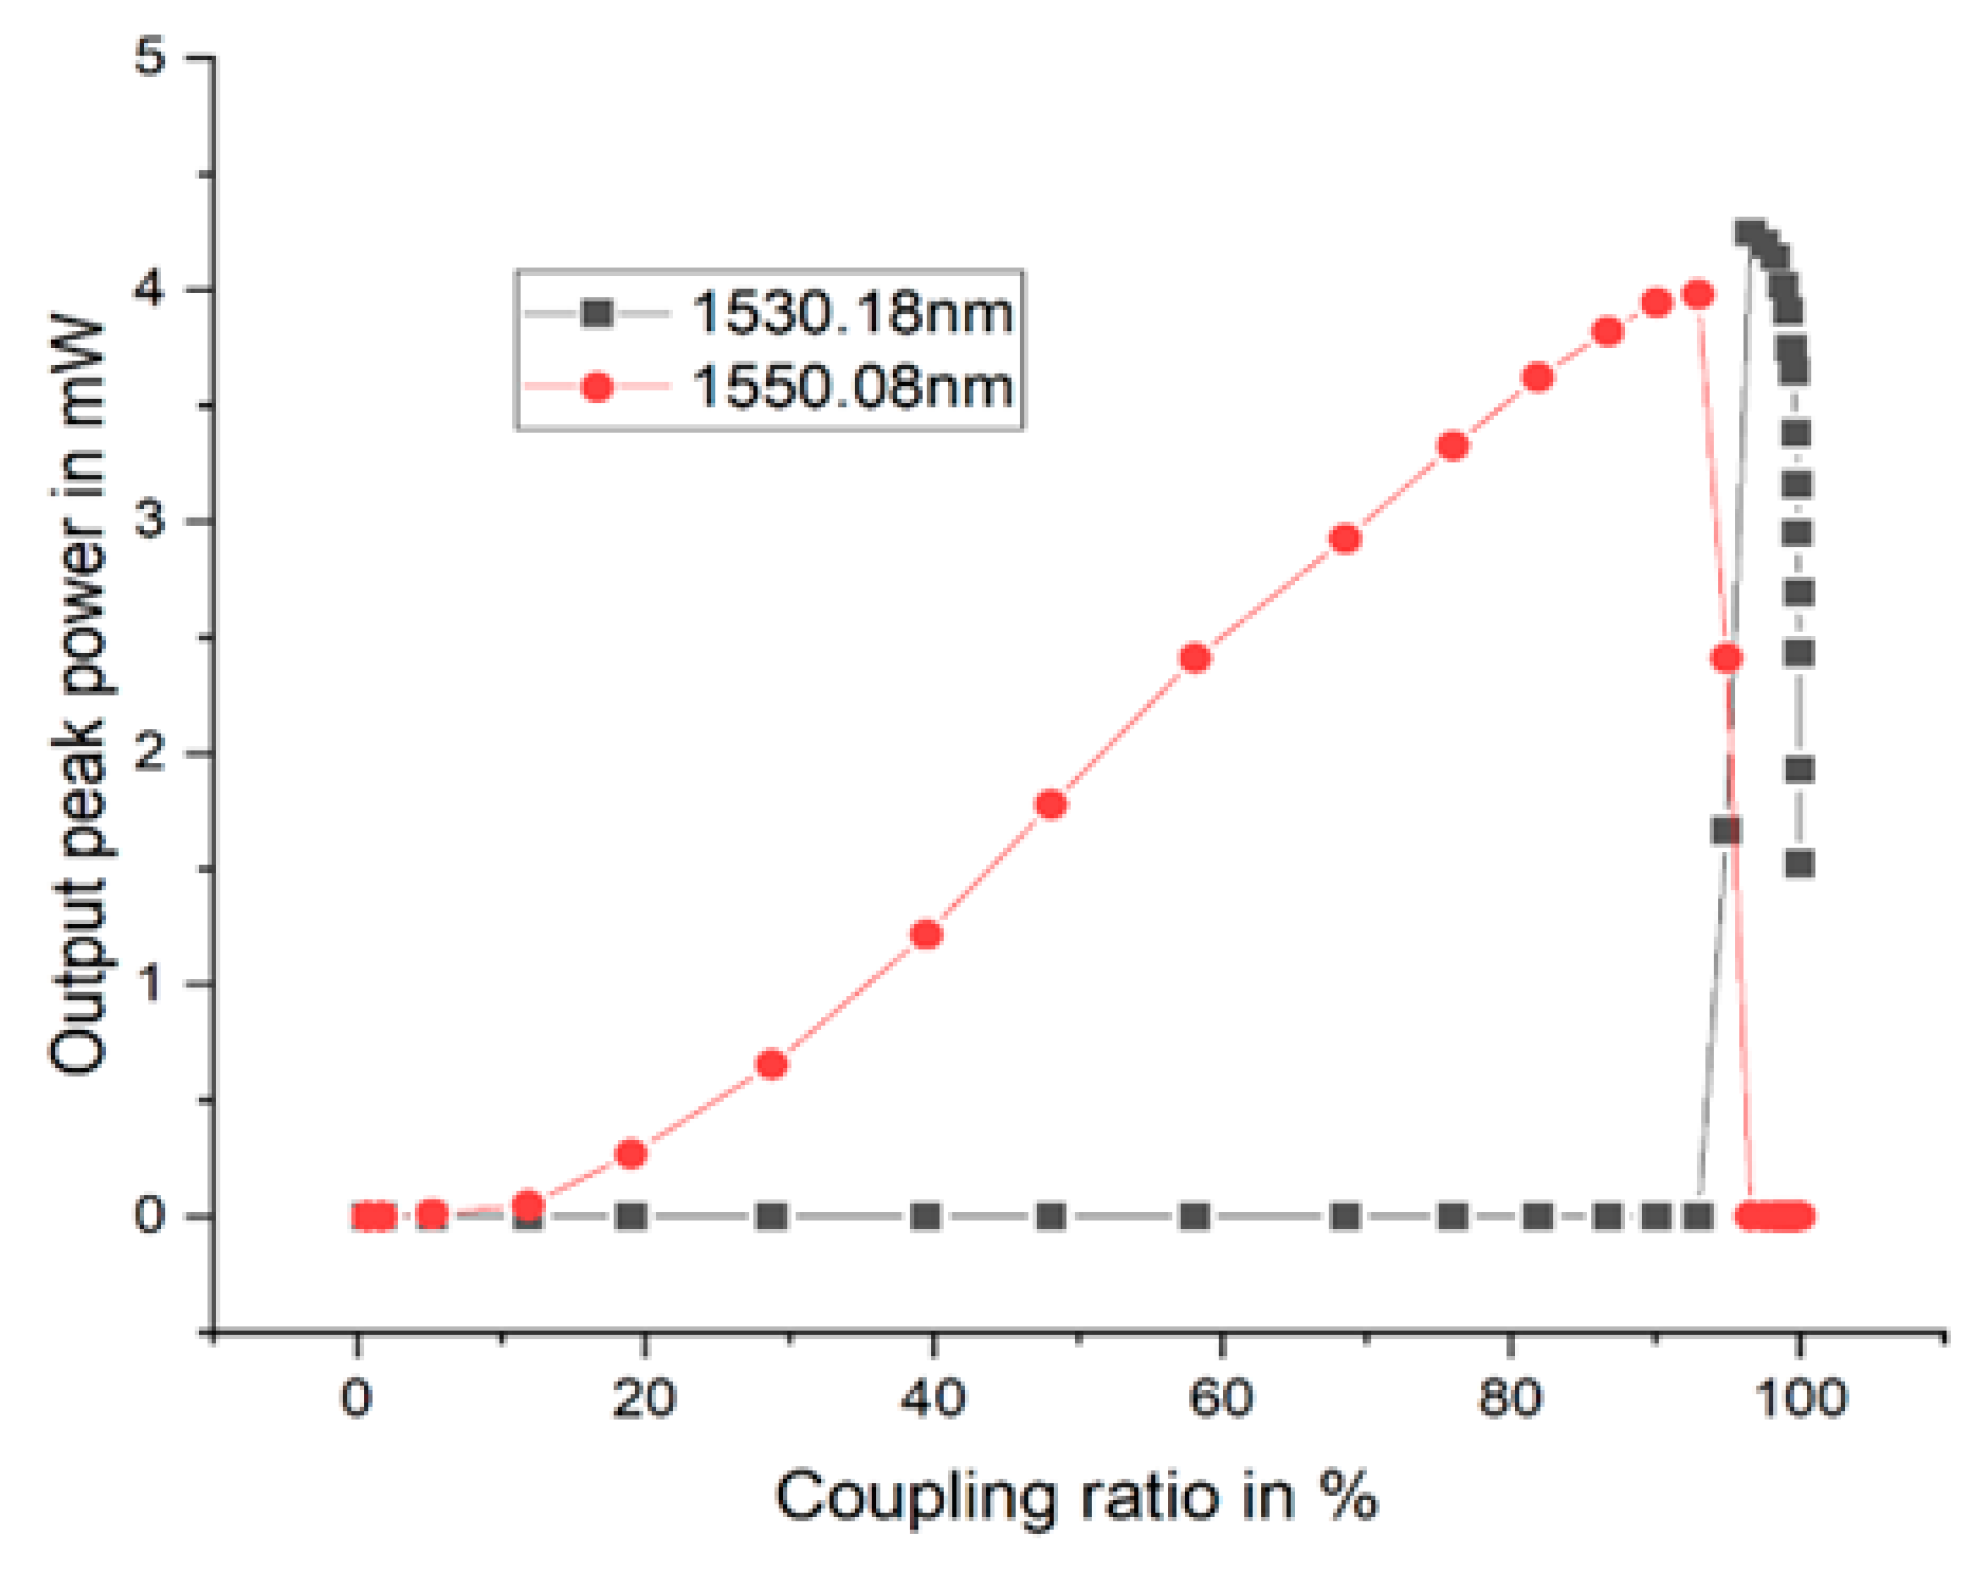
To obtain the optimal coupling ratio at which the output power in both transmitting wavelengths was balanced, we characterized the fiber laser by adjusting the knob on the variable coupler the output power obtained is represented in
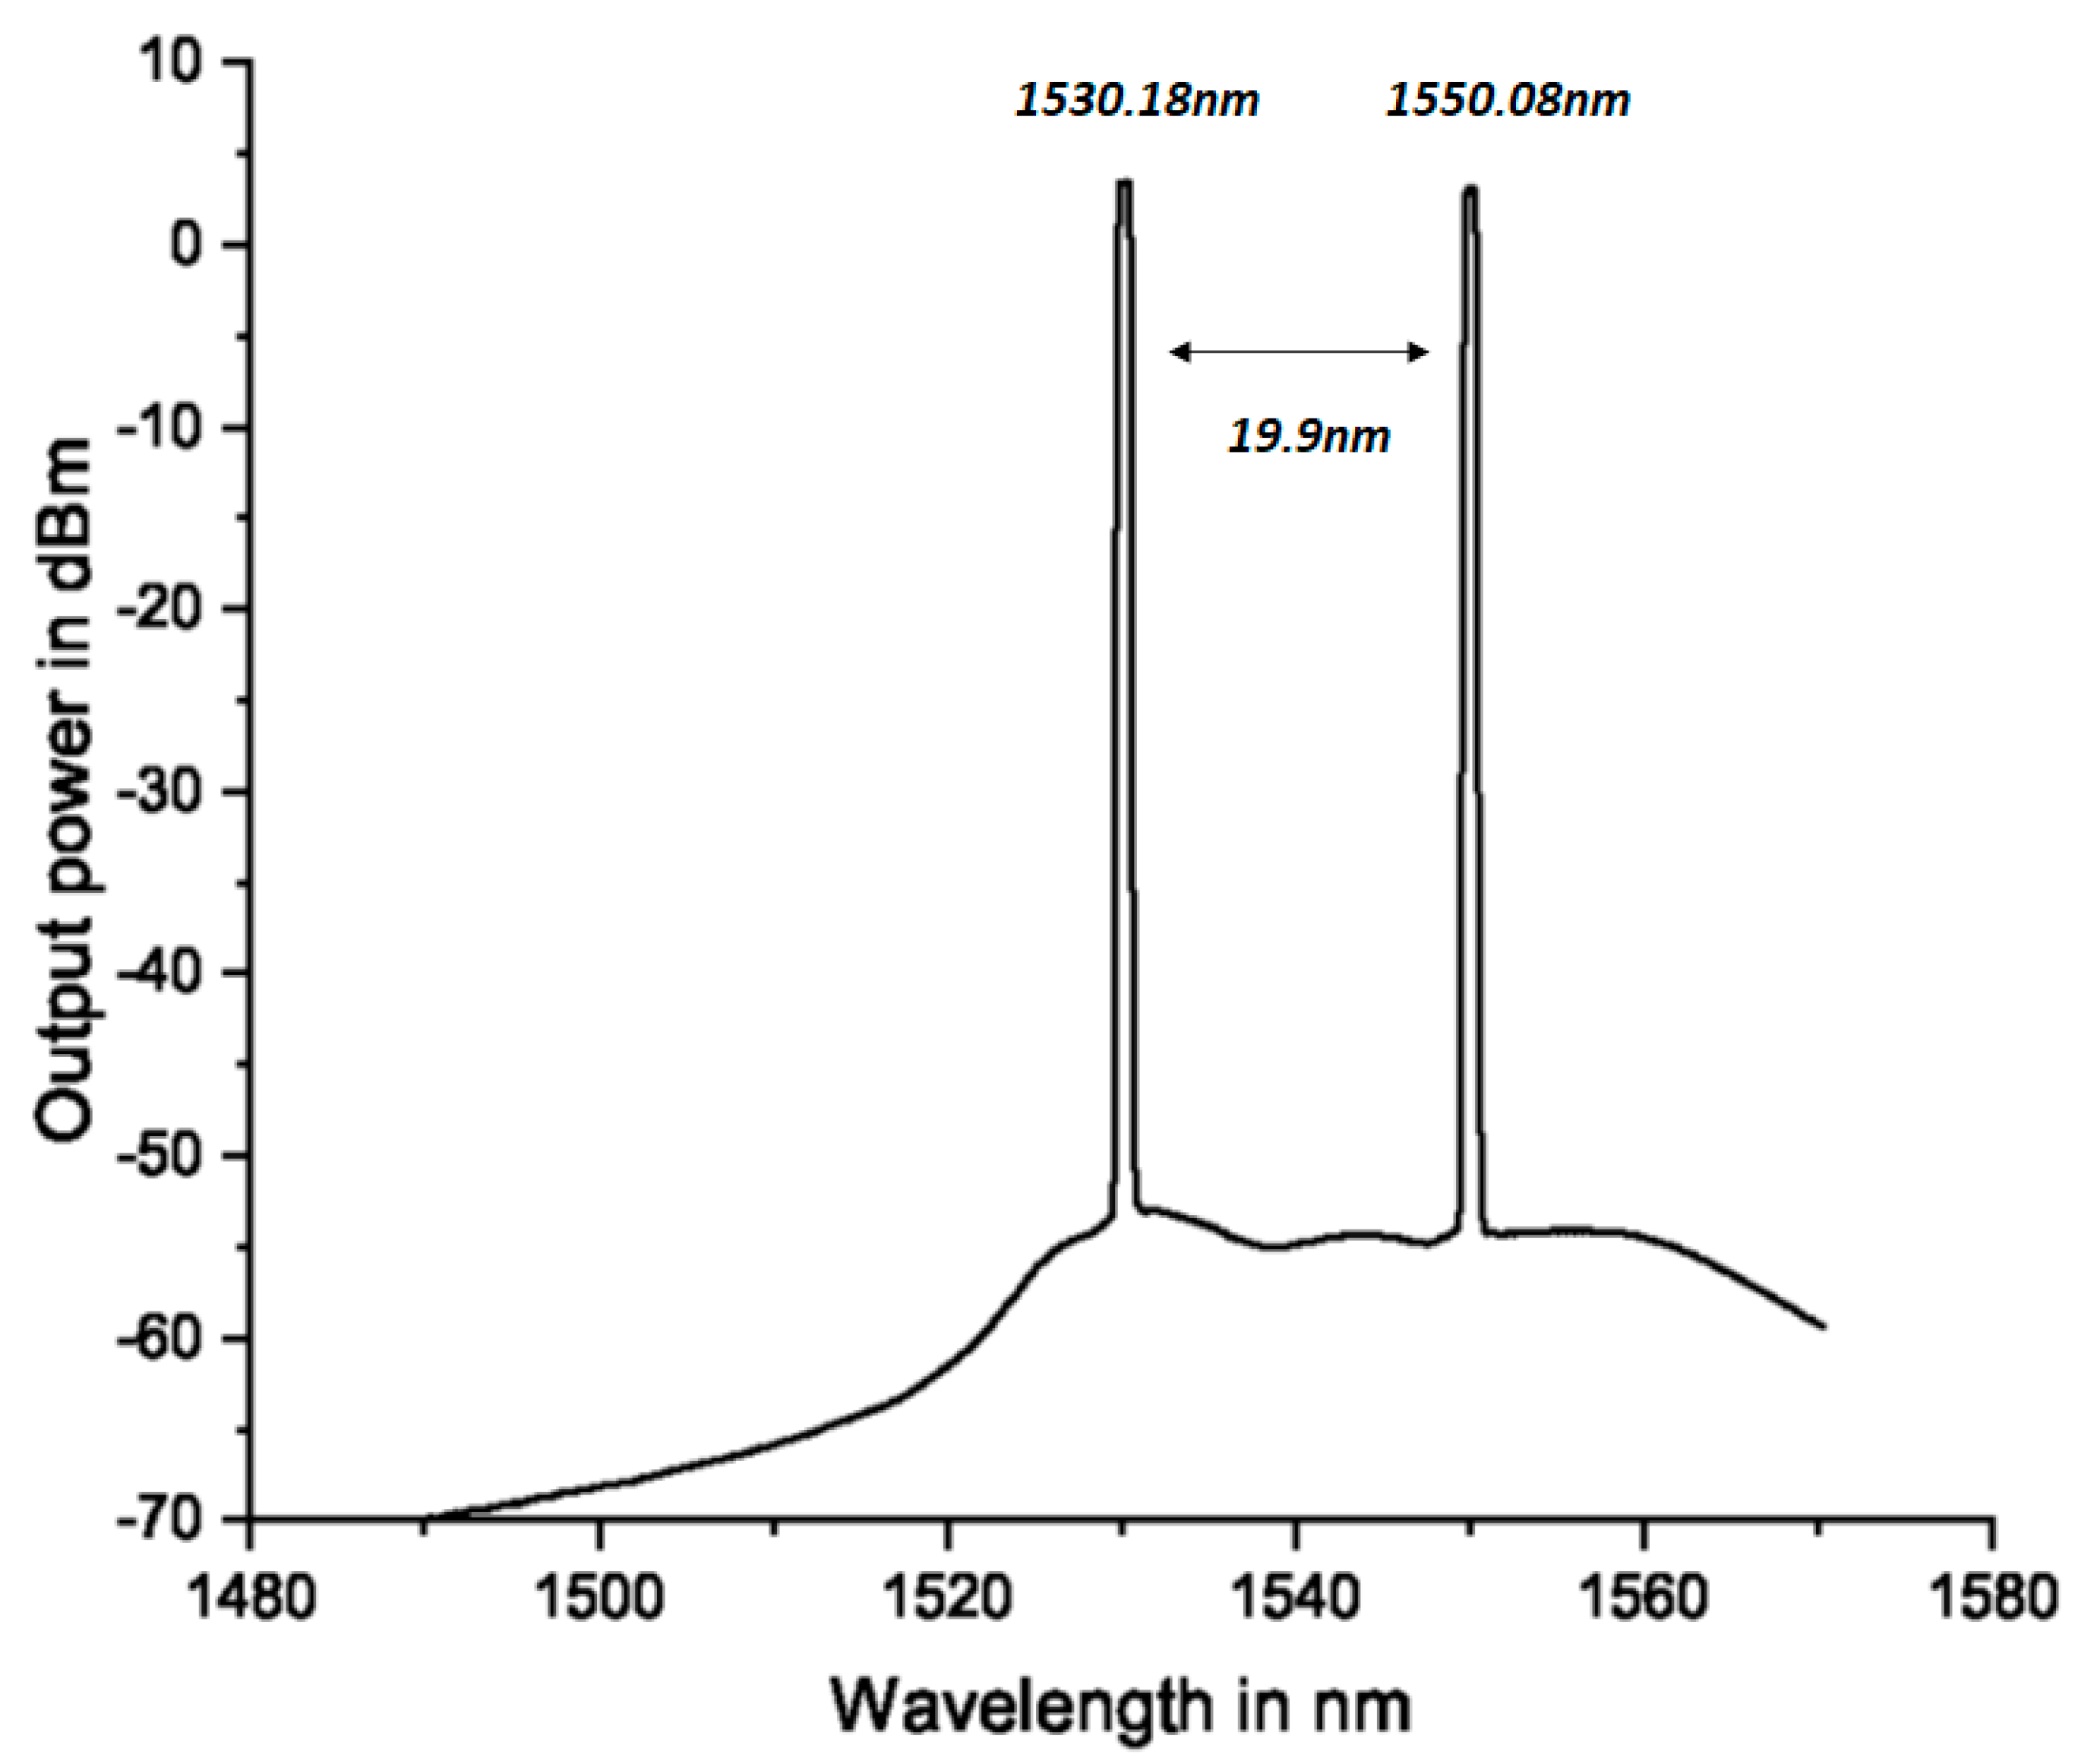
Figure 6 and measured using an optical spectrum analyzer. The output spectrum from the fiber laser was measured using an optical spectrum analyzer AQ6370D from Yokogawa Test and Measurement Corporations. The maximum input power of the optical spectrum analyzer was 20 dBm, so we designed our laser such that our maximum output power did not saturate the photodetector of the spectrum analyzer. The optical spectrum analyzer was set to a span of 80 nm, a resolution of 0.5 nm, and a ref level of 10 dB/div. The optimization of the coupling ratio was to balance the optical output power for the two wavelengths reflected from 1530.8 nm and 1550.08 nm, respectively. The optimization of the coupling ratio was performed without the tunable filter or the saturable absorber in the configuration. Using a pump power of 100 mW, a balanced output power of 3.4 mW was obtained for wavelength 1530.18 nm, and 3.1 mW was obtained for 1550.08 nm, respectively. The balanced output power was obtained at a coupling ratio of 95% and an optical signal-to-noise ratio (OSNR) of 61 dB for the laser output spectrum for each wavelength, as shown in
Figure 5.
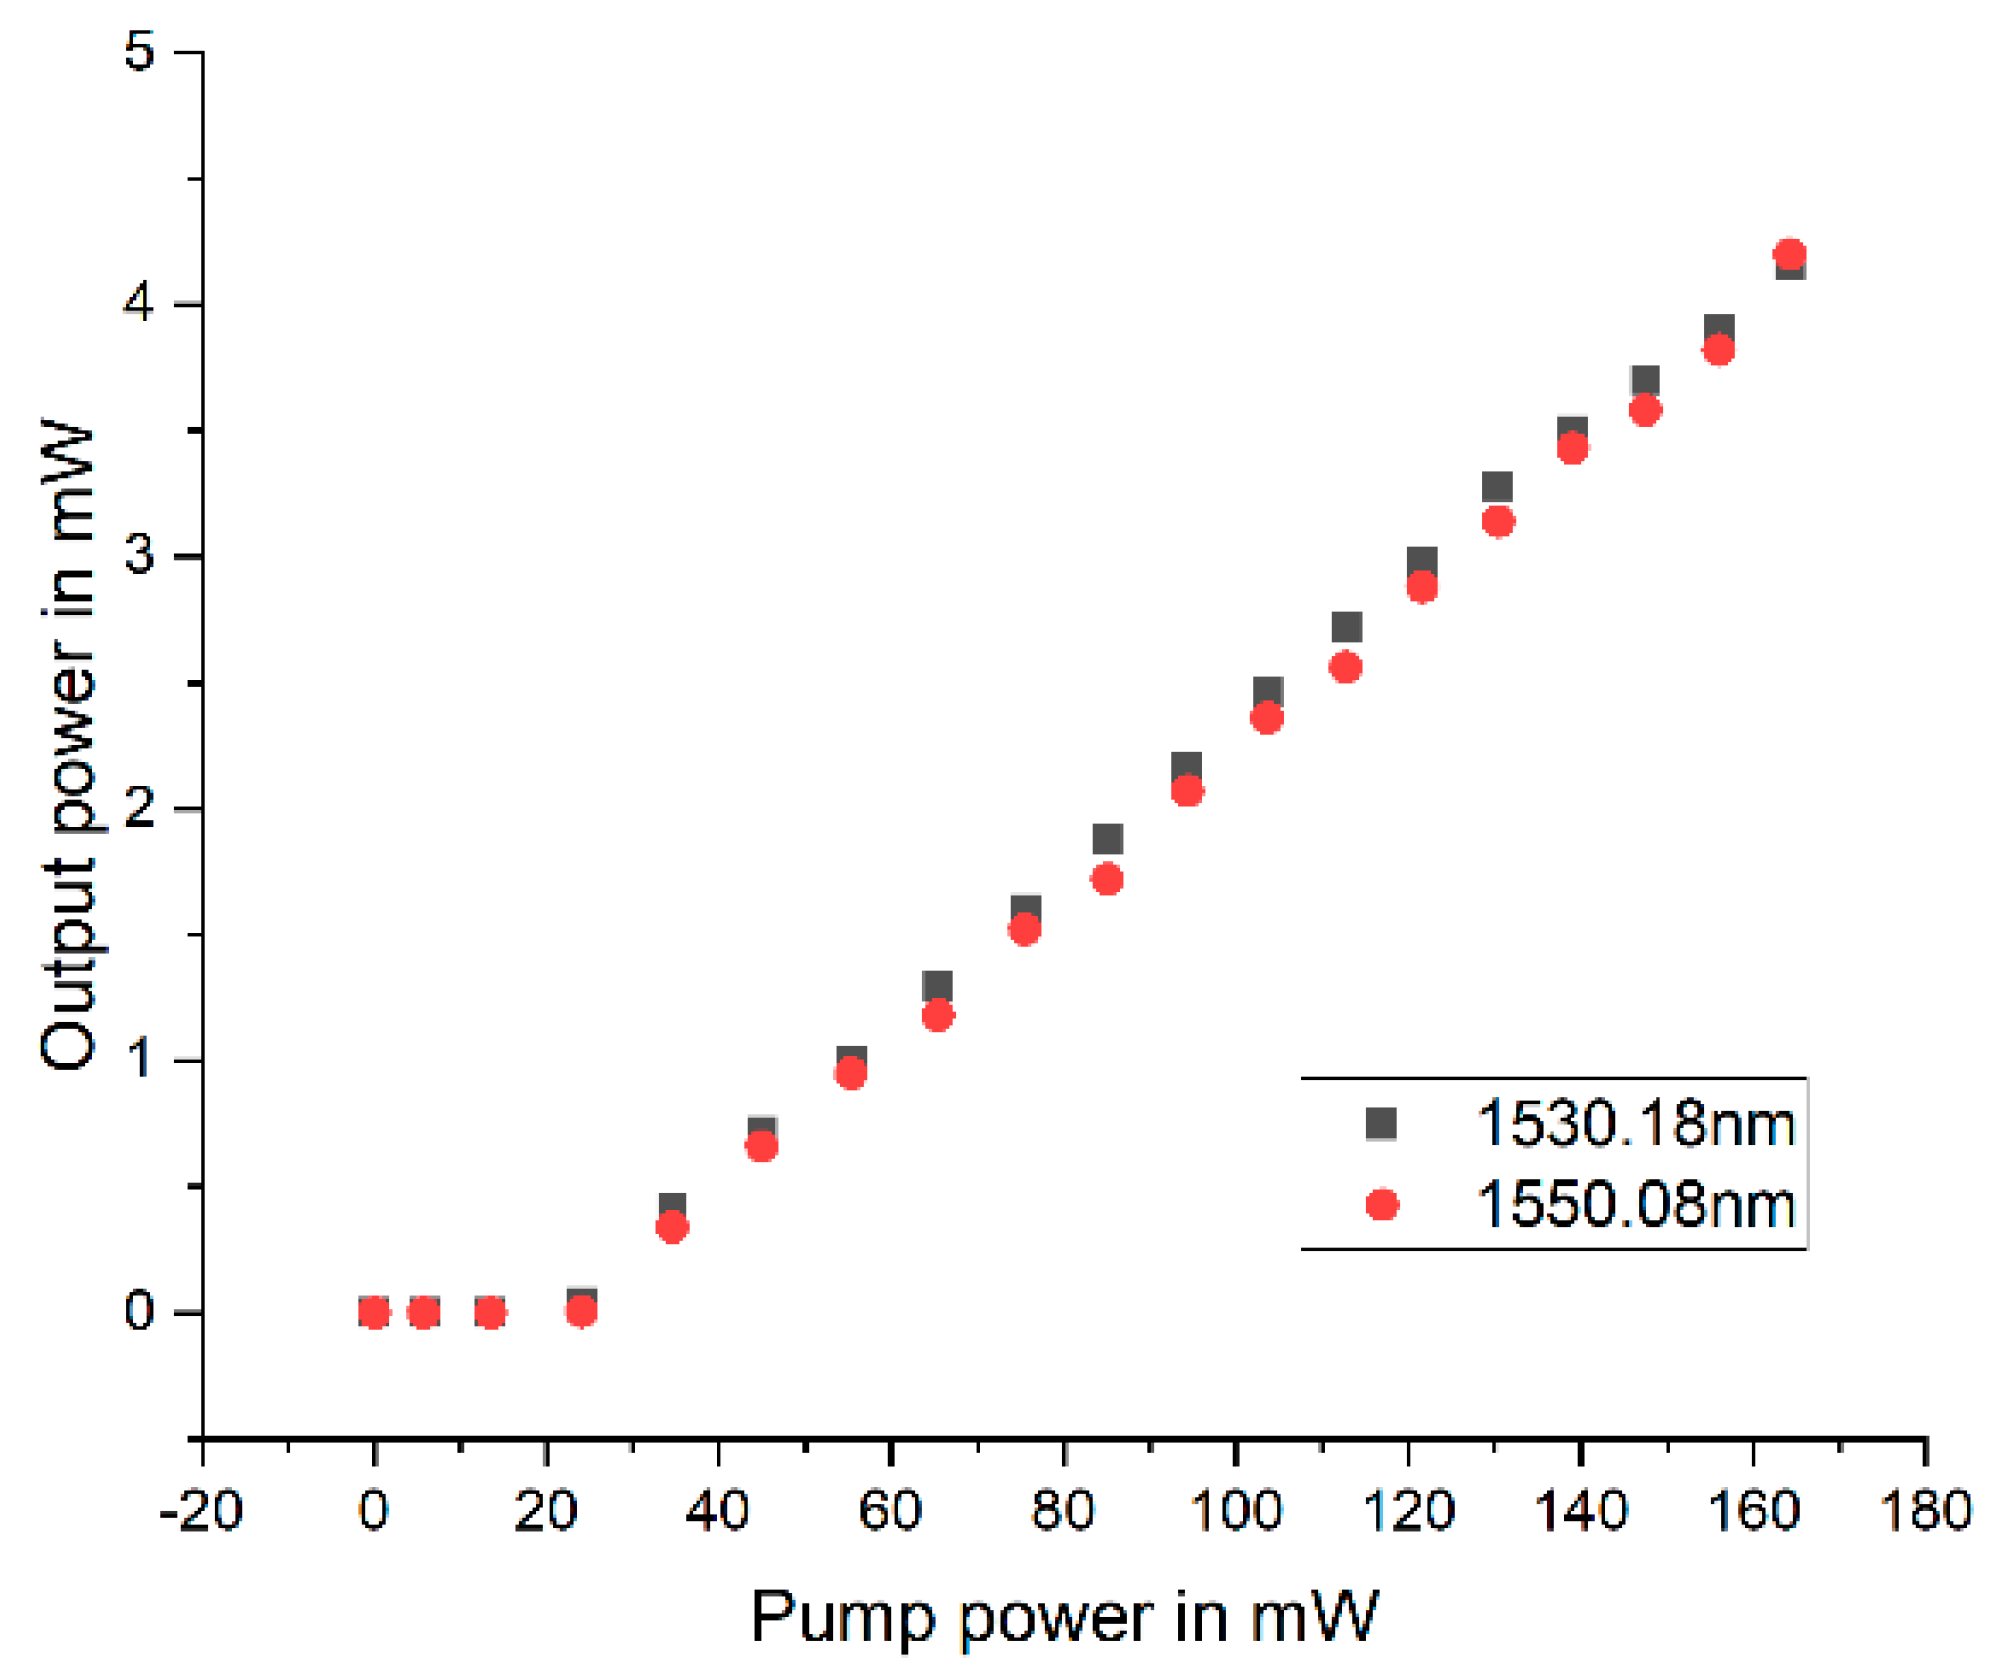
We characterized the fiber laser pump power with respect to output power by introducing pump power from 10 mW–100 mW. The fiber laser threshold was obtained, and the behavior of the laser as the pump power increased was observed to ensure we did not saturate the gain medium. The pump power introduced from 10 mw–180 mw is shown in the plot in
Figure 7. The optimal value for the pump power at which population inversion was achieved without saturating the gain from our design was chosen to be 100 mW. Having achieved our first goal, which was optimal pump power and optimal coupling ratio, the tunable filter was spliced to the configuration.
Introducing the tunable filter, the output of the laser was measured in the optical spectrum analyzer while taking into account the insertion loss introduced by the tunable filter. The tunable filter was introduced without the saturable absorber. The tunable filter enabled us to tune the fiber laser output between the two wavelengths by changing the applied bias voltage. A wavelength of 1530.18 nm transmitted at a bias voltage of 3.6 V, while a wavelength of 1550.08 nm transmitted at a bias voltage of 9.8 V. To avoid drift in the wavelength, the tunable filter was kept in a controlled environment so that it was not influenced in any way by atmospheric temperature. The optical wavelength of 1530.18 nm experienced 0.965 dB of insertion loss, while for 1550.08 nm, it was a 0.411 dB insertion loss. The fiber laser stability was measured three times by observing the output power using an optical spectrum analyzer for different coupling ratios at 5 min intervals. The variation in the output power at a 99.97% coupling ratio was around 0.10 dB at 1530.18 nm and 0.08 dB at 1550.08 nm.
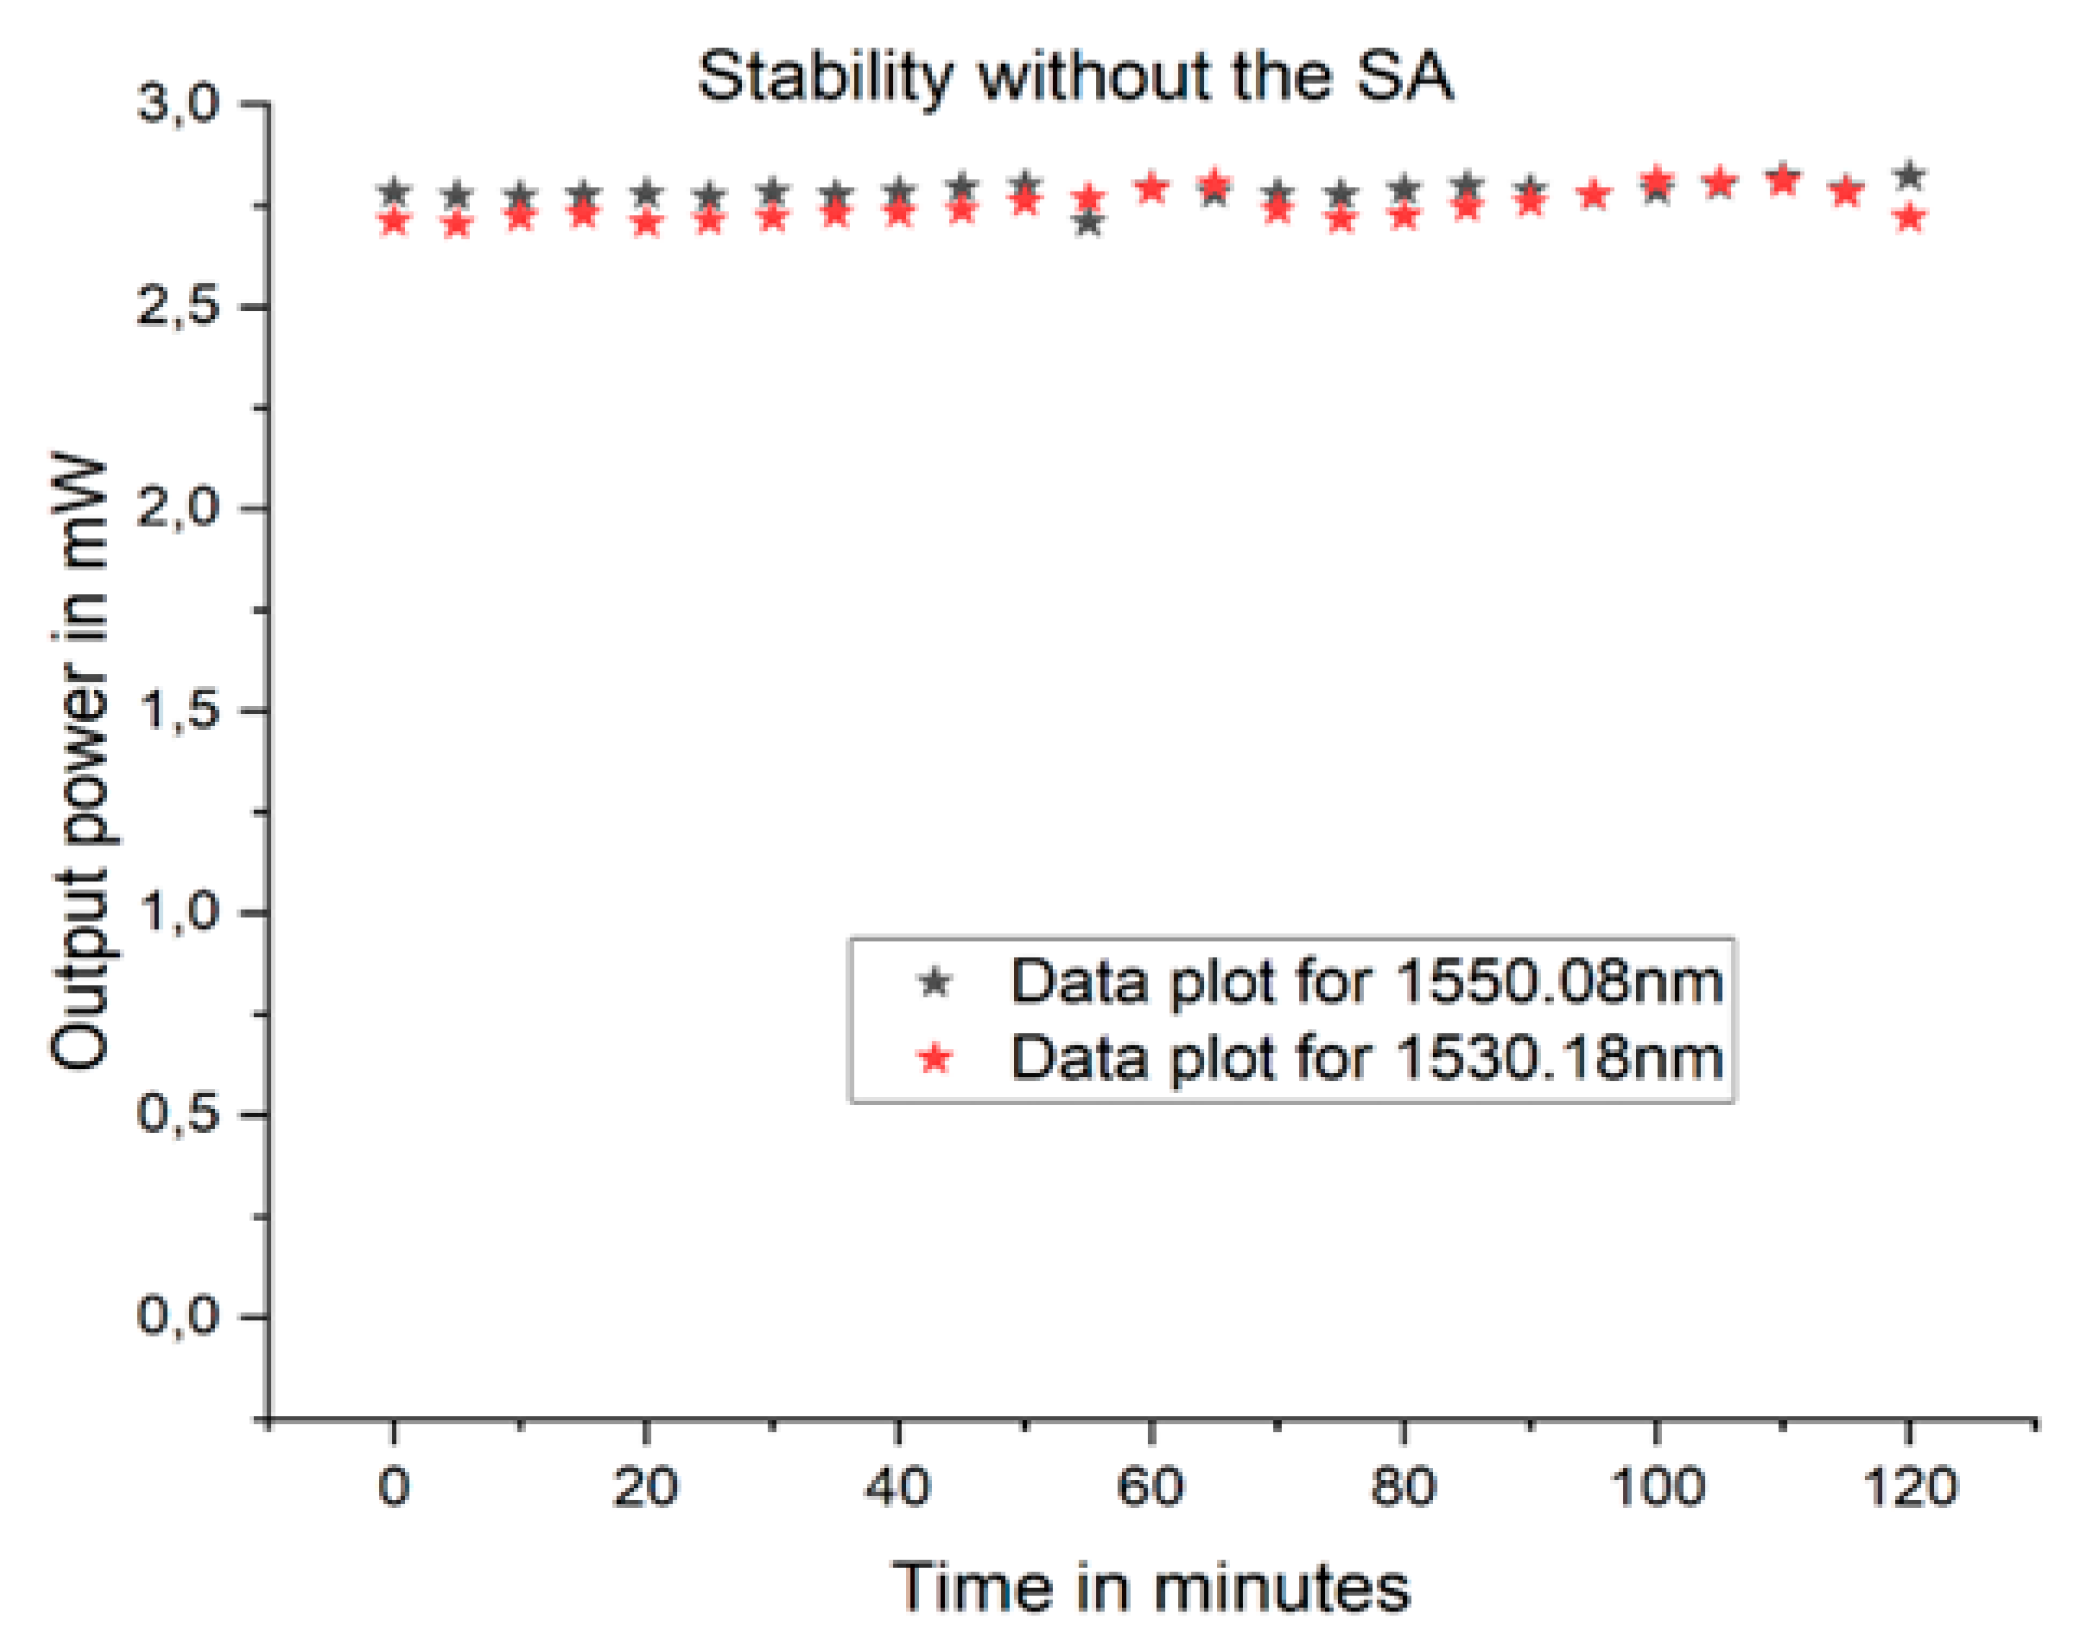
At a 98% coupling ratio, the output for the wavelength of 1530.18 nm had an output power of 6.17 mW (7.9 dBm). We had an output power variation of 0.007 dB at three measurement intervals of 5 min. The maximum output power for the 1550.08 nm wavelength was obtained at a coupling ratio of 81.8% and at a value of 5.59 mW (7.47 dBm), with a variation of 0.008 dB at three measurement intervals of 5 min. At the coupling ratio where the balanced output power for each wavelength was obtained, we observed the stability over 2 h at intervals of 5 min. Output power variations of 0.177 dB and 0.169 dB were achieved for the optical wavelengths of 1550.08 nm and 1530.18 nm, respectively, as shown in
Figure 8.
The saturable absorber was added to the fiber laser configuration, as shown in
Figure 4. The stability of the output power was measured, and the result showed no visible fluctuation in the amplitude of the output power for both wavelengths measured with an optical spectrum analyzer. The length of the erbium-doped fiber used as the saturable absorber was 0.5 m. Since our focus was mainly to achieve a more stable output power and a narrow linewidth, we did not optimize the saturable absorber.
6. Linewidth Measurement
The configuration shown in
Figure 4 was used to measure the linewidth of the fiber laser before and after introducing the saturable absorber into the fiber laser. The delayed self-heterodyne technique was practically used for the linewidth measurement. The delayed self-heterodyne technique was implemented by tuning the fiber laser output wavelength between 1530.18 nm and 1550.08 nm per time. This was achieved using the tunable filter and adjusting the applied bias voltage on the tunable filter. The self-heterodyne technique used a delayed line Mach–Zehnder interferometer, which comprised of two 50/50 three-port optical couplers, a phase modulator, a polarization controller (PC), and a photodetector, as shown in [
41,
42]. The output of the fiber laser was used as the input of the interferometer used for the linewidth measurement. The 50/50 coupler split the input of the interferometer into two spectrums of the same amplitude, traveling to different parts. A part of the spectrum traveled through a delayed line of 30 km such that the resolution of the self-delayed heterodyne configuration was 6.6 kHz, corresponding to the (30 km) delayed line. The resolution limit, or free spectral range (
FSR), of the delayed line interferometer was obtained using the expression in Equation (4) below.
where
c is the speed of light in the medium,
n is the refractive index of fiber medium, and
l is the length of the delayed line.
The phase modulator was used to achieve frequency shift to isolate the beat frequency from the default frequency in the spectrum analyzer. The MX10 driver was used to modulate the JDSU SN524022F intensity modulator, and the Agilent E8257C radio frequency spectrum analyzer (RFSA) was used to measure the beat frequency. Using the optical photodetector FPD 510, the beat signal was captured and displayed on the RFSA.
To measure the linewidth, four important variables were considered, including span, reference level, resolution bandwidth, and video bandwidth. The span, which indicates the frequency range, was measured at 600 kHz, at a center frequency of 80 MHz, to ensure that dynamic changes in the measured spectrum were detected; this influences the reference level. The resolution bandwidth (RBW) of 4 kHz was set; this influenced the displayed average noise floor level (DANL) and improved the signal-to-noise ratio. The careful selection of RBW was to increase selectivity, reduce the noise floor so that weak signals could be measured, and increase the sweep time of RFSA. The final variable video bandwidth (VBW) only affected the display signal and not the measured signal. The VBW affected the sweep time of the RFSA such that the narrow VBW increased the sweep time. The measurement of 40 kHz was chosen for our experiment.
The fiber laser configurations with and without the saturable absorber were used to characterize the optical linewidth.
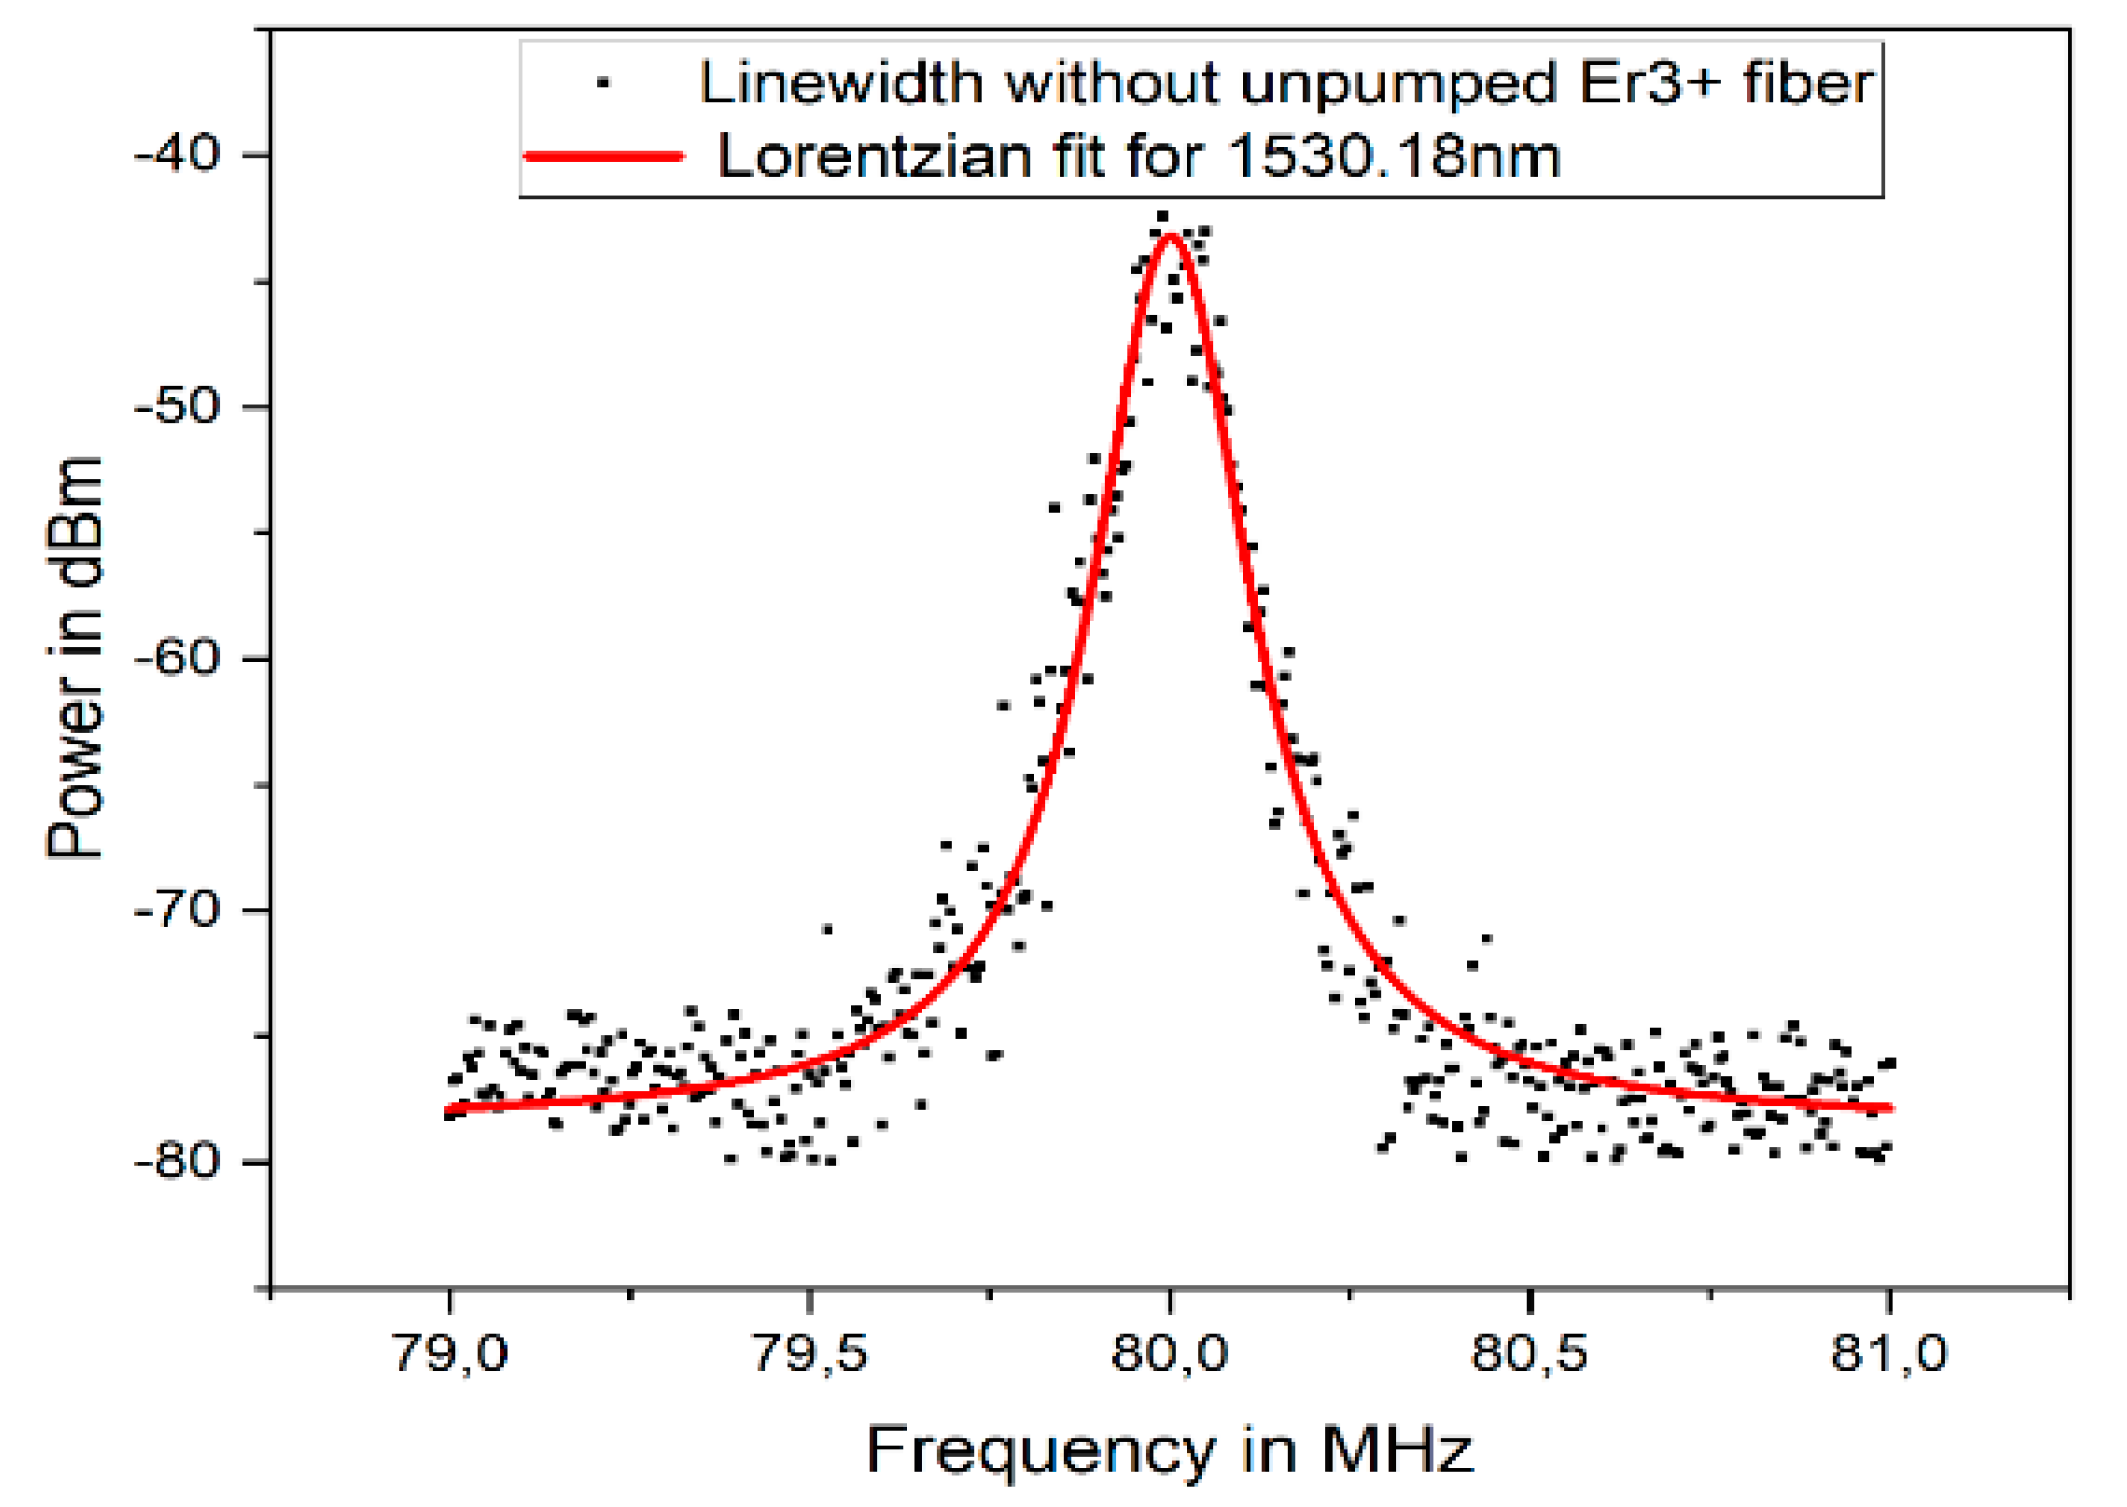
The measured linewidth was 27.7 kHz, with a noise floor of −10 dB at a 1530.18 nm wavelength. This is illustrated in
Figure 9. The linewidth in this instance was measured without the saturable absorber connected to the fiber laser. Since the fiber laser configuration was designed to have two distinct wavelengths, a tunable filter had to be used to select each respective wavelength. The tunable filter enabled one to tune the fiber laser output between the two wavelengths by changing the applied bias voltage. A wavelength of 1530.18 nm transmitted at a bias voltage of 3.6 V, while a wavelength of 1550.08 nm transmitted at a bias voltage of 9.8 V. To avoid a drift in wavelength, the tunable filter was kept in a controlled environment, thereby also limiting the influence of atmospheric temperature.
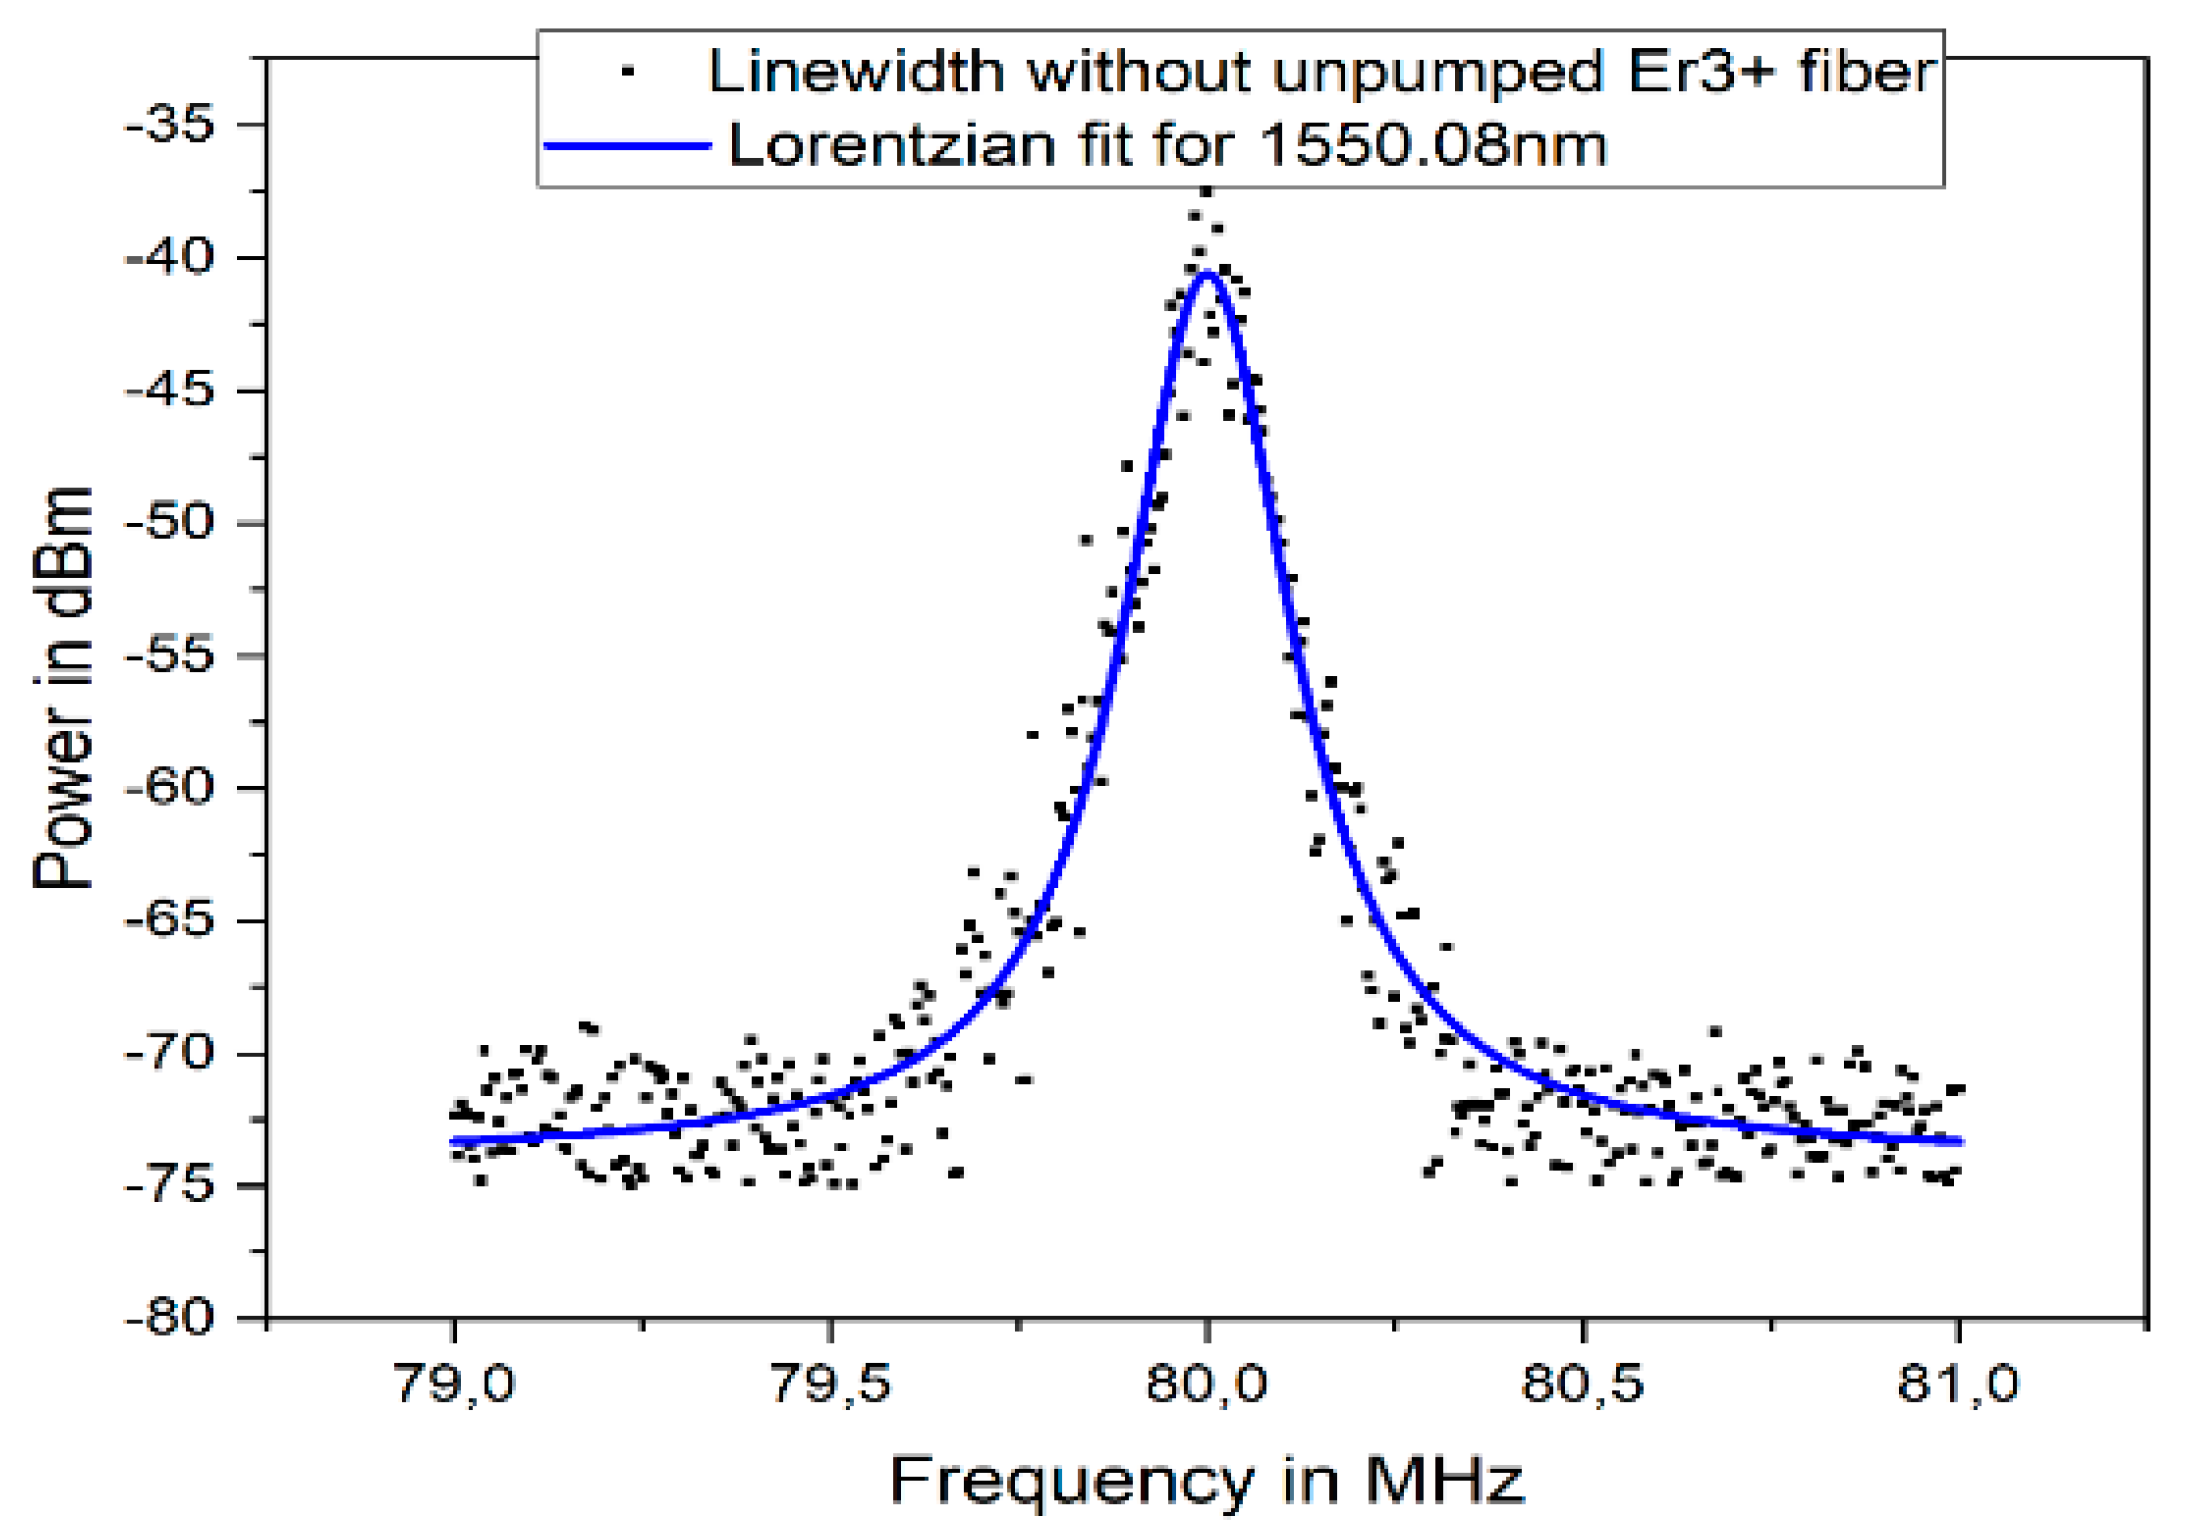
The linewidth of the second wavelength of 1550.08 nm was measured next, and the plot is presented in
Figure 10. As indicated in
Figure 10, a FWHM occurred at 1550.08 nm, which showed a linewidth of 28.3 kHz at 1550.08 nm.
The effect of the unpumped erbium-doped fiber on the configuration using 0.5 m of erbium-doped fiber was examined. The unpumped erbium-doped fiber used with a fiber Bragg grating accomplished the following: It attenuated the spectrum in the unpumped fiber due to absorption, and it modified the spectral response of the output. When the spectrum from pumped erbium-doped fiber traveled through the unpumped fiber, it acted as a long grating and as a result, narrowed the output spectrum from the passive uniform FBG [
43]. The unpumped fiber was always positioned such that the laser spectrum would propagate bi-directionally within it to form a standing wave. The standing wave was formed by laser spectrum propagating into the unpumped fiber and the counter-propagating reflection from the FBG. These occurrences influenced the spectrum of the fiber laser, thereby narrowing its spectral linewidth.
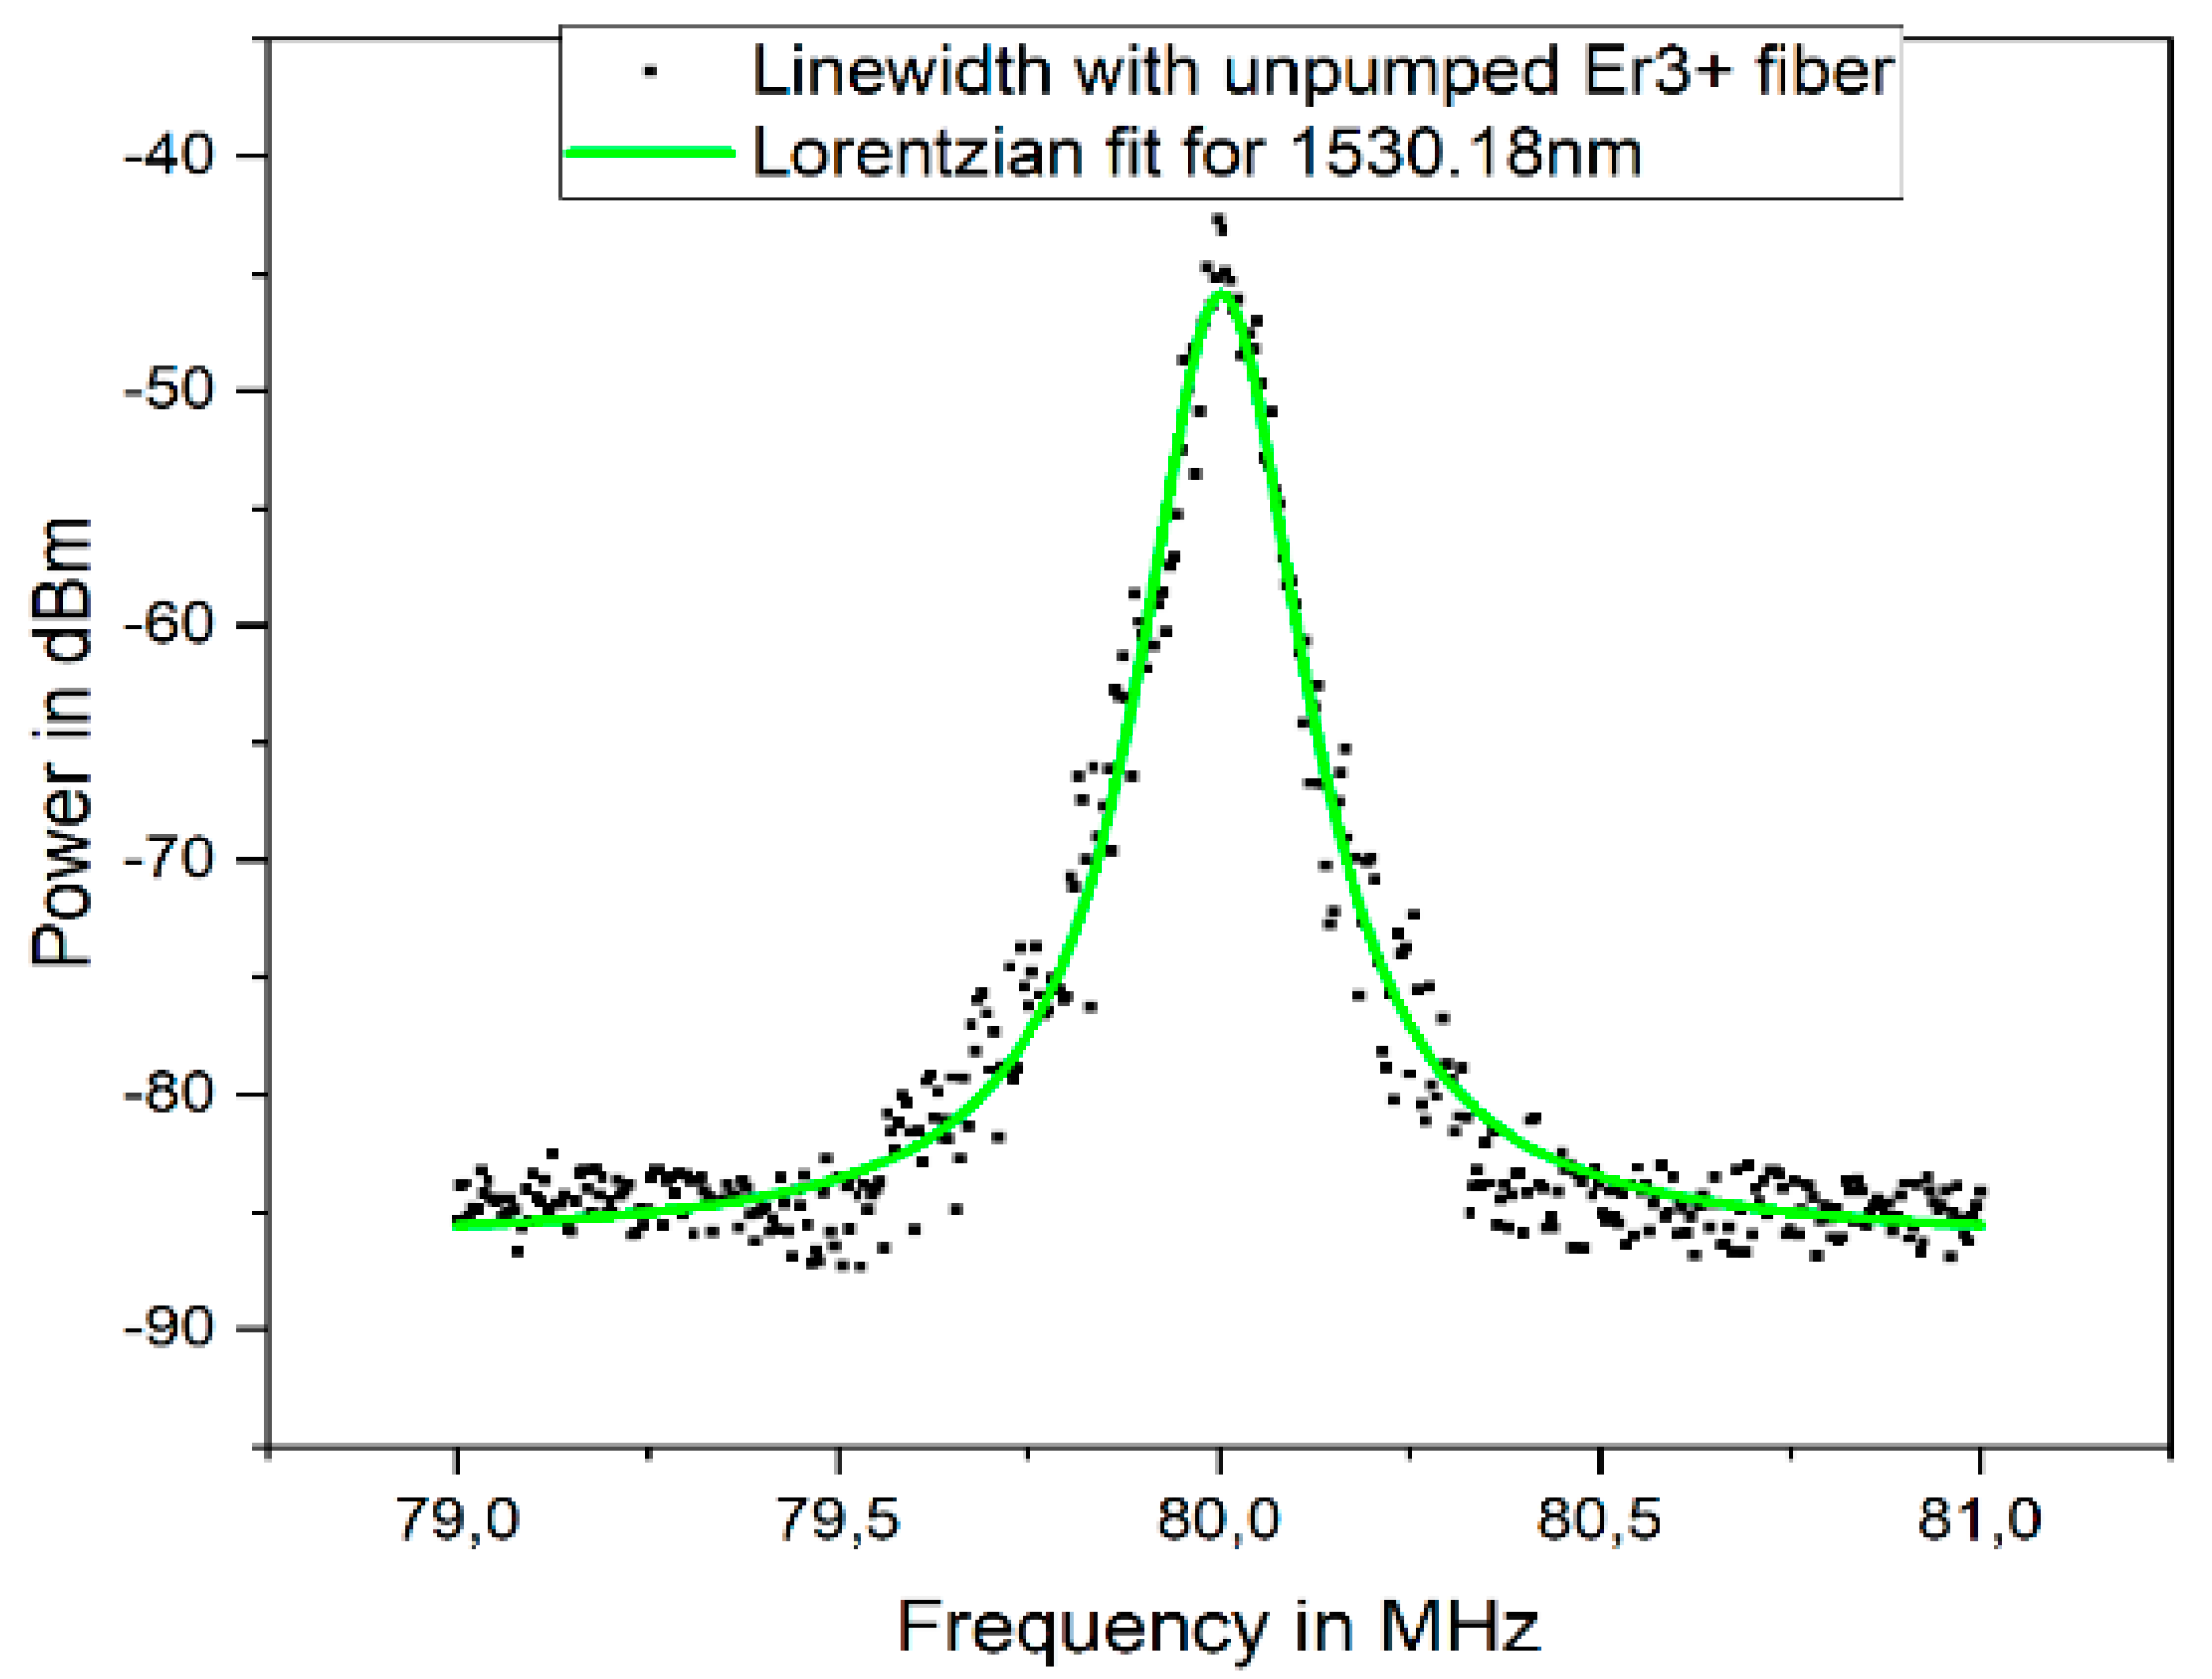
The linewidth was measured after incorporating a 0.5 m unpumped erbium-doped fiber as a saturable absorber in the configuration. This is shown above in
Figure 11. The estimated optical linewidth for a wavelength of 1530.18 nm was measured, and a linewidth of 25.3 KHz was obtained.
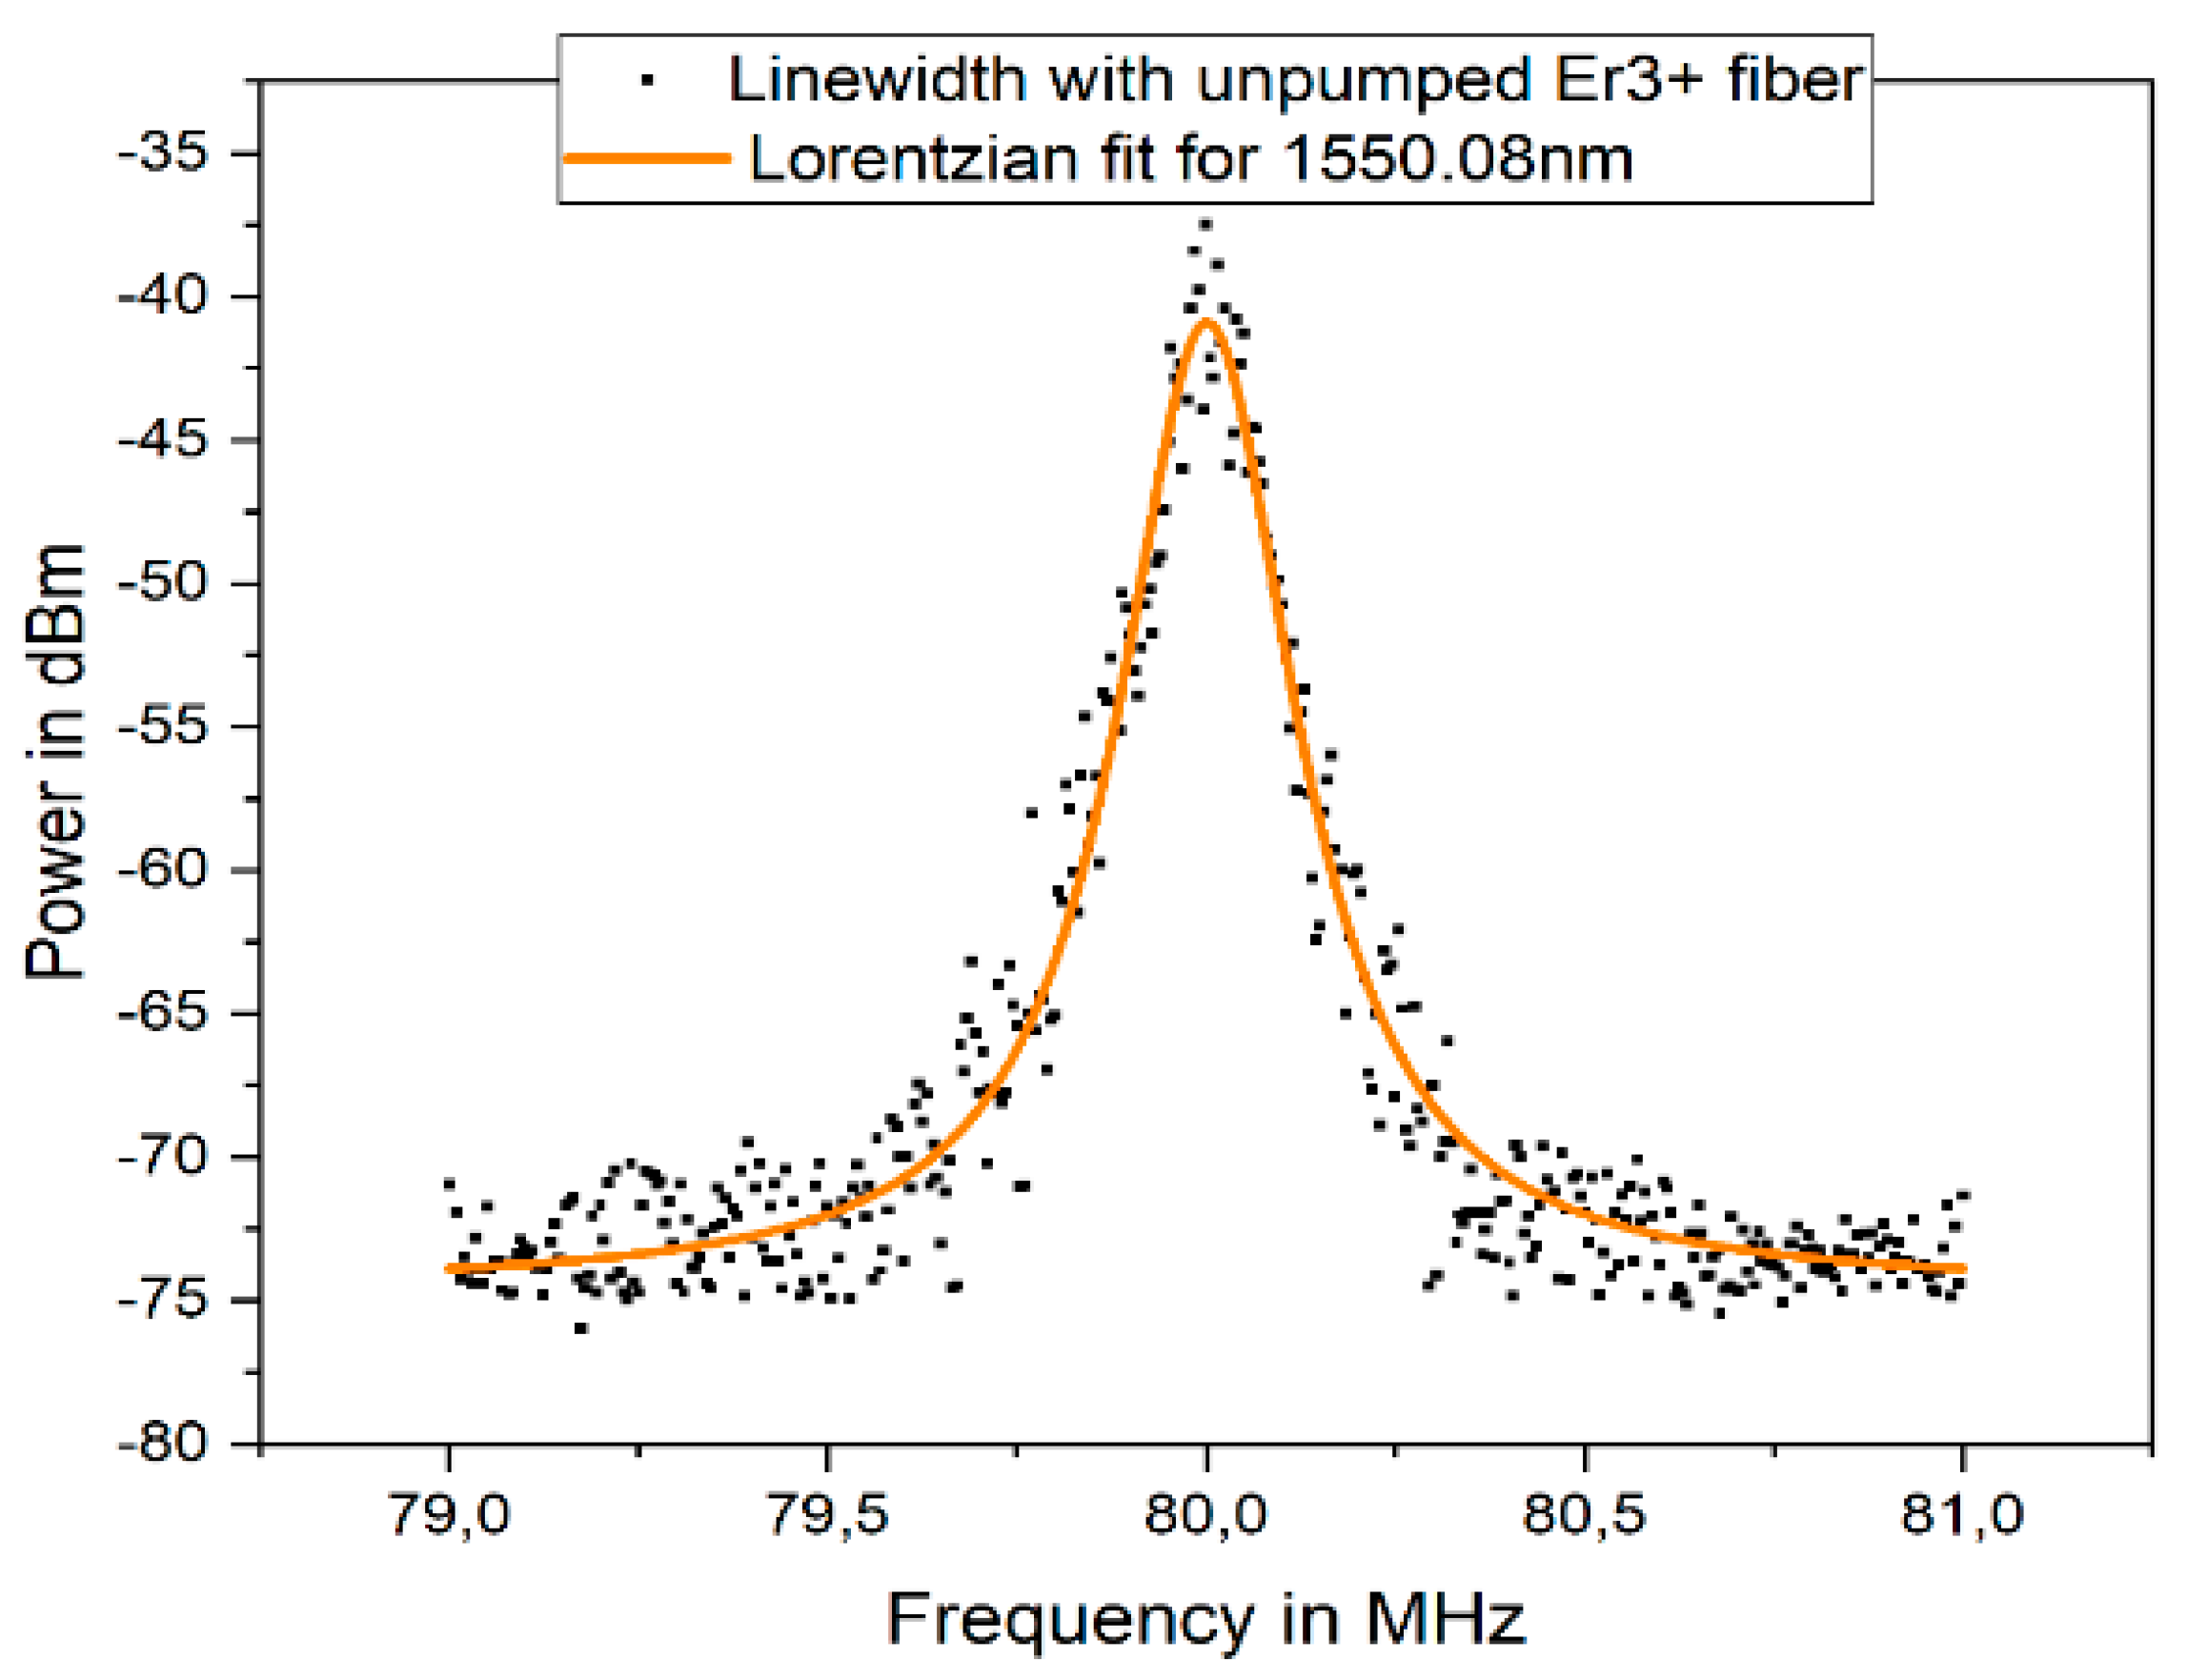
The wavelength of the tunable filter was tuned to a center wavelength of 1550.08 nm by adjusting the bias voltage. The output of the fiber laser linewidth was measured, and the result obtained was plotted, as shown in
Figure 12. The estimated optical linewidth for a wavelength of 1550.08 nm was 21.1 KHz. This clearly showed a reduction of 9% for 1530.18 nm and a reduction of 25% for 1550.08 nm in the spectral linewidths of the fiber laser outputs following modification in the spectral response of the output introduced by the saturable absorber.
7. Conclusions
The dual wavelength-selectable, erbium-doped ring cavity fiber laser was investigated. The fiber laser output of the two wavelengths were balanced using a variable optical coupler to mitigate visible mode competition between both wavelengths. The linewidth of the fiber laser was measured for both wavelengths by using an F-P tunable filter to select the output wavelength of the laser per time.
A numerical model was used to investigate the fiber laser before the experimental implementation. The simulation result showed the signal and pump propagation within the laser cavity, as well as the behavior of the output power with respect to pump power, for various wavelengths.
The fiber laser output was a continuous wave and was characterized with respect to its output power and pump power after optimization, using the variable coupler to balance the output in both wavelengths of 1530.18 nm and 1550.08 nm, respectively. The OSNR was around 61 dB before incorporating the tunable filter. The linewidth of the laser was measured after introducing the tunable filter, which served as a selection device for each respective optical wavelength. The linewidth was measured before and after introducing the saturable absorber, which eliminated the unwanted modes, thereby reducing the optical linewidth. The linewidth showed 9% and 25% reductions in linewidth for 1530.18 nm and 1550.08 nm, respectively, because of the saturable absorber. For future work, further investigation using the different lengths of the saturable absorber will be incorporated to determine the optical linewidth. The Wiener effect will also be examined to further determine and analyze the effect of the saturable absorber on the linewidth of the fiber laser.


