Abstract
The aim of the present study was to evaluate changes in cutaneous blood flow detected by incoherent optical fluctuation flowmetry (IOFF) in diabetic patients with diagnosed microangiopathies. The study includes 52 patients with type 2 diabetes mellitus (12 males, 40 females, median age 57 (51; 60) years). All patients were examined using the IOFF method using functional tests: occlusion test on the index finger, local heat test on the dorsum of the foot, and local heat test on the big toe. The patients were divided into 2 groups: 13 patients with both diabetic retinopathy and diabetic nephropathy (Group 2, severe microcirculatory disorders) and 39 patients with only 1 microangiopathic complication or without any (Group 1). Local thermal hyperaemia (LTH2_1) was higher in Group 1 than in Group 2 (p = 0.011). Post-occlusive reactive hyperaemia (PORH_2) was higher in Group 2 than in Group 1 (p = 0.009). No changes were detected on the big toe. When PORH_2 and LTH2_1 were used in combination, the area under the ROC curve (95% CI) was 0.733 (0.62 to 0.846). Thus, the IOFF method has the potential to accurately detect blood flow abnormalities associated with diabetic microangiopathies.
1. Introduction
In 2019, diabetes mellitus (DM) was diagnosed in 463 million people worldwide [1]. DM is characterised by chronic hyperglycaemia resulting from impaired insulin secretion and/or action and is often accompanied by vascular damage [2]. Complications associated with microvascular damage include diabetic retinopathy (DR) and nephropathy [2]. They can lead to impaired or even complete loss of renal and retinal function. However, DR causes blindness in 12% of cases [3]. Retinopathy and nephropathy are endpoints of DM that indicate the serious consequences of hyperglycaemia and oxidative stress. At the same time, microvascular lesions in this disease occur not only in the kidneys and retina but also in the whole body. Early detection of microvascular abnormalities is an important task. At this stage, it would be possible to provide therapeutic intervention or to increase the patient’s compliance and motivation to modify their lifestyle to normalise carbohydrate metabolism. The most accessible area for such investigation is the microcirculatory bed of the skin. Many methods have been described to assess the condition of skin microvasculature, such as videocapillaroscopy, laser Doppler flowmetry (LDF), photoplethysmography, thermography, transcutaneous oximetry, near-infrared spectroscopy, tissue reflectance spectrophotometry, optical coherence tomography, orthogonal spectral polarisation and others [4,5,6]. The most widely used method to measure skin microcirculation is LDF. This method is based on the analysis of laser beam frequency change that occurs due to its reflection from moving blood-forming elements in the vessels. LDF has previously been shown to detect differences in microcirculation between individuals with DM and conditionally healthy volunteers [7,8,9,10], as well as microvascular reactivity abnormalities in DR, nephropathy, neuropathy, and microcirculatory disorders identified by capillaroscopy [11,12,13,14,15]. However, this method has a number of disadvantages: sensitivity to unstable conditions during measurements (appearance of artefacts from motion, breathing, different actions of the operator, etc.), insufficiently good reproducibility of perfusion measurement due to the position of optical fibre only in one point with spatial differences of skin in different areas [16], and the possibility to only study small tissue volume and obtain relative perfusion values, but not absolute ones [5]. A recently developed method of incoherent optical fluctuation flowmetry (IOFF) may be a promising substitute for LDF [17,18]. This method uses the analysis of low-frequency fluctuations (0–10 Hz) of optical signals reflected from tissues initially emitted by an incoherent source—an LED. The optical sensor of the prototype device uses three LEDs operating in the 560–580 nm wavelength range and one silicon photodiode. The device has an automatic calibration capability which has not been implemented in LDF-based devices. The use of LEDs makes the technique potentially cheap and accessible. In addition to LDF, the technology implements photoplethysmography and oscillometric methods and includes the possibility of automatic local thermal and occlusion tests, which are used to assess the microvascular reactivity and functional state of the endothelium. Thus, the described device makes it possible to monitor a wide range of indices reflecting the state of both micro- and macrovascular beds. Currently, it is important to study the possibility of the IOFF method detecting dermal microcirculatory disturbances accompanying microangiopathic complications of DM for its subsequent use in screening of complications of carbohydrate metabolism disorders and estimation of their severity.
The aim of this study is to assess the ability of the IOFF technique to detect microcirculatory abnormalities in patients with diabetic microangiopathies.
2. Materials and Methods
2.1. Study Participants
A total of 52 patients from the Therapeutic Endocrinology Department of Moscow Regional Research and Clinical Institute (12 males and 40 females) with type 2 DM were studied. The inclusion criteria were individuals aged 18 years or older with the presence of type 2 DM. The exclusion criteria were acute diseases, exacerbations of chronic diseases, malignant tumours at the time of the study, thrombocytopenia, anaemia of moderate or severe degree (haemoglobin level below 90 g/L, erythrocyte count below 5.1 × 10¹²/L), dermatitis in the measurement sites, pregnancy, and the inability to independently move to the measurement site and/or stay in the supine position. For healthy volunteers, additional exclusion criteria were diseases potentially affecting blood vessels (cardiovascular, renal, liver, and other diseases). Exclusion criteria were patient reluctance to participate in the study, and the discontinuation of perfusion measurement due to discomfort or subjective impairment perceived by the patient.
General blood count (haemoglobin, erythrocytes, mean erythrocyte volume, haematocrit, platelets, leukocytes, and erythrocyte sedimentation rate) was assessed for all participants, as well as blood chemistry (with a calculation of GFR according to EPI formula), glycated haemoglobin, and electrocardiography. All patients with type 2 DM were examined by an ophthalmologist, who performed visual acuity measurement and ocular fundus examination under medicated mydriasis.
Informed consent was obtained from all participants. The study protocol complies with the ethical principles of the Declaration of Helsinki (2013 revision) and was approved by the Independent Ethics Committee of the Moscow Regional Research and Clinical Institute named after M.F. Vladimirsky (protocol No. 8 of 7 July 2022).
2.2. Perfusion Measurement
The study of the skin microvasculature was carried out in a specialised test room at a temperature of 21–25 °C. The participant of the study was placed in the supine position. The adaptation period in this position to the room conditions lasted 10 min. The skin perfusion was measured by the IOFF method using a prototype of a new device developed in MONIKI in cooperation with the JSC Elatom Instrument Factory (Elatma settlement, Ryazan region, Russia) with the participation of Optical Medical Diagnostic Systems LLC (Pushchino, Moscow region, Russia).
In IOFF the considered blood flow (perfusion) is proportional to the rate of the blood volume increment (ΔVb) in a tissue per unit of time. Blood flow is computed as the first moment of the photocurrent amplitude spectrum normalised to the DC component [19]:
where k0 is the proportional coefficient, n is the total number of all low-frequency fluctuations in the measured photocurrent, is the AC amplitude of the k-th fluctuation, is the frequency of this k-th fluctuation, and is the amplitude of the DC component. Unlike LDF, IOFF does not require any optical fibres, lasers, or coherent light and makes it possible to obtain a signal from a larger diagnostic volume of tissues (tens of mm3) [19].
This device has three optical sensors, each of which contains three LEDs, generating radiation with a wavelength of 560–580 nm (output power 20–30 mW), and one silicon photodiode. The developed device carries out not only the measurement of blood flow but also the automatic conduction of local thermal and occlusion tests, which are used to assess the reactivity of microvasculature and the functional state of the endothelium. For this purpose, the device has a cuff for creating an occlusion on the limb by applying pressure and heating elements integrated into the optical sensors. The measurement was taken consecutively first on the left and then on the right side of the body. Sensor 1 was placed on the index finger of the hand with LEDs directed to the palmar surface of its distal phalanx. Sensor 2 was attached to the dorsal surface of the foot in the first interdigital space. Sensor 3 was placed on the plantar surface of the big toe in the distal phalanx region. The cuff for measuring pressure and performing the occlusion test was placed on the middle third of the shoulder.
First, skin perfusion was measured for 40 s at rest, followed by an oscillometric blood pressure measurement. This was followed by a pause of 3 min to stabilise haemodynamics after exposure of the arm vessels. After the recovery period, a thermal test was started on the feet by increasing the temperature of probes 2 and 3 to 41.8–42 °C, which remained at this level until the end of the measurement. At the same time, 120-s cuff occlusion was performed by automatically applying pressure above the subject’s systolic blood pressure. After the release of the cuff pressure, post-occlusive reactive hyperaemia (PORH) was recorded for 3 min, and the measurement of local thermal hyperaemia (increased perfusion due to heating, LTH) on two zones of the foot was continued.
The following parameters were used to assess the cutaneous perfusion:
- Baseline perfusion levels (BP1, BP2, BP3)—average resting perfusion levels measured by sensors 1, 2, and 3, respectively.
- Post-occlusive reactive hyperaemia levels after 1, 2 and 3 min of cuff pressure release (PORH_1, PORH_2, PORH_3, respectively).
- Maximum PORH level (max_PORH).
- Time to reach max_PORH from pressure release (max_PORH time).
- Local thermal hyperaemia levels after 1–5 min of heating (LTHi_j, where i—sensor number, j—minute number).
- Maximum LTH level (max_LTH2, max_LTH3).
- Time to reach max_PORH from pressure release (max_LTH2 time, max_LTH3 time).
- Parameters from each side of the body were assessed independently.
2.3. Statistical Analysis
Statistical analysis was performed with the Rstudio 2022.12.0 (Posit Software, PBC) software using the R 4.2.2 programming language (The R Foundation). Medians and quartiles were calculated for quantitative variables, while absolute and relative frequencies were calculated for qualitative variables. The Mann-Whitney test was used to compare quantitative variables between the two groups. To compare qualitative variables, Chi-square or Fisher’s exact test was used. The diagnostic characteristics of the quantitative variables were assessed by ROC analysis. The type-I error rate (α) was set to 0.05. Null hypotheses were rejected at p < 0.05.
3. Results
The clinical characteristics of the patients are shown in Table 1. The patients were divided into two groups during the study. Group 2 (systemic microcirculatory disorders) included patients who had both retinopathy and nephropathy; Group 1 included the remaining patients. There were no significant differences between the groups in terms of age, sex, body mass index (BMI), glycated haemoglobin (HbA1c), frequency of arterial hypertension and coronary heart disease. The results of the comparison of the blood flow parameters between the groups are shown in Table 2.

Table 1.
The characteristics of the patients. Me (LQ; UQ) are calculated for quantitative variables.
Table 2.
Comparison of blood flow parameters in the groups of patients. Me (LQ; UQ) are calculated for quantitative variables.
Patients with systemic microangiopathies (Group 2) showed decreased microcirculatory reactivity to heating at the first minute of heating on the dorsal surface of the foot (LTH2_1, p = 0.011). At the same time in Group 2, there was an increase in PORH on the index finger at 2 and 3 min of post-occlusive hyperaemia (PORH_2, p = 0.009; PORH_3, p = 0.021) as well as in maximum perfusion at the time of hyperaemia (max_PORH, p = 0.048). There were no differences between the groups in the big toe during the local thermal test.
To assess the shape of the hyperaemic response in more detail, we plotted averaged perfusion plots for all functional tests. For each time point, the average perfusion value for the entire patient group was calculated with a 95% two-sided confidence interval (Figure 1).
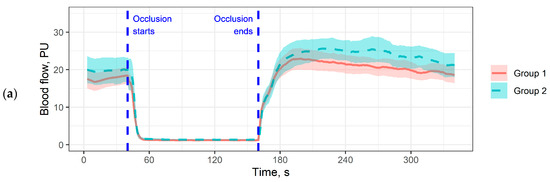
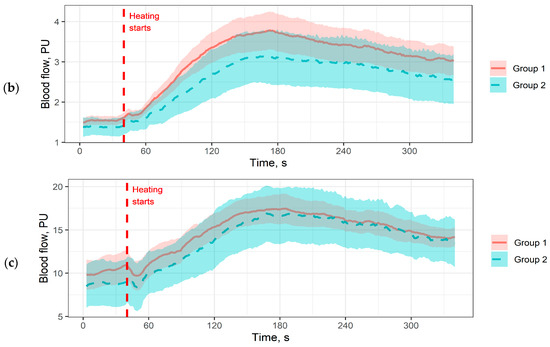
Figure 1.
Averaged perfusion plots. The coloured area denotes 95% confidence intervals. (a) Perfusion plot for the occlusion test on the index finger; (b) Perfusion plot for the local thermal test on the dorsal surface of the foot; (c) Perfusion plot for the local thermal test on the big toe. Pressure measurement periods and pauses are cut out for plot matching.
The perfusion plots allow a more detailed analysis of the differences obtained in Table 2. For example, in Figure 1b we see that patients in Group 2 have a reduced rate of perfusion increase in response to heating compared to Group 1, with no difference in the rate of development of the maximum hyperaemic response. Interestingly, this pattern does not correlate with what we see in Figure 1a: patients in Group 2 have a more pronounced hyperaemic response, but the maximum averaged hyperaemic response is observed later. In the big toe (Figure 1c), differences were observed in baseline perfusion, but they were not significant in the analysis of the parameters in Table 2.
To assess the diagnostic informativeness of the parameters from Table 2, an ROC analysis was performed. The maximum area under the ROC curve (95% CI) was obtained for PORH_2: 0.672 (0.561–0.783), corresponding to poor prognostic power [20]. However, combining the two indices and calculating a composite index by building a logistic regression model (2) increased the diagnostic informativeness of functional tests (Figure 2).
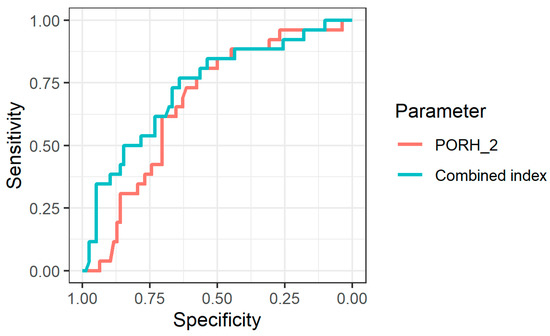
Figure 2.
ROC curves for identifying patients from Group 2 using the PORH_2 index and using the combined index.
The use of a composite index improved the diagnostic performance of the IOFF method. The area under the ROC curve for it was 0.733 (0.62–0.846).
4. Discussion
Hyperglycaemia is known to contribute to the development of microcirculatory disorders. Zoungas S. et al. demonstrated the effect of reducing the overall level of glycaemia on reducing the risk of microangiopathic complications (nephropathy and retinopathy) and their progression [21]. This association is explained by the fact that increased glucose levels cause damage to endothelial cells, resulting in increased permeability, decreased nitric oxide release, and hyperproduction of reactive oxygen [22]. In addition, a variety of hemorheological abnormalities that contribute to the development of DR are much more pronounced in DM compared with healthy volunteers of comparable age [23]. Cutaneous blood flow represents an accessible vascular bed, which has been proposed as a model of generalised microvascular function [24]. Cutaneous microcirculation is associated with microangiopathic abnormalities in the target organs of arterial hypertension and DM. Nguyen T. et al. in constructing a multivariate logistic regression model found that patients with decreased endothelium-dependent and independent skin vasodilation (microvascular response to acetylcholine and sodium nitroprusside) had DR with odds ratios of 2.33 (95% CI 1.09–5.01) and 2.20 (1.05–4.61) for each response type, respectively [25]. In addition, those with a reduced response to both these stimuli were four times more likely to have DR than participants with a normal outcome (odds ratio 3.86 [1.45–10.3]). Thus, microvascular changes occur in parallel in both the retina and the skin, making the latter a promising model for assessing the severity of microangiopathic disorders in DM [25].
Our results on the dorsum of the foot are consistent with both the literature data [26] and the results we obtained earlier [15,27]. We noted a decrease in the reactivity of the microcirculatory bed in patients with severe microangiopathies (Group 2) (Table 2, Figure 1b). The fact that significant differences between the groups were obtained only in the first minute of heating may be due to a different measurement localisation (we used to take measurements on the forearm) and low signal amplitude.
On the index finger, we see a different situation. In our study, perfusion levels during post-occlusive hyperaemia were higher in patients with severe microangiopathies (Group 2) than in Group 1 (Table 2, Figure 1a). This is not very consistent with the evidence that reactivity in response to occlusion should decrease in the background of DM complications [28]. On the other hand, we can put forward the following hypothesis. There is evidence that in the background of neurovascular complications of DM, we may observe an increase in vascular density and an increase in baseline blood flow [29]. This also can be related to impaired vasoconstrictor function [30]. We saw a higher baseline blood flow in Group 2 patients (although these differences were not statistically significant). We speculate that in Group 2 patients, the abnormalities were expressed firstly in a reduced rate of reaching maximum perfusion and secondly in a reduced rate of perfusion recovery to baseline after the peak of hyperaemia, but at present, this statement can only be made as a hypothesis. This hypothesis will be investigated further.
The level of diagnostic significance obtained in our work for the combined index including both occlusion and heat test (AUC = 0.733) (Figure 2) is acceptable from the point of view of conventional interpretation [19]. Sensitivity and specificity levels were 76.9% and 64.1%, respectively. We believe that in future studies, these rates could be increased by including more features in the model.
The following factors may be noted as limitations of the study. The study population was predominantly female. This may affect the reproducibility of the results when the study is repeated in a population with a different proportion of females. The study of blood flow on the right and left sides of the body was carried out sequentially rather than simultaneously, which may have increased the variability of the measurements. The sample size did not allow for a full multivariate analysis: a logistic regression model was constructed only to demonstrate the prospect of combining the parameters.
5. Conclusions
In the current study, we showed that patients with severe microangiopathies may show changes in vascular reactivity to thermal and occlusive stimuli. However, these changes were observed on the index finger and dorsum of the foot, but not on the thumb. Combined assessment of the parameters (e.g., by building a logistic regression model) may increase the diagnostic performance of the method. We believe that in the future, technologies allowing the simultaneous performance of several functional tests within a short period of time can be used for the accurate detection of blood flow abnormalities associated with diabetic microangiopathies.
Author Contributions
Conceptualisation, A.G., P.G. and Y.K.; methodology, D.L., A.T. and D.R.; software, D.L., A.T. and A.G.; validation, K.K. and A.G.; formal analysis, K.K. and A.G.; investigation, A.G., K.K., P.G. and Y.K.; resources, A.G. and Y.K.; data curation, K.K.; writing—original draft preparation, A.G. and K.K.; writing—review and editing, P.G., A.T., D.L., D.R. and Y.K.; visualisation, A.G. and D.L.; supervision, Y.K. and D.R.; project administration, A.G. All authors have read and agreed to the published version of the manuscript.
Funding
This research was funded by the Ministry of Science and Higher Education of the Russian Federation, grant number MK-4421.2022.3.
Institutional Review Board Statement
The study protocol complies with the ethical principles of the Declaration of Helsinki (2013 revision) and was approved by the Independent Ethics Committee of the Moscow Regional Research and Clinical Institute (“MONIKI”) (protocol No. 8 of 7 July 2022).
Informed Consent Statement
Written informed consent was obtained from all participants.
Data Availability Statement
Data can be made available upon reasonable request.
Conflicts of Interest
The authors declare no conflict of interest.
References
- Saeedi, P.; Petersohn, I.; Salpea, P.; Malanda, B.; Karuranga, S.; Unwin, N.; Colagiuri, S.; Guariguata, L.; Motala, A.A.; Ogurtsova, K.; et al. Global and Regional Diabetes Prevalence Estimates for 2019 and Projections for 2030 and 2045: Results from the International Diabetes Federation Diabetes Atlas, 9th Edition. Diabetes Res. Clin. Pract. 2019, 157, 107843. [Google Scholar] [CrossRef]
- American Diabetes Association Standards of Medical Care in Diabetes-2022 Abridged for Primary Care Providers. Clin. Diabetes Publ. Am. Diabetes Assoc. 2022, 40, 10–38. [CrossRef]
- Gudla, S.; Tenneti, D.; Pande, M.; Tipparaju, S.M. Diabetic Retinopathy: Pathogenesis, Treatment, and Complications; Patel, J.K., Sutariya, V., Kanwar, J.R., Pathak, Y.V., Eds.; Springer International Publishing: Cham, Vietnam, 2018; pp. 83–94. [Google Scholar]
- Rosenberry, R.; Nelson, M.D. Reactive Hyperemia: A Review of Methods, Mechanisms, and Considerations. Am. J. Physiol. Regul. Integr. Comp. Physiol. 2020, 318, R605–R618. [Google Scholar] [CrossRef]
- Neubauer-Geryk, J.; Hoffmann, M.; Wielicka, M.; Piec, K.; Kozera, G.; Brzeziński, M.; Bieniaszewski, L. Current Methods for the Assessment of Skin Microcirculation: Part 1. Adv. Dermatol. Allergol. Dermatol. Alergol. 2019, 36, 247–254. [Google Scholar] [CrossRef]
- Neubauer-Geryk, J.; Hoffmann, M.; Wielicka, M.; Piec, K.; Kozera, G.; Bieniaszewski, L. Current Methods for the Assessment of Skin Microcirculation: Part 2. Adv. Dermatol. Allergol. Dermatol. Alergol. 2019, 36, 377–381. [Google Scholar] [CrossRef]
- Fuchs, D.; Dupon, P.P.; Schaap, L.A.; Draijer, R. The Association between Diabetes and Dermal Microvascular Dysfunction Non-Invasively Assessed by Laser Doppler with Local Thermal Hyperemia: A Systematic Review with Meta-Analysis. Cardiovasc. Diabetol. 2017, 16, 11. [Google Scholar] [CrossRef] [PubMed]
- Hu, H.-F.; Hsiu, H.; Sung, C.-J.; Lee, C.-H. Combining Laser-Doppler Flowmetry Measurements with Spectral Analysis to Study Different Microcirculatory Effects in Human Prediabetic and Diabetic Subjects. Lasers Med. Sci. 2017, 32, 327–334. [Google Scholar] [CrossRef]
- Mizeva, I.; Zharkikh, E.; Dremin, V.; Zherebtsov, E.; Makovik, I.; Potapova, E.; Dunaev, A. Spectral Analysis of the Blood Flow in the Foot Microvascular Bed during Thermal Testing in Patients with Diabetes Mellitus. Microvasc. Res. 2018, 120, 13–20. [Google Scholar] [CrossRef] [PubMed]
- Sorelli, M.; Francia, P.; Bocchi, L.; De Bellis, A.; Anichini, R. Assessment of Cutaneous Microcirculation by Laser Doppler Flowmetry in Type 1 Diabetes. Microvasc. Res. 2019, 124, 91–96. [Google Scholar] [CrossRef]
- Park, H.S.; Yun, H.M.; Jung, I.M.; Lee, T. Role of Laser Doppler for the Evaluation of Pedal Microcirculatory Function in Diabetic Neuropathy Patients. Microcirculation 2016, 23, 44–52. [Google Scholar] [CrossRef] [PubMed]
- Liao, F.; Jan, Y.-K. Nonlinear Dynamics of Skin Blood Flow Response to Mechanical and Thermal Stresses in the Plantar Foot of Diabetics with Peripheral Neuropathy. Clin. Hemorheol. Microcirc. 2017, 66, 197–210. [Google Scholar] [CrossRef]
- Mrowietz, C.; Franke, R.P.; Pindur, G.; Sternitzky, R.; Jung, F.; Wolf, U. Evaluation of Laser-Doppler-Fluxmetry for the Diagnosis of Microcirculatory Disorders. Clin. Hemorheol. Microcirc. 2019, 71, 129–135. [Google Scholar] [CrossRef]
- Tehrani, S.; Bergen, K.; Azizi, L.; Jörneskog, G. Skin Microvascular Reactivity Correlates to Clinical Microangiopathy in Type 1 Diabetes: A Pilot Study. Diab. Vasc. Dis. Res. 2020, 17, 1479164120928303. [Google Scholar] [CrossRef]
- Krasulina, K.A.; Glazkova, P.A.; Glazkov, A.A.; Kulikov, D.A.; Rogatkin, D.A.; Kovaleva, Y.A.; Bardeeva, J.N.; Dreval, A.V. Reduced Microvascular Reactivity in Patients with Diabetic Neuropathy. Clin. Hemorheol. Microcirc. 2021, 79, 335–346. [Google Scholar] [CrossRef] [PubMed]
- Hellmann, M.; Roustit, M.; Cracowski, J.-L. Skin Microvascular Endothelial Function as a Biomarker in Cardiovascular Diseases? Pharmacol. Rep. 2015, 67, 803–810. [Google Scholar] [CrossRef] [PubMed]
- Lapitan, D.G.; Raznitsyn, O.A. A Method and a Device Prototype for Noninvasive Measurements of Blood Perfusion in a Tissue. Instrum. Exp. Tech. 2018, 61, 745–750. [Google Scholar] [CrossRef]
- Lapitan, D.; Rogatkin, D. Optical Incoherent Technique for Noninvasive Assessment of Blood Flow in Tissues: Theoretical Model and Experimental Study. J. Biophotonics 2021, 14, e202000459. [Google Scholar] [CrossRef]
- Lapitan, D.G.; Tarasov, A.P.; Rogatkin, D.A. Dependence of the Registered Blood Flow in Incoherent Optical Fluctuation Flowmetry on the Mean Photon Path Length in a Tissue. Photonics 2023, 10, 190. [Google Scholar] [CrossRef]
- Hosmer, D., Jr.; Lemeshow, S.; Sturdivant, R. Assessing the Fit of the Model. In Applied Logistic Regression; John and Wiley and Sons: Hoboken, NJ, USA, 2013; pp. 153–225. ISBN 978-1-118-54838-7. [Google Scholar]
- Zoungas, S.; Arima, H.; Gerstein, H.C.; Holman, R.R.; Woodward, M.; Reaven, P.; Hayward, R.A.; Craven, T.; Coleman, R.L.; Chalmers, J.; et al. Effects of Intensive Glucose Control on Microvascular Outcomes in Patients with Type 2 Diabetes: A Meta-Analysis of Individual Participant Data from Randomised Controlled Trials. Lancet Diabetes Endocrinol. 2017, 5, 431–437. [Google Scholar] [CrossRef]
- Stehouwer, C.D.A. Microvascular Dysfunction and Hyperglycemia: A Vicious Cycle With Widespread Consequences. Diabetes 2018, 67, 1729–1741. [Google Scholar] [CrossRef]
- Biro, K.; Sandor, B.; Kovacs, D.; Csiszar, B.; Vekasi, J.; Totsimon, K.; Toth, A.; Koltai, K.; Endrei, D.; Toth, K.; et al. Lower Limb Ischemia and Microrheological Alterations in Patients with Diabetic Retinopathy. Clin. Hemorheol. Microcirc. 2018, 69, 23–35. [Google Scholar] [CrossRef]
- Holowatz, L.A.; Thompson-Torgerson, C.S.; Kenney, W.L. The Human Cutaneous Circulation as a Model of Generalized Microvascular Function. J. Appl. Physiol. 2008, 105, 370–372. [Google Scholar] [CrossRef]
- Nguyen, T.T.; Shaw, J.E.; Robinson, C.; Kawasaki, R.; Wang, J.J.; Kreis, A.J.; Wong, T.Y. Diabetic Retinopathy Is Related to Both Endothelium-Dependent and -Independent Responses of Skin Microvascular Flow. Diabetes Care 2011, 34, 1389–1393. [Google Scholar] [CrossRef] [PubMed]
- Kuryliszyn-Moskal, A.; Zarzycki, W.; Dubicki, A.; Moskal, D.; Kosztyła-Hojna, B.; Hryniewicz, A. Clinical Usefulness of Videocapillaroscopy and Selected Endothelial Cell Activation Markers in People with Type 1 Diabetes Mellitus Complicated by Microangiopathy. Adv. Med. Sci. 2017, 62, 368–373. [Google Scholar] [CrossRef] [PubMed]
- Glazkov, A.A.; Krasulina, K.A.; Glazkova, P.A.; Kovaleva, Y.A.; Bardeeva, J.N.; Kulikov, D.A. Skin Microvascular Reactivity in Patients with Diabetic Retinopathy. Microvasc. Res. 2023, 147, 104501. [Google Scholar] [CrossRef] [PubMed]
- Santesson, P.; Lins, P.-E.; Kalani, M.; Adamson, U.; Lelic, I.; von Wendt, G.; Fagrell, B.; Jörneskog, G. Skin Microvascular Function in Patients with Type 1 Diabetes: An Observational Study from the Onset of Diabetes. Diab. Vasc. Dis. Res. 2017, 14, 191–199. [Google Scholar] [CrossRef]
- Adamska, A.; Pilacinski, S.; Zozulinska-Ziolkiewicz, D.; Gandecka, A.; Grzelka, A.; Konwerska, A.; Malinska, A.; Nowicki, M.; Araszkiewicz, A. An Increased Skin Microvessel Density Is Associated with Neurovascular Complications in Type 1 Diabetes Mellitus. Diab. Vasc. Dis. Res. 2019, 16, 513–522. [Google Scholar] [CrossRef]
- Holowatz, L.A.; Thompson-Torgerson, C.; Kenney, W.L. Aging and the control of human skin blood flow. Front. Biosci. 2010, 15, 718–739. [Google Scholar] [CrossRef]
Disclaimer/Publisher’s Note: The statements, opinions and data contained in all publications are solely those of the individual author(s) and contributor(s) and not of MDPI and/or the editor(s). MDPI and/or the editor(s) disclaim responsibility for any injury to people or property resulting from any ideas, methods, instructions or products referred to in the content. |
© 2023 by the authors. Licensee MDPI, Basel, Switzerland. This article is an open access article distributed under the terms and conditions of the Creative Commons Attribution (CC BY) license (https://creativecommons.org/licenses/by/4.0/).