Article

Phase-Derived Ranging Based Fiber Transfer Delay Measurement Using a Composite Signal for Distributed Radars with Fiber Networks

1
National Key Lab of Microwave Imaging Technology, Aerospace Information Research Institute Chinese Academy of Sciences, Beijing 100190, China
2
The School of Electronics, Electrical and Communication Engineering, University of Chinese Academy of Sciences, Beijing 100049, China
*
Authors to whom correspondence should be addressed.
Photonics 2023, 10(4), 421; https://doi.org/10.3390/photonics10040421
Submission received: 1 March 2023 / Revised: 1 April 2023 / Accepted: 6 April 2023 / Published: 7 April 2023
(This article belongs to the Special Issue Advanced Photonic Sensing and Measurement)

Abstract

:
Fiber transfer delay (FTD) variations influence the coherence of distributed radars with fiber networks, resulting in a performance degradation in target detecting and imaging. To measure and compensate for the variation, a phase-derived ranging based FTD measurement using a composite signal is proposed. The composite signal comprises a sinusoidal component and a linear frequency modulation (LFM) component. As the composite signal passes through a fiber under test (FUT), the sinusoidal component generates a phase shift that corresponds to the FTD. The phase shift can be represented by two parameters: the number of complete periods of 2π that can be estimated by using the LFM component, and a phase shift less than 2π that be measured employing the sinusoidal component. When using the proposed measurement system to measure FTD variations in a distributed radar, only an additional sinusoidal component is needed, which minimizes interference with radar signals. Moreover, the proposed measurement system can share core function modules such as signal generation and process modules with distributed radars, which enhances the compatibility and reduces the overall complexity. Experiments are carried out to measure a variable optical delay line and a long optical fiber. The experiment results verify the feasibility of the measurement system and show that a measurement range of more than 15 km, an accuracy of ±0.1 ps and a measurement time of 105 ms can be achieved.

1. Introduction

Distributed radars play an important role in civil and security applications. Compared to monostatic radars, distributed radars have the potential to coherently process echoes from different remote nodes, thereby improving target detecting, tracking and imaging performance [1]. However, the coherence of echoes from different remote nodes is difficult to guarantee due to inappropriate signal transmission approach, environment perturbation, etc. Particularly, in distributed radars which transmit radar signals between a central station and remote nodes with fiber networks [2], the coherence is limited by the fiber transfer delay (FTD) variation caused by temperature and stress perturbation [3]. To solve this problem, a solution is to measure the FTD variation and then compensate echoes with the measurement results. For an accurate compensation, the FTD measurement has to satisfy the following two key points: (1) high accuracy (2) high measurement speed. The first point is an essential requirement for an accurate compensation. As reported in [4], to ensure the coherent detection performance, a phase jitter below 0.1 radian should be provided, which corresponds to a time delay variation of 1.6 ps at a frequency of 10 GHz. As the frequency increases, the required measurement accuracy also increases. The second point is also important in distributed radars with fiber networks. As the fiber becomes longer, the time for the phase jitter to change by 0.1 radian becomes shorter. Thereby, the measurement time should be short enough to keep up with the changing speed of phase jitter.
In the past few decades, a number of FTD measurement methods have been proposed. According to principles of measurement, these methods can be divided into three categories: (1) time domain measurements (TDMs), (2) frequency domain measurements (FDMs), (3) phase-derived range measurements (PRMs). The TDMs directly detect the flight time of probe signals. Examples include optical time domain reflectometer (OTDR) [5,6,7] and chaotic light-based measurement [8]. However, as the accuracy decreases with increasing fiber length, these methods are unable to meet the requirement of variation compensation in distributed radars. The FDMs transfer the time delay measurement to the frequency measurement. Typical examples include optical frequency domain reflectometer (OFDR) [9,10,11,12,13], mode-lock laser repetition frequency measurement [14] and free-running laser mode-spacing measurement [15]. However, the accuracy of these methods is also limited. The accuracy of OFDR is several picoseconds and the accuracy of the latter two is only tens of picoseconds in a measurement range of 100 km. Obviously, the FDMs cannot be used for variation compensation in distributed radars due to their limited accuracy. PRMs obtain the time delay by directly measuring the phase shift of probe signals after transmission, which can simultaneously achieve an ultrahigh accuracy and a large measurement range [16,17,18,19,20,21,22,23,24]. Due to the periodicity of the phase, the phase shift has an integer ambiguity problem, which has to be resolved to acquire a unique time delay. In [17], a frequency-scanning method is proposed to resolve the integer ambiguity, which increases the measurement time to a certain extent. In [20], nonlinear four-point sweeping is employed to estimate the integer ambiguity, reducing the measurement time to tens of milliseconds per measurement. In [24], a de-chirp process of a linear frequency modulation (LFM) signal is used to solve the integer ambiguity, and the measurement time is further reduced to sub-milliseconds. However, using these PRMs for variation compensation in distributed radars with a fiber network presents challenges, including (1) interference between probe and radar signals, and (2) limited compatibility between these PRMs and distributed radars, which results in increased overall system complexity.
To measure and compensate for the variation of distributed radars, a phase-derived ranging based FTD measurement system using a composite signal is proposed and experimentally demonstrated. The composite signal is composed of a sinusoidal component and an LFM component. When the composite signal passes through a fiber under test (FUT), the sinusoidal component generates a phase shift that corresponds to the FTD. The phase shift can be represented by two parameters: the number of complete periods of 2π and a phase shift less than 2π. The number of periods is estimated by analyzing the de-chirped signal of the LFM component, while the phase shift less than 2π is measured from the down-converted signal of the sinusoidal component. Based on these two parameters, the total phase shift is accurately determined, allowing for an accurate FTD measurement. The LFM component is already used in distributed radars [25,26,27], which means only an additional sinusoidal component is needed when measuring the FTD variation of the distributed radars with the proposed measurement system. As a result, the interference among the signals is reduced. In addition, core function modules such as the signal generation module and process module used in the proposed system are also widely used in distributed radars [28,29]. Sharing these core function modules makes the proposed system and distributed radars compatible, which reduces overall complexity, leading to a more cost-effective and efficient integration system. A measurement of a variable optical delay line and a long fiber is carried out. The measurement results show that a dynamic range of more than 15 km, an accuracy of ±0.1 ps and a measurement time of 105 ms can be achieved.
The remainder of this manuscript is organized as follows. In Section 2, an integration system of the proposed FTD measurement system with a distributed radar system is introduced. The principle of the FTD measurement system is also presented. In Section 3, the two experiments used to verify the feasibility of the proposed system are introduced. The experimental results are also analyzed. In Section 4, a comparison of various measurement systems is discussed at the point of distributed radar signal compensation. In Section 5, conclusions are finally exposed.

2. Principle

2.1. Integration System of the Proposed FTD Measurement System with a Distributed Radar

Figure 1a shows an integration system of the proposed FTD measurement system with a typical distributed radar system to demonstrate the compatibility of the two systems. The distributed radar comprises a central station and several transceivers (TRs, denoted by TR1, TR2, …, TRn). The central station consists of a signal generation module (SGM), a signal process module (SPM) and a signal acquisition module (SAM). The optical signals from the central station are split by several optical splitters and sent to each TRi (i = 1, 2, …, n). The TRi is shown in Figure 1b. When the switch is set to the “b” position, the TRi is used to achieve emission and reception of radar signals. During the operation of the distributed radar, the FTD variation from point “A” to point “Bi” (i = 1, 2, …, n) will reduce the coherence of the system. Therefore, the FTD variation from point “A” to point “Bi” should be measured and compensated for.
The SGM and SPM are also combined to form a probe link (when the switches in Figure 2 are set to position “a”, details can be found in Section 2.2), which is a key component of the proposed fiber transfer delay measurement (FTDM) system. Sharing the SGM and SPM makes the FTDM system and distributed radars compatible, which reduces overall complexity.
The switches in the integration system, located in the SPM and TRi, control the operating state of both the distributed radar and FTD measurement system. By appropriately configuring the switching timing, both systems can operate concurrently and independently without interference.

2.2. Schematic Diagram and FUT Calculation Method of the Proposed FTD Measurement System

The core structure of the central station is shown in Figure 2. When the switches in Figure 2 are set to position “b”, the core structure is used as the SGM and SPM. When the switches are set to position “a”, the core structure is transformed into an FTD measurement system. The FTD measurement system can be divided into a reference link and a probe link. In the reference link, reference signal generation is realized based on photonic multiplier technology. In the probe link, the probe signal generation and processing (de-chirp and down-conversion) are completed.
The reference link consists of a laser (LD1), an MZM (MZM1), a photodetector (PD1) and an electrical band-pass filter (EBPF). The light wave from LD1 is used as an optical carrier. The optical carrier is modulated by a composite signal in the MZM1. The composite signal is composed of a sinusoidal component and a LFM component, which can be expressed as
S 1 ( t ) = cos [ φ 1 ( t ) ]
where φ1(t) is the phase of the S1(t), it can be written as
φ 1 ( t ) = { 2 π ( f 0 B 2 + Δ f 2 ) t 0 t T p 2 π ( f 0 B 2 ) ( t T ) + π k ( t T ) 2 T t T + T p
where f0B/2 +f/2 is the frequency of sinusoidal component, f0B/2 is the start frequency of the LFM component, ∆f/2 is a frequency shift, B is the bandwidth of the LFM component, Tp is the pulse width, T is the pulse period, k = B/Tp is chirp rate. The MZM1 is biased at null point. The output of the MZM1 can be expressed as
E r e f ( t ) 2 exp [ j 2 π f c 1 t ] × J 1 ( β 1 ) cos [ φ 1 ( t ) ]
where fc1 is the frequency of the optical carrier, J1 is the first-order Bessel function of the first kind, β1 is the modulation index of the MZM1. Here, the high order sidebands are ignored under the small-signal approximation. By beating the ±1 order sidebands of the modulated optical signal in the PD1, the reference signal is generated, which can be expressed as
S r e f ( t ) = | E r e f ( t ) | 2 cos [ 2 φ 1 ( t ) ]
The probe link is mainly composed of a laser (LD2), two MZMs (MZM2 and MZM3), a photodetector (PD2) and an ADC. The optical carrier from LD2 is modulated by another composite signal, which can be expressed as
S 2 ( t ) = cos [ φ 2 ( t ) ]
where φ2(t) is the phase of the RF signal, it can be written as
φ 2 ( t ) = { 2 π ( f 0 B 2 ) t 0 t T p 2 π ( f 0 B 2 ) ( t T ) + π k ( t T ) 2 T t T + T p
where f0 − B/2 is both the frequency of sinusoidal component and the start frequency of the LFM component. The MZM2 is biased at null point. The output of the MZM2 acts as a probe signal, which can be expressed as
E p ( t ) = 2 exp [ j 2 π f c 2 t ] × { J 1 ( β 2 ) cos [ φ 2 ( t ) ] }
where fc2 is the frequency of the optical carrier from LD2, β2 is the modulation index of the MZM2. The high order sidebands are also ignored under the small-signal approximation. Then, the probe signal goes through an FUT and undergoes a time delay of τ. Reflected by a reflector, the probe signal is sent to MZM3 and modulated by the reference signal. The MZM3 is biased at quadrature point, and its output can be expressed as
E M Z M 3 ( t ) = E p ( t τ ) × { exp [ j ( β 3 S r e f + π 4 ) ] + exp [ j ( β 3 S r e f + π 4 ) ] } = 2 2 J 1 ( β 2 ) exp [ j 2 π f c 2 ( t τ ) ] × { J 0 ( β 3 ) × cos [ φ 2 ( t τ ) ] 2 J 1 ( β 3 ) cos ( 2 φ 1 ( t ) ) × cos [ φ 2 ( t τ ) ] }
where Ep(tτ) is the probe signal with a time delay of τ, J0 is the zero-order Bessel function of the first kind, and β3 is the modulation index of the MZM3. An optical band-pass filter (OBPF) is used to select the desired sidebands. The output of the OBPF can be expressed as
E O B P F ( t ) = 2 J 1 ( β 2 ) J 0 ( β 3 ) exp [ j 2 π f c 2 ( t τ ) + j φ 2 ( t τ ) ] + 2 J 1 ( β 2 ) J 1 ( β 3 ) exp [ j 2 π f c 2 ( t τ ) + j ( 2 φ 1 ( t ) φ 2 ( t τ ) ) ]
Detected by PD2, an RF signal containing time delay information of the FUT is obtained, which can be expressed as
S P D 2 ( t ) cos [ ( 2 φ 2 ( t τ ) 2 φ 1 ( t ) ) ] = { S d 1 ( t ) : = cos [ 2 π Δ f t + 2 π ( 2 f 0 B ) τ ] 0 t T p S d 2 ( t ) : = cos [ 2 π 2 k τ t 2 π 2 k T τ + 2 π ( 2 f 0 B ) τ 2 π k τ 2 ] T t T + T p
where the Sd1(t) is a down-converted signal of the sinusoidal component, the Sd2(t) is a de-chirped signal of the LFM component. Filtered by an electrical low-pass filter (ELBP), the detected signal is digitized by an ADC. The total phase φp is proportional to the FTD, as shown in Equation (11), but it cannot be obtained directly.
φ p = 2 π ( 2 f 0 B ) τ
Based on Fast Fourier Transform (FFT), only the peak phase φre and peak frequency fp can be extracted from the peak points of power spectral density of the Sd1(t) and the Sd2(t), respectively. The peak frequency can be expressed as
f p = 2 k τ
Given that the peak phase is located in [0, 2π), the φp can also be expressed as
φ p = φ r e + 2 π N
where N is the number of complete periods of 2π. Substituting Equations (11) and (12) into Equation (13), N can be expressed as
N = [ ( 2 f 0 B ) f p 2 k φ r e 2 π ]
where […] is the rounding operator. Because the fp is directly extracted from the de-chirped signal of the LFM component, the N can be calculated quickly compared other PRMs, which improves the overall measurement speed. Combining Equations (11) and (13), the time delay can be given by
τ = N ( 2 f 0 B ) + φ r e 2 π ( 2 f 0 B )
To correctly calculate the number of the periods, the accuracy of the peak frequency should satisfy
Δ f 2 k < 1 ( 2 f 0 B )
The ∆f is related to both pulse width Tp and interpolation multiple of Fast Fourier Transform (FFT). By properly selecting the interpolation multiple, the number of the periods can be resolved correctly. From Equation (15), the accuracy of τ is determined by
Δ τ Δ φ r e 2 π ( 2 f 0 B )
where ∆φre is the accuracy of the peak phase.
In the proposed system, the measurement time is mainly composed of signal acquisition time and calculating time. The signal acquisition time is 2T, which can be designed flexibly. The calculating time is decided by the time of two FFTs.

3. Experiment and Results

An FTD measurement system is implemented. Based on the measurement system, two experiments are demonstrated to evaluate the system stability, measurement accuracy and measurement range.

3.1. Experiment Setup

The FTD measurement system is implemented based on the setup shown in Figure 2. The composite signal S1 and S2 are from two channels of an arbitrary waveform generation (AWG) (Keysight, M8190A). The parameters of the two composite signals are shown in Table 1. The S1 is sent to the reference link to generate a reference signal, while the S2 is sent to the probe link to measure the FTD of the FUT. In the reference link, the optical carrier from a laser (LD1) (CONQUER, DFB-C36) is modulated by the S1 in a MZM (MZM1) (EO-space) and sent to a PD (PD1) (Finisar, XPDV2120RA) to achieve opto-electrical conversion. In the probe link, the S2 modulates an optical carrier generated by a laser (PD2) (NKT Koheras BASIK) in an MZM (MZM2) (EO-space). Then, the modulated optical signal is sent to the FUT as a probe signal. Reflected by a reflector, the probe signal is routed to an MZM (MZM3) (EO-space) and modulated by the reference signal. Filtered by a tunable OBPF (Yenista, XTM-50), the modulated probe signal is sent to a PD (PD2) (Finisar, XPDV2120RA) and converted to an RF signal composed of a down-converted signal Sd1(t) and a de-chirped signal Sd2(t) in the PD2, and is collected by a homemade ADC with a sample rate of 500 MHz.

3.2. System Stability

In the first experiment, a motorized variable optical delay line is measured by the FTD measurement system to verify the system stability and the measurement accuracy. The optical delay line has an accuracy of 0.01 ps and a max delay of 1500 ps. We can specify the delay of the optical delay line flexibly through a host computer. The experiment can be divided into two stages.
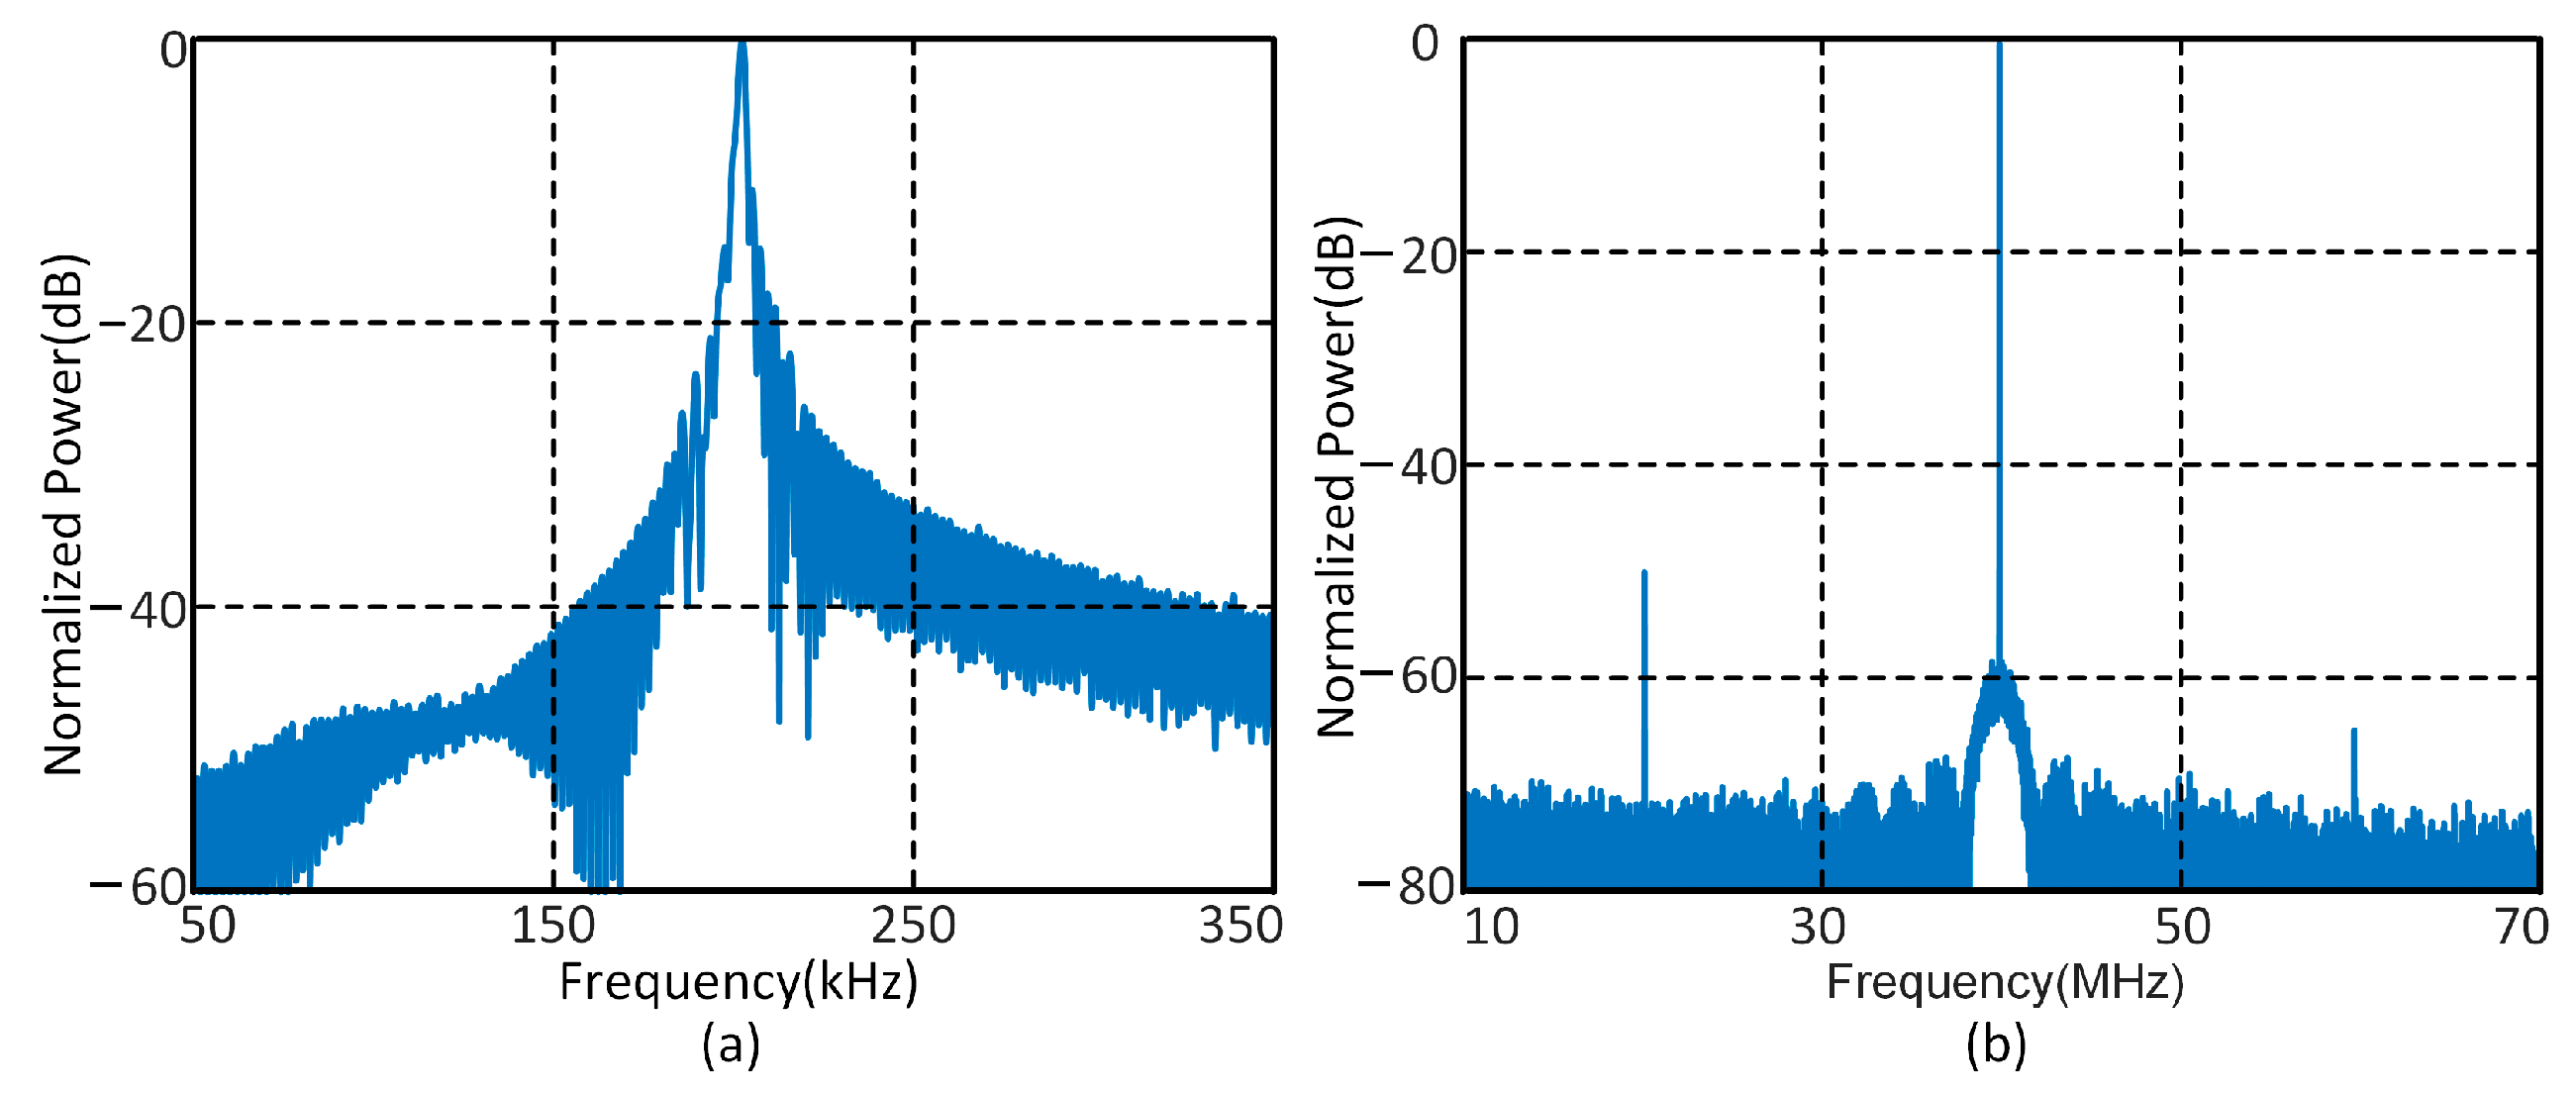
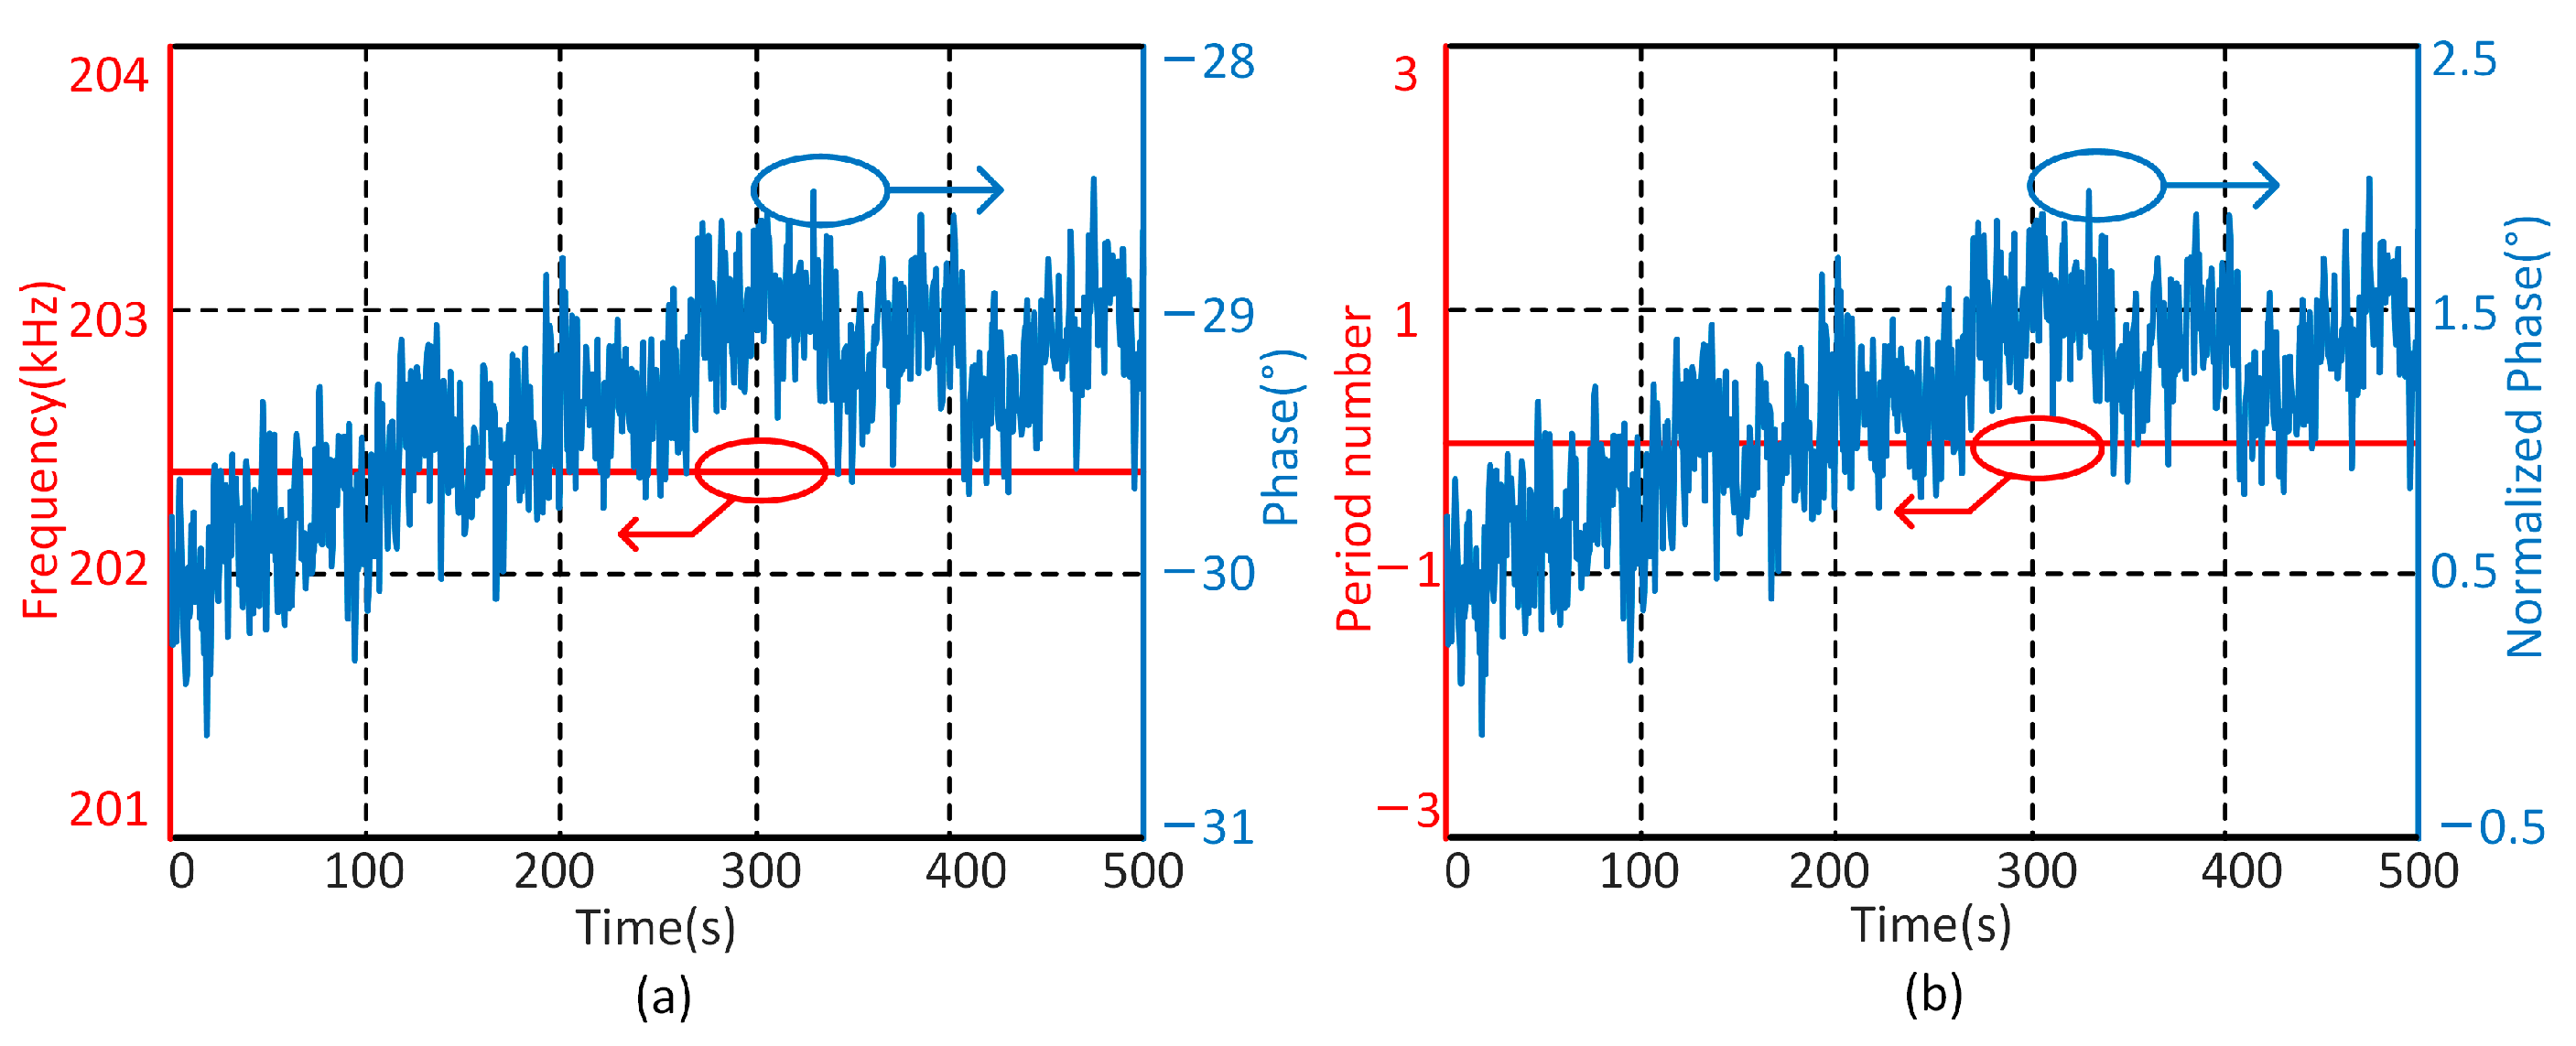
In the first stage, the FTD of the variable optical delay line is fixed at a constant value. Considering that the pigtail of the optical delay line is short, the measured results can be used to characterize the stability of the system. By performing fast Fourier transform (FFT), the normalized power spectrum density of the de-chirped signal and the down-converted signal are obtained, as shown in Figure 3a,b respectively. The peak frequencies and peak phases are plotted in Figure 4a without averaging. The time interval between the two peak frequencies (peak phases) is 1.2 s. The peak frequencies in Figure 4a show that the length of optical fiber patch cords and pigtails of devices is about 20.24 m. The peak frequencies and peak phases are normalized using the first measured value as a reference. The number of complete periods of 2π are calculated based on Equation (14). The number of periods and normalized peak phases are as shown in Figure 4b. Furthermore, the system delay can be calculated based on Equation (15), as shown in Figure 5. As can be seen, the system delay variation without temperature control is within 0.5 ps for 8 minutes.

3.3. Measurement Accuracy

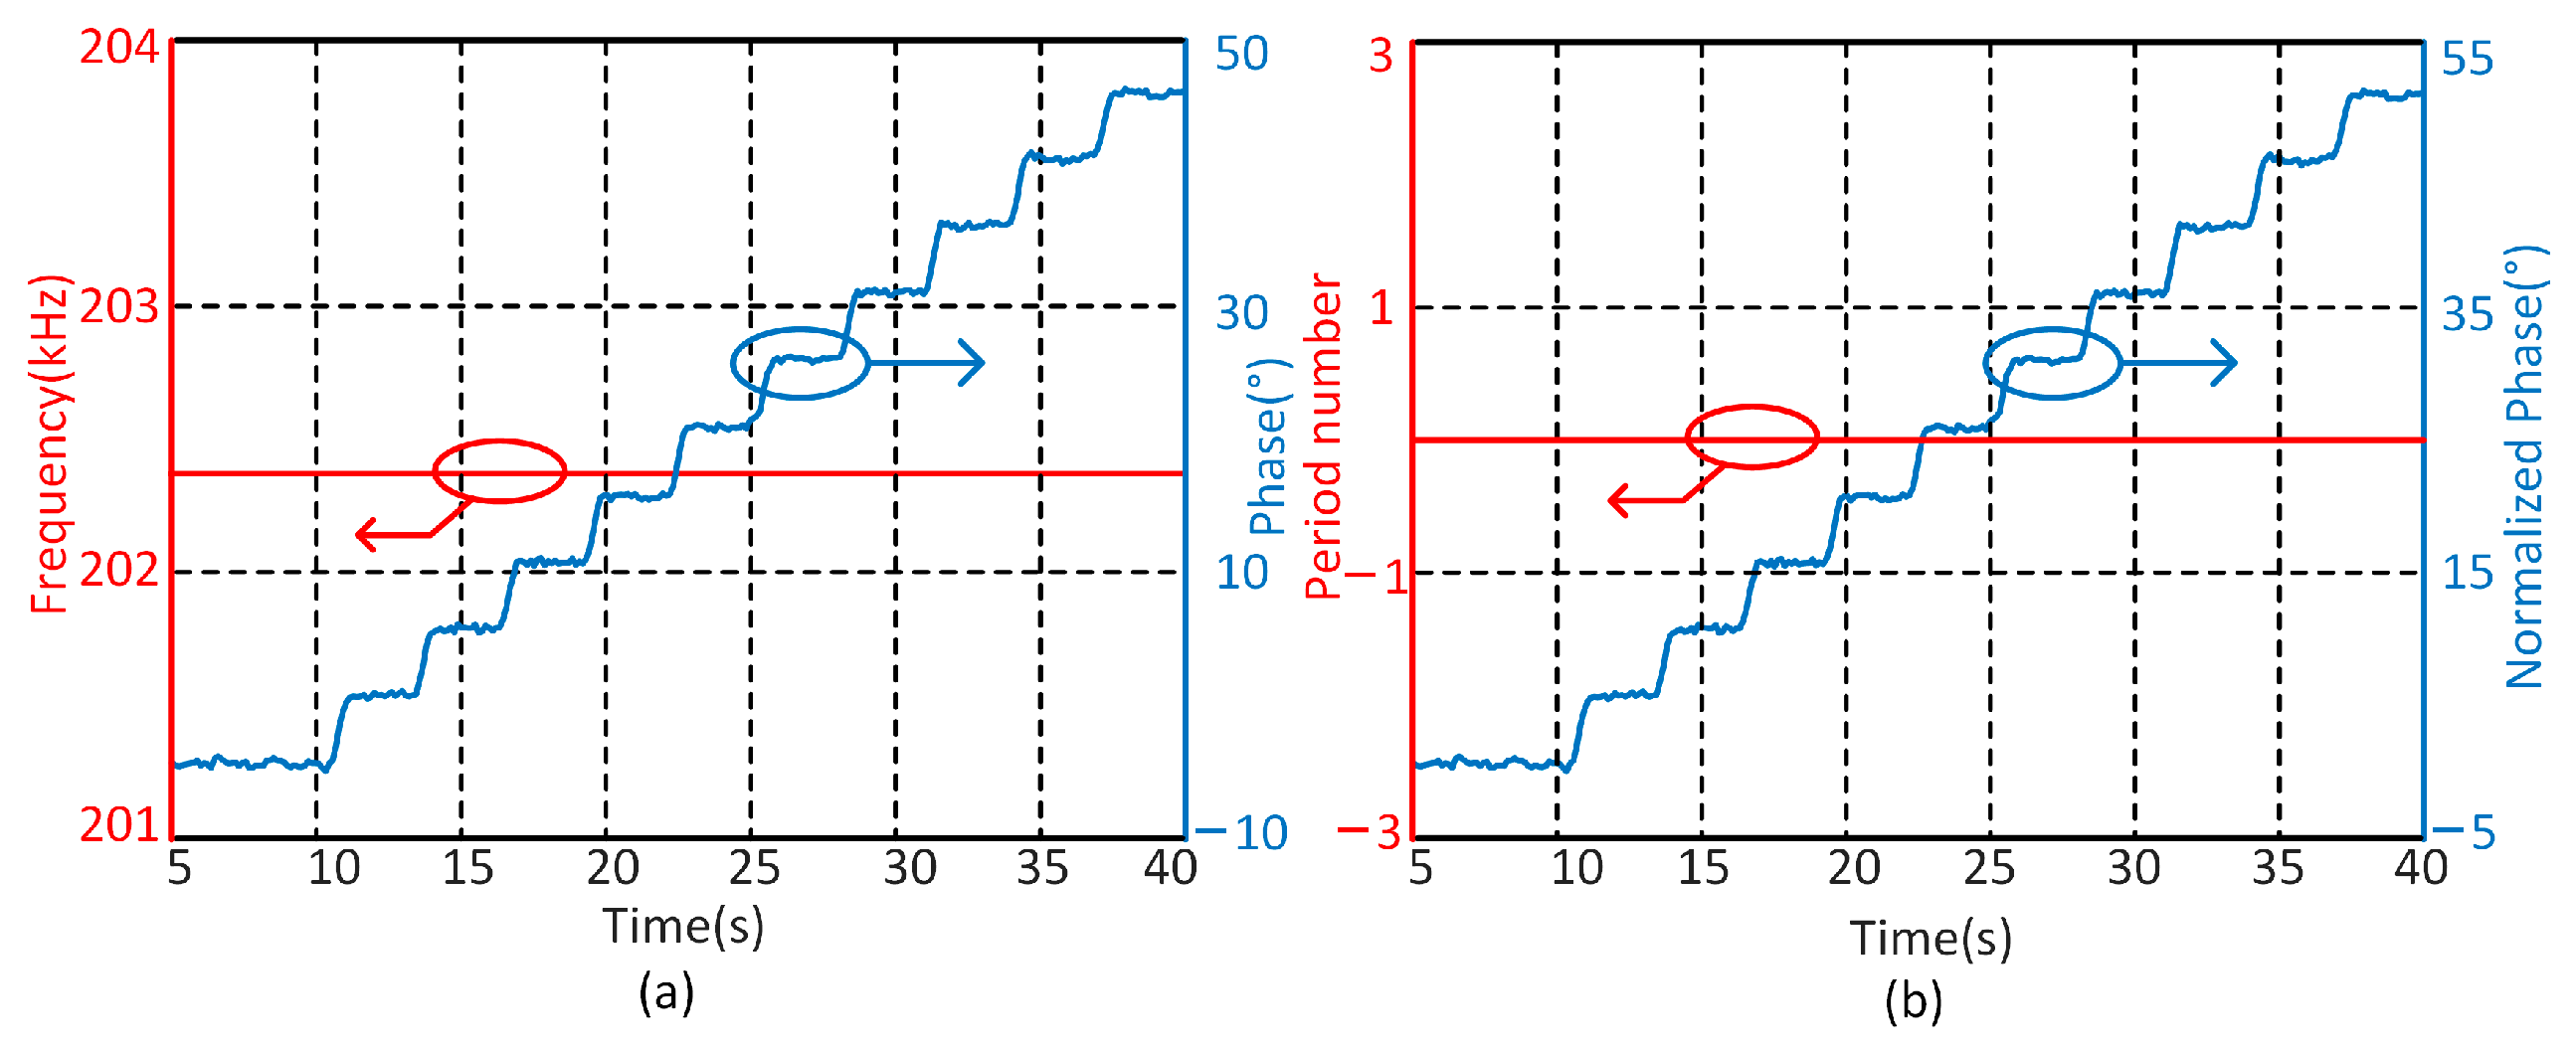
In the second stage of the first experiment, the optical delay line varies from 0 to 10 ps with a step of 1 ps. The peak frequencies and peak phases are shown in Figure 6a. The number of periods and normalized phases are shown in Figure 6b. The measured time delays are shown in Figure 7a. In Figure 7a, the blue dots represent the measured values. The red lines and error bars represent the mean values and deviations, respectively. The inset gives a zoomed-in view of the FTD changing from 5 ps to 6 ps. It is obvious that the measured values not only agree with the set values, but also show the details in the changing process of the FTD. By subtracting measured FTD from the set optical delay, the deviations are calculated. The deviations are plotted in Figure 7b. It is clear that the measurement accuracy is better than ±0.1 ps.

3.4. Measurement Range

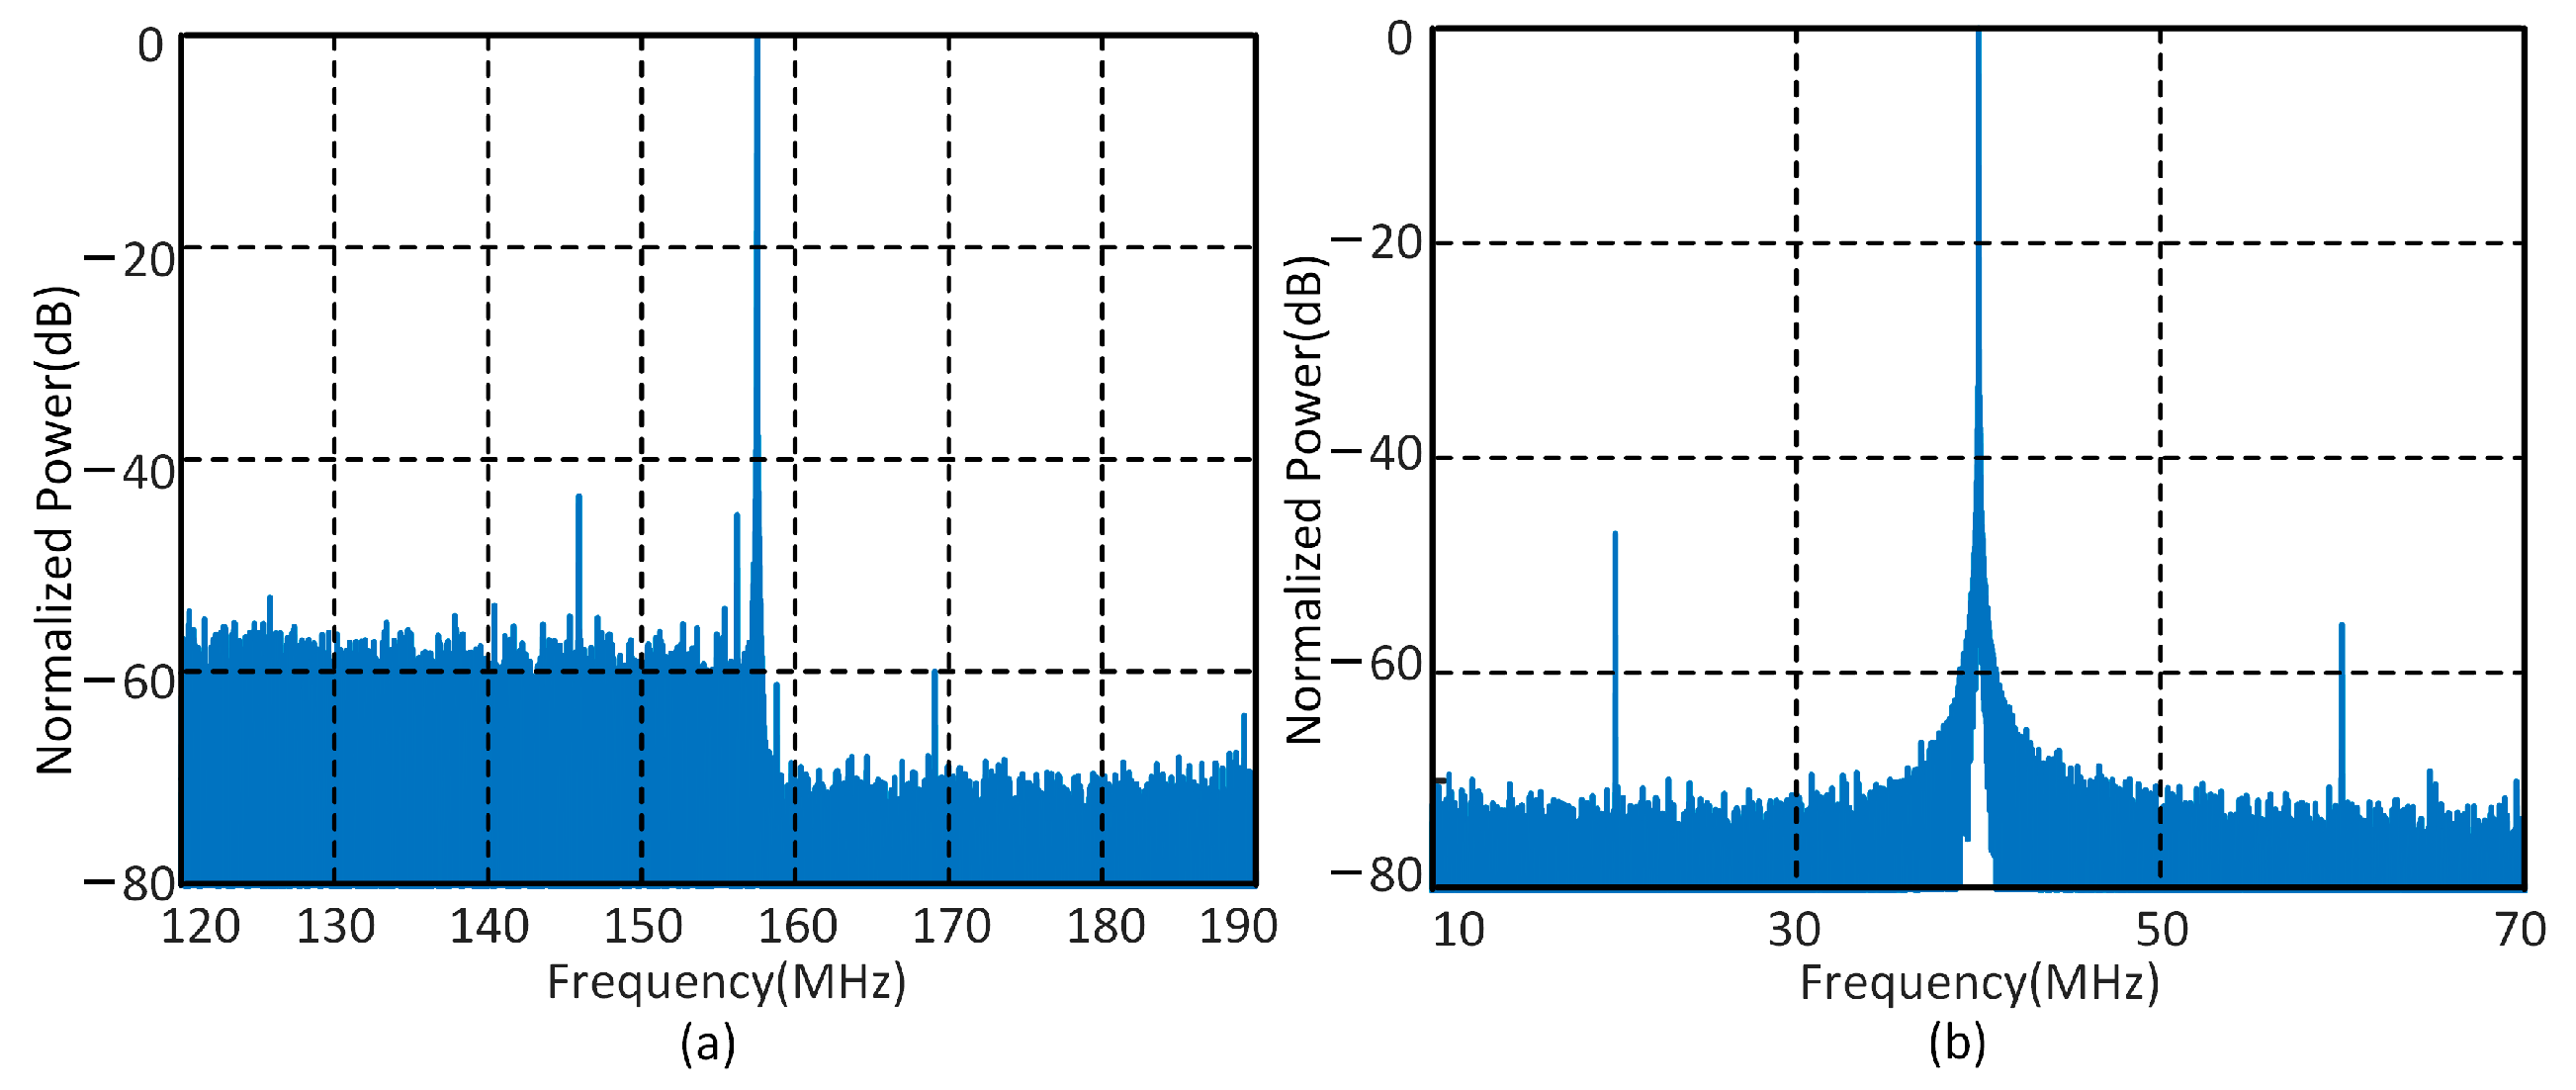
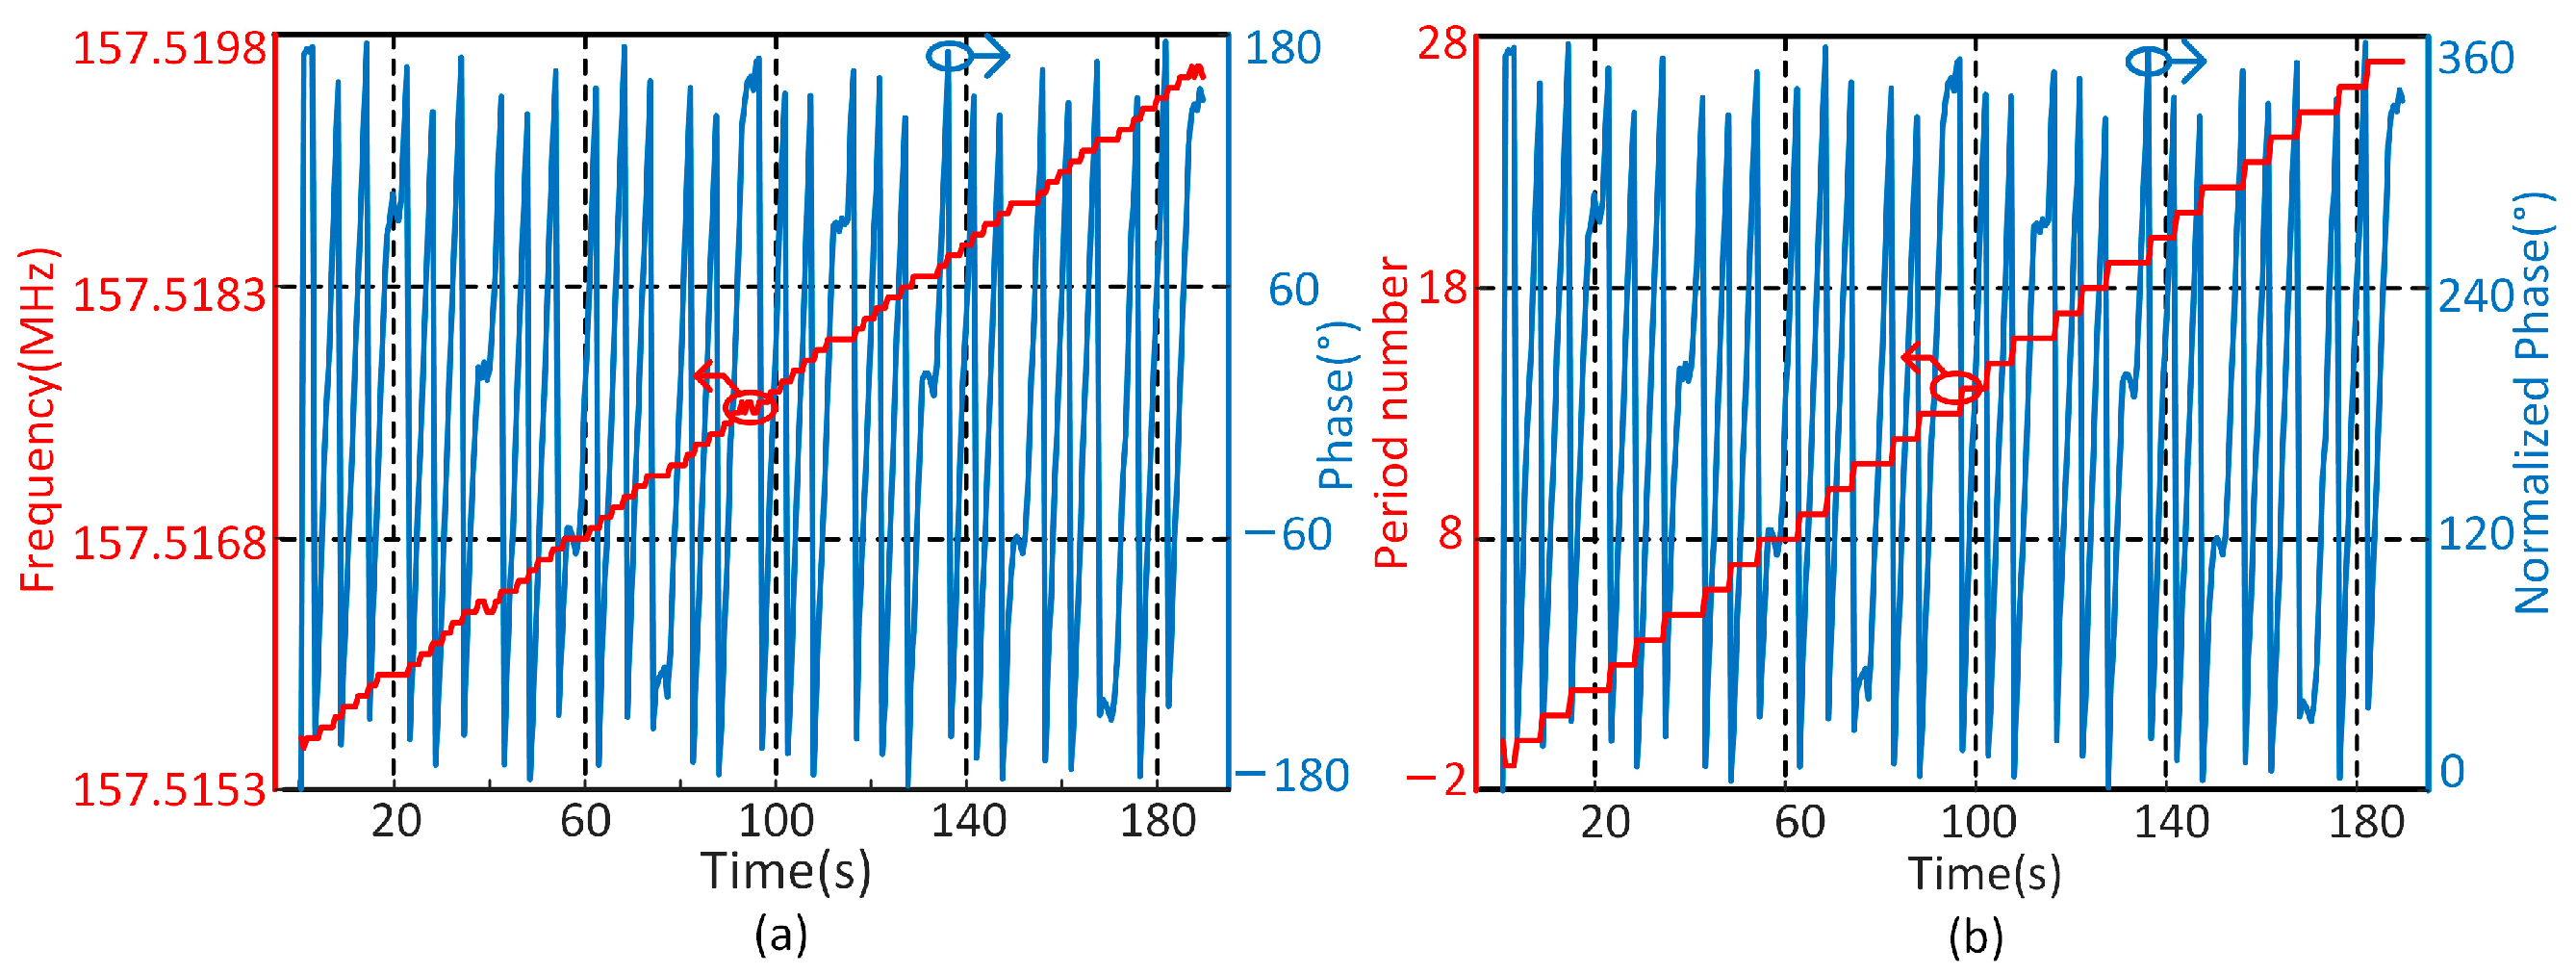
In the second experiment, the total FTD of a 15 km fiber spool and the variable optical delay line is measured to demonstrate the measurement range. The variable optical delay line varies from 0 to 2000 ps with a step of 200 ps. The normalized power spectrum density of the de-chirped signal and the down-converted signal are shown in Figure 8a,b respectively. The peak frequencies and peak phases are shown in Figure 9a. The number of periods and normalized phases are shown in Figure 9b. Clearly, the peak phase increases by 2π while the number of periods increase by 1. The measured FTDs are shown in Figure 10. A deviation about 4 ps is observed, which is due to the fact that the fiber of long distance is vulnerable to environmental change. The measured FTDs indicate that the measurement system has a measurement range of at least 15 km, while maintaining a high accuracy. It is important to note that by time-shifting the reference signal, the measurement range has the potential to extend to hundreds of kilometers.

4. Discussion

Taking into account the influence of different parameters on the FTD variation compensation of distributed radar systems, a comparison of various measurement systems has been made with regards to their accuracy, measurement range, measurement time, additional signals added to the distributed radars and compatibility with distributed radars, as indicated in Table 2.
The measurement range is related to the deployment capacity of the distributed radar. The greater the measurement range, the wider the coverage of the distributed radar that the measurement method can support. In terms of measurement range, all the methods listed in Table 2 meet the requirements of the distributed radar.
The measurement accuracy decides the accuracy of variation compensation that can be reached. Given that a phase jitter below 0.1 radian is needed to ensure the coherent detection performance [4], which corresponds to a time delay of 1.6 ps at a frequency of 10 GHz, the accuracy of TDMs can reach 1.7 ps by adopting a digital compensation chromatic dispersion. The accuracy of an FDM can reach 5 ps employing the injection-locking technique and cascaded four-wave-mixing process. However, the accuracy of TDMs and FDMs is not enough to compensate for FTD variation in distributed radars.
The measurement time reflects the response speed of the measurement system to the variation of the fiber network. The measurement time of the phase-locked loop based PRM [17] and the linear-frequency sweeping based PRM [19] is several seconds. Considering that certain tasks, such as target imaging, can be completed in mere seconds, the two PRMs mentioned above can only produce up to three measurement results during this limited time frame. As a result, it is not possible to accurately compensate the FTD variation using such a limited number of results. Compared with the two aforementioned PRMs, the nonlinear four-point sweeping based PRM [20] and the proposed system exhibit better performance. It is noteworthy that the measurement time of the proposed system is composed of signal acquisition and computation time. The signal acquisition time is 1.2 ms (two times of the period of the signal component), while the computation time is about 105 ms. The computation time can be reduced by adopting more efficient programming languages. That means the proposed system has the potential to lower the measurement time to just several milliseconds.
The additional signals added to the distributed radar can reflect the impact of the measurement system on the radar to some extent. As the number and complexity of the added signals increase, signals are more likely to interfere with each other. In comparison to other methods, the proposed method only requires the addition of a 7 GHz sinusoidal signal, which reduces the risk of interference.
The compatibility with distributed radars refers to the ability of the measurement system to measure the FTD delay of distributed radars. The mode-lock laser based FDM [14] and free-running laser based FDM [15] necessitate the probe signal to oscillate in the fiber network, which presents a significant challenge, especially when the radar signal is being transmitted in the fiber network. Some methods consider the fiber network as FUT, which leads to unnecessary duplication of hardware. In contrast, the proposed measurement system and the distributed radar can share the core function modules such as signal generation module and process module, as shown in Figure 2. By appropriately configuring the switching timing, both systems can operate concurrently and independently without interference. As a result, the proposed method enhances compatibility between the two systems, reduces overall complexity and has the potential to create a more cost-effective and efficient integration system.

5. Conclusions

In this paper, we propose a phase-derived ranging based FTD measurement using a composite signal. The measurement has an accuracy better than ± 0.1 ps, a measurement range at least 15 km and the measurement time has the potential to be several milliseconds. Compared with other methods, only a 7 GHz sinusoidal signal is added to distributed radars as a probe signal, which reduces the risk of signal interference. Additionally, an integration system of the proposed FTD measurement system with a typical distributed radar system is given, verifying the compatibility between two systems, which may provide a new method for variation compensation in distributed radars.

Author Contributions

Conceptualization, Q.S. and W.L.; Data curation, Q.S.; Formal analysis, Q.S. and J.Y.; Investigation, Q.S., C.L. and J.L.; Methodology, Q.S. and J.D.; Software, Q.S., J.D. and J.Y.; Validation, W.L.; Writing—original draft, Q.S.; Writing—review and editing, J.D. and W.L. All authors have read and agreed to the published version of the manuscript.

Funding

This research was funded by National Key Research and Development Program of China (grant no. 2018YFA0701900 and 2018YFA0701901), and National Natural Science Foundation of China (NSFC) (grant no. 62101536).

Data Availability Statement

The data presented in this study are available on request from the corresponding author.

Conflicts of Interest

The authors declare no conflict of interest.

References

  1. Haimovich, A.M.; Blum, R.S.; Cimini, L.J. MIMO radar with widely separated antennas. IEEE Signal Process. Mag. 2007, 25, 116–129. [Google Scholar] [CrossRef]
  2. Malacarne, A.; Maresca, S.; Scotti, F.; Ghelfi, P.; Serafino, G.; Bogoni, A. Coherent dual-band radar-over-fiber network with VCSEL-based signal distribution. J. Light. Technol. 2020, 38, 6257–6264. [Google Scholar] [CrossRef]
  3. Krehlik, P.; Sliwczynski, Ł.; Buczek, Ł.; Lipínski, M. Fiber-optic joint time and frequency transfer with active stabilization of the propagation delay. IEEE Trans. Instrum. Meas. 2012, 61, 2844–2851. [Google Scholar] [CrossRef]
  4. Pasya, I.; Kobayashi, T. Detection performance of M-sequence-based MIMO radar systems considering phase jitter effects. In Proceedings of the 2013 IEEE International Symposium on Phased Array Systems and Technology, Waltham, MA, USA, 15–18 October 2013; pp. 394–398. [Google Scholar]
  5. Barnoski, M.; Jensen, S. Fiber waveguides: A novel technique for investigating attenuation characteristics. Appl. Opt. 1976, 15, 2112–2115. [Google Scholar] [CrossRef] [PubMed]
  6. Wang, S.; Fan, X.; He, Z. Ultrahigh resolution optical reflectometry based on linear optical sampling technique with digital dispersion compensation. IEEE Photonics J. 2017, 9, 6804710. [Google Scholar] [CrossRef]
  7. Wang, X.; Yan, Z.; Wang, F.; Sun, Z.; Mou, C.; Zhang, X.; Zhang, L. SNR enhanced distributed vibration fiber sensing system employing polarization OTDR and ultraweak FBGs. IEEE Photonics J. 2015, 7, 6800511. [Google Scholar] [CrossRef]
  8. Wang, A.; Wang, Y. Chaos correlation optical time domain reflectometry. Sci. China Inf. Sci. 2010, 53, 398–404. [Google Scholar] [CrossRef] [Green Version]
  9. MacDonald, R. Frequency domain optical reflectometer. Appl. Opt. 1981, 20, 1840–1844. [Google Scholar] [CrossRef] [PubMed]
  10. Tsuji, K.; Shimizu, K.; Horiguchi, T.; Koyamada, Y. Coherent optical frequency domain reflectometry for a long single-mode optical fiber using a coherent lightwave source and an external phase modulator. IEEE Photonics Technol. Lett. 1995, 7, 804–806. [Google Scholar] [CrossRef]
  11. Tsuji, K.; Shimizu, K.; Horiguchi, T.; Koyamada, Y. Coherent optical frequency domain reflectometry using phase-decorrelated reflected and reference lightwaves. J. Light. Technol. 1997, 15, 1102–1109. [Google Scholar] [CrossRef]
  12. Ding, Z.; Yao, X.S.; Liu, T.; Du, Y.; Liu, K.; Han, Q.; Meng, Z.; Jiang, J.; Chen, H. Long measurement range OFDR beyond laser coherence length. IEEE Photonics Technol. Lett. 2012, 25, 202–205. [Google Scholar] [CrossRef]
  13. Wang, B.; Fan, X.; Wang, S.; Du, J.; He, Z. Millimeter-resolution long-range OFDR using ultra-linearly 100 GHz-swept optical source realized by injection-locking technique and cascaded FWM process. Opt. Express 2017, 25, 3514–3524. [Google Scholar] [CrossRef] [PubMed]
  14. Hu, Y.; Zhan, L.; Zhang, Z.; Luo, S.; Xia, Y. High-resolution measurement of fiber length by using a mode-locked fiber laser configuration. Opt. Lett. 2007, 32, 1605–1607. [Google Scholar] [CrossRef]
  15. Yun, K.; Li, J.; Zhang, G.; Chen, L.; Yang, W.; Zhang, Z. Simple and highly accurate technique for time delay measurement in optical fibers by free-running laser configuration. Opt. Lett. 2008, 33, 1732–1734. [Google Scholar] [CrossRef] [PubMed]
  16. Dong, J.; Wang, B.; Gao, C.; Guo, Y.; Wang, L. Highly accurate fiber transfer delay measurement with large dynamic range. Opt. Express 2016, 24, 1368–1375. [Google Scholar] [CrossRef] [PubMed] [Green Version]
  17. Dong, J.; Wang, B.; Gao, C.; Wang, L. Accurate and fast fiber transfer delay measurement based on phase discrimination and frequency measurement. Rev. Sci. Instrum. 2016, 87, 093102. [Google Scholar] [CrossRef] [Green Version]
  18. Si, H.; Wang, B.; Dong, J.; Wang, L. Accurate self-calibrated fiber transfer delay measurement. Rev. Sci. Instrum. 2018, 89, 083117. [Google Scholar] [CrossRef]
  19. Li, S.; Wang, X.; Qing, T.; Liu, S.; Fu, J.; Xue, M.; Pan, S. Optical fiber transfer delay measurement based on phase-derived ranging. IEEE Photonics Technol. Lett. 2019, 31, 1351–1354. [Google Scholar] [CrossRef]
  20. Li, S.; Qing, T.; Fu, J.; Wang, X.; Pan, S. High-accuracy and fast measurement of optical transfer delay. IEEE Trans. Instrum. Meas. 2020, 70, 8000204. [Google Scholar] [CrossRef]
  21. Li, S.; Qing, T.; Cao, M.; Chen, X.; Fang, Y.; Wang, X.; Pan, S. High-accuracy and stable measurement of optical time delay based on an optical Hilbert transformer. In Proceedings of the 4th Optics Young Scientist Summit (OYSS 2020), Ningbo, China, 28 February 2021; p. 117810C. [Google Scholar]
  22. Li, S.; Qing, T.; Fu, J.; Wang, X.; Pan, S. High-accuracy optical fiber transfer delay measurement using fiber-optic microwave interferometry. J. Light. Technol. 2020, 39, 627–632. [Google Scholar] [CrossRef]
  23. Liu, X.; Wang, L.; Tang, X.; Li, S.; Ma, C.; Yang, Y.; Jiang, X.; Huang, C.; Wang, X.; Pan, S. Optical Transfer Delay Measurement Based on Multi-frequency Phase-Derived Ranging. In Proceedings of the 2021 19th International Conference on Optical Communications and Networks (ICOCN), Qufu, China, 23–27 August 2021; pp. 1–6. [Google Scholar]
  24. Qiu, B.; Zhang, Y.; Sun, X.; Xu, Z.; Liang, X.; Wang, D.; Pan, S. Laser Ranging with Micrometer Precision and kHz Rate via Joint Frequency-Phase Measurement. IEEE Photonics Technol. Lett. 2022, 34, 1214–1217. [Google Scholar] [CrossRef]
  25. Sun, Q.; Dong, J.; Liu, C.; Yang, J.; Zhang, X.; Li, W. Scalable distributed microwave photonic MIMO radar based on a bidirectional ring network. Opt. Express 2021, 29, 31508–31519. [Google Scholar] [CrossRef] [PubMed]
  26. Dong, J.; Zhang, F.; Jiao, Z.; Sun, Q.; Li, W. Microwave photonic radar with a fiber-distributed antenna array for three-dimensional imaging. Opt. Express 2020, 28, 19113–19125. [Google Scholar] [CrossRef]
  27. Zhang, F.; Gao, B.; Pan, S. Photonics-based MIMO radar with high-resolution and fast detection capability. Opt. Express 2018, 26, 17529–17540. [Google Scholar] [CrossRef] [Green Version]
  28. Gao, B.; Zhang, F.; Sun, G.; Xiang, Y.; Pan, S. Microwave Photonic MIMO Radar for High-resolution Imaging. J. Light. Technol. 2021, 39, 7726–7733. [Google Scholar] [CrossRef]
  29. Dong, J.; Sun, Q.; Jiao, Z.; Zhang, L.; Yin, Z.; Huang, J.; Yu, J.; Wang, S.; Li, S.; Zheng, X. Photonics-enabled distributed MIMO radar for high-resolution 3D imaging. Photonics Res. 2022, 10, 1679–1688. [Google Scholar] [CrossRef]
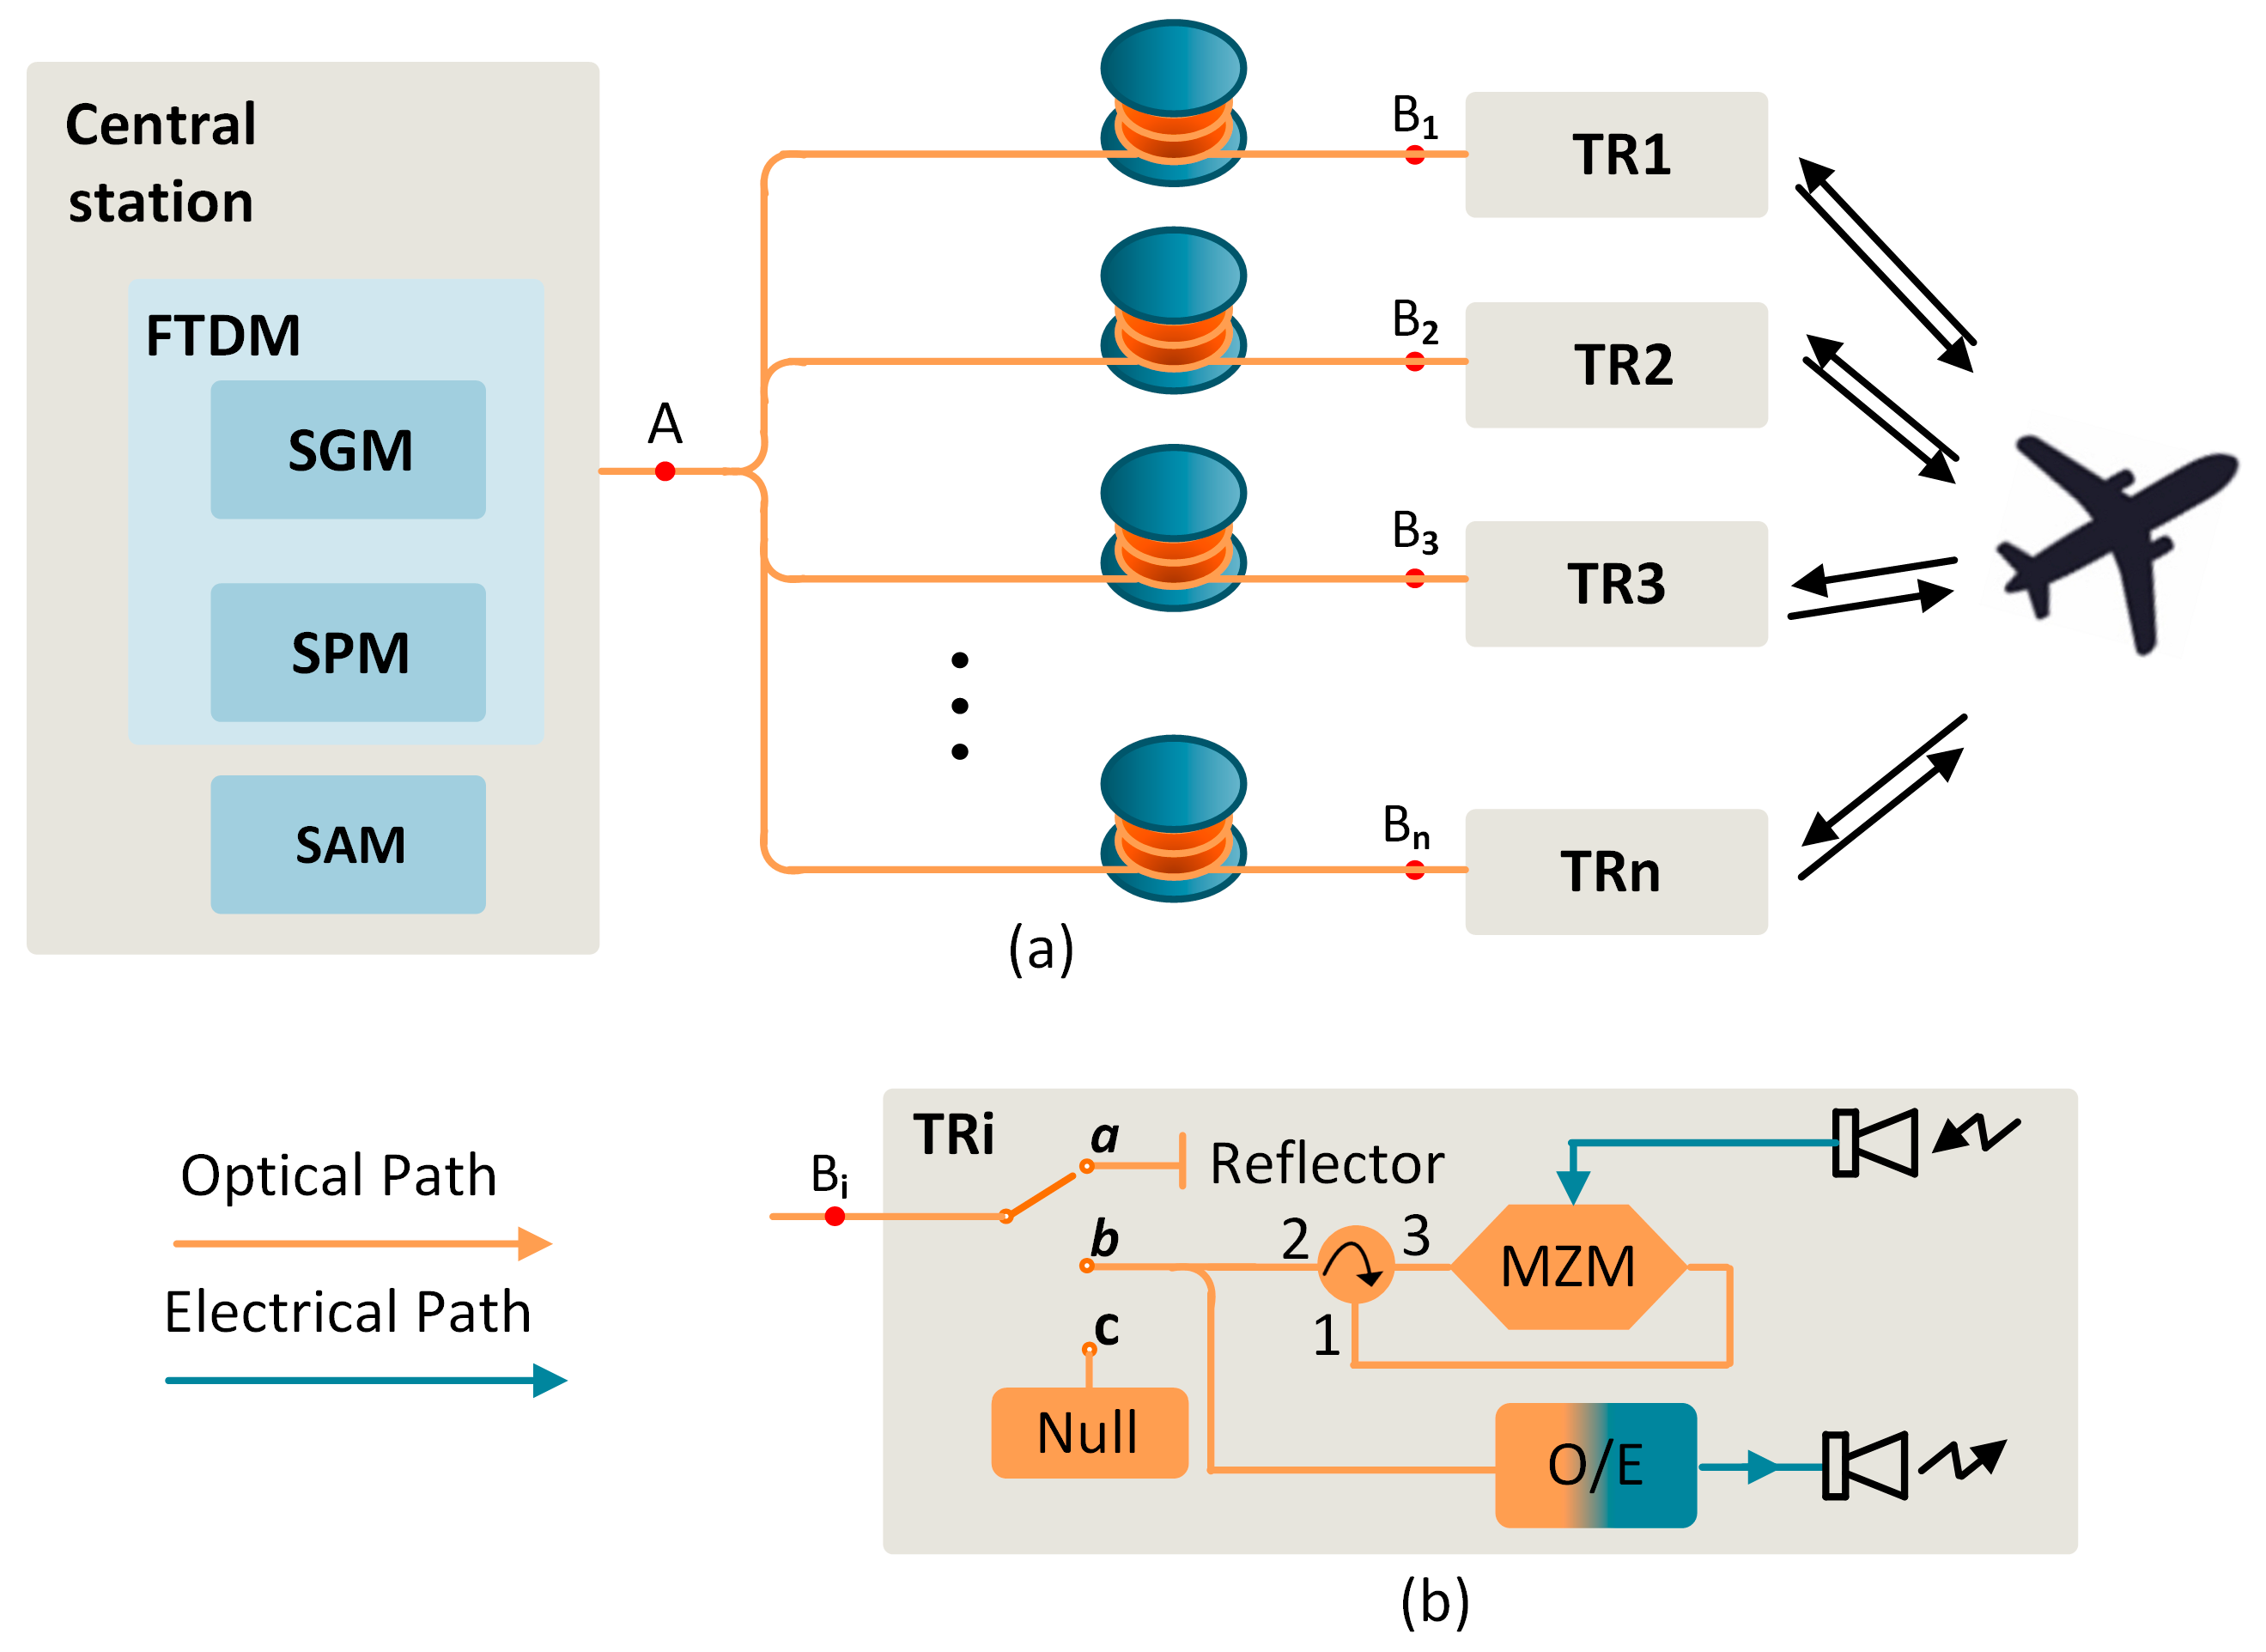
Figure 1. (a) An integration system of the proposed FTD measurement system with the distributed radar. (b) The diagram of TRi. FTDM, fiber transfer delay measurement system; SGM, signal generation module; SPM, signal process module; SAM, signal acquisition module; MZM, Mach–Zehnder modulator; O/E, opto-electrical converter.
Photonics 10 00421 g001
Figure 2. The schematic diagram of the proposed time delay measurement system. LD, laser; MZM, Mach–Zehnder modulator; EDFA, erbium-doped fiber amplifier; PD, photodetector; PC, polarization controller; LNA, low-noise amplifier; EBPF, electrical band-pass filter; ELPF, electrical low-pass filter; OBPF, optical band-pass filter; ADC, analog-to-digital converter.
Photonics 10 00421 g002
Figure 3. The normalized power spectrum density of the de-chirped signal (a) and the down-converted signal (b).
Photonics 10 00421 g003
Figure 4. Measurement results when FTD is fixed. (a) measured peak frequencies (red) and peak phases (blue); (b) the number of periods (red) and normalized phases (blue).
Photonics 10 00421 g004
Figure 5. The system delay with a fixed FTD.
Photonics 10 00421 g005
Figure 6. Measurement results when FTD varies with a step of 1 ps. (a) measured peak frequencies (red) and peak phases (blue); (b) the number of periods (red) and normalized phases (blue).
Photonics 10 00421 g006
Figure 7. (a) The measured FTDs of the variable optical delay line; (b) the delay deviations of the measured FTDs.
Photonics 10 00421 g007
Figure 8. The normalized power spectrum density of the de-chirped signal (a) and the down-converted signal (b).
Photonics 10 00421 g008
Figure 9. Measurement results when FTD varies with a step of 200 ps. (a) measured peak frequencies (red) and peak phases (blue); (b) the number of periods (red) and normalized phases (blue).
Photonics 10 00421 g009
Figure 10. The measurement FTD of a 15 km fiber spool and a variable optical delay line.
Photonics 10 00421 g010
Table 1. Parameters of two composite signals.
ParametersS1S2
Sinusoidal ComponentLFM ComponentSinusoidal Component LFM Component
Start frequency7.02 GHz7 GHz7 GHz7 GHz
Pulse width500 µs500 µs500 µs500 µs
Period600 µs600 µs600 µs600 µs
Bandwidth/0.5 GHz/0.5 GHz
Table 2. Comparison of the Measurement Systems.
CategoryMethodsAccuracyMeasurement RangeMeasurement TimeAdditional Signals Added to Distributed RadarsCompatibility with
Distributed Radars
TDMsOTDR [6]1.7 ps20 km/Ultrashort optical pulsesMiddle
Chaotic light based TDM [8]300 ps50 km/A broadband chaotic lightMiddle
FDMsOFDR based on injection-locking technique and cascaded FWM process [13] 5 ps2 km/A linear-frequency sweeping optical signalMiddle
Mode-lock laser based FDM [14]25 ns50 km//Low
Free-running laser based FDM [15]28 ps 100 kmSeveral minutes/Low
PRMsPhase-locked loop based PRM [17]0.2 ps100 kmSeveral secondsA frequency-sweeping signal with a bandwidth of 6 MHzMiddle
Linear-frequency sweeping based PRM [19]0.2 ps40 km Several secondsA frequency-sweeping signal with a bandwidth of 1 MHzMiddle
Nonlinear four-point sweeping based PRM [20]0.1 ps74 km48 msFour single tones (5.59 GHz, 5.590001 GHz, 5.591 GHz, 5.6 GHz)Middle
Proposed system0.2 ps15 km106 msA sinusoidal signal (7 GHz)High
Disclaimer/Publisher’s Note: The statements, opinions and data contained in all publications are solely those of the individual author(s) and contributor(s) and not of MDPI and/or the editor(s). MDPI and/or the editor(s) disclaim responsibility for any injury to people or property resulting from any ideas, methods, instructions or products referred to in the content.