Abstract
The technical specifications and the evaluation of the remote operation of the open-path, tunable diode laser absorption spectroscopic (TDLAS) instrument are presented. The instrument is equipped with two low optical power diode lasers in the near-infrared spectral range for the atmospheric detection of carbon dioxide, methane, and water vapors (CO2, CH4, and H2O). Additionally, the instrument eliminates the requirement of retroreflectors since it detects the back reflection of the laser beam from any topographic target. The instrument was operated remotely by measuring background concentrations of CO2 and CH4 in the atmosphere from 24 November 2022 to 4 January 2023. The accuracy of CO2 and CH4 measurement retrievals on a 200 m laser path was estimated at 20 ppm (4.8%) and 60 ppb (3.1%), respectively. The CH4 accuracy is comparable, but the CO2 accuracy is noticeably lower than the accuracy achieved in local operation. The accuracy issues raised are studied and discussed in terms of the laser driver’s cooling performance.
1. Introduction
Detailed greenhouse gas (GHG) emission estimation requires extensive atmospheric concentration measurements of regions with high GHG emissions (cities, airports, power plants, oil and natural gas production and distribution facilities, landfills, cultivated fields, etc.). Calculation of the emissions from these specific locations has large uncertainties due to insufficient emission monitoring [1,2,3]. The installation and operation of ground-based stations are considered an optimal solution for detecting and monitoring GHG concentrations [4,5] from such locations. Therefore, robust, reliable, easy-to-maintain, remotely-operated instruments detecting GHG in the atmosphere are essential to survey GHG concentrations in the atmosphere from places with high emissions. These instruments must have low detection limits and high accuracies to measure global variations of GHG concentrations. In particular, their accuracy must be in the range of sub-ppm for carbon dioxide (CO2) detection and a few ppb for methane (CH4) detection.
Optical spectroscopy techniques possess high sensitivity, good selectivity, and continuous, real-time detection [6,7,8]. Open-path optical spectroscopy techniques such as Fourier-transform infrared (FTIR) spectroscopy and differential optical absorption spectroscopy (DOAS) have been employed to measure trace gas column concentrations. Several research groups have developed FTIR and DOAS systems for measuring column concentrations of various trace gases simultaneously, using sunlight (passive), lamps, or LEDs (active) as the light source [9,10,11,12]. However, the broadband light source has a low spectral resolution, which limits gas detection sensitivity.
The Total Carbon Column Observing Network (TCCON) operates high-sensitivity, stationary FTIR spectrometers [13] that measure total columns of CO2, CO, CH4, N2O, H2O, HF, and other atmospheric gases. In addition, the COllaborative Carbon Column Observing Network (COCCON) is a greenhouse-gas-observing network that uses common FTIR instrumental standards and data analysis procedures [14]. The main objective of the COCCON is to increase global greenhouse gas observations due to the simplicity of the FTIR spectrometers used on the network. Both networks provide measurements of column-averaged abundances of GHGs by analyzing the solar radiation using Fourier-transform infrared (FTIR) spectrometers. These two networks should be considered the standard in optical spectroscopy for GHG detection due to the instrumentation and methodology employed.
Tunable diode laser absorption spectroscopy (TDLAS) has the potential to achieve high sensitivities because it utilizes robust and reliable distributed feedback (DFB) laser diodes that emit light in the near-infrared spectral range, exhibit excellent wavelength stability, and offer narrow spectral resolutions over a wide range of temperatures and current conditions, making them suitable for use in harsh environments. Open-path TDLAS is a flexible, cost-effective sensing technology for measuring selected target gases in complex mixtures associated with evolving modern industrial applications [15,16].
Several research groups have reported the construction and deployment of open-path TDLAS sensors [17]. Zimmerman et al. reported an open-path TDLAS sensor used to measure CO2 concentrations along a fixed 100 m path [18]. The sensor proved effective as an alarm-type system intended for personnel safety. Bailey et al. developed an open-path TDLAS instrument for CO2 absorption measurements over a 200 m long horizontal path to a retroreflector [19]. Xia et al. presented measurements of both CO2 and CH4 over a 2.6 km long path using an open-path TDLAS instrument [20]. Therefore, measurement of CO2 column concentration in a large number of regions based on open-path TDLAS is valuable for improving climate warming.
All these works and developed instruments require the establishment of reflectors; otherwise, short-range operation of the open-path instrument is a requirement [21,22]. However, the installation of retroreflectors used for efficient collection of back-reflected light is a limitation. Retroreflectors reduce the suitable number of sites and require precise alignment. Due to this, the instrument’s installation becomes complex and the remote operation and maintenance of the system is difficult, reducing the robustness of the system.
In this paper, we present in detail the design and specifications, and the results of the remote operation, of an open-path TDLAS instrument to monitor atmospheric CO2 and CH4 concentrations. The device is designed to operate at long laser path ranges (from 100 m up to 1 km) and is capable of detecting back reflection of topographic targets, eliminating the establishment of reflectors for efficient detection. Furthermore, we present the evaluation of the performance of the device during remote operation for more than a month.
2. Materials and Methods
2.1. DIAL Methodology
The range-resolved gas assessments are calculated from the recorded signal using the differential absorption lidar (DIAL) technique [23,24]. DIAL uses the retrieval of the atmospheric reflected light from a laser that is transmitted into the atmosphere. The wavelength is alternated successively between two wavelengths, one coinciding with an absorption line of the gas of interest (λon), the other in proximity but out of the absorption line (λoff). The averaged gas imprint over a range of z is calculated from the ratio of the atmospheric reflected light at the two wavelengths. It is presumed that the atmosphere and the detection system have the same properties at the two wavelengths apart from the absorption due to the gas of interest:
where, z is the propagation range of the laser beam from the device to the reflection surface, P (λon) and P (λoff) are the recorded signals at λon and λoff, N is the averaged gas concentration in the atmospheric line of the laser beam, and σ (λ) is the gas absorption cross-section which can be found in the literature [25,26].
Even though the DIAL method lies on the recorded signal intensities at two different laser wavelengths (the λon and λoff), the proposed approach uses the peak amplitude obtained from the full absorption spectrum. A fitting process of the data is necessary to improve the accuracy of the measurement since the recorded signal has a low signal-to-noise ratio (SNR). The instrument operates at a low elevation (<500 m), where the atmospheric pressure has a dominant effect on broadening the absorption peaks. Therefore, a Lorentz function is selected to fit the absorption peaks since this function predicts the broadening due to pressure [27]. The ln (P (λon)/P (λoff)) value that is required in the DIAL equation to calculate the concentration of the GHGs is equal to the difference in the maximum from the baseline of the fitted function.
The accuracy of the calculation of the atmospheric GHG concentrations is impacted by two major sources of error; the uncertainty in the distance z value between the device position and the reflective surface and the SNR which affects the accuracy of the fitting function. Thus, the error of the instrument is derived from the equation:
where s (N) is the error of the calculated averaged gas concentration, z is the range of the laser beam, s (z) is the error of the range z, A is equal to the ln (P (λon)/P (λoff)) that is calculated from the fitted function, s (A) is the error of A, and σ (λ) is the gas absorption cross-sections derived from the HITRAN database [25,26]. The s (A) is the standard error produced from the fitting procedure. The s (A) value is calculated from the square root of the diagonal of the parameters’ covariance matrix.
The CO2 and CH4 content calculation from DIAL Equation (1) requires the measurement of the laser range z. The range z was calculated using the method demonstrated in our previous work [28] based on the absorption lines of water vapors recorded in the CH4 spectrum at 6047.77 cm−1. The atmospheric parameters (vapor pressure, temperature, atmospheric pressure) were recorded simultaneously with the laser back-reflection measurements using a local weather station installed in the vicinity of the device. The water vapor concentration in the atmosphere is calculated from the specific atmospheric parameters. The distance z from the laser sensor to the object is calculated using once more the DIAL method and the water vapor concentration:
where NH2O is the water vapor concertation in the atmosphere calculated from the water station measurements, PH2O (λon) and PH2O (λoff) are the recorded signals at λon and λoff, and σH2O (λ) are the gas absorption cross-sections which can be found in the literature [25,26].
2.2. Design and Manufacturing
The system (Figure 1) and the methodology for GHG concentration measurements have been presented in detail in previous work [29]. The system is equipped with two cw DFB tunable diode lasers in a 14-pin butterfly package. The first one has a central wavelength of 1.57 μm (6369 cm−1) with a linewidth of 1 MHz and maximum output power of 60 mW (Toptica, #LD-1550-0060-DFB-1) and is used for the detection of atmospheric CO2. The second one emits around 1.652 μm (6053 cm−1) with a linewidth lower than 2 MHz and maximum output power of 15 mW (ld-pd, PL-DFB-1650-A-A81-PA) for the detection of CH4. Two current and temperature controllers (Maiman, SF8075-ZIF14) regulate each laser. The emission wavelengths of the CO2 and CH4 detection lasers were adjusted from 6365 to 6375 cm−1 and 6040 to 6050 cm−1, respectively.
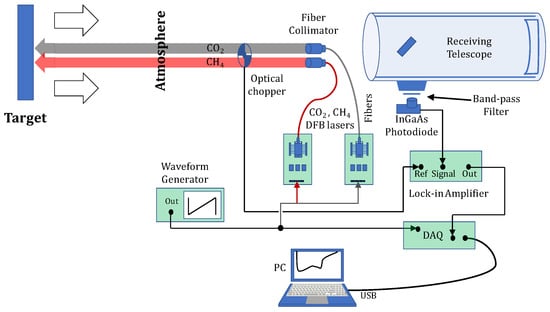
Figure 1.
Diagram of the instrument’s setup.
The laser beam propagates through single-mode fibers and collimates using fiber collimators with a focal length of 19 mm (Thorlabs, F280APC-1550). Finally, an optical chopper modulates the laser beam (Scitec, 360C-OEM) at a low frequency (400 Hz) before being transmitted into the atmosphere. The square pulse signal generated from the rotation of the chopper is used as a reference signal to the lock-in amplifier.
The back-reflected light is collected by an f/5 Newtonian telescope (SkyWatcher, 200/1000 PDS) with a 1 m focal length mirror and detected by a homemade amplified photodetector equipped with a 3 mm diameter InGaAs diode (Hamamatsu, G12180-130A). A dual-phase digital lock-in amplifier (Femto, LIA-200MVD-H) amplifies the photodetector’s signal by using the optical chopper signal as a reference to achieve maximum sensitivity.
A full profile of the absorption peak is recorded by wavelength scanning of the laser beam instead of the two-wavelength (on-line and off-line) approach that is usually employed.
The instrument’s mechanical design must be adapted to overcome various challenges that arise from its remote operation. These challenges are imposed by the constraints from the installation location and the selection of the measurement orientation, as well as the need to protect the instrument from environmental conditions. The device has an envelope of 1.45 m × 0.5 m × 0.45 m, an approximate weight of 70 kg, and was fully modeled in 3D (Figure 2).
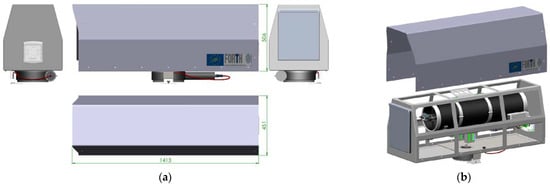
Figure 2.
CAD images of the instrument’s (a) external and (b) internal configuration (dimensions in mm).
To ensure that the laser beams propagate above the designated canopy, a supporting pole for the device was designed. Simulation of the device and the poll was applied using finite element methods to ensure durability at the installation height. Moreover, a slewing drive was installed to rotate the device at the desired orientation. The slewing drive was equipped with a reduction and DC motor with integrated Hall sensors for position control. In addition, an inductive sensor was installed to initialize the drive system.
The welded frame and the cover were constructed using stainless steel galvanized sheets. High temperatures during summer can affect the device’s performance amid remote operation in the Mediterranean region. To address this issue, the device and the cover were externally painted white to reflect sunlight during summer and internally black on the inside to reduce unwanted light reflection. In addition, the device was equipped with a ventilation fan that generated an air stream towards the hatch to reduce contamination by dust particles during the dry summer season.
The telescope and electronics were mounted on the frame, while the laser fiber optics were attached to the telescope (Figure 3a). Moreover, a hatch was designed using two stepper motors with threaded rods. The hatch mechanism was based on an extruded aluminum V-slot frame and was driven by two synchronized stepper motors via a T8 trapezoidal axis. The hatch was sealed from aluminum profiles with integrated rubber. Terminal switches are activated in the open and closed positions and are used to control the hatch.
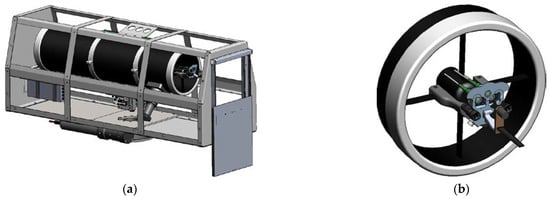
Figure 3.
CAD image of the (a) instruments internal configuration and (b) laser diode collimator mount.
The alignment requirement of the laser diodes is crucial for the smooth operation of the instrument. Therefore, a miniature stage that can support up to three collimators with independent movement, and one optical chopper for all lasers, was designed and manufactured (Figure 3b). The specific configuration was attached to the support cross of the telescope auxiliary mirror.
For quality assurance, all devices were subjected to a 20-day period of continuous operational indoor tests. These tests included power on/off cycle, hatch operation, sensor checking, and continuous full measurement cycles.
2.3. Hardware
A single-board computer (Raspberry Pi 3) was used for handling, remote control, communications, data handling, and transmission. The laser drivers are connected via USB connection and controlled by UART protocol. Motor functions, power distribution (supply) to the subsystems, sensor reading, and partly the data collecting is handled by a microcontroller board (Arduino DUE) with a custom shield and firmware. The microcontroller is connected to the Raspberry Pi 3 via a serial connection, which allows it to receive commands and send status updates. The 12-bit ADC of the microcontroller is used to record the value of the lock-in amplifier during the measurement (Figure 4).
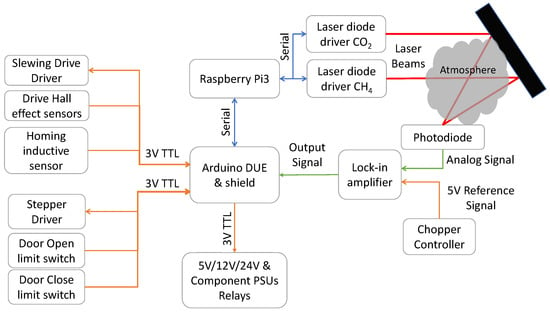
Figure 4.
Device control diagram.
The system is powered by 220 V AC and turns on when connected to power as the Raspberry Pi has its own power supply directly connected to the power line. A 12 V/24 V, 100 W power supply provides power to the motor drivers, the ventilation, and the optical chopper driver. Each laser driver has an exclusive 5 V, 35 W power supply. Additionally, each of the optical components (lock-in amplifier, photodiode, and optical chopper) are powered by separate power supplies with specifications recommended by the manufacturers. The power supplies are activated by individual relays on the shield depending on the operating stage. To control the hatch stepper motors, a TB6600 guide was used. A Single DC motor driver (DRI00042) was chosen to drive the DC rotation motor. The Arduino shield also receives signals from the door terminal switches, the zero-position induction sensor, and the integrated hall sensors in the rotation motor for position control.
2.4. Software
Python was used to implement the control software for the instruments, allowing for seamless communication with the subsystems such as laser drivers and an Arduino shield, as well as external connectivity. After initialization at startup, the microcontroller enters a serial communication standby mode. The software performs various functions including hatch operation, azimuth movement, relay control, status reporting, and lock-in amplifier data acquisition. The laser drivers are controlled using serial hex commands, which are sent through the Raspberry Pi.
The device can operate in two modes depending on the tasks performed: field mode or calibration/debug mode. During remote operation of the instrument for GHG monitoring, the field mode is selected that enables autonomous operation without external input from a user. Minimum external commands allow the instrument to operate more reliably, providing consistent measurements of GHG concentrations. However, during the installation of the device, calibration/debug mode is activated. In this mode, a user provides the commands required to set up and calibrate the system. Furthermore, calibration/debug mode is selected to confirm the proper operation of the components and to certify the instrument’s performance for remote operation. In addition, this mode is used for remote software upgrades and debugging.
On system startup, field operation is initialized by default and internet connectivity is established by an Azure server. When a measurement request is issued, the device begins the measurement cycle (Figure 5). Moreover, a graphical user interface (GUI) was developed for calibration, testing, and debugging.

Figure 5.
Flowcharts (a) for the device operation (b) for the measurement procedure.
The lock-in amplifier output, the laser driver current, and the temperature are recorded. Information such as the device’s date and time, position angle, door status, internal temperature, and selected laser driver status is also controlled and monitored.
2.5. Installation and Testing Location
The instrument was installed in the Kato Valsamonero village, Crete, Greece, a rural area dominated by olive trees (Figure 6 and Figure 7). A weather station was also installed to simultaneously measure the weather conditions in the area (relative humidity, air temperature, wind speed, and direction).
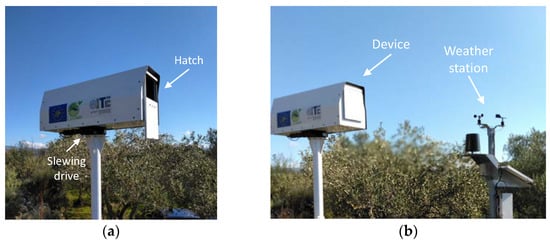
Figure 6.
Image (a) of the device with (b) the weather station installed in Kato Valsamonero, Crete, Greece.
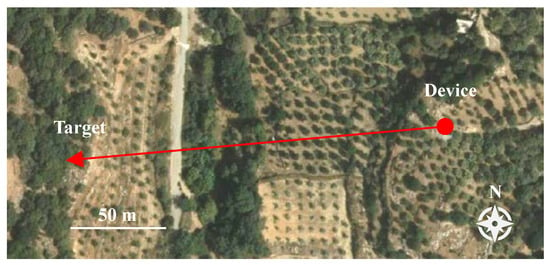
Figure 7.
Map of the instrument’s installation location (image from the Hellenic Land Registry [30]).
Any available topographic target that provides sufficient reflection for the laser beam is suitable for the system’s operation such as a nearby mountain, hill, or building. The methodology followed is unaffected by the absorption characteristics of a surface since the wavelength scan range of the lasers is 1 nm, approximately. In such a short spectral range, the variation in the absorption coefficient is expected to be negligible. The instrument is directed towards a surface at a distance of 200 ± 5 m. The distance was calculated applying the DIAL method on the water vapor peak at 6047.77 cm−1 recorded in the CH4 spectra (Figure 8b). A single measurement of each GHG had a 15 min duration.
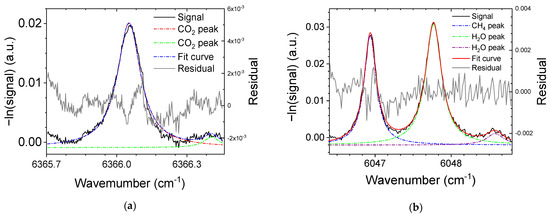
Figure 8.
Typical (a) CO2 signal, fitted function, and the residual between the fitted profile and the CO2 signal; and (b) CH4 and H2O signal, fitted functions, and the residual between the fitted profile and the CH4 signal.
3. Results
Remote Operation and Measurements
The recorded signal of the CO2 absorption line and the fitted function of a typical measurement is presented in Figure 8a. Moreover, the recorded peaks of the CH4 absorption line with the water vapor absorption lines and their fitted functions are presented in Figure 8b.
The instrument performance and the accuracy of the methodology to measure GHG concentrations in the atmosphere were evaluated during remote operation of the device for a period higher than a month from 24 November 2022 until 4 January 2023. The recorded concentrations of the CO2 and the CH4 in the atmosphere are presented in Figure 9a,b, respectively. The mean reduced chi-square () value for CO2 fitting is 1.015 and for CH4 fitting is 1.070. Therefore, the fitting process produces statistically reliable ln (P (λon)/P (λoff)) values since the is sufficiently small.
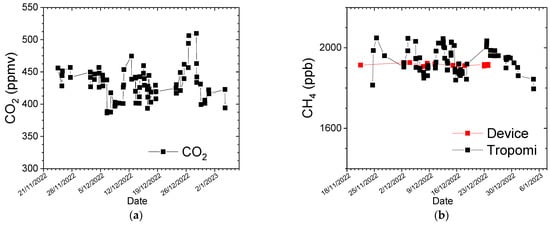
Figure 9.
Concentration variation in (a) CO2 and (b) CH4 in the atmosphere from 24 November 2022 to 4 January 2023.
The mean CO2 concentration value calculated during the instrument’s remote operation was 430 ± 20 ppm which is 2.6% higher than the global value provided by NOAA (418.95 ppb, December 2022) [31]. Furthermore, the measurement deviation of the monitoring area compared with the reference values is smaller than the measurement error (4.6%).
However, the measured atmospheric CO2 content variation is noticeably higher than that reported in our recent work (Figure 9a), which is attributed to the lower atmospheric temperatures during the remote operation of the device compared with the summer season measurements. Low atmospheric temperature affects the performance of the thermoelectric cooling (TEC) driver of the CO2 laser. In particular, the TEC is ineffective in stabilizing the temperature of the laser (Figure 10). The laser temperature instability changes the wavelength of the laser and affects the recorded signal, which causes a broadening of the CO2 absorption peak. Even though the CO2 laser suffers from TEC stability in lower air temperatures, the CH4 laser temperature remains stable at all temperatures due to the lower electric current required for CH4 laser operation than the CO2 laser. The lower current produces a smaller thermal load, which is easily compensated by the TEC module. In any case, a future upgrade of the device is necessary to enhance the laser driver’s thermal insulation, enabling it to operate effectively at lower temperatures without compromising the performance of the TEC driver.
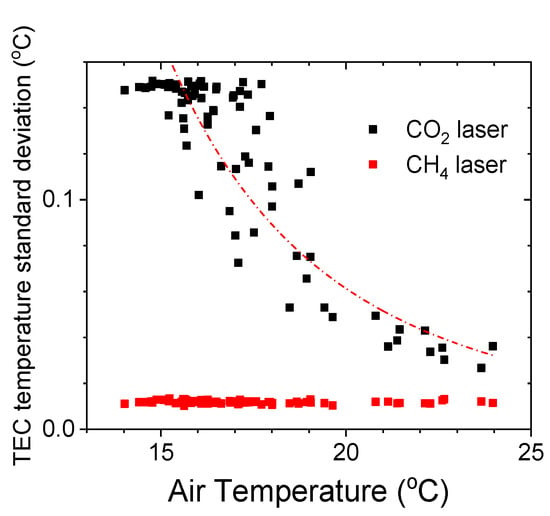
Figure 10.
Standard deviation of the CO2 and CH4 laser temperature during a CO2 and CH4 atmospheric measurement at various air temperatures.
The CH4 concentration presented no significant variation during the remote operation of the device (Figure 9b). The mean CH4 concentration calculated during the instrument’s remote operation was 1940 ± 60 ppb. This value is 1.3% higher than the global values provided by NOAA (1915.86 ppb, September 2022) [32] and 1.2% higher than the value of the Kato Valsamonero area provided by the TROPOMI instrument (1917 ± 6 ppm) of the Sentinel5P observatory [33,34] (Figure 9b). Furthermore, the measurement deviation of the monitoring area compared with the reference values is smaller than the measurement error (3.1%) and is similar to those reported by our recent work. Therefore, the device accuracy is probably even better than those derived by the error calculations.
4. Conclusions
Developing robust, reliable, and simple-to-operate and maintain instruments is crucial for effective GHG emission monitoring. These instruments must ensure accurate and precise measurements in various environments and conditions, including harsh weather, extreme temperatures, and remote locations.
In this study, we present the technical specifications and the evaluation of the remote operation of the open-path, tunable diode laser absorption spectroscopic (TDLAS) instrument. The instrument is equipped with two near-infrared lasers at 1.57 μm and 1.65 μm to measure the atmospheric concentrations of CO2 and CH4, respectively.
Any topographic target that provides detectable reflection to the device can be used to measure GHG, thereby eliminating the requirement of retroreflector installation. This design feature substantially simplifies the instrument’s installation complexity as well as the operational and maintenance costs.
The device was installed in a rural area in Crete, Greece, and operated remotely from 24 November 2022 to 4 January 2023. During the remote operation of the instrument, any manual intervention from a user was unnecessary, enabling autonomous operation. Such a minimum external interference allows the instrument to operate more reliably, providing consistent measurements of GHG concentrations.
The DIAL method was applied to calculate the mean concentration of CO2 and CH4 gases in the atmosphere along the propagation path of the laser beam. The path length of the laser beam from the device to the back-reflection target is 200 ± 5 m, calculated based on the water vapor concentration in the atmosphere and the water peak height recorded in the CH4 spectrum. Over the remote operation period of the instrument, the average atmospheric background concentrations of CO2 and CH4 were measured to be 430 ± 20 ppm and 1940 ± 60 ppb, respectively.
Low performance of TEC at lower air temperatures leads to lower CO2 measurement accuracy. Therefore, improving the insulation of the electronics of the laser driver will enhance the accuracy of the CO2 measurement.
The successful remote operation of the instrument demonstrates its potential as an effective tool for measuring GHG atmospheric concentrations. The ability to remotely operate the device is essential for monitoring emissions in hard-to-reach or remote locations where continuous monitoring has previously been difficult or impossible to perform.
Author Contributions
Conceptualization, P.S. and M.V.; methodology, P.S.; data curation, G.P.; software, G.P.; writing—original draft preparation, P.S.; writing—review and editing, G.P. and M.V.; supervision, M.V. All authors have read and agreed to the published version of the manuscript.
Funding
This study was co-funded by the European Commission in the framework of the LIFE17 CCM/GR/000087 project “Innovative technologies for climate change mitigation by Mediterranean agricultural sector (LIFE ClimaMed)”.
Data Availability Statement
Unprocessed data are available from the http://iot-telemetry.green-projects.gr/ (accessed on 28 March 2023) website upon request. For related information, please visit the LIFE ClimaMed project site at https://life-climamed.eu/ (accessed on 28 March 2023).
Acknowledgments
We would like to express our gratitude to Nikolaos Tsotsolas and GreenProject SA for their installation of the weather station and their operation of the internet gate, which enabled us to remotely access the instrument.
Conflicts of Interest
The authors declare no conflict of interest.
References
- Solazzo, E.; Crippa, M.; Guizzardi, D.; Muntean, M.; Choulga, M.; Janssens-Maenhout, G. Uncertainties in the Emissions Database for Global Atmospheric Research (EDGAR) Emission Inventory of Greenhouse Gases. Atmos. Chem. Phys. 2021, 21, 5655–5683. [Google Scholar] [CrossRef]
- European Commission; Joint Research Centre; Institute for Environment and Sustainability. Uncertainty Estimates and Guidance for Road Transport Emission Calculations; Publications Office of the European Union: Luxembourg, 2010; ISBN 978-92-79-15307-5. [Google Scholar]
- Marland, G. Uncertainties in Accounting for CO2 From Fossil Fuels. J. Ind. Ecol. 2008, 12, 136–139. [Google Scholar] [CrossRef]
- Lloyd, C.R.; Rebelo, L.-M.; Max Finlayson, C. Providing Low-Budget Estimations of Carbon Sequestration and Greenhouse Gas Emissions in Agricultural Wetlands. Environ. Res. Lett. 2013, 8, 015010. [Google Scholar] [CrossRef]
- Verifying Greenhouse Gas Emissions: Methods to Support International Climate Agreements; National Research Council (U.S.), National Research Council (U.S.), National Research Council (U.S.), Eds.; National Academies Press: Washington, DC, USA, 2010; ISBN 978-0-309-15211-2. [Google Scholar]
- Wang, F.; Cheng, Y.; Xue, Q.; Wang, Q.; Liang, R.; Wu, J.; Sun, J.; Zhu, C.; Li, Q. Techniques to Enhance the Photoacoustic Signal for Trace Gas Sensing: A Review. Sens. Actuators A Phys. 2022, 345, 113807. [Google Scholar] [CrossRef]
- Picqué, N.; Hänsch, T.W. Frequency Comb Spectroscopy. Nat. Photon 2019, 13, 146–157. [Google Scholar] [CrossRef]
- Queißer, M.; Burton, M.; Fiorani, L. Differential Absorption Lidar for Volcanic CO2 Sensing Tested in an Unstable Atmosphere. Opt. Express 2015, 23, 6634. [Google Scholar] [CrossRef]
- Kern, C.; Trick, S.; Rippel, B.; Platt, U. Applicability of Light-Emitting Diodes as Light Sources for Active Differential Optical Absorption Spectroscopy Measurements. Appl. Opt. 2006, 45, 2077. [Google Scholar] [CrossRef]
- Ohyama, H.; Kawakami, S.; Tanaka, T.; Morino, I.; Uchino, O.; Inoue, M.; Sakai, T.; Nagai, T.; Yamazaki, A.; Uchiyama, A.; et al. Observations of XCO2 and XCH4 with Ground-Based High-Resolution FTS at Saga, Japan, and Comparisons with GOSAT Products. Atmos. Meas. Tech. 2015, 8, 5263–5276. [Google Scholar] [CrossRef]
- Griffith, D.W.T.; Pöhler, D.; Schmitt, S.; Hammer, S.; Vardag, S.N.; Platt, U. Long Open-Path Measurements of Greenhouse Gases in Air Using near-Infrared Fourier Transform Spectroscopy. Atmos. Meas. Tech. 2018, 11, 1549–1563. [Google Scholar] [CrossRef]
- Butz, A.; Guerlet, S.; Hasekamp, O.; Schepers, D.; Galli, A.; Aben, I.; Frankenberg, C.; Hartmann, J.-M.; Tran, H.; Kuze, A.; et al. Toward Accurate CO2 and CH4 Observations from GOSAT: GOSAT CO 2 AND CH 4 VALIDATION. Geophys. Res. Lett. 2011, 38, L14812. [Google Scholar] [CrossRef]
- Wunch, D.; Toon, G.C.; Blavier, J.-F.L.; Washenfelder, R.A.; Notholt, J.; Connor, B.J.; Griffith, D.W.T.; Sherlock, V.; Wennberg, P.O. The Total Carbon Column Observing Network. Phil. Trans. R. Soc. A 2011, 369, 2087–2112. [Google Scholar] [CrossRef]
- Frey, M.; Sha, M.K.; Hase, F.; Kiel, M.; Blumenstock, T.; Harig, R.; Surawicz, G.; Deutscher, N.M.; Shiomi, K.; Franklin, J.E.; et al. Building the COllaborative Carbon Column Observing Network (COCCON): Long-Term Stability and Ensemble Performance of the EM27/SUN Fourier Transform Spectrometer. Atmos. Meas. Tech. 2019, 12, 1513–1530. [Google Scholar] [CrossRef]
- Helmut, H.T.; Ureña, A.G.; Robert, J. Donovan Environmental and Other Analytical Applications. In Laser Chemistry: Spectroscopy, Dynamics and Applications; John Wiley & Sons: Chichester, UK; Hoboken, NJ, USA, 2007; pp. 395–408. ISBN 978-0-471-48570-4. [Google Scholar]
- Lackner, M. Tunable Diode Laser Absorption Spectroscopy (TDLAS) in the Process Industries—A Review. Rev. Chem. Eng. 2007, 23, 65. [Google Scholar] [CrossRef]
- Xin, F.; Li, J.; Guo, J.; Yang, D.; Wang, Y.; Tang, Q.; Liu, Z. Measurement of Atmospheric CO2 Column Concentrations Based on Open-Path TDLAS. Sensors 2021, 21, 1722. [Google Scholar] [CrossRef] [PubMed]
- Zimmerman, J.W.; Ii, R.A.L.; Blakley, C.S.; Frish, M.B.; Laderer, M.C.; Wainner, R.T. Tunable Diode Lase Absorption Spectrometers for CO2 Wellhead and Pipeline Leakage Monitoring: Experiences from Prototype Testing at the Illinois Basin—Decatur Project, USA. Energy Procedia 2014, 63, 4083–4094. [Google Scholar] [CrossRef]
- Bailey, D.M.; Adkins, E.M.; Miller, J.H. An Open-Path Tunable Diode Laser Absorption Spectrometer for Detection of Carbon Dioxide at the Bonanza Creek Long-Term Ecological Research Site near Fairbanks, Alaska. Appl. Phys. B 2017, 123, 245. [Google Scholar] [CrossRef]
- Xia, J.; Zhu, F.; Zhang, S.; Kolomenskii, A.; Dong, J.; Okada, K.; Strohaber, J.; Schuessler, H.A. Probing Greenhouse Gases in Turbulent Atmosphere by Long-Range Open-Path Wavelength Modulation Spectroscopy. Opt. Lasers Eng. 2019, 117, 21–28. [Google Scholar] [CrossRef]
- Liang, W.; Wei, G.; He, A.; Shen, H. A Novel Wavelength Modulation Spectroscopy in TDLAS. Infrared Phys. Technol. 2021, 114, 103661. [Google Scholar] [CrossRef]
- Li, J.; Yang, X.; Li, L.; Wang, Z.; He, L.; Wu, Z.; Du, Z. Simultaneous Standoff Sensing for Methane and Hydrogen Sulfide Using Wavelength-Modulated Laser Absorption Spectroscopy with Non-Cooperative Target. Sens. Actuators B Chem. 2023, 374, 132825. [Google Scholar] [CrossRef]
- Ismail, S.; Browell, E.V. LIDAR|Differential Absorption Lidar. In Encyclopedia of Atmospheric Sciences; North, G.R., Pyle, J., Zhang, F., Eds.; Elsevier: Amsterdam, The Netherlands, 2015; pp. 277–288. ISBN 978-0-12-382225-3. [Google Scholar]
- Differential Absorption Lidar Technique (DIAL). In Elastic Lidar: Theory, Practice, and Analysis Methods; Kovalev, V.A., Eichinger , W.E., Eds.; John Wiley: Hoboken, NJ, USA, 2004; ISBN 978-0-471-20171-7. [Google Scholar]
- Gordon, I.E.; Rothman, L.S.; Hargreaves, R.J.; Hashemi, R.; Karlovets, E.V.; Skinner, F.M.; Conway, E.K.; Hill, C.; Kochanov, R.V.; Tan, Y.; et al. The HITRAN2020 Molecular Spectroscopic Database. J. Quant. Spectrosc. Radiat. Transf. 2022, 277, 107949. [Google Scholar] [CrossRef]
- HITRAN on the Web. Available online: https://hitran.iao.ru/home (accessed on 1 February 2023).
- Liou, K.-N. An Introduction to Atmospheric Radiation, 2nd ed.; International Geophysics Series; Academic Press: Amsterdam, The Netherlands, 2002; ISBN 978-0-12-451451-5. [Google Scholar]
- Siozos, P.; Psyllakis, G.; Velegrakis, M. A Continuous-wave, Lidar Sensor Based on Water Vapour Absorption Lines at 1.52 Μm. Remote Sens. Lett. 2022, 13, 1164–1172. [Google Scholar] [CrossRef]
- Siozos, P.; Psyllakis, G.; Samartzis, P.C.; Velegrakis, M. Autonomous Differential Absorption Laser Device for Remote Sensing of Atmospheric Greenhouse Gases. Remote Sens. 2022, 14, 460. [Google Scholar] [CrossRef]
- Hellenic Land Registry. Available online: http://gis.ktimanet.gr/wms/ktbasemap/default.aspx (accessed on 2 February 2023).
- Lan, X.P.; Tans, K.W. Thoning Trends in Globally-Averaged CO2 Determined from NOAA Global Monitoring Laboratory Measurements. Version 2023-02. Available online: http://gml.noaa.gov/ccgg/trends/ (accessed on 4 March 2023).
- Lan, X.; Thoning, K.W.; Dlugokencky, E.J. Trends in Globally-Averaged CH4, N2O, and SF6 Determined from NOAA Global Monitoring Laboratory Measurements. Version 2023-01. Available online: https://doi.org/10.15138/P8XG-AA10 (accessed on 4 March 2023).
- Veefkind, J.P.; Aben, I.; McMullan, K.; Förster, H.; de Vries, J.; Otter, G.; Claas, J.; Eskes, H.J.; de Haan, J.F.; Kleipool, Q.; et al. TROPOMI on the ESA Sentinel-5 Precursor: A GMES Mission for Global Observations of the Atmospheric Composition for Climate, Air Quality and Ozone Layer Applications. Remote Sens. Environ. 2012, 120, 70–83. [Google Scholar] [CrossRef]
- Copernicus Data Space Ecosystem. Available online: https://dataspace.copernicus.eu/ (accessed on 1 February 2023).
Disclaimer/Publisher’s Note: The statements, opinions and data contained in all publications are solely those of the individual author(s) and contributor(s) and not of MDPI and/or the editor(s). MDPI and/or the editor(s) disclaim responsibility for any injury to people or property resulting from any ideas, methods, instructions or products referred to in the content. |
© 2023 by the authors. Licensee MDPI, Basel, Switzerland. This article is an open access article distributed under the terms and conditions of the Creative Commons Attribution (CC BY) license (https://creativecommons.org/licenses/by/4.0/).