Abstract
Photonic crystal has become a powerful technique for regulating electromagnetic waves due to its excellent features, such as structure designability and dynamic adjustability; in addition, it has great application value. In this paper, we visualize colors on the Ostwald color model and analyze the color differences of each group of color patches via the minimum color difference model. The manipulation law of particle size, temperature, and humidity on the color change of photonic crystal hydrogel is verified by these color analyses.
1. Introduction
It is well known that light is a type of electromagnetic radiation of a certain frequency, only a small segment of which can be perceived by the eye; that is, the range of what is commonly known as the visible spectrum, with different wavelengths causing different color sensations [1]. The measurement of color—colorimetry—is developed into a multi-science field in metrology, which cannot be separated from visual matching experiments. Any color can be obtained by mixing three colors (red, green, and blue; RGB for short) in a certain proportion, which is a commonly used color space for CRT displays (the cathode ray tube), scanners, and digital cameras [2]. The International Commission on Illumination (CIE) identified a LAB mode (CIELAB), which theoretically includes all the colors visible to the human eye. Color palettes are ubiquitous in color design. A color palette usually contains a number of color patches that represents the colors used in a design or an image. Interest in developing and sharing color palettes has grown considerably in recent years [3]. There are many color palette generators currently available, among which is the well-known Adobe Color CC, where a color palette, typically consisting of about five individual colors, can be generated either from a color wheel or from an imported image based on a user’s choice of preferences (color rule).
Different from chemical color, scientific research shows that the structural color of organisms is mostly due to the optical effect and superposition of thin-film interference, diffraction effect, and light scattering from their own microstructure [4]; such as butterfly wings, opals, peacock feathers, etc. These colors come from their own ordered structure [5]. Scientists define this multilayer regular structure as “photonic crystal”, which is an ordered structure material formed by two or more materials with different refractive indexes in a certain arrangement order. The concept of the photonic crystal was proposed in 1987 by E. Yablonovitch [6] and S. John [7] based on the semiconductor concept and the electronic bandgap concept. Through reasonable design of the refractive index, lattice constant, and other parameters, the propagation of the electromagnetic wave and spontaneous radiation can be controlled; in addition, the photonic crystal with a specific bandgap can be artificially customized. The introduction of these conceptual theories for the first time realized the free regulation of electromagnetic wave, so that the direction of electromagnetic waves could be freely selected according to demand.
Due to the Bragg diffraction effect caused by the periodic structure, the electromagnetic wave will be hindered when passing through the photonic crystal structure and form the photonic band structure; defining the bandgaps between different energy bands as photonic bandgap (PBG) [8]. Electromagnetic waves whose frequencies are just within the bandgap of the photonic crystal will be forbidden to propagate, while those outside the bandgap will propagate almost losslessly. As shown in Figure 1, when the photonic crystal’s bandgap is within the visible range (380–780 nm), electromagnetic waves within the bandgap will be prevented from spreading and reflected back; thus, producing bright structural colors. By adjusting the lattice spacing of the photonic crystal or the refractive index of the photonic crystal material, the photonic bandgap of the photonic crystal can be changed; thus, to realize the effective design and regulation of the photonic crystal structural color.
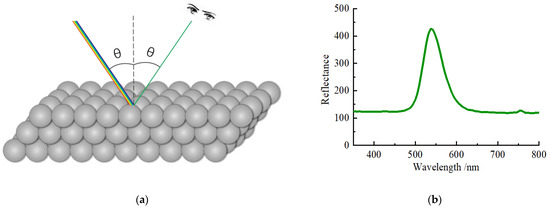
Figure 1.
(a) Schematic diagram and (b) reflection spectrum of photonic crystal generating structural color under incident light irradiation.
Monodisperse polystyrene microspheres are functional materials with excellent properties, such as high cohesion, large specific surface area, high mechanical properties, strong adsorption, and surface reactivity. Therefore, it is often used to prepare photonic crystals. Two-dimensional photonic crystals [9] are prepared by the needle tip-flow method [10,11], top-down approaches [12], etc. based on the capillary force [13] on the liquid surface [14]. Polymer microspheres self-assemble in a thin layer of liquid surface or between the gas–liquid interface [15], obtaining ordered arrays to realize periodic modulation of the dielectric constant. The preparation of 3D photonic crystals mainly adopts the top-down colloidal self-assembly method, which is widely used in experimental research due to its advantages of low cost and easy operations [16]. These colorful photonic crystals have important applications in areas such as color displays, biological and chemical sensors, inks and paints, and many optical active components [17].
Responsive photonic crystals, which are prepared according to the change of refractive index or lattice spacing caused by the change of parameters to be measured, have been used in various fields [18,19]. Polymer-based thermosensitive photonic crystals were probably the first successful example of responsive photonic crystals that combine a functional and responsive polymer matrix with colloidal crystals. Since the pioneering work from Asher et al. [20], a large number of responsive photonic crystals have been developed that are similar in structure, but sensitive to various stimuli. Photonic crystals take the role of externalizing the variable to be measured as the color changes. Fan et al. [21] proposed a kind of magnetic field sensor based on a symmetrically side-polished photonic crystal fiber with an adjustable high magnetic field sensitivity. Yu et al. [22] developed a visible PC-based biochemical sensor that can clearly identify ethanol–water mixtures with ethanol content between 0% and 40%. Cai’s group [23,24] demonstrates a proof-of-concept for developing responsive, “smart” protein hydrogel materials with VPTs that utilize ligand-binding-induced protein conformational changes. In addition, by using responsive hydrogels as substrates, people can conveniently prepare photonic crystal sensors that can be used to visually determine temperature and humidity [25]. The lattice spacing can be tuned by the swelling and shrinkage of the hydrogel in a solvent such as water. In recent years, more new temperature and humidity photonic crystal sensors [26] have been developed based on this principle.
The analysis of color space and the control of structural color are rarely reported in the field of response photonic crystals. Unfortunately, most structural color analysis still uses spectrometers or visual inspection [27], lacking accurate quantitative analysis of structural color, or causing the color analysis technology to lose the advantages of simple, low-cost, fast, and high-throughput naked eye colorimetry. In fact, quantitative analysis makes the results of color analysis free from the influence of human factors, making our understanding and positioning of structural colors more accurate and comprehensive. Even the subtle color changes can be captured; even the changes of saturation and brightness can be captured.
The color picture of the photonic crystal structure we obtained is a true-color image. A typical true-color image may contain hundreds of thousands of colors, which makes it challenging to analyze the color of such an image. Therefore, it is necessary to conduct color quantization (CQ) for photonic crystal color images. Color quantization (CQ) is a popular image-processing operation, which aims to reduce the number of distinct colors in a true-color image with minimal distortion [28]. CQ is fundamentally a large-scale combinatorial optimization problem that consists of two steps: palette design, in which a reduced number of palette colors typically 8–256 is specified; and pixel mapping, in which each color pixel is assigned to one of the colors in the palette. From the pattern recognition point of view, color quantization can be regarded as an unsupervised classification of the 3D-color space, each class being represented by one palette color.
The difference or distance between two color palettes is a metric of interest in color science. It allows a quantified examination of a perception that formerly could only be described with adjectives. Quantification of these properties is of great importance. Pan [29] proposed three different methods for the evaluation of color difference between color palettes, namely the single color difference model, the mean color difference model, and the minimum color difference model. The minimum color difference model outperformed the other two metrics based on statistics analysis and regression analysis. The concept of this algorithm is that for each color in one palette, there will be a corresponding color (or even more than one color) in another palette that it most closely matches.
Four groups of photonic crystal hydrogel structural color pictures were obtained from our previous works or from references. Different from the photonic crystal response analysis performed by other studies, we use Adobe color CC to extract the structural colors and analyze their positions in the CIELAB color space. We visualized colors on the Ostwald color model and analyzed the color differences of each group of pictures via the minimum color difference model. None of these numerical analysis methods have ever been used in photonic crystals. Based on these works, we summarized the law of particle size regulation of different dimensions of photonic crystal color, and the color change law of photonic crystal hydrogel temperature and humidity sensors.
2. Materials and Methods
2.1. Photonic Crystal Hydrogel Preparation
A series of monodisperse highly crosslinked polystyrene microspheres with particle sizes of 500, 600, 720, and 820 nm were prepared by the soap-free emulsion polymerization method. The two-dimensional photonic crystals were self-assembled by the tip guide method to obtain the neatly arranged two-dimensional photonic crystals of polystyrene.
Polystyrene colloidal microspheres with sizes of 132, 205, 275, and 300 nm were synthesized by the emulsion polymerization method; and then, self-assembled by the vertical deposition method. Three-dimensional polystyrene photonic crystals with regular arrangement in visible-light wavelength were obtained.
We used the “sandwich” method to fabricate photonic crystals hydrogel film with an excellent response to temperature. The hydrogel precursor solution containing AM, NIPAM, BIS, DEAP, and DMSO was penetrated into a photonic crystals array (PS) between two glass sheets by capillary force; and the hydrogel combined with the photonic crystals array was obtained by UV-excited radical. We immersed a 205 nm PhCs hydrogel film in pure water at 5, 15, 25, and 40 °C for sufficient time.
2.2. Characterization
Under the same light environment and fixed camera shooting angle (vertical 90 degrees), two-dimensional photonic crystal structural color composed of colloidal particles of different sizes, three-dimensional photonic crystal structural color composed of colloidal particles of different sizes, and three-dimensional photonic crystal hydrogel structural color under different temperature conditions were obtained.
2.3. Structural Color Analysis Based on PhCs Digital Photos
We used Adobe Color CC to extract five pixels from each PhCs structural color photo, read, and output its RGB three channel values. We created a color palette for each image based on the main color of the single image. Then, we designed a code base on the MATLAB (2022) to convert RGB data to CIELAB values and established a LAB color space three-dimensional coordinates, in which were the L-Z axis (range 0–100), A-x axis (range −127–128), and B-y axis (range −127–128). Each color palette scattered over the CIELAB color space, of which the positions were analyzed.
2.4. Color Difference Analysis
We used the minimum color difference model to calculate the color difference (ΔE) between two color palettes. Color differences in this study were calculated using the CIELAB ΔE formula shown in Equation (1). In the formula, L, A, and B, respectively, represent the LAB value of a color patch, while different corner marks indicate different color patches.
- For each color in one palette, the CIELAB color difference between this color and each of the colors in the second palette are calculated. The minimum color difference is recorded.
- Step 1 is repeated for all the colors in the first palette, finding their closest corresponding colors in the second palette, resulting in 5 color differences.
- The 5 minimum color difference values are averaged and the mean value symbolized as m1.
- Steps 1–3 are repeated, but this time for each of the colors in the second palette. In other words, for each of these colors, the closest corresponding color in the first palette is found. The mean value of these 5 color differences is symbolized as m2.
- The values of m1 and m2 are averaged to obtain the color difference between the two palettes.
3. Results and Discussion
3.1. True-Color Digital Photos of Photonic Crystal Hydrogel
The structural color of two-dimensional photonic crystal can be observed by the naked eye at the macroscopic level. In order to make the observation more convenient, a reflector is placed under the two-dimensional photonic crystal. The reflector can reflect the light diffracted forward back, and the structural color can be observed more directly from the front. As shown in Figure 2a, the structural colors of polystyrene 2D photonic crystals at 500, 600, 720, and 820 nm are blue-violet, green, orange, and red-violet, respectively. We extracted five pixels from each of these four images as shown in Figures S1–S4. The RGB three channel values were measured and converted to CIELAB values as shown in Tables S1–S4 (Supporting Information). In addition, their LAB values are plotted in the three-dimensional color space, shown as Figure 2a. Every five pixels occupies a different certain position in the color space, while the change trend of the two adjacent groups of points is similar. Figure 2b shows the structural color of three-dimensional photonic crystal arrays assembled by polystyrene colloidal microspheres with a diameter of 132, 205, 275, and 300 nm. As the particle size increases, structural colors become brighter in turn under direct observation. In the color space, four groups of pixel points are relatively scattered and the vertical coordinates decrease especially, which also confirms the colors’ increasing lightness.
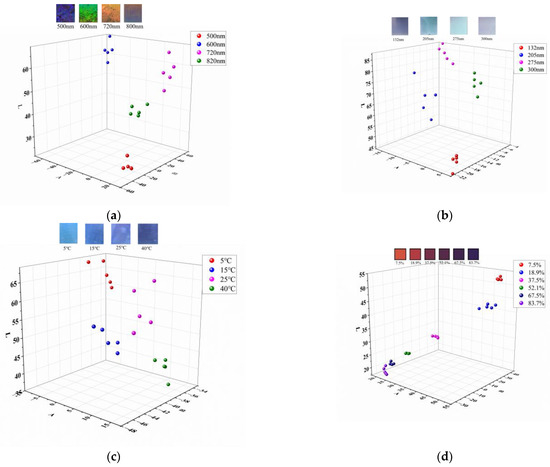
Figure 2.
(a) Distribution of 2D photonic crystal color palettes in CIELAB color space; (b) distribution of 3D photonic crystal color palettes in CIELAB color space; (c) distribution of color palettes in CIELAB color space of photonic crystal hydrogel films at different temperatures; (d) distribution of color palettes in CIELAB color space of photonic crystal hydrogel films at different humidity.
With a fixed camera angle (vertically 90 degrees), the structural color of the three-dimensional PS photonic hydrogel film was photographed at different temperatures; as shown in Figure 2c, the blue gradually deepened. Based on the phenomenon that chitosan swells relative to humidity, Jang J et al. [30] developed a humidity sensor with a multilayer structure. Through colorimetric analysis, the change in the relative humidity of the environment can be sensed. We extracted five color patches from each of their color-responsive graphs. We obtained the corresponding LAB value as shown in the 3D space (Figure 2d). The color lightness of the image becomes lower as the humidity increases, while the six sets of points in the spatial coordinates move in one direction, signaling a good response of the sensor to humidity.
3.2. Color Quantification
The color difference between the two adjacent images in each group is studied using the minimum color difference model. We obtained the minimum values by Equation (1) and recorded the average as shown in Table 1. Table 1 also reports the characterization of color change trends. Taking the first set of color pictures of 2D photonic crystals as an example, the pictures are labeled 1, 2, 3, and 4 in order of increasing particle size, so that their positions on the Ostwald color model are found by RGB data. Ostwald color model discs are roughly divided into five hue zones. On the Ostwald color model, the saturation of the color increases gradually from the center to the edge of the disc. Apparently, as the particle size increases, 2D photonic crystals produce a large color phase change, and the saturation is substantially reduced. Three-dimensional photonic crystal colors of 130~300 nm PS size show irregular variations of hue, lightness, and saturation, probably due to the small sample quantity. The third chart in Table 1 shows that 3D photonic crystal hydrogel colors in different temperatures are in the same color phase (the triangular area in the figure), while lightness gradually decreases as the temperature rises. Finally, the changing hue in the last Ostwald disc indicates that color temperature runs the gamut from warm to cool as the humidity value increases.

Table 1.
Color difference values and Ostwald color model characterization of photonic crystal hydrogel colors.
3.3. The Principle of Color Modulation
Digital photos were taken of the structural colors of the two-dimensional photonic crystals self-assembled by polystyrene microspheres of different sizes, as shown in Figure 3. With the increase of the particle size of colloidal particles, the corresponding structural colors changed from blue-violet to orange-red; that is, the bandgap wavelength of the photonic crystals gradually increased, which was in line with the photonic bandgap theory of the generation of structural colors. Therefore, based on the relevant theory of generating the photonic bandgap, we regulated the photonic crystal structural color by the size of colloidal particles, namely Bragg’s diffraction law [31]:
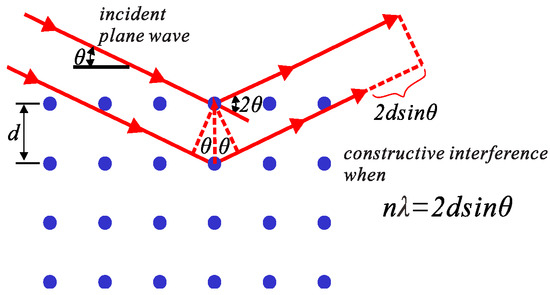
Figure 3.
Schematic diagram of Bragg’s diffraction law [32].
See Figure 3; θ is Bragg’s diffraction angle, d is the (111) crystal plane spacing, n is the reciprocal of the material’s average refractive index, and λ is the diffraction wave length.
The nanospheres are arranged in a face-centered cubic packing structure, and the wavelength λ at the center of the bandgap (denoted as λmax) accords with the Bragg diffraction relation:
In the formula, neff is the equivalent refractive index:
ns and fs are the refractive index and volume fraction of the microsphere material, respectively; nair is the refractive index of air. The refractive index depends on the type of microsphere material (PS’s ns is 1.59). The volume fraction fs of the densely packed microspheres is about 74%. The face spacing d111 of face-centered cubic (111) crystal faces is consistent:
“a” is the lattice constant of the face-centered cubic structure; “D” is the particle size.
According to these formulas, the relationship between the bandgap wavelength of the photonic crystal and the particle size of the microsphere is established; that is, the structural color of photonic crystal can be regulated by theoretical calculation. When soap-free emulsion polymerization is used to prepare large-size colloidal microspheres, the particle size is controlled by adjusting the amount of monomer styrene and initiator potassium persulfate. See Table 2 for the experimental formula and corresponding particle size. Moreover, the particle size of emulsion polymerization is also affected by the amount of emulsifier sodium dodecyl sulfonate, as shown in Table 3. Obviously, with the increase of the monomer amount, the decrease in the emulsifier, and the increase of the initiator amount, the PS microspheres will amplify.
Table 2.
Emulsion polymerization formula and corresponding particle size.
Table 3.
Emulsion polymerization formula and corresponding particle size.
Our temperature-responsive photonic crystal gel materials are created by embedding a non-close-packed colloidal crystal in a thermosensitive hydrogel of poly (N-isopropylacrylamide) (PNIPAM). PNIPAM is a thermosensitive polymer that undergoes a reversible volume phase transition between a hydrated state and a dehydrated state around its lower critical solution temperature (LCST, ca. 328C) in water. When the temperature increases, the polymer expels water and contracts, so that the interparticle distance in the colloidal crystal decreases, leading to a blue shift in the diffraction. The essence is still the relationship between band gap center wavelength and lattice spacing, while nair should be replaced by the refractive index of hydrogel. That explains as the temperature of the aqueous solution soaked in photonic crystal hydrogel rises, its blue color gradually deepens. Similarly, with the increase of ambient humidity, the structural color of the photonic crystal hydrogel changes from orange-red to blue-purple. This is attributed to the stretching properties of hydrogel at different humidity levels.
4. Conclusions
In this paper, the manipulation law of particle size, temperature, and humidity on the color change of photonic crystal hydrogel is verified by quantitative analysis of the color difference and color visualization analysis. The photonic crystal primitive particle size can achieve a huge color hue change in a certain range. For three-dimensional photonic crystals, magnifying the particle size in a small range can gradually increase the color lightness of photonic crystals. With the stretching assistance of NIPAM hydrogel, the color brightness of photonic crystal gradually decreases as the temperature increases. With the stretching assistance of hydrogel, the hue, brightness, and saturation of photonic crystal sensor color all have changes as the humidity increases. It is expected that these analyses can provide some regular guidance for subsequent experiments to design and regulate the color of photonic crystal hydrogels.
Supplementary Materials
The following supporting information can be downloaded at: https://www.mdpi.com/article/10.3390/photonics10020186/s1, Reagents of the preparation of two/three dimensional photonic crystals; Reagents of the preparation of photonic crystals hydrogel films for Temperature/humidity sensor; SEM images of three/two-dimensional PS photonic crystals; Reflection spectra of three-dimensional photonic crystals; Table S1: RGB and LAB data of 2D-photonic crystals with different particle sizes; Table S2: RGB and LAB data of 3D-photonic crystals with different particle sizes; Table S3: RGB and LAB data of Three-dimensional PS photonic crystals at different temperatures; Table S4: RGB and LAB data of Three-dimensional PS photonic crystals at different; Figure S1: Color patches of 2D-PhCs; Figure S2: Color patches of 3D-PhCs; Figure S3: Color patches of temperature sensor; Figure S4: Color patches of humidity sensor.
Author Contributions
Conceptualization, J.G., Z.M., Y.Q. and B.L.; methodology, J.G., Z.M., Y.Q. and B.L.; writing—original draft preparation, J.G.; writing—review and editing, J.G., Z.M., Y.Q. and B.L.; funding acquisition, Y.Q. All authors have read and agreed to the published version of the manuscript.
Funding
This research was supported by the Youth Program of National Natural Science Foundation of China (Nos. 52105292).
Institutional Review Board Statement
Not applicable.
Informed Consent Statement
Not applicable.
Data Availability Statement
The raw/processed data required to reproduce these findings cannot be shared at this time as the data also form part of an ongoing study.
Conflicts of Interest
The authors declare no conflict of interest.
References
- Parretta, A. All the light from the Newton’s Prism: Effects of the multiple internal reflections. Opt. Commun. 2020, 474, 10. [Google Scholar] [CrossRef]
- Cantrell, K.; Erenas, M.M.; de Orbe-Paya, I.; Capitan-Vallvey, L.F. Use of the Hue Parameter of the Hue, Saturation, Value Color Space As a Quantitative Analytical Parameter for Bitonal Optical Sensors. Anal. Chem. 2010, 82, 531–542. [Google Scholar] [CrossRef] [PubMed]
- Yang, J.; Chen, Y.; Westland, S.; Xiao, K.D. Predicting visual similarity between colour palettes. Color Res. Appl. 2020, 45, 401–408. [Google Scholar] [CrossRef]
- Kinoshita, S.; Yoshioka, S. Structural colors in nature: The role of regularity and irregularity in the structure. Chem. Phys. Chem. 2005, 6, 1442–1459. [Google Scholar] [CrossRef]
- Barrows, F.P.; Bart, M.H. Photonic Structures in Biology: A Possible Blueprint for Nanotechnology. Nanomater. Nanotechnol. 2014, 4, 12. [Google Scholar] [CrossRef]
- Yablonovitch, E. Inhibited Spontaneous Emission in Solid-State Physics and Electronics. Phys. Rev. Lett. 1987, 58, 2059–2062. [Google Scholar] [CrossRef]
- John, S. Strong localization of photons in certain disordered dielectric superlattices. Phys. Rev. Lett. 1987, 58, 2486–2489. [Google Scholar] [CrossRef]
- Liu, Z.D.; Gao, J.J.; Li, B.; Zhou, J. Temperature tunable photonic band gap crystals based on liquid-infiltrated inverse opal structure. Opt. Mater. 2013, 35, 1134–1137. [Google Scholar] [CrossRef]
- Zhang, J.T.; Wang, L.L.; Lamont, D.N.; Velankar, S.S.; Asher, S.A. Fabrication of Large-Area Two-Dimensional Colloidal Crystals. Angew. Chem.-Int. Edit. 2012, 51, 6117–6120. [Google Scholar] [CrossRef]
- Zhang, J.T.; Wang, L.L.; Chao, X.; Velankar, S.S.; Asher, S.A. Vertical spreading of two-dimensional crystalline colloidal arrays. J. Mater. Chem. C 2013, 1, 6099–6102. [Google Scholar] [CrossRef]
- Zhang, J.T.; Chao, X.; Liu, X.Y.; Asher, S.A. Two-dimensional array Debye ring diffraction protein recognition sensing. Chem. Commun. 2013, 49, 6337–6339. [Google Scholar] [CrossRef]
- Painter, O.; Lee, R.K.; Scherer, A.; Yariv, A.; O’Brien, J.D.; Dapkus, P.D.; Kim, I. Two-dimensional photonic band-gap defect mode laser. Science 1999, 284, 1819–1821. [Google Scholar] [CrossRef] [PubMed]
- Snoswell, D.R.E.; Bower, C.L.; Ivanov, P.; Cryan, M.J.; Rarity, J.G.; Vincent, B. Dynamic control of lattice spacing within colloidal crystals. New J. Phys. 2006, 8, 10. [Google Scholar] [CrossRef]
- Holtz, J.H.; Asher, S.A. Polymerized colloidal crystal hydrogel films as intelligent chemical sensing materials. Nature 1997, 389, 829–832. [Google Scholar] [CrossRef] [PubMed]
- Potyrailo, R.A.; Ghiradella, H.; Vertiatchikh, A.; Dovidenko, K.; Cournoyer, J.R.; Olson, E. Morpho butterfly wing scales demonstrate highly selective vapour response. Nat. Photonics 2007, 1, 123–128. [Google Scholar] [CrossRef]
- von Freymann, G.; Kitaev, V.; Lotschz, B.V.; Ozin, G.A. Bottom-up assembly of photonic crystals. Chem. Soc. Rev. 2013, 42, 2528–2554. [Google Scholar] [CrossRef]
- Ge, J.P.; Yin, Y.D. Responsive Photonic Crystals. Angew. Chem.-Int. Edit. 2011, 50, 1492–1522. [Google Scholar] [CrossRef]
- Li, T.; Liu, G.; Kong, H.; Yang, G.; Wei, G.; Zhou, X. Recent advances in photonic crystal-based sensors. Coord. Chem. Rev. 2023, 475, 214909. [Google Scholar]
- Cai, Z.Y.; Li, Z.W.; Ravaine, S.; He, M.X.; Song, Y.L.; Yin, Y.D.; Zheng, H.B.; Teng, J.H.; Zhang, A.O. From colloidal particles to photonic crystals: Advances in self-assembly and their emerging applications. Chem. Soc. Rev. 2021, 50, 5898–5951. [Google Scholar] [CrossRef]
- Weissman, J.M.; Sunkara, H.B.; Tse, A.S.; Asher, S.A. Thermally switchable periodicities and diffraction from mesoscopically ordered materials. Science 1996, 274, 959–960. [Google Scholar] [CrossRef]
- Fan, Y.; Pu, S.; Li, D.; Zhao, Y.; Yuan, M.; Wang, J.; Liu, W. Bilaterally Polished Photonic Crystal Fiber Magnetic Field Sensor Based on Lossy Mode Resonance. IEEE Sens. J. 2022, 22, 23786–23792. [Google Scholar] [CrossRef]
- Yu, Y.; Brandt, S.; Nicolas, N.J.; Aizenberg, J. Colorimetric Ethanol Indicator Based on Instantaneous, Localized Wetting of a Photonic Crystal. ACS Appl. Mater. Interfaces 2020, 12, 1924–1929. [Google Scholar] [CrossRef] [PubMed]
- Shen, P.Y.; Zhang, Y.Q.; Cai, Z.Y.; Liu, R.X.; Xu, X.Y.; Li, R.; Wang, J.J.; Yang, D.A. Three-dimensional/two-dimensional photonic crystal hydrogels for biosensing. J. Mater. Chem. C 2021, 9, 5840–5857. [Google Scholar] [CrossRef]
- Cai, Z.Y.; Kwak, D.H.; Punihaole, D.; Hong, Z.M.; Velankar, S.S.; Liu, X.Y.; Asher, S.A. A Photonic Crystal Protein Hydrogel Sensor for Candida albicans. Angew. Chem.-Int. Edit. 2015, 54, 13036–13040. [Google Scholar] [CrossRef]
- Osada, Y.; Gong, J.P. Soft and wet materials: Polymer gels. Adv. Mater. 1998, 10, 827–837. [Google Scholar] [CrossRef]
- Ding, H.J.; Wei, Y.M.; Wu, Z.X.; Tao, K.; Ding, M.H.; Xie, X.; Wu, J. Recent Advances in Gas and Humidity Sensors Based on 3D Structured and Porous Graphene and Its Derivatives. ACS Mater. Lett. 2020, 2, 1381–1411. [Google Scholar] [CrossRef]
- Zhang, W.; Qiu, L.; Shea, K.J.; Fan, J.; Liu, Y.; Zheng, W.; Xue, M.; Liu, W.; Xu, Z.; Xiu-Tian-Feng, E.; et al. Quantitative Analysis of Structure Color of Photonic Crystal Sensors Based on HSB Color Space. ACS Appl. Mater. Interfaces 2022, 14, 35010–35019. [Google Scholar] [CrossRef]
- Abernathy, A.; Celebi, M.E. The incremental online k-means clustering algorithm and its application to color quantization. Expert Syst. Appl. 2022, 207, 117927. [Google Scholar]
- Pan, Q.; Westland, S. Comparative Evaluation of Color Differences between Color Palettes. Color Imaging Conf. 2018, 2018, 110–115. [Google Scholar] [CrossRef]
- Jang, J.; Kang, K.; Raeis-Hosseini, N.; Ismukhanova, A.; Jeong, H.; Jung, C.; Kim, B.; Lee, J.Y.; Park, I.; Rho, J. Self-Powered Humidity Sensor Using Chitosan-Based Plasmonic Metal-Hydrogel-Metal Filters. Adv. Opt. Mater. 2020, 8, 7. [Google Scholar] [CrossRef]
- Zhang, L.; Qiu, L.; Lu, W.; Yu, Y.; Meng, Z.; Wang, S.; Xue, M.; Liu, W.-F. Preparation of opal type photonic crystal infrared stealth materials. J. Phys. 2017, 66, 158–164. [Google Scholar]
- Ho, K.M.; Chan, C.T.; Soukoulis, C.M. Existence of a Photonic Gap in Periodic Dielectric Structures. Phys. Rev. Lett. 1990, 65, 3152–3155. [Google Scholar] [CrossRef] [PubMed]


Disclaimer/Publisher’s Note: The statements, opinions and data contained in all publications are solely those of the individual author(s) and contributor(s) and not of MDPI and/or the editor(s). MDPI and/or the editor(s) disclaim responsibility for any injury to people or property resulting from any ideas, methods, instructions or products referred to in the content. |
© 2023 by the authors. Licensee MDPI, Basel, Switzerland. This article is an open access article distributed under the terms and conditions of the Creative Commons Attribution (CC BY) license (https://creativecommons.org/licenses/by/4.0/).