Article

Signal-to-Noise Ratio Improvement for Phase-Sensitive Optical Time-Domain Reflectometry Using a Genetic Least Mean Square Method

1
College of Electronic Information and Optical Engineering, Taiyuan University of Technology, Taiyuan 030024, China
2
Shanxi Transportation Technology Research & Development Co., Ltd., Taiyuan 030032, China
3
Key Laboratory of Advanced Transducers and Intelligent Control Systems, Ministry of Education, Taiyuan University of Technology, Taiyuan 030024, China
*
Author to whom correspondence should be addressed.
Photonics 2023, 10(12), 1362; https://doi.org/10.3390/photonics10121362
Submission received: 26 October 2023 / Revised: 27 November 2023 / Accepted: 7 December 2023 / Published: 9 December 2023

Abstract

:
In this paper, a genetic least mean square (GLMS) method is proposed to improve the signal-to-noise ratio (SNR) of acoustic signal reconstruction in a phase-sensitive optical time-domain reflectometry system. The raw demodulated signal is processed via applying the least mean square criterion. The SNR of the processed signal was calculated and served as the objective function in the fitness evaluation procedure. The genetic operations of the population selection, crossover, and mutation are sequentially performed and repeated until the suspensive condition is reached. Through multiple iterations, the GLMS method continuously optimized the population to find the optimal solution. Experimental results demonstrate that the SNR is substantially improved by 14.37–23.60 dB in the monotonic scale audio signal test from 60 to 1000 Hz. Furthermore, the improvement of the phase reconstruction of a human voice audio signal is also validated by exploiting the proposed GLMS method.

1. Introduction

Distributed optical fiber acoustic sensing has gained wide attention in recent years owing to its prominent advantages in terms of its high sensitivity, electrical passivity, and strong resistance to corrosion and electromagnetic interference [1,2,3]. In recent years, distributed acoustic sensors have received considerable research attention and exhibited a good application foreground in the areas of 3D vertical seismic profiling [4], traffic flow detection [5], partial discharge monitoring [6], pipeline integrity protecting [7], hydraulic fracturing monitoring [8], vehicle detection and classification [9], drone detection and localization [10], and so on.
In recent years, a considerable number of valuable works has been conducted, and different schemes have been proposed to fulfill the distributed acoustic sensing, such as using phase-sensitive optical time-domain reflectometry (phase-sensitive OTDR) [11,12,13], Brillouin optical time-domain analysis (BOTDA), and optical frequency-domain reflectometry (OFDR) [14,15,16], and other methods [17]. Among them, OFDR is based on swept-wavelength homodyne interferometry. The spatial resolution is inversely proportional to the frequency sweep range of the tunable laser, which can reach the submillimeter level [18]. However, the sensing distance of OFDR is typically tens to hundreds of meters [19]; such a short monitoring range is limited in many practical applications. BOTDA is based on the interaction of a pulsed pump and a counter-propagating continuous probe wave, separated in frequency by the Brillouin frequency shift of the sensing fiber. In traditional BOTDA, due to the demand for a large number of averages and frequency scanning, the measurement times are several minutes [20]. Later, the slope-assisted technique was introduced, which improves the detection bandwidth and enables the BOTDA systems to perform dynamic measurements [21]. However, the high cost and complexity hinder their potential applications in large-scale markets. In contrast, phase-sensitive OTDR based on Rayleigh backscattering (RBS) has attracted a significant amount of attention in the acoustic sensing field due to its excellent performance, low cost, large dynamic range, and wide frequency response [22,23]. It injects highly coherent optical pulses into the fiber, and the RBS light modulated by the acoustic waves is captured [24,25]. In traditional phase-sensitive OTDR, only the amplitude of the RBS light is demodulated to locate the acoustic waves acting on the sensing fiber. However, due to the lack of a specific relationship between the RBS light amplitude and the acoustic wave exerted on the fiber, in recent years, an increasing interest was demonstrated in the phase demodulation of RBS light since the relationship between the phase change and the amplitude of the acoustic wave is linear. For instance, Sha Z. et al. [26] derived a pair of orthogonal signals from the RBS intensity and then demodulated the phase signal to restore different forms of vibration induced by a piezoelectric ceramic transducer (PZT), yet the pulse width should be changed based on the scope of the external disturbance. On the other hand, embedding interferometers with a 3 × 3 coupler [27], or a phase-generated carrier algorithm [28], into phase-sensitive OTDR could also conduct phase demodulation, while at the same time, the cost and complexity could be increased and the system could be vulnerable to external disturbances.
To enhance the extensibility of phase-sensitive OTDR, coherent detection was introduced to demodulate the full vector information of the RBS [29]. For instance, Jiang, J. et al. analyzed the quantitative relationship between the minimal detectable strain and the related parameters; in the experiment, approximately 8 m of bare fiber was coiled over a PZT to simulate an environmental acoustic signal [30]. Wang Z. et al. implemented in-phase/quadrature (IQ) demodulation and homodyne detection via utilizing a 90° optical hybrid. In the scheme, 10 m of fiber wrapped around a PZT was employed as the testing point, and real-time demodulation of an RBS phase transition induced by PZT was performed [31]. Zhang X. et al. adopted analog IQ demodulation to retrieve the phase change induced by PZT, which was put around 2.07 km over a total length of 2.30 km as the vibration source [32]. However, considering the fact that the intensity of an acoustic signal such as a human voice is usually very weak compared to PZT-induced vibration signals, the signal-to-noise ratio (SNR) of the phase reconstruction of an acoustic signal is relatively low.
In this paper, a genetic least mean square (GLMS) method is proposed to enhance the SNR of the acoustic signal reconstruction in a phase-sensitive OTDR sensing system. The raw demodulated signal is preliminarily processed based on the least mean square criterion. The SNR of the processed signal was calculated and served as the objective function in the fitness evaluation procedure. The genetic operations of the population selection, crossover, and mutation are sequentially performed and repeated until the suspensive condition is reached. Finally, through multiple iterations, the GLMS method continuously optimized the population to find the optimal solution.
In the following parts, Section 2 gives a brief description of the experimental arrangement and the mathematical formalism underlying the operating principle of the GLMS method. Then, a proof-of-concept experiment was implemented, and the experimental results and discussions are presented in Section 3 to verify the proposed method. Finally, a conclusion that highlights the outcome of the research is provided in Section 4.

2. Operating Principle

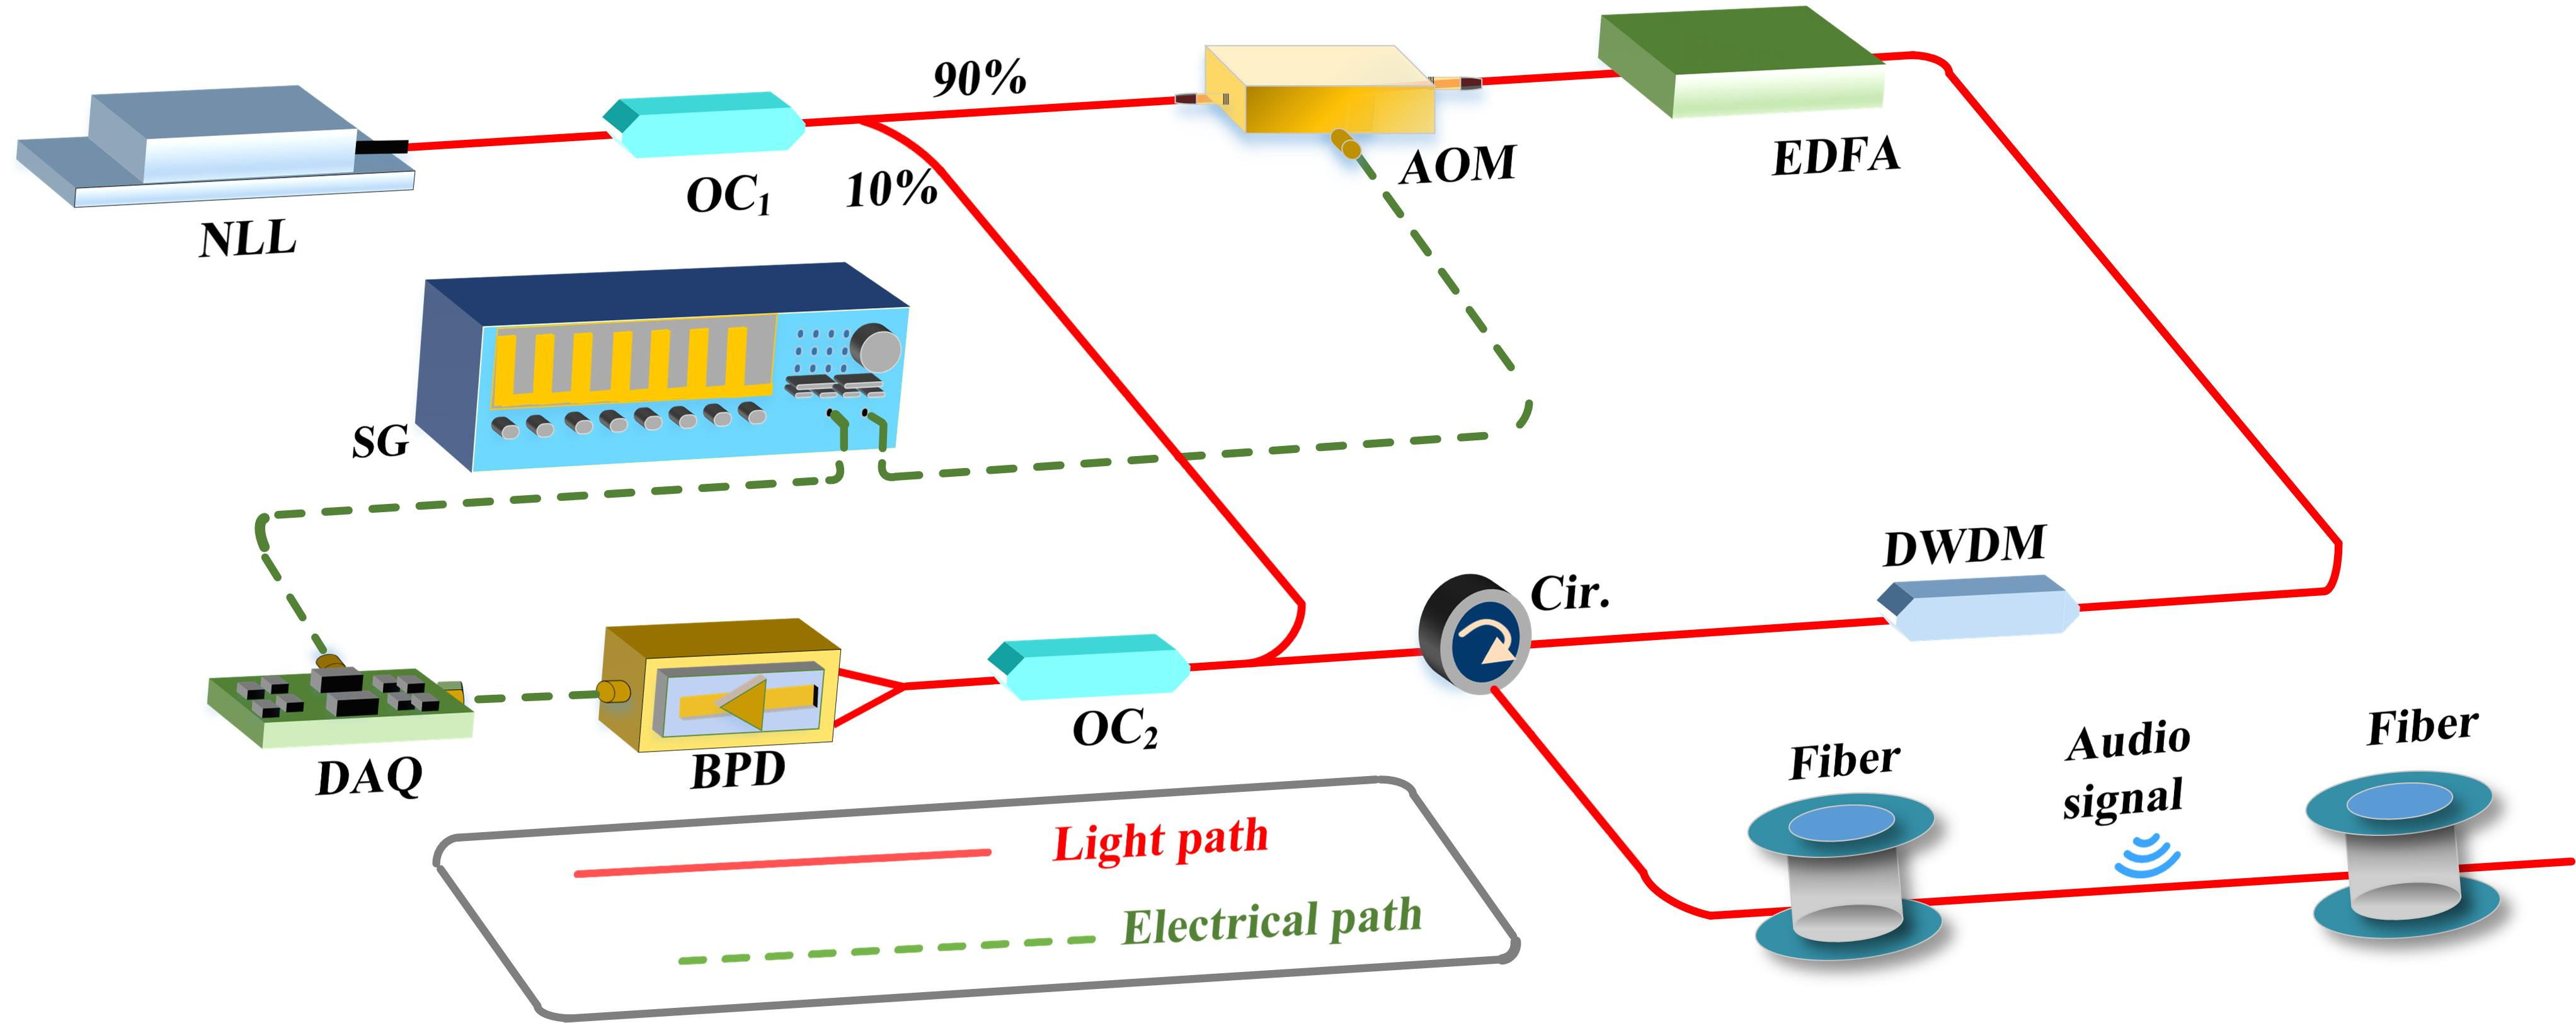
2.1. Experimental Arrangement

The pictorial demonstration of the experimental configuration is shown in Figure 1. In the system, the continuous light emitted from a 1550 nm narrow linewidth laser (NLL) was divided into two paths through a 90:10 optical coupler (OC1). The 90% path was coupled to an acoustic optical modulator (AOM) and modulated into probe pulses with a 200 ns width, a 10 kHz repetition frequency, and an 80 MHz frequency shift, while the 10% path was served as the local oscillator (LO). Subsequently, the probe pulses were amplified by an Erbium-doped fiber amplifier (EDFA), filtered by a dense wavelength division multiplexer (DWDM) and then injected into a 5 km long G.652 sensing fiber through a circulator (Cir). The audio signal generated by a speaker was played at 20 cm above the sensing fiber. The acoustic-modulated RBS light from the sensing fiber was then superimposed with the LO at a 50:50 optical coupler (OC2). Finally, the beat signal was detected by a 350 MHz balanced photodetector (BPD) and digitalized by a 250 MS/s data acquisition card (DAQ), which was synchronously triggered with the AOM by a signal generator (SG).

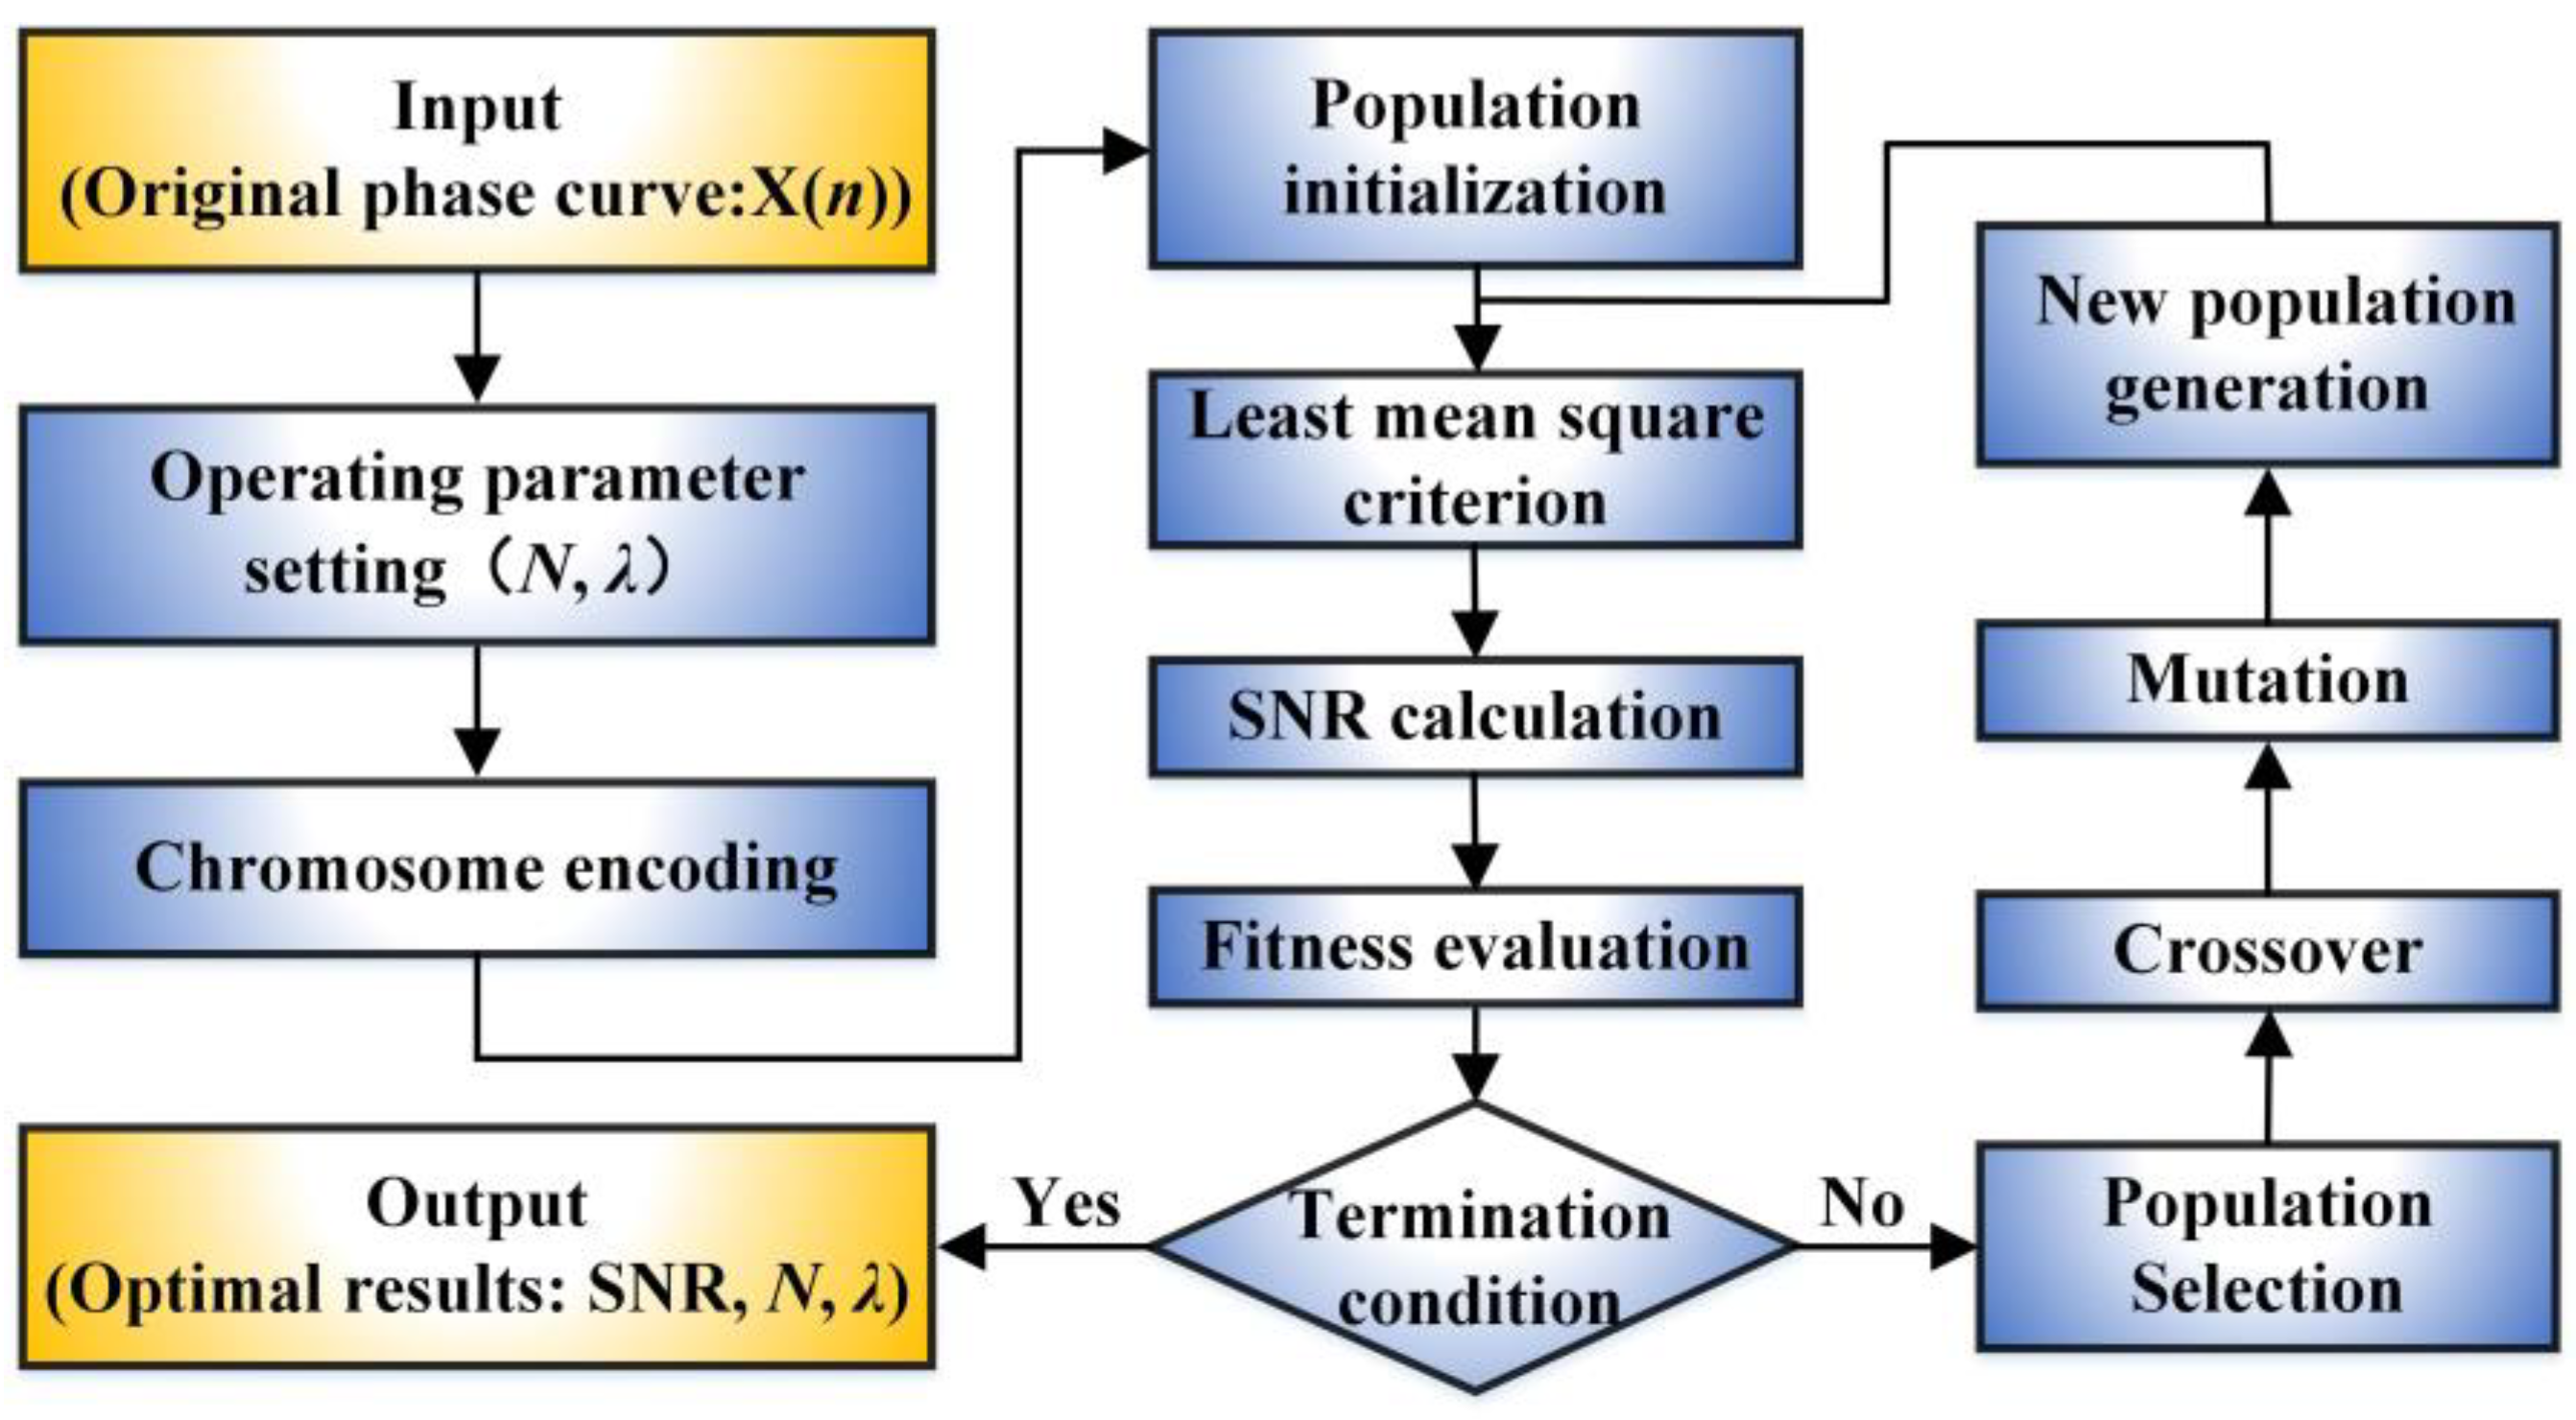
2.2. Operating Principle of the GLMS Method

In the phase-sensitive OTDR acoustic sensing system, the electric field of the RBS light Es(t) and the LO light EL(t) can be expressed, respectively, as follows:
Es(t) = AS(t) cos((w + Δw)t + φ(t)),
EL(t) = AL cos(wt + φL),
where AS(t) and AL denote the amplitude of the RBS signal and the LO light, respectively, w is the center frequency of the laser, Δw is the frequency shift introduced by the AOM, and φ(t) and φL represent the phase of RBS signal and the LO light, respectively. Then, the RBS light will be mixed with the LO light via OC2, and the beat signal is launched to the BPD, whose photocurrent is proportional to the optical power:
i ( t ) ( E s ( t ) + E L ( t ) ) 2 = ( A S ( t )   cos ( ( w + Δ w ) t + φ ( t ) ) + A L   cos ( w t + A L ) ) 2 = A s 2 ( t )   cos 2 ( ( w + Δ w ) t + φ ( t ) ) + A L 2 cos 2 ( w t + φ L ) + 2 A s ( t ) A L cos ( ( w + Δ w ) t + φ ( t ) ) cos ( w t + φ L ) ,
According to the trigonometric transformation, Equation (3) can be expressed as follows:
i ( t ) ( E s ( t ) + E L ( t ) ) 2 = A s 2 ( t ) 2 + A L 2 ( t ) 2 + A s 2 ( t ) 2   cos ( 2 ( w + Δ w ) t + 2 φ ( t ) ) + A L 2 ( t ) 2 cos ( 2 w t + 2 φ L ) + A s ( t ) A L cos ( ( 2 w + Δ w ) t + φ ( t ) + φ L ) + A s ( t ) A L cos ( Δ w t + φ ( t ) φ L ) ,
In Equation (4), the high-frequency terms ( A s 2 ( t ) 2 cos(2(w + Δw)t + 2φ(t)), A L 2 ( t ) 2 cos (2wt + 2φL), AS(t) AL cos((2w + Δw)t + φ(t) + φL)) are not within the response range of the BPD and cannot be detected. Moreover, the DC terms (   A s 2 ( t ) 2 , A L 2 ( t ) 2 ) are filtered out since the BPD is AC-coupled. Thus, Equation (5) can be derived after filtering out the DC and high-frequency terms:
i(t)∝AS(t) AL cos(Δwt + Δφ),
where Δφ = φ(t)−φL is the phase change caused by the external disturbance. Then, two orthogonal signals, cos(Δwt) and sin(Δwt), are exploited to mix with the beat signal, and the mixing results are expressed as I(t) and Q(t), respectively:
I ( t ) = A S ( t )   L   cos ( Δ wt + Δ φ )   cos ( Δ w ) = A S ( t ) A L 2 cos ( 2 Δ w t + Δ φ ) + cos ( Δ φ ) ,
Q ( t ) = A S ( t )   L   cos ( Δ wt + Δ φ )   sin ( Δ w ) = A S ( t ) A L 2 sin ( 2 Δ w t + Δ φ ) sin ( Δ φ ) ,
Therefore, the phase induced by the external acoustic disturbance can be demodulated as follows:
Δ φ =   arctan   Q ( t ) I ( t ) + 2 k π ,
Thus, the optical phase, which is proportional to the acoustic pressure applied to the optical fiber, is demodulated. However, in the actual measurement, the intensity of an acoustic signal such as a human voice is usually very weak compared to the PZT-induced vibration signals, and the SNR of the phase reconstruction of the acoustic signal is relatively low. In order to enhance the SNR of the acoustic signal reconstruction in the phase-sensitive OTDR sensing system, a GLMS method is proposed. Firstly, the raw demodulated signal is preliminarily processed based on the least mean square criterion:
ξ = E [ d ( n ) y ( n ) ] 2 = E [ d ( n ) W T ( n ) X ( n ) ] 2 = E [ d ( n ) i = 0 N 1 w i ( n ) x ( n i ) ] 2
where X(n) denotes the raw demodulated phase signal, W(n) represents the tap coefficient, and N indicates the number of taps, y(n) represents the processed signal, d(n) denotes the expected signal, which can be obtained from X(n) by utilizing wavelet decomposition and reconstruction techniques. In particular, W(n) is updated based on the previous parameters:
W ( n + 1 ) = W ( n ) + 2 λ X ( n ) ( d ( n ) y ( n ) )
where λ is the step size. It should be emphasized that, in actual measurements, it is of substantial importance to choose appropriate parameter values for N and λ , since these values greatly affect the SNR of the acoustic signal reconstruction in the phase-sensitive OTDR system. On the other hand, the basic idea of the genetic algorithm is to find the optimal solution via simulating the evolution process in nature. Based on such considerations, a genetic least mean square (GLMS) method is proposed in this paper. The fundamental framework of the genetic algorithm can be expressed as follows:
G A = C , F , P 0 , N , S , X , M , T
where C represents chromosome encoding, which is utilized to transform variables to be solved into parameters in optimization problems. F denotes the fitness evaluation, which is used to measure the degree of superiority or inferiority of an individual. P0 is the initial population, and N is the population size. S stands for the selection operation, which is used to select excellent individuals from a population based on the results of fitness evaluation. X represents the crossover operation, which refers to the exchange of chromosomal fragments between two parent chromosomes, resulting in the formation of new individuals. M represents the mutation operation, which refers to the occurrence of a mutation in a gene segment of a chromosome, resulting in the generation of a new individual. T represents the termination criterion, which refers to the conditions under which the algorithm stops running. Therefore, in the GLMS method, the chromosome encoding is performed to transform the variables to be solved (N and λ) in practical problems into recognizable information in optimization problems:
δ = U L 2 l 1
where U and L are the upper and lower bounds of the variables to be solved, δ is the calculation accuracy, and l is the chromosome length. Thus, the variables to be solved in the actual problem are converted into binary encoding strings. Then, the initial population with a certain number of individuals is generated. Here, an individual, which is coded as alal-1 al-2…a2 a1, can be decoded as follows:
b = δ + i l a i 2 i 1 U L 2 l 1
As analyzed above, the variables to be solved (N and λ) affect the SNR of the acoustic signal reconstruction in the phase-sensitive OTDR system. Therefore, by selecting appropriate values for N and λ, the SNR of the acoustic signal reconstruction can be enhanced. On this basis, the SNR is employed as the objective function in the optimization process, which can be written as follows:
Objv S N R = 10 l g S 2 ( n ) N 2 ( n )
where   S 2 ( n ) presents the signal energy, while N 2 ( n ) denotes the noise energy. Subsequently, the fitness evaluation is implemented according to the optimal degree of the individuals within the population. Then, the selection operation is conducted based on the individual’s fitness. Assuming there are n individuals in the population, the probability of i-th individual being selected is as follows:
P ( x i ) = f x i j = 1 n f x j
where f(xi) denotes the fitness value of the i-th individual, and j = 1 n f x j represents the sum of the fitness of all individuals in the current population. In addition, in order to select all individuals, the cumulative probability q(xi), which represents the sum of all the previous probabilities for each individual, is introduced:
q ( x i ) = j = 1 i p x i
Thus, the individuals with higher fitness have a higher probability of being selected; that is, excellent individuals are selected from the population for breeding the next generation. After that, the crossover operation is performed to replace and recombine the partial structures of two parent individuals to generate new individuals. Then, the mutation operation is executed in order to alter certain genes in chromosomes, introduce new genetic information, and increase the population diversity. Afterward, a new round of evolution begins on the basis of the new population. The result of each round of evolution is the acquisition of a population with a higher fitness on the basis of the previous population. After multiple iterations, the optimized individuals continuously approach the optimal solution. Finally, the individual with the best fitness from the final population, i.e., the optimal solution, is output.
Figure 2 is the flow chart of the proposed GLMS method. Firstly, the original demodulated phase curves are imported, and the range of operating parameters (number of taps N and step size λ) are set and converted to recognizable information in optimization problems through chromosome encoding. Then, the initial population with a certain size of individuals is generated. Subsequently, the input signal is processed based on the least mean square error criterion, and the SNR of the processed signal is calculated in order to conduct a fitness evaluation. Then, the cycle condition is judged, and if the termination criterion is not reached, the genetic operations of the population selection, crossover, and mutation are sequentially executed to generate the new population. The genetic steps are repeated, and the fitness is reevaluated until the suspensive condition is reached. Finally, the optimal results (SNR, N, and λ) can be obtained via exploiting the proposed GLMS method.

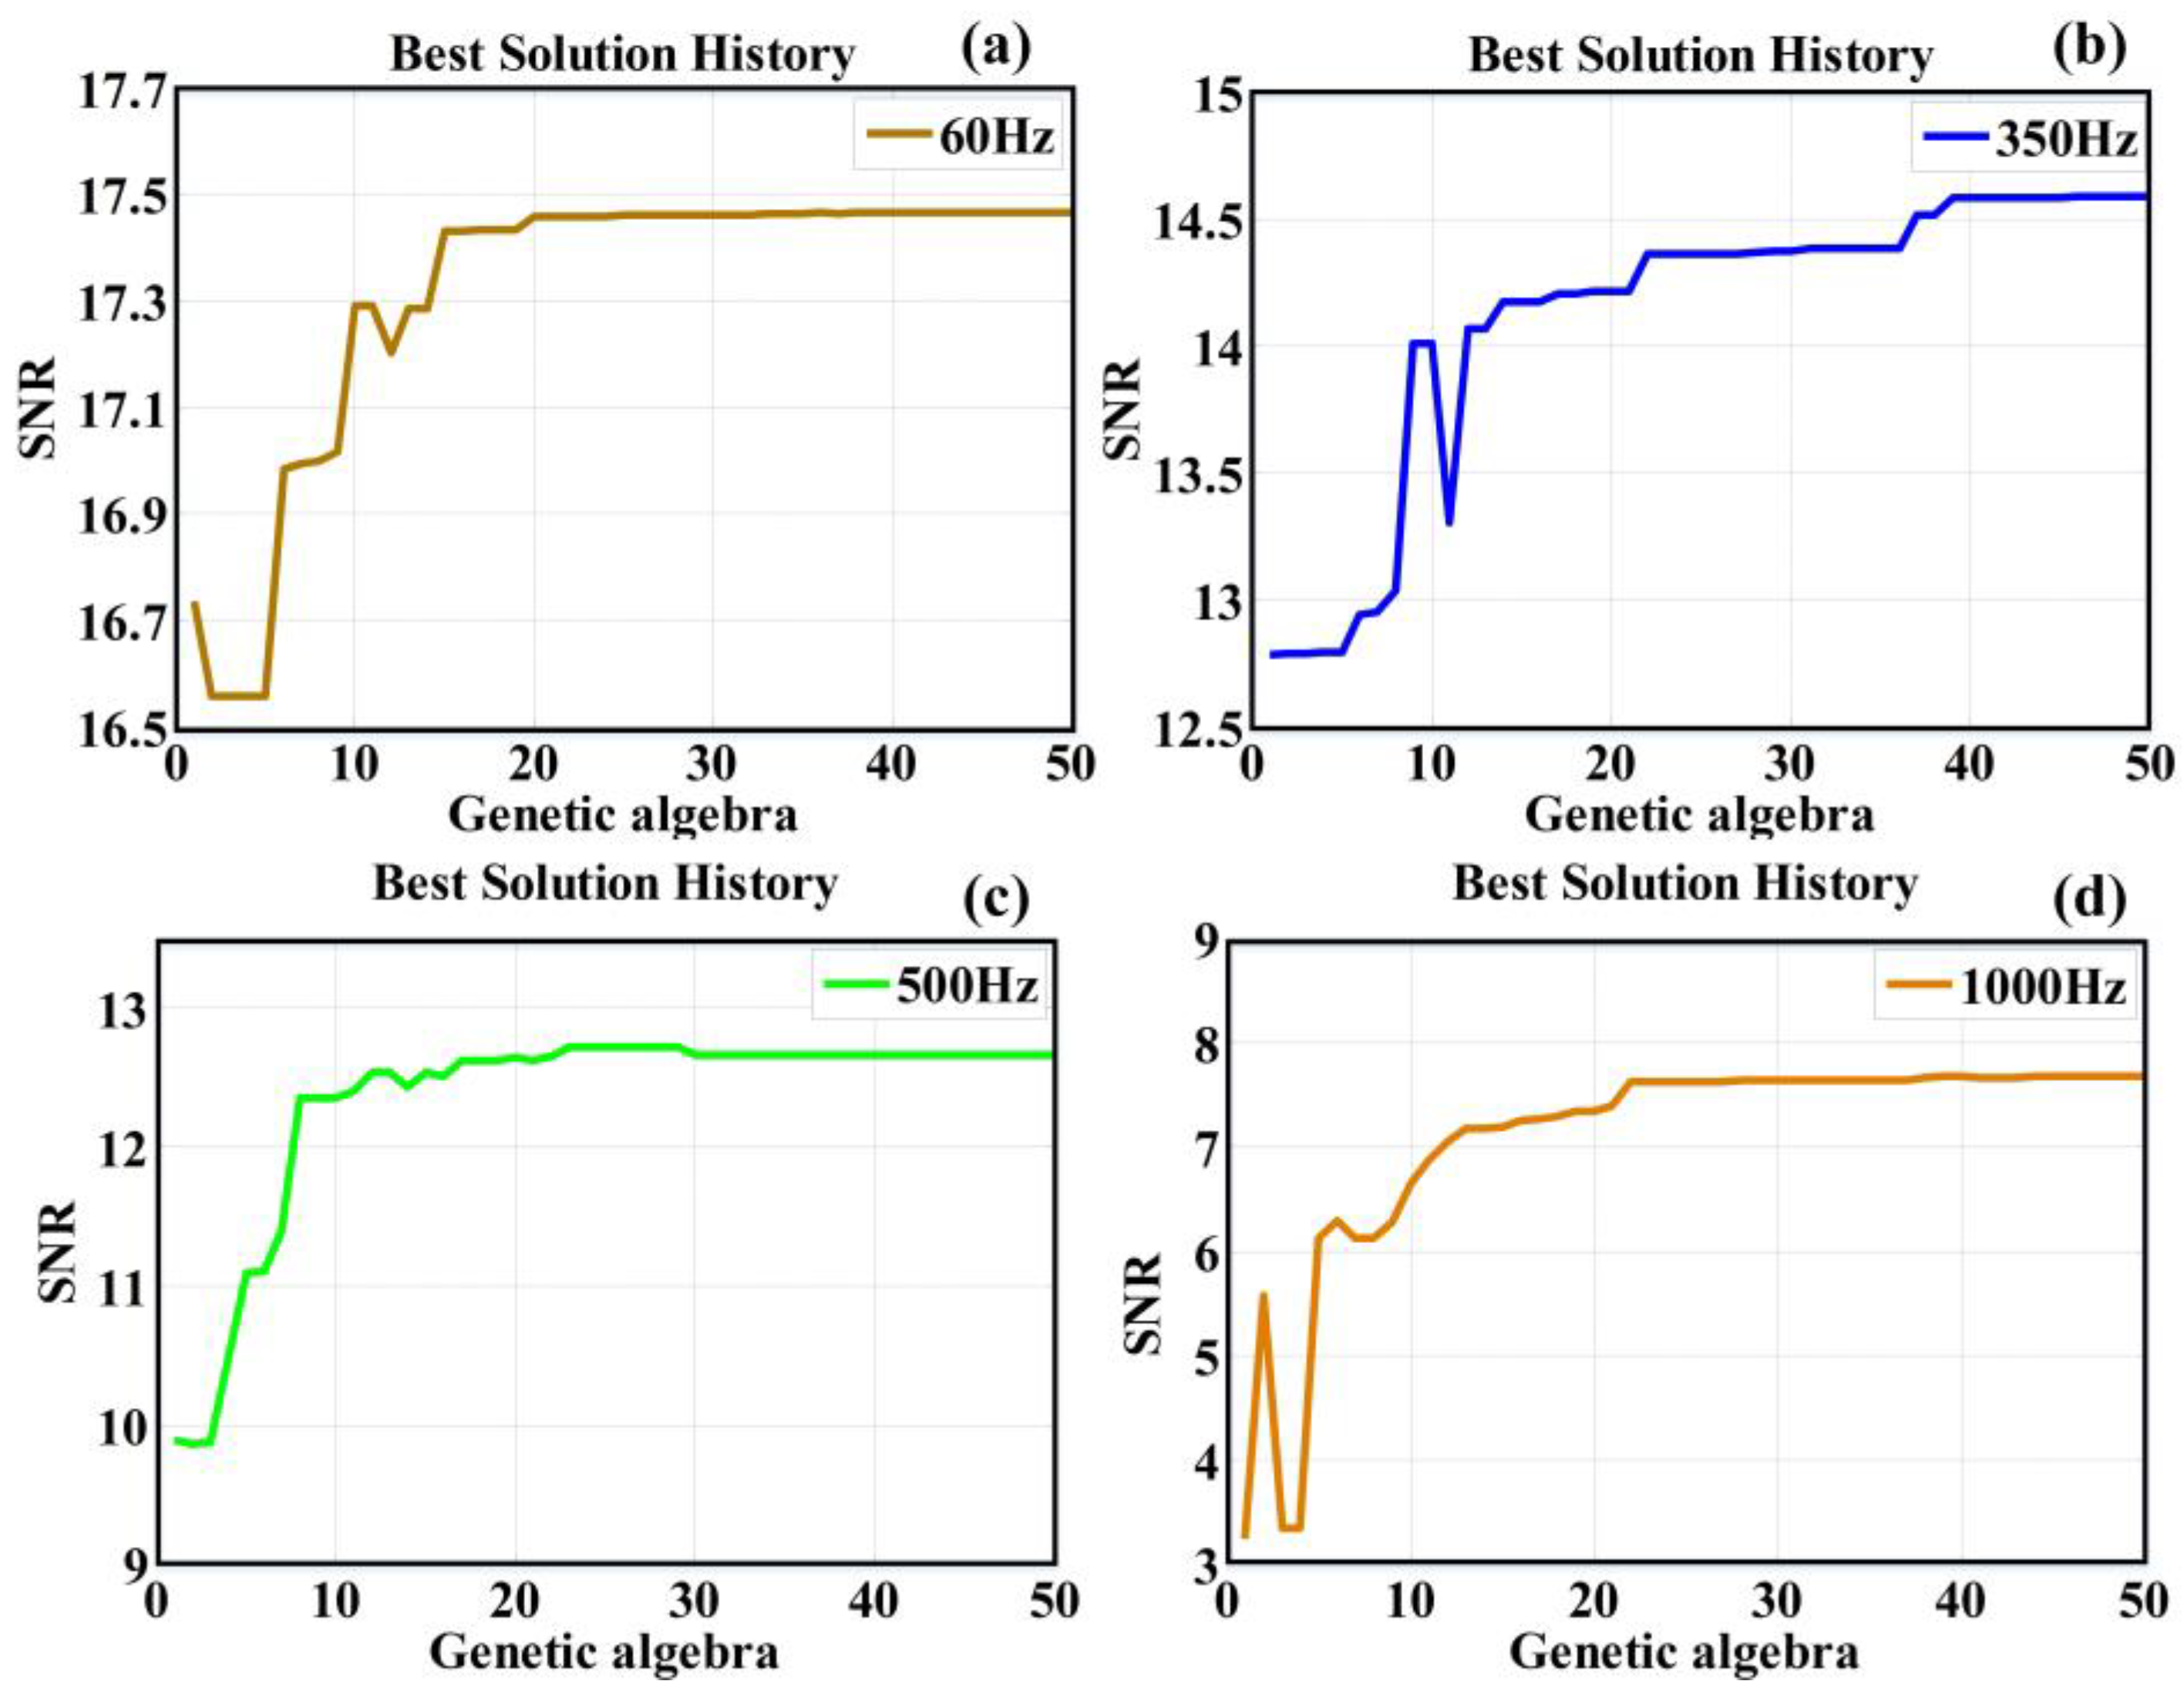
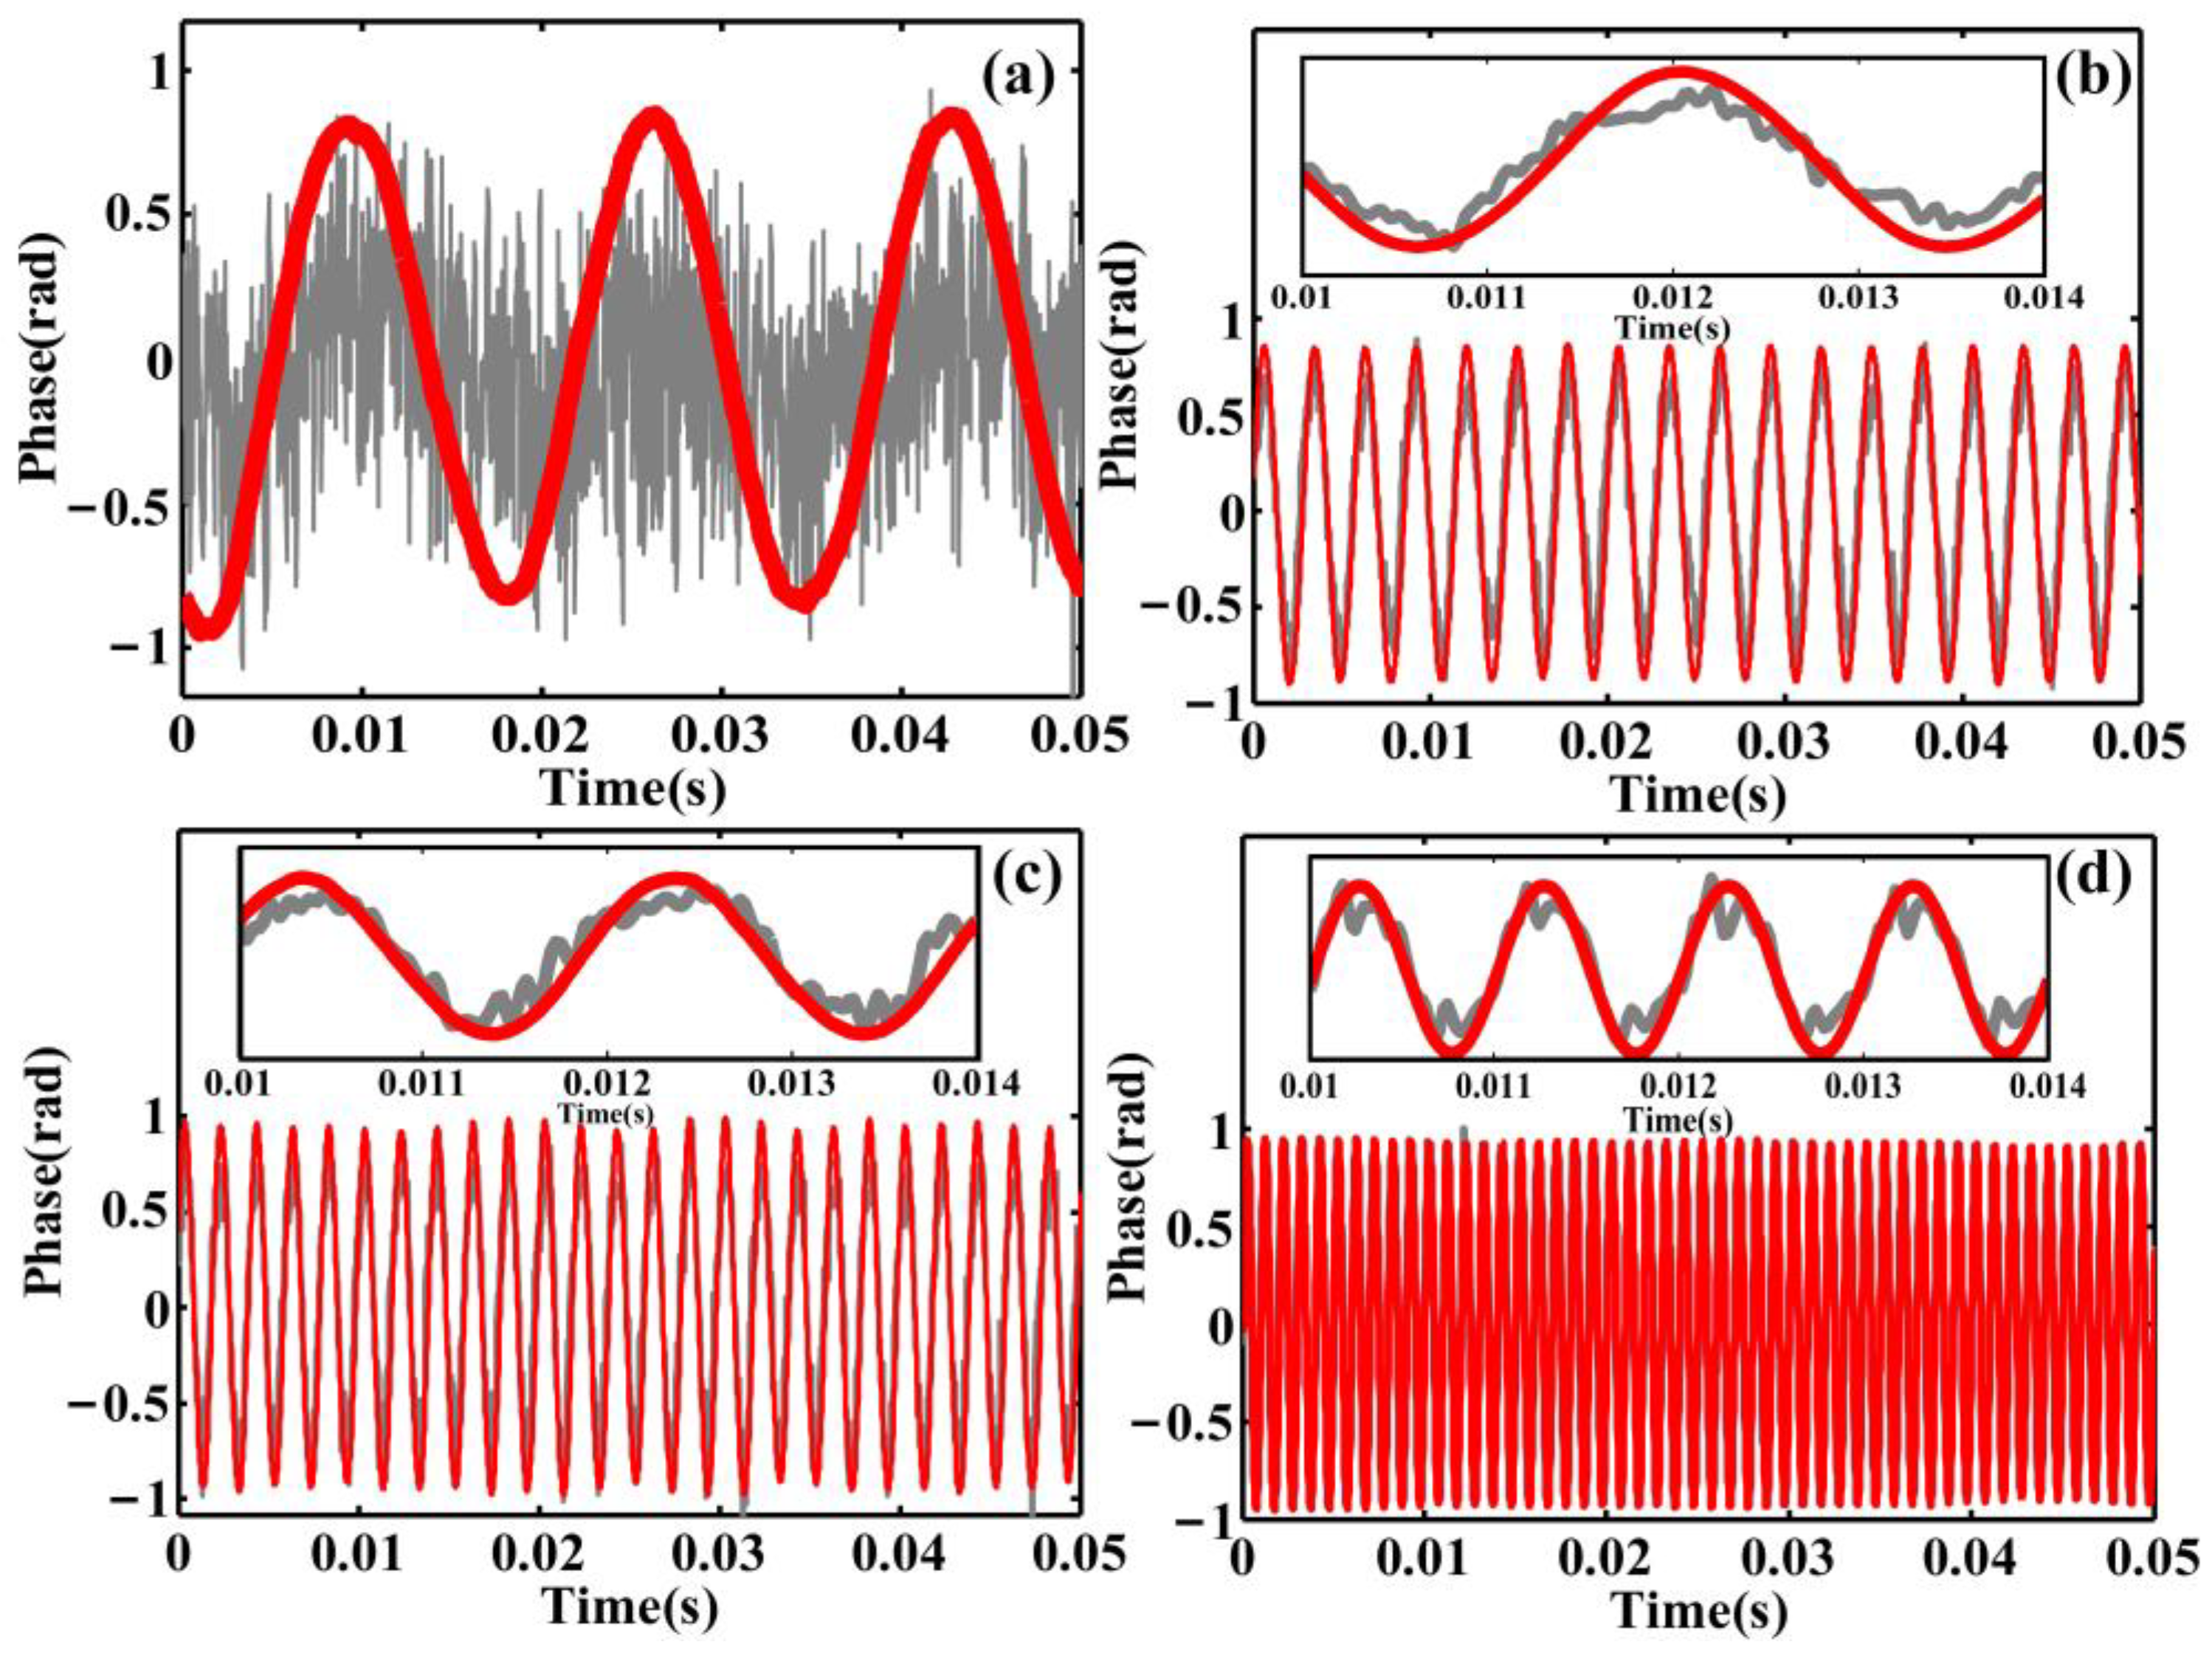
3. Experiments and Discussion

The structure employed in the experiment is demonstrated in Figure 1. In the experiment, a 10 m sensing fiber was coiled with a diameter of approximately 10 cm at a distance of 4 km. The audio signal generated by a speaker was played at 20 cm above the sensing fiber. Firstly, the monotonic scale audio signal test was carried out. Due to the performance limitation of the speaker, the audio signal was tested and varied in frequency from 60 Hz to 1000 Hz, and the phase change induced by the audio signal acting on the sensing fiber was analyzed.
Figure 3 shows the raw demodulated phase signals of 60 Hz, 350 Hz, 500 Hz, and 1000 Hz. As shown, the frequency of the raw demodulated phase signal is consistent with the frequency of the applied audio signal; however, the waveforms of the raw demodulated phase results were obviously affected by noise and the SNR was relatively low.
Thus, in order to enhance the SNR of the acoustic restoration, the GLMS method is applied. Firstly, the range of the operating parameters was set; in the experiment, the number of taps N was in the range of 10~2000 and the step size λ was in the range of 10−7~10−3. The operating parameters (N and λ) are then converted to recognizable information in optimization problems through chromosome encoding. Afterward, the initial population with a certain size of 40 was generated. Each individual was a vector of a constant length of 20 with binary values. Subsequently, the raw demodulated signal was processed based on the least mean square criterion, and the SNR of the processed signal was calculated and served as the objective function in the process of the fitness evaluation. The maximum number of genetic iterations was set to 50, and if the termination criterion was not reached, the population selection was performed based on fitness values with a generation gap of 0.95. Then, a crossover between the selected populations was conducted with a crossover rate of 0.7 to generate a new population. Subsequently, a mutation operation with a mutation rate of 0.01 was introduced to ensure population diversity and prevent falling into a locally optimized solution. Afterward, the fitness values of the new generation were recalculated, and the entire process was repeated until the suspensive condition was reached. Finally, the optimal results including the SNR, N, and λ could be achieved via exploiting the proposed GLMS method.
Figure 4 demonstrates the best solution history of the audio signal tests of 60 Hz, 350 Hz, 500 Hz, and 1000 Hz. It can be seen that, through 50 genetic iterations, the GLMS method continuously optimized the population to find an optimal solution and achieve the optimal SNR. According to (14), the SNRs of the raw demodulated phase curve of 60 Hz, 350 Hz, 500 Hz, and 1000 Hz are −0.73 dB, −5.58 dB, −2.73 dB, and −8.11 dB, respectively. Therefore, the SNRs are respectively improved by 18.19 dB, 19.01 dB, 15.39 dB, and 15.79 dB in the audio signal test by utilizing the proposed method. In addition, under the current laboratory environment, the software is implemented in MATLAB 2018a in order to validate the effectiveness of the proposed method. In the following study, a real-time response ability can be achieved via exploiting the Field Programmable Gate Array (FPGA) hardware acceleration platform (e.g. Zynq UltraScale+MPSoC) and software optimization strategies.
Figure 5 shows the comparison of the phase signals before and after using the proposed GLMS method in the audio signal tests of 60 Hz, 350 Hz, 500 Hz, and 1000 Hz. As shown in Figure 5, the grey curve indicates the raw demodulated phase signal, and the red curve represents the processed phase signal using the GLMS method. It can be seen that the processed phase signal is more consistent with the actual applied audio signal.
In addition, the power spectral density (PSD) of the phase signals before and after using the proposed GLMS method is plotted in Figure 6. As shown, the noise level was obviously degraded by 25.20 dB, 24.80 dB, 14.73 dB, and 32.56 dB in the audio signal tests of 60 Hz, 350 Hz, 500 Hz, and 1000 Hz, respectively.
Table 1 summarizes the experimental results of the monotonic scale audio signal test. In the experiment, 11 different audio frequencies in the range of 60–1000 Hz were selected to test the feasibility of the proposed method. In each test, the SNR of the raw demodulated phase signal was calculated. Afterward, the GLMS method was exploited to enhance the SNR. Through 50 genetic iterations, the population was continuously optimized to find the optimal solution. Hence, the optimal results (the number of taps N, step size λ, and SNR of the reconstructed phase signal) could be achieved. Finally, the SNR increment before and after using the proposed method was calculated. As shown in Table 1, it can be obviously seen that the SNR of the processed phase signal is significantly improved by 14.37~23.60 dB with respect to the raw demodulated phase signal, which exhibits the feasibility and availability of the proposed GLMS method.
Finally, the audio signal test of a human voice was performed. As mentioned above, the range of the operating parameters was primarily set; in the experimental test of a human voice, N was in the range of 10~2000 and λ was in the range of 5 × 10⁻⁹~10−5. Subsequently, the raw demodulated signal was processed based on the least mean square criterion, and the SNR of the processed signal was calculated and served as the objective function in the process of the fitness evaluation. The maximum number of genetic iterations was 50. The genetic manipulations of the population selection, crossover, and mutation were sequentially executed to generate a new population until the suspensive condition was reached.
Figure 7 indicates the experimental results of the human voice audio signal test. Figure 7a represents the raw demodulated phase signal. According to (14), the SNR of the raw demodulated phase curve is −12.94 dB. Figure 7b illustrates the processed audio phase signal by utilizing the proposed GLMS method, and it can be seen that the noise is significantly reduced.
In addition, Figure 8 presents the spectrogram of the human voice audio signal. Figure 8a is the spectrogram of the original audio signal played by the speaker, and Figure 8b is the spectrogram of the raw demodulated phase signal. It can be observed that the demodulated signal is obviously affected by noise. Figure 8c is the spectrogram of the processed phase signal by utilizing the proposed method. It can be seen that the spectrogram of the proposed phase signal is similar to the spectrogram of the original audio signal, which proves the fidelity of the proposed GLMS method.
Figure 9 demonstrates the iterative optimization process of the GLMS method. Figure 9a presents the objective function graph, and the blue solid triangles within the black dashed circle are the partial solutions obtained at each iteration. Figure 9b is the partially enlarged view of the circled area. It can be seen that the GLMS method continuously optimized the population to find an optimal solution. Figure 9c is the two-dimensional (2D) view of the objective function graph. The blue solid triangles are the partial solutions obtained during the iteration process, and the black solid triangle represents the optimal results (N = 1282, λ = 6.11 × 10⁻⁸, and SNR = 2.20 dB), which were achieved through 50 genetic iterations. Figure 9d reveals the best solution history. Hence, the SNR of the processed phase signal was improved by 15.14 dB with respect to the raw demodulated phase signal. Therefore, the experimental results further prove the feasibility of the proposed GLMS method.

4. Conclusions

A GLMS method is proposed in this paper to improve the SNR of acoustic signal reconstruction in a phase-sensitive OTDR sensing system. The raw demodulated signal is preliminarily processed via applying the least mean square criterion. The SNR of the processed signal was calculated and served as the objective function in the process of fitness evaluation. The genetic operations of the population selection, crossover, and mutation are sequentially performed and repeated until the suspensive condition is reached. Through 50 genetic iterations, the GLMS method continuously optimized the population to find the optimal solution. The experimental results demonstrate that the SNR is substantially improved by 14.37–23.60 dB in the monotonic scale audio signal test from 60 Hz to 1000 Hz. Furthermore, the improvement of the phase reconstruction of the human voice audio signal is also validated by exploiting the proposed GLMS method. In previous publications, researchers have conducted several studies to improve the SNR of a phase-sensitive OTDR sensing system. For instance, H. Cai et al. introduced a dense multichannel signal integration (DMSI) technique in phase-sensitive OTDR for SNR enhancement. In the scheme, the spatial multiplexing was exploited as a noise constraint condition, and the SNR was improved by ~20 dB over 800 m of fiber length [33]. Z. Wang et al. proposed a phase-demodulated optical pulse-coding phase-sensitive OTDR system, and the experimental results show that the noise variance of Golay coding was reduced by 13.7 dB with respect to a single pulse averaging four times over a total fiber length of 2.2 km [34]. Y. Liu et al. proposed multi-transverse modes heterodyne matched-filtering technology to conduct SNR improvement. By using the advantages of few-mode fibers, the noise floor was degraded by 11.4 dB over 2 km of monitoring distance [35]. Y. Hu et al. adopted frequency division multiplexing (FDM) technology to enhance the system performance. When the spatial resolution was consistent with the length of the disturbance region, the SNR was increased by 3 dB compared to the average SNR [36]. J. Tang et al. proposed an ultra-weak fiber Bragg grating (UWFBG) array based on a distributed acoustic sensing system. The Golay coding pulse sequence was utilized as the probe signal and a 1.5 km UWFBG was adopted as the sensing fiber. The experimental results demonstrate that the SNR was improved by 2.7 dB at 100 Hz [37].
In summary, our work differs from previous work in that the enhancement of the SNR of the acoustic signal reconstruction was obtained without increasing the cost and complexity of the system, indicating that the proposed method can be a promising solution for cost-sensitive distributed acoustic sensing applications.

Author Contributions

Conceptualization, X.L. and B.J.; methodology, X.L. and B.J.; software, Z.L. and X.Z.; validation, X.L. and Q.B.; formal analysis, X.L., Q.B. and Y.W.; investigation, Z.L. and X.Z.; resources, Y.W. and B.J.; data curation, X.L.; writing—original draft preparation, X.L.; writing—review and editing, Z.L. and X.Z.; visualization, X.L. and Q.B.; supervision, B.J.; funding acquisition, X.L., Y.W. and B.J. All authors have read and agreed to the published version of the manuscript.

Funding

This research was funded in part by the National Natural Science Foundation of China under Grant 62175175 and 62375197; in part by the Fundamental Research Program of Shanxi Province under Grant 20210302124599 and 202103021222010; in part by the Patent Transformation Special Plan Project of Shanxi Province under Grant 202202050; in part by the Key Research and Development (R&D) Projects of Shanxi Province under Grant 202102130501021; in part by the special fund for Science and Technology Innovation Teams of Shanxi Province under Grant 201805D131003, in part by the Guiding Funds of Central Government for Supporting the Development of the Local Science and Technology under Grant YDZJSX20231B004.

Institutional Review Board Statement

Not applicable.

Informed Consent Statement

Not applicable.

Data Availability Statement

Data underlying the results presented in this paper are not publicly available at this time but may be obtained from the authors upon reasonable request.

Acknowledgments

The authors sincerely thank the anonymous reviewers for their valuable comments.

Conflicts of Interest

The authors declare no conflict of interest.

References

  1. Muñoz, F.; Soto, M.A. Enhancing fibre-optic distributed acoustic sensing capabilities with blind near-field array signal processing. Nat. Commun. 2022, 13, 4019. [Google Scholar] [CrossRef] [PubMed]
  2. Gorshkov, B.G.; Yüksel, K.; Fotiadi, A.A.; Wuilpart, M.; Korobko, D.A.; Zhirnov, A.A.; Stepanov, K.V.; Turov, A.T.; Konstantinov, Y.A.; Lobach, I.A. Scientific Applications of Distributed Acoustic Sensing: State-of-the-Art Review and Perspective. Sensors 2022, 22, 1033. [Google Scholar] [CrossRef] [PubMed]
  3. Shang, Y.; Wang, C.; Ni, J.; Zhao, W.; Li, C.; Chang, B.; Huang, S.; Wang, C.; Peng, G. Discussion on the sensitivity of optical cables based on distributed acoustic sensing. Opt. Rev. 2019, 26, 659–663. [Google Scholar] [CrossRef]
  4. Mateeva, A.; Lopez, J.; Potters, H.; Mestayer, J.; Cox, B.; Kiyashchenko, D.; Wills, P.; Grandi, S.; Hornman, K.; Kuvshinov, B.; et al. Distributed acoustic sensing for reservoir monitoring with vertical seismic profiling. Geophys. Prospect. 2014, 62, 679–692. [Google Scholar] [CrossRef]
  5. Liu, H.; Ma, J.; Yan, W.; Liu, W.; Zhang, X.; Li, C. Traffic Flow Detection Using Distributed Fiber Optic Acoustic Sensing. IEEE Access 2018, 6, 68968–68980. [Google Scholar] [CrossRef]
  6. Kim, H.; Kim, M.J.; Lee, J.; Jung, H.; Kim, Y.H. Partial Discharge Monitoring Technology based on Distributed Acoustic Sensing. J. Sens. Sci. Technol. 2022, 31, 441–447. [Google Scholar] [CrossRef]
  7. Hussels, M.T.; Chruscicki, S.; Arndt, D.; Scheider, S.; Prager, J.; Homann, T.; Habib, A.K. Localization of Transient Events Threatening Pipeline Integrity by Fiber-Optic Distributed Acoustic Sensing. Sensors 2019, 19, 3322. [Google Scholar] [CrossRef]
  8. Molenaar, M.M.; Hill, D.J.; Webster, P.; Fidan, E.; Birch, B. First Downhole Application of Distributed Acoustic Sensing for Hydraulic-Fracturing Monitoring and Diagnostics. SPE Drill. Complet. 2012, 27, 32–38. [Google Scholar] [CrossRef]
  9. Liu, H.; Ma, J.; Xu, T.; Yan, W.; Ma, L.; Zhang, X. Vehicle Detection and Classification Using Distributed Fiber Optic Acoustic Sensing. IEEE Trans. Veh. Technol. 2020, 69, 1363–1374. [Google Scholar] [CrossRef]
  10. Fang, J.; Li, Y.; Ji, P.; Wang, T. Drone Detection and Localization Using Enhanced Fiber-Optic Acoustic Sensor and Distributed Acoustic Sensing Technology. J. Light. Technol. 2023, 41, 822–831. [Google Scholar] [CrossRef]
  11. Hua, L.; Zhu, X.; Cheng, B.; Song, Y.; Zhang, Q.; Wu, Y.; Murdoch, L.C.; Dauson, E.R.; Donahue, C.M.; Xiao, H. Distributed Acoustic Sensing Based on Coherent Microwave Photonics Interferometry. Sensors 2021, 21, 6784. [Google Scholar] [CrossRef]
  12. Muanenda, Y.; Faralli, S.; Oton, C.J.; Di Pasquale, F. Dynamic phase extraction in a modulated double-pulse φ-OTDR sensor using a stable homodyne demodulation in direct detection. Opt. Express 2018, 26, 687–701. [Google Scholar] [CrossRef] [PubMed]
  13. Fernández-Ruiz, M.R.; Costa, L.; Martins, H.F. Distributed acoustic sensing using chirped-pulse phase-sensitive OTDR technology. Sensors 2019, 19, 4368. [Google Scholar] [CrossRef] [PubMed]
  14. Marcon, L.; Galtarossa, A.; Palmieri, L. High-frequency high-resolution distributed acoustic sensing by optical frequency domain reflectometry. Opt. Express 2019, 7, 13923–13933. [Google Scholar] [CrossRef] [PubMed]
  15. Shiloh, L.; Eyal, A. Sinusoidal frequency scan OFDR with fast processing algorithm for distributed acoustic sensing. Opt. Express 2017, 25, 19205–19215. [Google Scholar] [CrossRef]
  16. Li, H.; Liu, Q.; Chen, D.; Deng, Y.; He, Z. High-spatial-resolution fiber-optic distributed acoustic sensor based on Φ-OFDR with enhanced crosstalk suppression. Opt. Lett. 2020, 45, 563. [Google Scholar] [CrossRef]
  17. Piñeiro, E.; Sagues, M.; Loayssa, A. Compensation of Phase Noise Impairments in Distributed Acoustic Sensors Based on Optical Pulse Compression Time-Domain Reflectometry. J. Light. Technol. 2023, 41, 3199–3207. [Google Scholar] [CrossRef]
  18. Froggatt, M.; Moore, J. High-spatial-resolution distributed strain measurement in optical fiber with Rayleigh scatter. Appl. Opt. 1998, 37, 1735–1740. [Google Scholar] [CrossRef]
  19. Leviatan, E.; Eyal, A. High resolution DAS via sinusoidal frequency scan OFDR (SFS-OFDR). Opt. Express 2015, 23, 33318–33334. [Google Scholar] [CrossRef]
  20. Thevenaz, L.; Mafang, S.F.; Lin, J. Effect of pulse depletion in a Brillouin optical time-domain analysis system. Opt. Express 2013, 21, 14017–14035. [Google Scholar] [CrossRef]
  21. Peled, Y.; Motil, A.; Yaron, L.; Tur, M. Slope-assisted fast distributed sensing in optical fibers with arbitrary Brillouin profile. Opt. Express 2011, 19, 19845–19854. [Google Scholar] [CrossRef] [PubMed]
  22. Ip, E.; Huang, Y.; Huang, M.; Yaman, F.; Wellbrock, G.; Xia, T.; Wang, T.; Asahi, K. DAS Over 1007-km Hybrid Link With 10-Tb/s DP-16QAM Co-Propagation Using Frequency-Diverse Chirped Pulses. J. Light. Technol. 2023, 41, 1077–1086. [Google Scholar] [CrossRef]
  23. Muanenda, Y. Recent Advances in Distributed Acoustic Sensing Based on Phase-Sensitive Optical Time Domain Reflectometry. J. Sens. 2018, 2018, 3897873. [Google Scholar] [CrossRef]
  24. Sun, Y.; Li, H.; Fan, C.; Yan, B.; Chen, J.; Yan, Z.; Sun, Q. Review of a Specialty Fiber for Distributed Acoustic Sensing Technology. Photonics 2022, 9, 277. [Google Scholar] [CrossRef]
  25. Shang, Y.; Sun, M.; Wang, C.; Yang, J.; Du, Y.; Yi, J.; Zhao, W.; Wang, Y.; Zhao, Y.; Ni, J. Research Progress in Distributed Acoustic Sensing Techniques. Sensors 2022, 22, 6060. [Google Scholar] [CrossRef] [PubMed]
  26. Sha, Z.; Feng, H.; Zeng, Z. Phase demodulation method in phase-sensitive OTDR without coherent detection. Opt. Exp. 2017, 25, 4831. [Google Scholar] [CrossRef] [PubMed]
  27. Liu, X.; Wang, C.; Shang, Y.; Wang, C.; Zhao, W.; Peng, G.; Wang, H. Distributed acoustic sensing with Michelson interferometer demodulation. Photonic Sens. 2017, 7, 193–198. [Google Scholar] [CrossRef]
  28. Fang, G.; Xu, T.; Feng, S.; Li, F. Phase-Sensitive Optical Time Domain Reflectometer Based on Phase-Generated Carrier Algorithm. J. Light. Technol. 2015, 33, 2811–2816. [Google Scholar] [CrossRef]
  29. Pan, Z.; Liang, K.; Ye, Q.; Cai, H.; Qu, R.; Fang, Z. Phase-sensitive OTDR system based on digital coherent detection. In Proceedings of the 2011 Asia Communications and Photonics Conference and Exhibition (ACP), Shanghai, China, 13–16 November 2011; p. 83110S. [Google Scholar]
  30. Jiang, J.; Xiong, J.; Wang, Y.; Wang, P.; Zhang, J.; Liang, Y.; Sun, J.; Wang, Z. The Noise Lower-Bound of Rayleigh-Scattering-Pattern-Based Distributed Acoustic Sensing With Coherent Detection. J. Light. Technol. 2022, 40, 5337–5344. [Google Scholar] [CrossRef]
  31. Wang, Z.; Zhang, L.; Wang, S.; Xue, N.; Peng, F.; Fan, M.; Sun, W.; Qian, X.; Rao, J.; Rao, Y. Coherent Φ-OTDR based on I/Q demodulation and homodyne detection. Opt. Express 2016, 24, 853–858. [Google Scholar] [CrossRef]
  32. Jiang, F.; Lu, Z.; Cai, F.; Li, H.; Zhang, Z.; Zhang, Y.; Zhang, X. Low Computational Cost Distributed Acoustic Sensing Using Analog I/Q Demodulation. Sensors 2019, 19, 3753. [Google Scholar] [CrossRef] [PubMed]
  33. Wang, Z.; Yang, J.; Gu, J.; Liu, Y.; Lu, B.; Ying, K.; Ye, L.; Ye, Q.; Qu, R.; Cai, H. Practical Performance Enhancement of DAS by Using Dense Multichannel Signal Integration. J. Light. Technol. 2021, 39, 6348–6354. [Google Scholar] [CrossRef]
  34. Wang, Z.; Zhang, B.; Ji, X.; Yun, F.; Rao, Y. Distributed Acoustic Sensing Based on Pulse-Coding Phase-Sensitive OTDR. IEEE Internet Things J. 2019, 6, 6117–6124. [Google Scholar] [CrossRef]
  35. Liu, Y.; Yang, J.; Wu, B.; Lu, B.; Shuai, L.; Wang, Z.; Ye, L.; Ying, K.; Ye, Q.; Qu, R.; et al. High SNR Φ-OTDR with Multi-Transverse Modes Heterodyne Matched-Filtering Technology. Sensors 2021, 21, 7460. [Google Scholar] [CrossRef]
  36. Hu, Y.; Meng, Z.; Zabihi, M.; Shan, Y.; Fu, S.; Wang, F.; Zhang, X.; Zhang, Y.; Zeng, B. Performance Enhancement Methods for the Distributed Acoustic Sensors Based on Frequency Division Multiplexing. Electronics 2019, 8, 617. [Google Scholar] [CrossRef]
  37. Tang, J.; Wang, G.; Lv, W.; Cheng, C.; Gan, W.; Yang, M. Distributed Acoustic Sensing System Based on Inserting-Zero Golay Coding with Ultra-Weak Fiber Bragg Gratings. IEEE Sens. J. 2022, 22, 15985–15990. [Google Scholar] [CrossRef]
Figure 1. Experimental arrangement of the phase-sensitive OTDR acoustic sensing system.
Photonics 10 01362 g001
Figure 2. Flow diagram of the proposed GLMS method.
Photonics 10 01362 g002
Figure 3. Raw demodulated phase signal. Time-domain results: (a) 60 Hz, (b) 350 Hz, (c) 500 Hz, and (d) 1000 Hz. Frequency domain results: (e) 60 Hz, (f) 350 Hz, (g) 500 Hz, and (h) 1000 Hz.
Photonics 10 01362 g003
Figure 4. Best solution history of the audio signal test: (a) 60 Hz, (b) 350 Hz, (c) 500 Hz, and (d) 1000 Hz.
Photonics 10 01362 g004
Figure 5. Comparison of phase signals before and after using the proposed GLMS method in the audio signal test: (a) 60 Hz, (b) 350 Hz, (c) 500 Hz, and (d) 1000 Hz.
Photonics 10 01362 g005
Figure 6. PSD of the raw demodulated phase signals in the audio signal tests: (a) 60 Hz, (b) 350 Hz, (c) 500 Hz, and (d) 1000 Hz. PSD of processed phase signal using the GLMS method in the audio signal tests: (e) 60 Hz, (f) 350 Hz, (g) 500 Hz, and (h) 1000 Hz.
Photonics 10 01362 g006
Figure 7. Experimental results of the human voice audio signal test using the GLMS method: (a) raw demodulated phase signal, (b) processed phase signal.
Photonics 10 01362 g007
Figure 8. Spectrogram of the human voice audio signal: (a) original audio signal played by the speaker; (b) raw demodulated phase signal; (c) phase signal processed using the GLMS method.
Photonics 10 01362 g008
Figure 9. Iterative optimization process: (a) objective function graph; (b) partially enlarged view of the circled area; (c) 2D view of the objective function graph; (d) best solution history.
Photonics 10 01362 g009
Table 1. Summarization of the experimental results of the audio signal test within 60–1000 Hz.
Acoustic FrequencyNumber of Taps (N)Step Size
(λ)
SNR of the Raw Demodulated PhaseSNR of the Processed Phase by GLMS MethodSNR Increment
60 Hz19654.53 × 10−5−0.73 dB17.46 dB18.19 dB
100 Hz19962.00 × 10−50.35 dB14.04 dB14.37 dB
150 Hz19851.67 × 10−6−3.31 dB20.29 dB23.60 dB
200 Hz10528.30 × 10−4−2.88 dB15.86 dB18.74 dB
250 Hz18395.16 × 10−70.85 dB18.62 dB17.77 dB
300 Hz2282.62 × 10−6−4.66 dB16.92 dB21.58 dB
350 Hz19057.49 × 10−4−5.58 dB14.59 dB19.01 dB
400 Hz17324.50 × 10−4−7.98 dB11.65 dB19.63 dB
450 Hz19386.56 × 10−4−5.72 dB10.64 dB16.36 dB
500 Hz1899.25 × 10−6−2.73 dB12.66 dB15.39 dB
1000 Hz262.68 × 10−6−8.11 dB7.68 dB15.79 dB
Disclaimer/Publisher’s Note: The statements, opinions and data contained in all publications are solely those of the individual author(s) and contributor(s) and not of MDPI and/or the editor(s). MDPI and/or the editor(s) disclaim responsibility for any injury to people or property resulting from any ideas, methods, instructions or products referred to in the content.

