Article

Experimental Study on the Temporal Evolution Parameters of Laser–Produced Tin Plasma under Different Laser Pulse Energies for LPP–EUV Source

1
State Key Laboratory of Laser Interaction with Matter, Changchun Institute of Optics, Fine Mechanics and Physics, Chinese Academy of Sciences, Changchun 130033, China
2
Yanqihu Campus, University of Chinese Academy of Sciences, Beijing 100049, China
*
Authors to whom correspondence should be addressed.
Photonics 2023, 10(12), 1339; https://doi.org/10.3390/photonics10121339
Submission received: 1 November 2023 / Revised: 27 November 2023 / Accepted: 29 November 2023 / Published: 4 December 2023

Abstract

:
The laser–produced plasma extreme ultraviolet (LPP–EUV) source is the sole light source currently available for commercial EUVL (extreme ultraviolet lithography) machines. The plasma parameters, such as the electron temperature and electron density, affect the conversion efficiency (CE) of extreme ultraviolet radiation and other critical parameters of LPP–EUV source directly. In this paper, the optical emission spectroscopy (OES) was employed to investigate the time–resolved plasma parameters generated by an Nd:YAG laser irradiation on a planar tin target. Assuming that the laser–produced tin plasma satisfies the local thermodynamic equilibrium (LTE) condition, the electron temperature and electron density of the plasma were calculated by the Saha–Boltzmann plot and Stark broadening methods. The experimental results revealed that during the early stage of plasma formation (delay time < 50 ns), there was a significant presence of continuum emission. Subsequently, the intensity of the continuum emission gradually decreased, while line spectra emerged and became predominant at a delay time of 300 ns. In addition, the evolution trend of plasma parameters, with the incident laser pulse energy set at 300 mJ, was characterized by a rapid initial decrease followed by a gradual decline as the delay time increased. Furthermore, with an increase in the incident laser pulse energy from 300 mJ to 750 mJ, the electron temperature and electron density of laser–produced tin plasma exhibiting a monotonically showed increasing trend at the same delay time.

1. Introduction

Accompanied by the rapid development of the electronics industry, the integration requirements for semiconductor chips in electronic products are continuously increasing. Consequently, the critical dimensions (CDs) of integrated circuits needs to be constantly decreased to fulfill the demands of electronic products for compactness, high performance, and low power consumption. To achieve smaller lithographic critical dimensions, the strategy of shortening the exposure wavelength has been adopted by researchers. Extreme ultraviolet lithography, which can significantly enhance the manufacturing process of high–end chips, is a new technique that promotes the reduction in critical dimensions in lithography to the 7 nm node and beyond. In comparison to other schemes [1,2,3,4,5,6], the LPP (laser–produced plasma) scheme [7] involves irradiating the target with a high–energy laser pulse to generate a high–temperature, high–density plasma, from which EUV light is subsequently emitted through de–excitation processes [8,9]. Being characterized by high conversion efficiency, controllable debris, small light–source size, stability and cleanliness [10], LPP represents the sole solution currently available for high–volume manufacturing (HVM) lithography machines.
A well–performing LPP–EUV source has already been manufactured by ASML and Gigaphoton [11,12]. The EUV lithography machine NXE:3400B produced by ASML requires that the output power at the intermediate focus (IF) of the LPP–EUV source exceed 205 W in actual industrial production in order to meet the production rate of over 125 wafers per hour and effectively reduce costs [13]. Hence, enhancing the EUV output power and EUV radiation conversion efficiency of LPP–EUV source is a crucial issue that urgently needs to be addressed in the lithography industry.
In recent years, research work related to the diagnostic analysis of laser–produced tin plasma parameters has been conducted by multiple research groups to enhance the CE of the LPP–EUV source. Harilal et al. conducted a study on the influence of laser wavelength on the electron density of laser–produced tin plasma from both experimental and theoretical perspectives at Purdue University in 2011 [14]. The research group utilized OES to study the spatial evolution of the electron density in laser–produced tin plasma with a delay time greater than 100 ns. It was observed that the electron density of laser–produced tin plasma decreased with increasing observation distance. Moreover, the decay rate of the electron density in CO2–laser–produced tin plasma was found to be significantly faster compared to Nd:YAG–laser–produced tin plasma. Wu et al. from Huazhong University of Science and Technology employed OES to investigate the temporal evolution of CO2–laser–produced tin plasma within the delay time range of 100 to 2000 ns in 2012 [15]. The research group observed that both the electron temperature and electron density of laser–produced tin plasma exhibited an initial rapid decrease followed by a gradual decrease as a function of increasing delay time. Lan et al. from Huazhong University of Science and Technology used OES to investigate the effects of laser wavelength, laser pulse energy, and chamber pressure on the electron temperature and electron density of laser–produced Sn and SnO2 plasmas in 2016 [16,17]. The research group found that the parameters of Nd:YAG–laser–produced plasma are higher due to the larger critical electron density of Nd:YAG–laser–produced plasma compared to CO2–laser–produced plasma. Moreover, the study revealed that the laser–produced plasma parameters increase with the increase in laser pulse energy and chamber pressure. Additionally, it was discovered that under the same experimental conditions, the laser–produced plasma parameters of SnO2 were greater than those of Sn. Amin et al. from the University of California conducted a study using OES to investigate the time–resolved spectra of CO2–laser–produced tin plasma in 2020 [18]. The research group also analyzed the influence of an external magnetic field on laser–produced tin plasma parameters. It was observed that the electron temperature and electron density exhibited exponential decay within the delay time range of 200–1100 ns, and the laser–produced tin plasma parameters were higher in the presence of the magnetic field. Du et al. conducted a study on the spatio–temporal evolution behavior of Al–Sn alloy plasma using OES at Northwest Normal University in 2022 [19]. They found that there were differences in the evolution process of laser–produced plasma parameters for alloys with varying atomic ratios.
According to research, the electron temperature and electron density of laser–produced tin plasma after the termination of laser irradiation serve as important parameters for inferring the state of the plasma plume. The electron temperature and electron density determine the distribution of plasma charge states and the various transient ions, which are closely associated with the generation of EUV radiation and out–of–band (OOB) thermal radiation. Diagnosing the electron temperature and electron density of laser–produced tin plasma is essential for enhancing the EUV radiation intensity and improve the CE of the LPP–EUV source. This paper presents the measurement of the emission spectrum in the visible regime from the plasma generated by Nd:YAG laser ablation on a planar tin target, utilizing a spectrometer and an intensified charge–coupled device (ICCD), with the EUV radiation moment serving as the reference point for spectrum acquisition. A comprehensive investigation was conducted into the temporal evolution parameters of laser–produced tin plasma under varying laser pulse energies. Section 2 discusses the experimental setup for diagnosing the parameters of laser–produced tin plasma. Section 3 discusses the plasma emission, electron temperature, and electron density of laser–produced tin plasma, along with the temporal evolution of plasma parameters under different laser–pulse energies. Section 4 presents a summary of this study.

2. Experimental Setup

The experimental setup for the time–resolved spectra measurement of laser–produced tin plasma is illustrated in Figure 1. The experiment utilized an Nd:YAG laser with output wavelength of 1064 nm, pulse width of 9 ns, adjustable repetition frequency of 1–10 Hz, and maximum pulse energy of 900 mJ, accompanied by a 9 mm laser beam diameter. The laser pulse was reflected by a planar mirror and focused vertically onto the surface of a plane tin target (99.99% purity, dimensions 25 mm × 25 mm × 5 mm) inside a vacuum chamber (vacuum pressure is 10−3 Pa) by a ZnSe focusing lens (f = 450 mm), resulting in the generation of tin plasma. The laser spot diameter on the target surface was approximately 60 μm. The emission spectral signals of the laser−produced tin plasma plume were imaged and collected using a quartz lens (f = 40 mm) at 45° angle to the normal direction of tin target surface and subsequently coupled to a spectrometer (Andor Shamrock SR 500i, 600 grooves/mm grating, grating resolution 0.08 nm, blazed wavelength 500 nm, covering the spectral measurement in the 400–700 nm range, equipped with an iStar ICCD detector) through an optical fiber probe. The collected signals were processed by the spectrometer and then transmitted to the computer, resulting in the generation of corresponding spectral data.
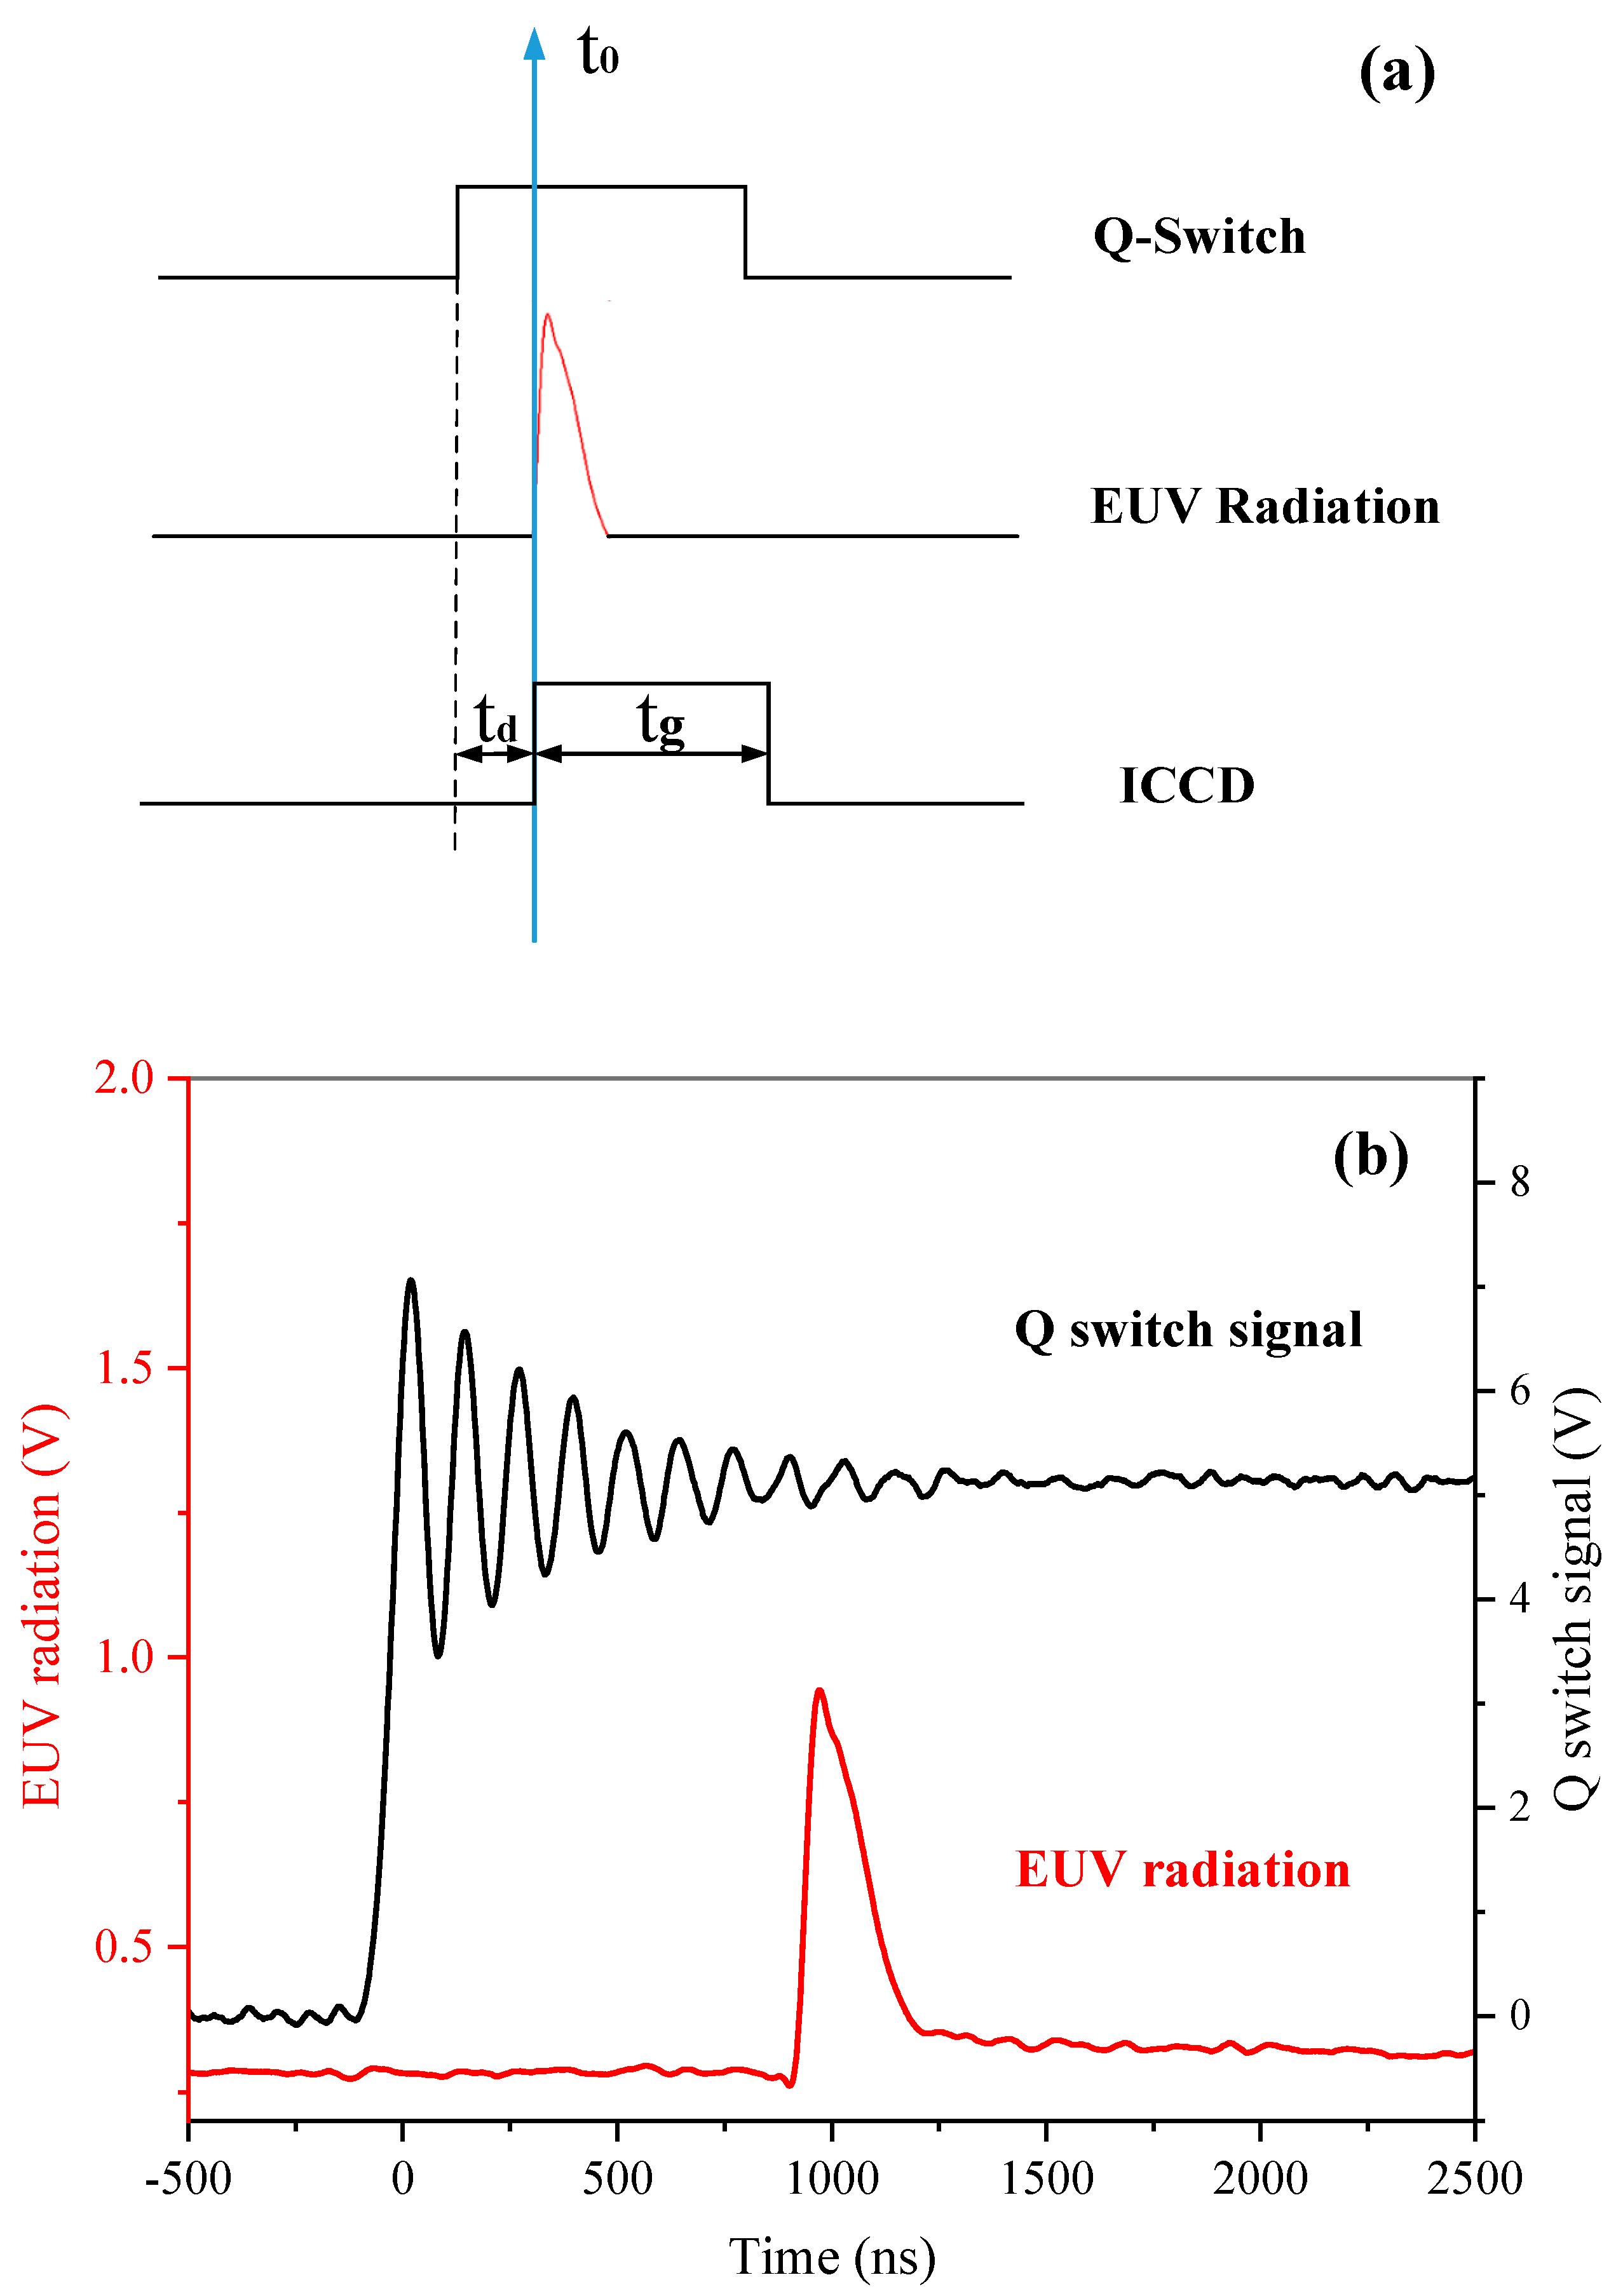
To achieve time–resolved measurements of the laser–produced tin plasma emission, the ICCD was synchronously triggered by the Q–switch signal of the Nd:YAG laser. The spectrometer, ICCD, and computer were interconnected to perform temporal measurements of tin plasma spectrum by adjusting the delay time (td), which represents the interval between the Q–switch signal of the laser and the start of spectral acquisition (i.e., the time interval between the Q–switch signal and the ICCD gate opening moment), as well as the gate width (tg), which represents the interval between the start and end points of spectral acquisition. In order to enhance the accuracy of experimental results, we conducted multiple measurements of the tin plasma emission under the same experimental conditions.
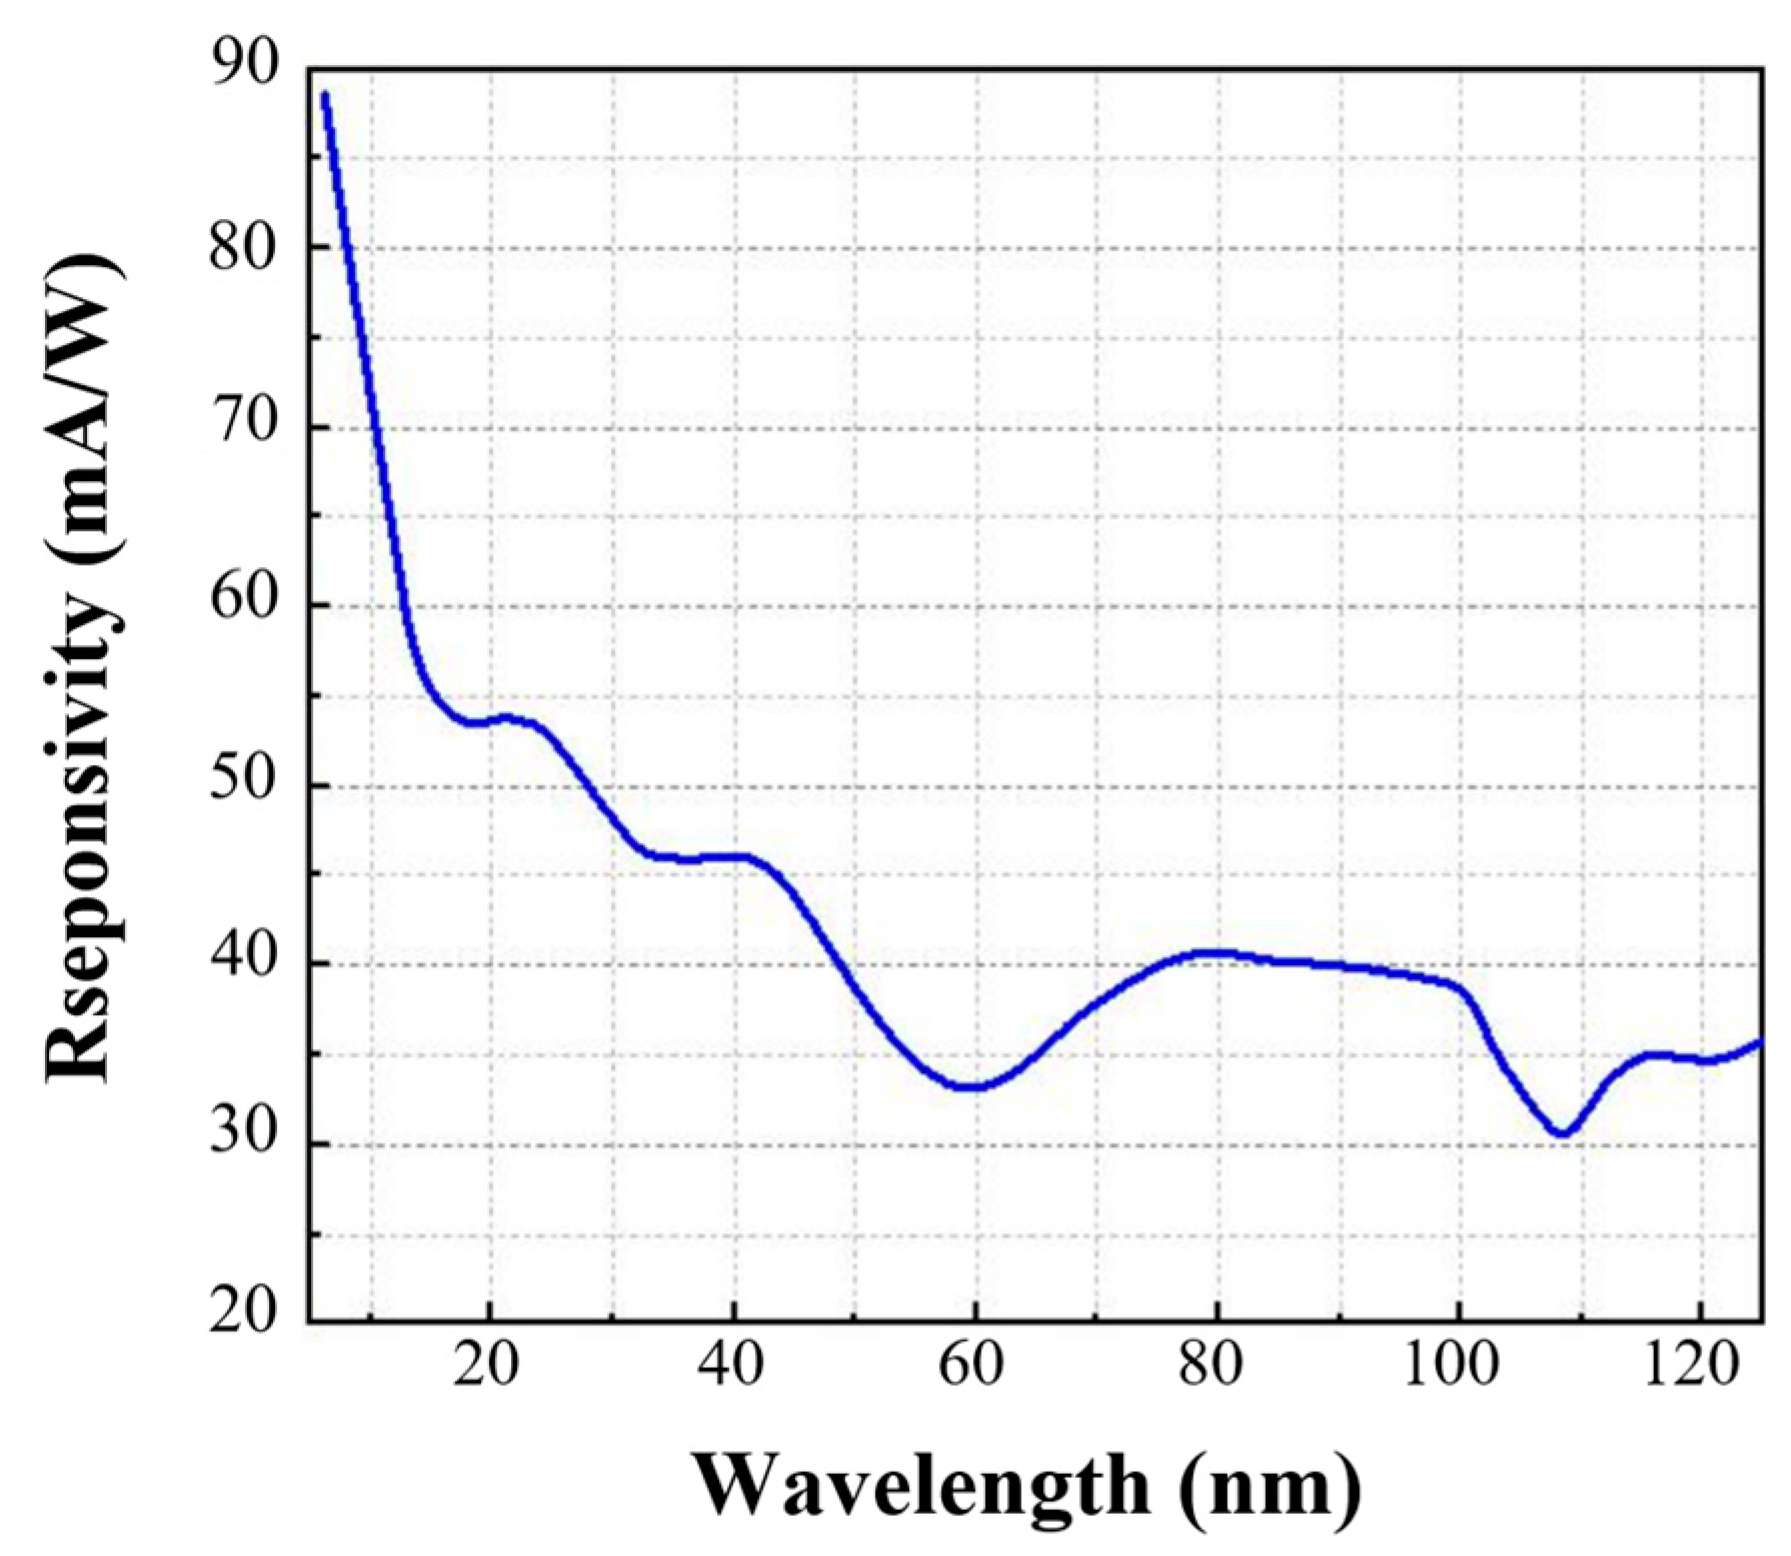
The experimental timing control diagram is illustrated in Figure 2a. The experiment was conducted with the moment of EUV radiation from tin plasma serving as the starting point, denoted as t0 for the first spectral acquisition. To determine the moment t0, the time characteristics of laser–produced tin plasma EUV radiation were recorded and measured using an EUV photoelectric detector (ST–EUV6) manufactured by GaNo optoelectronics company. The measurement results are presented in Figure 2b. It was found that the time interval between the moment of EUV radiation and the Q–switch signal of the laser is about 942 ns, i.e., the delay time td of the first spectral acquisition is 942 ns. The response curve of the ST–EUV6 in different wavelength bands is shown in Figure 3, revealing that the detector not only responds to the EUV wavelength band but also exhibits the other wavelength bands. Consequently, the signal measured by the ST–EUV6 contains light from non–EUV wavelength bands. To accurately measure the duration of EUV light, a zirconium film will be added in front of the detector in the next stage of work.

3. Results and Discussion

3.1. Time–Resolved Spectral Measurement of Laser–Produced Tin Plasma

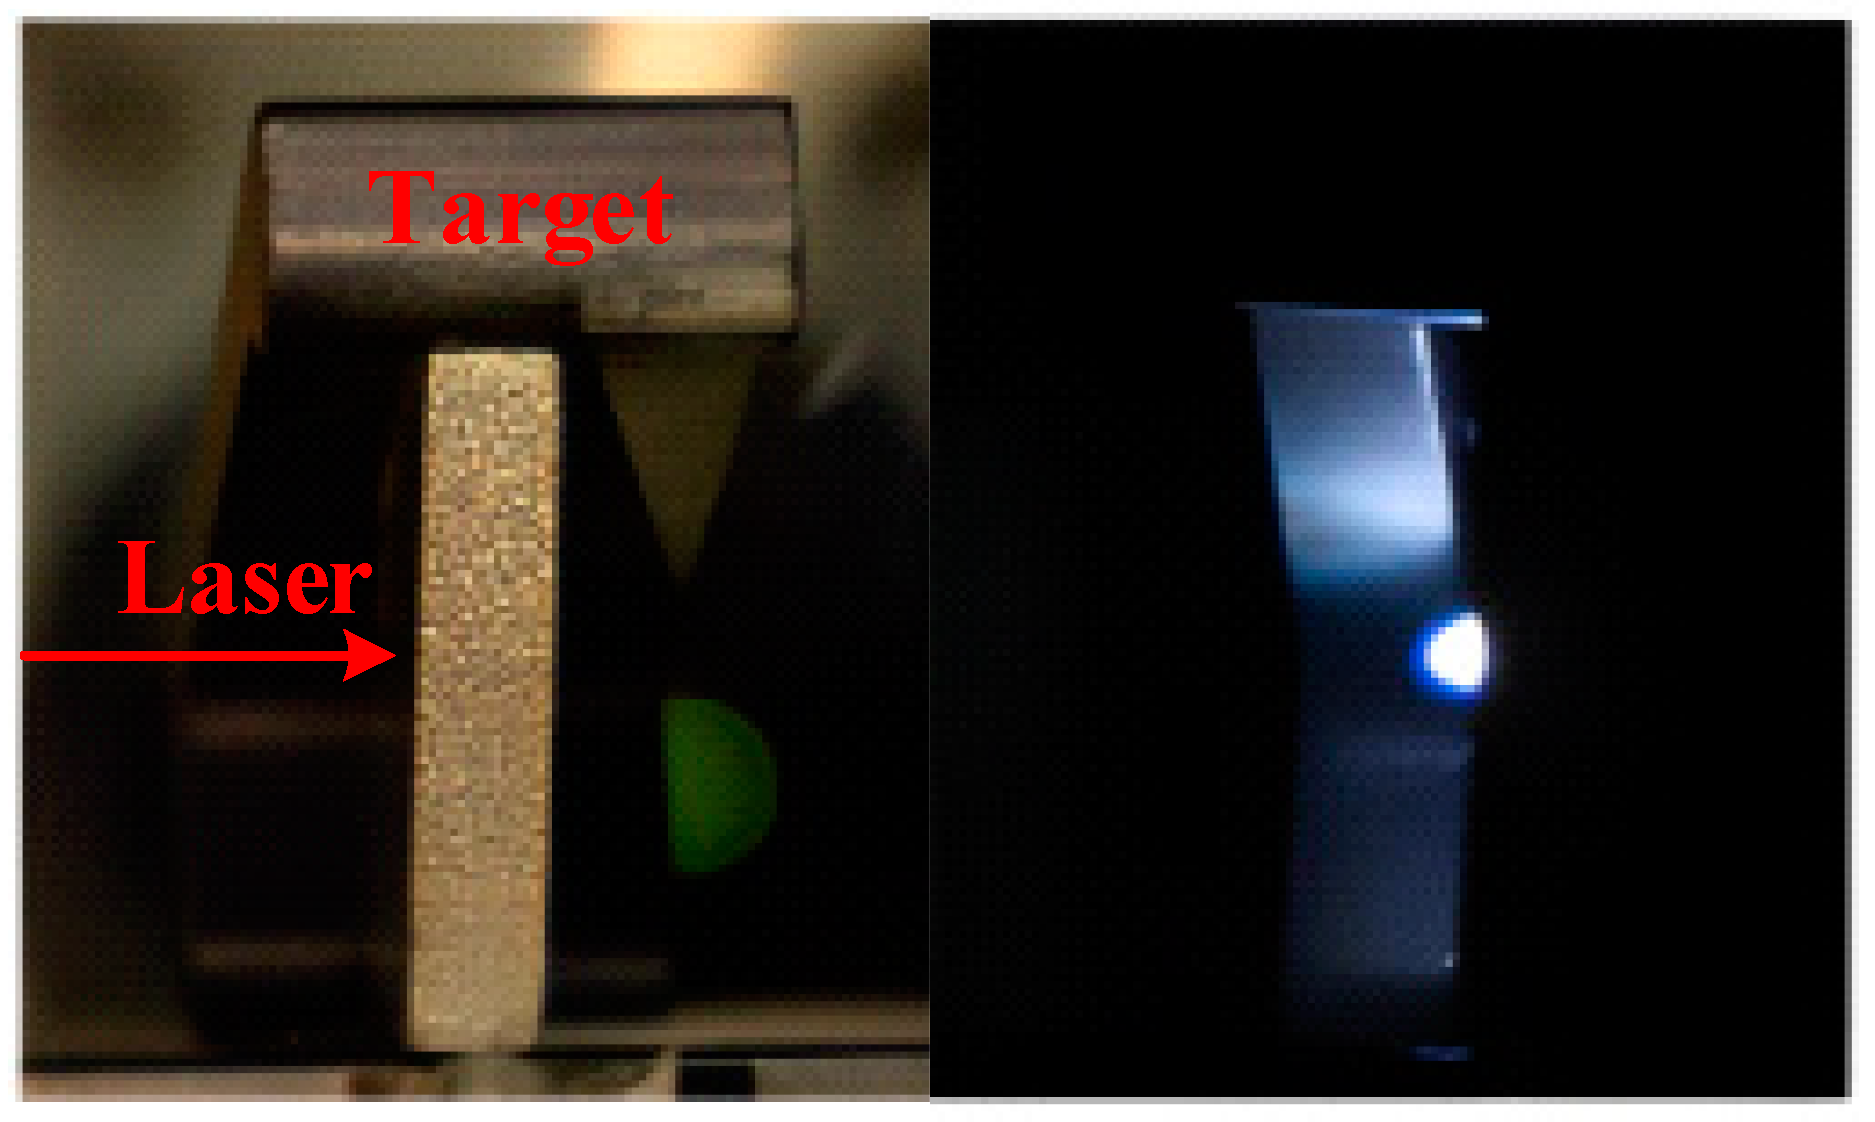
Laser–produced tin plasma was formed on the tin target by focusing the laser pulse vertically by focusing lens. The tin plasma image, captured with a CCD camera, was observed in the direction perpendicular to the target surface normal, as shown in Figure 4.
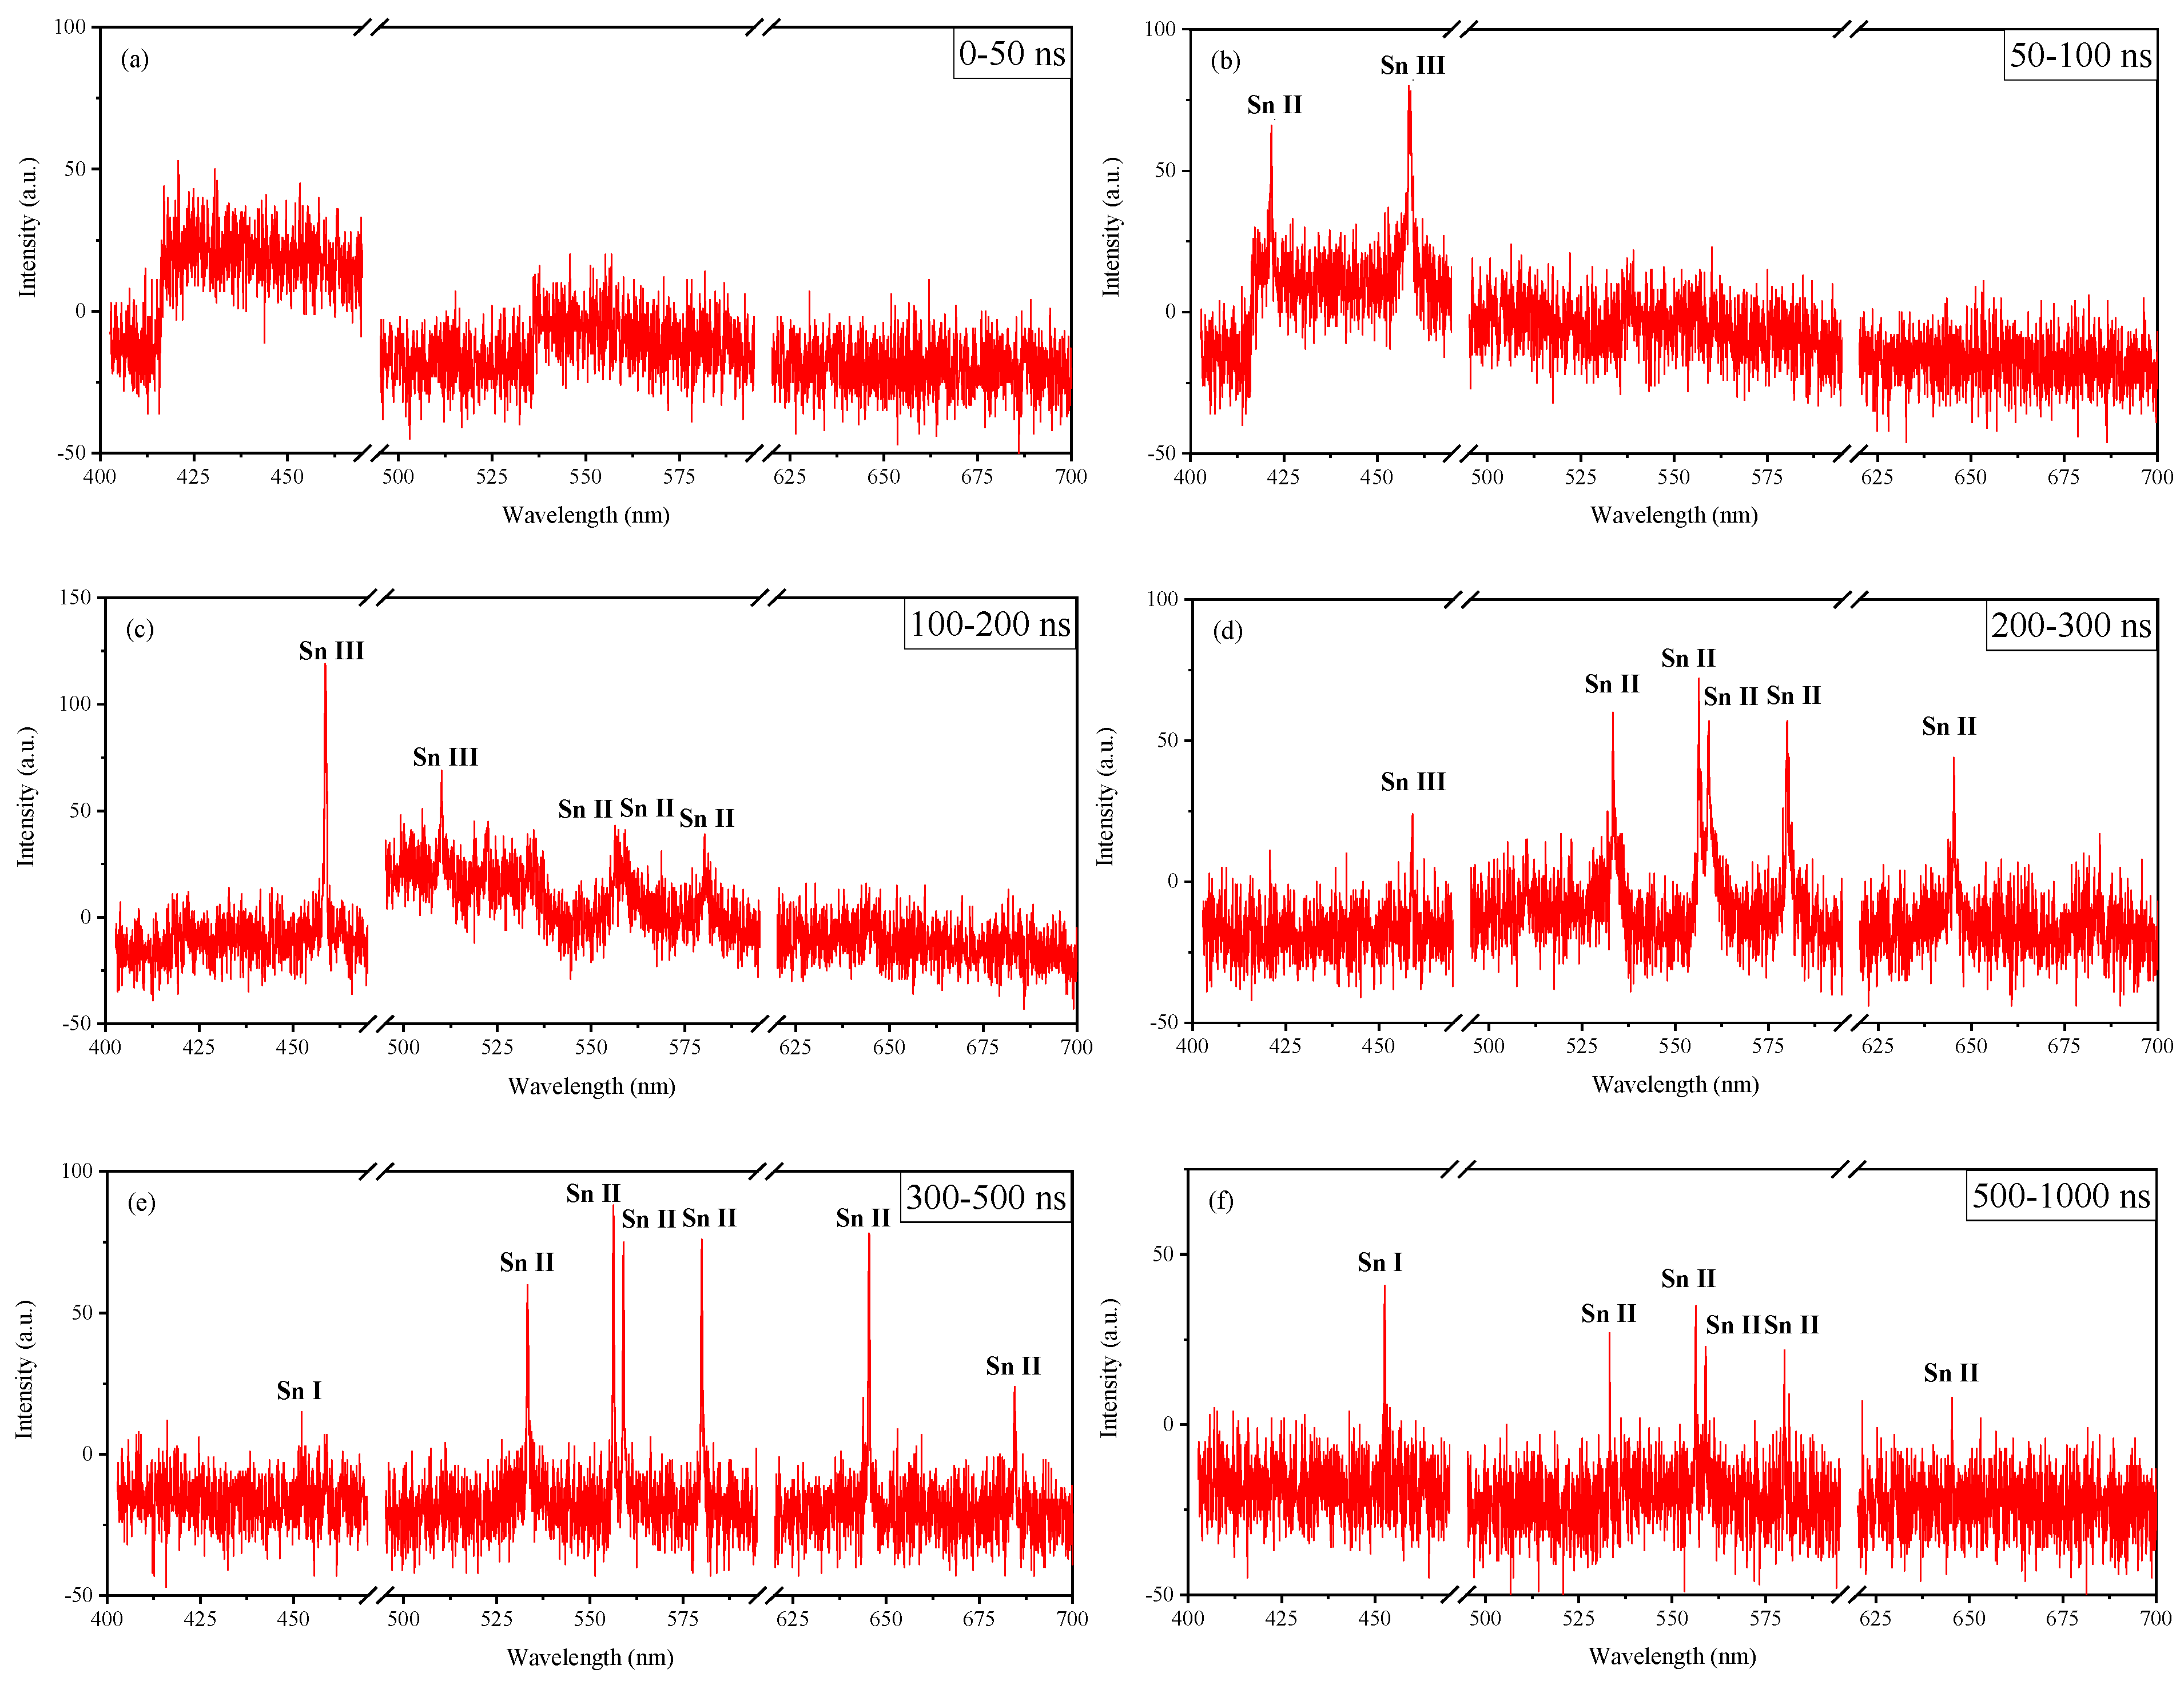
To investigate the temporal evolution characteristics of laser–produced tin plasma, the emission spectrum of tin plasma at different delay times were measured with laser pulse energy of 300 mJ (laser intensity of approximately 1.0 × 10¹² W/cm2), as shown in Figure 5. The evolution process of tin ions and atoms during the expansion of the laser–produced tin plasma was analyzed. Within the delay time range of 0–1000 ns, the emission spectrum of tin plasma exhibited two distinct phases: an initial phase, characterized by a dominant continuum emission, followed by a subsequent phase dominated by spectral line emission. The latter includes ionic lines such as Sn II and Sn III, as well as neutral atom line, represented by Sn I.
During the initial phase of tin plasma formation with a delay time below 50 ns, the intense bremsstrahlung and radiative recombination are present within the laser–produced tin plasma, leading to emission spectrum characterized by continuum emission. Subsequently, the intensity of the continuum spectrum gradually decreases while line spectra begin to emerge. With the delay time of 300 ns, the line spectra dominate, originating from the collision excitation produced by transitions between different bound energy levels of electrons in atoms or ions. A trend of initially increasing followed by decreasing intensity is observed in the line spectra as the delay time varies. In general, the doubly ionized Sn III lines exhibit an earlier onset and disappearance compared to the singly ionized Sn II lines due to the formation of lower ionization states through recombination between highly charged ions and electrons. When the delay time exceeds 500 ns, the intensity of singly ionized Sn II lines gradually decreases as the neutral Sn I atom line emerge.

3.2. Diagnosis of Electron Temperature and Electron Density in Laser–Produced Tin Plasma

To further elucidate the temporal evolution of laser–produced tin plasma parameters (electron temperature and electron density), the Saha–Boltzmann plot and Stark broadening method were employed to analyze the six singly ionized Sn II lines and one neutral Sn I atom line in Figure 5. Table 1 presents the relevant parameters of the selected spectral lines, with data obtained from the National Institute of Standards and Technology (NIST) database [20].

3.2.1. Electron Temperature Diagnosis

The Saha–Boltzmann method was employed to calculate the electron temperature of laser–produced tin plasma, as the measured spectral line emissions originate from different ionization states [21,22]. Assuming that the laser–produced tin plasma satisfies the local thermodynamic equilibrium and neglecting self–absorption effects, the intensity of the ionic lines from the transition of higher energy level k to lower energy level i can be expressed as follows:
I k i I I = h c A k i 4 π λ k i n a I I g k U a I I e E k k B T
where, n a I I is the number density of singly charged ions, A k i is the transition probability, U a I I is the partition function, g k is the statistical weight of the upper level k , E k is the energy of the upper level k , and k B is the Boltzmann constant.
The ratio between the number density of neutral atom n a I and the number density of singly charged ions n a I I satisfies the Saha equation:
n a I I n a I = ( 2 π m e k B T ) 3 / 2 n e h 3 2 U a I I U a I e E I P E k B T
Δ E = 3 e 2 4 π ε 0 ( 4 π n e 3 ) 1 / 3
where, n e represents the electron density of the plasma, m e represents the mass of the electron, h represents the Planck’s constant, E I P represents the atomic ionization energy, and E represents the ionization energy correction due to Debye shielding [23].
The combination of Equations (1) and (2) yields the following equation:
I k i I I λ k i A k i g k = h c n a I 4 π U a I · 2 ( 2 π m e k B T ) 3 / 2 n e h 3 e E k + E I P E k B T
By performing a logarithmic transformation on both sides of Equation (4), the following equation is obtained:
l n I k i I I λ k i A k i g k l n 2 ( 2 π m e k B T ) 3 2 n e h 3 = E k + E I P E k B T + l n h c n a I 4 π U a I
Equation (5) can be simplified into a linear function form:
l n I k i I I λ k i A k i g k * = a E k * + b
where
E k * = E k   a t o m ( E k + E I P E )   i o n  
l n I k i I I λ k i A k i g k * = ln I k i I I λ k i A k i g k   a t o m ln I k i I I λ k i A k i g k ln 2 ( 2 π m e k B T ) 3 2 n e h 3   i o n  
a = 1 k B T
b = l n h c n a I 4 π U a I
In the calculation process, the laser–produced tin plasma temperature is first set as the initial estimated value T 0 and substituted into parameter l n I k i I I λ k i A k i g k * . A scatter plot is generated with E k * as the horizontal axis and l n I k i I I λ k i A k i g k * as the vertical axis, and the scatter points are subjected to linear regression to obtain the slope a . Subsequently, a new T value is calculated using the obtained slope and then substituted into Equation (6) for another round of linear regression. This iterative process is repeated multiple times until the convergence value of T is obtained.
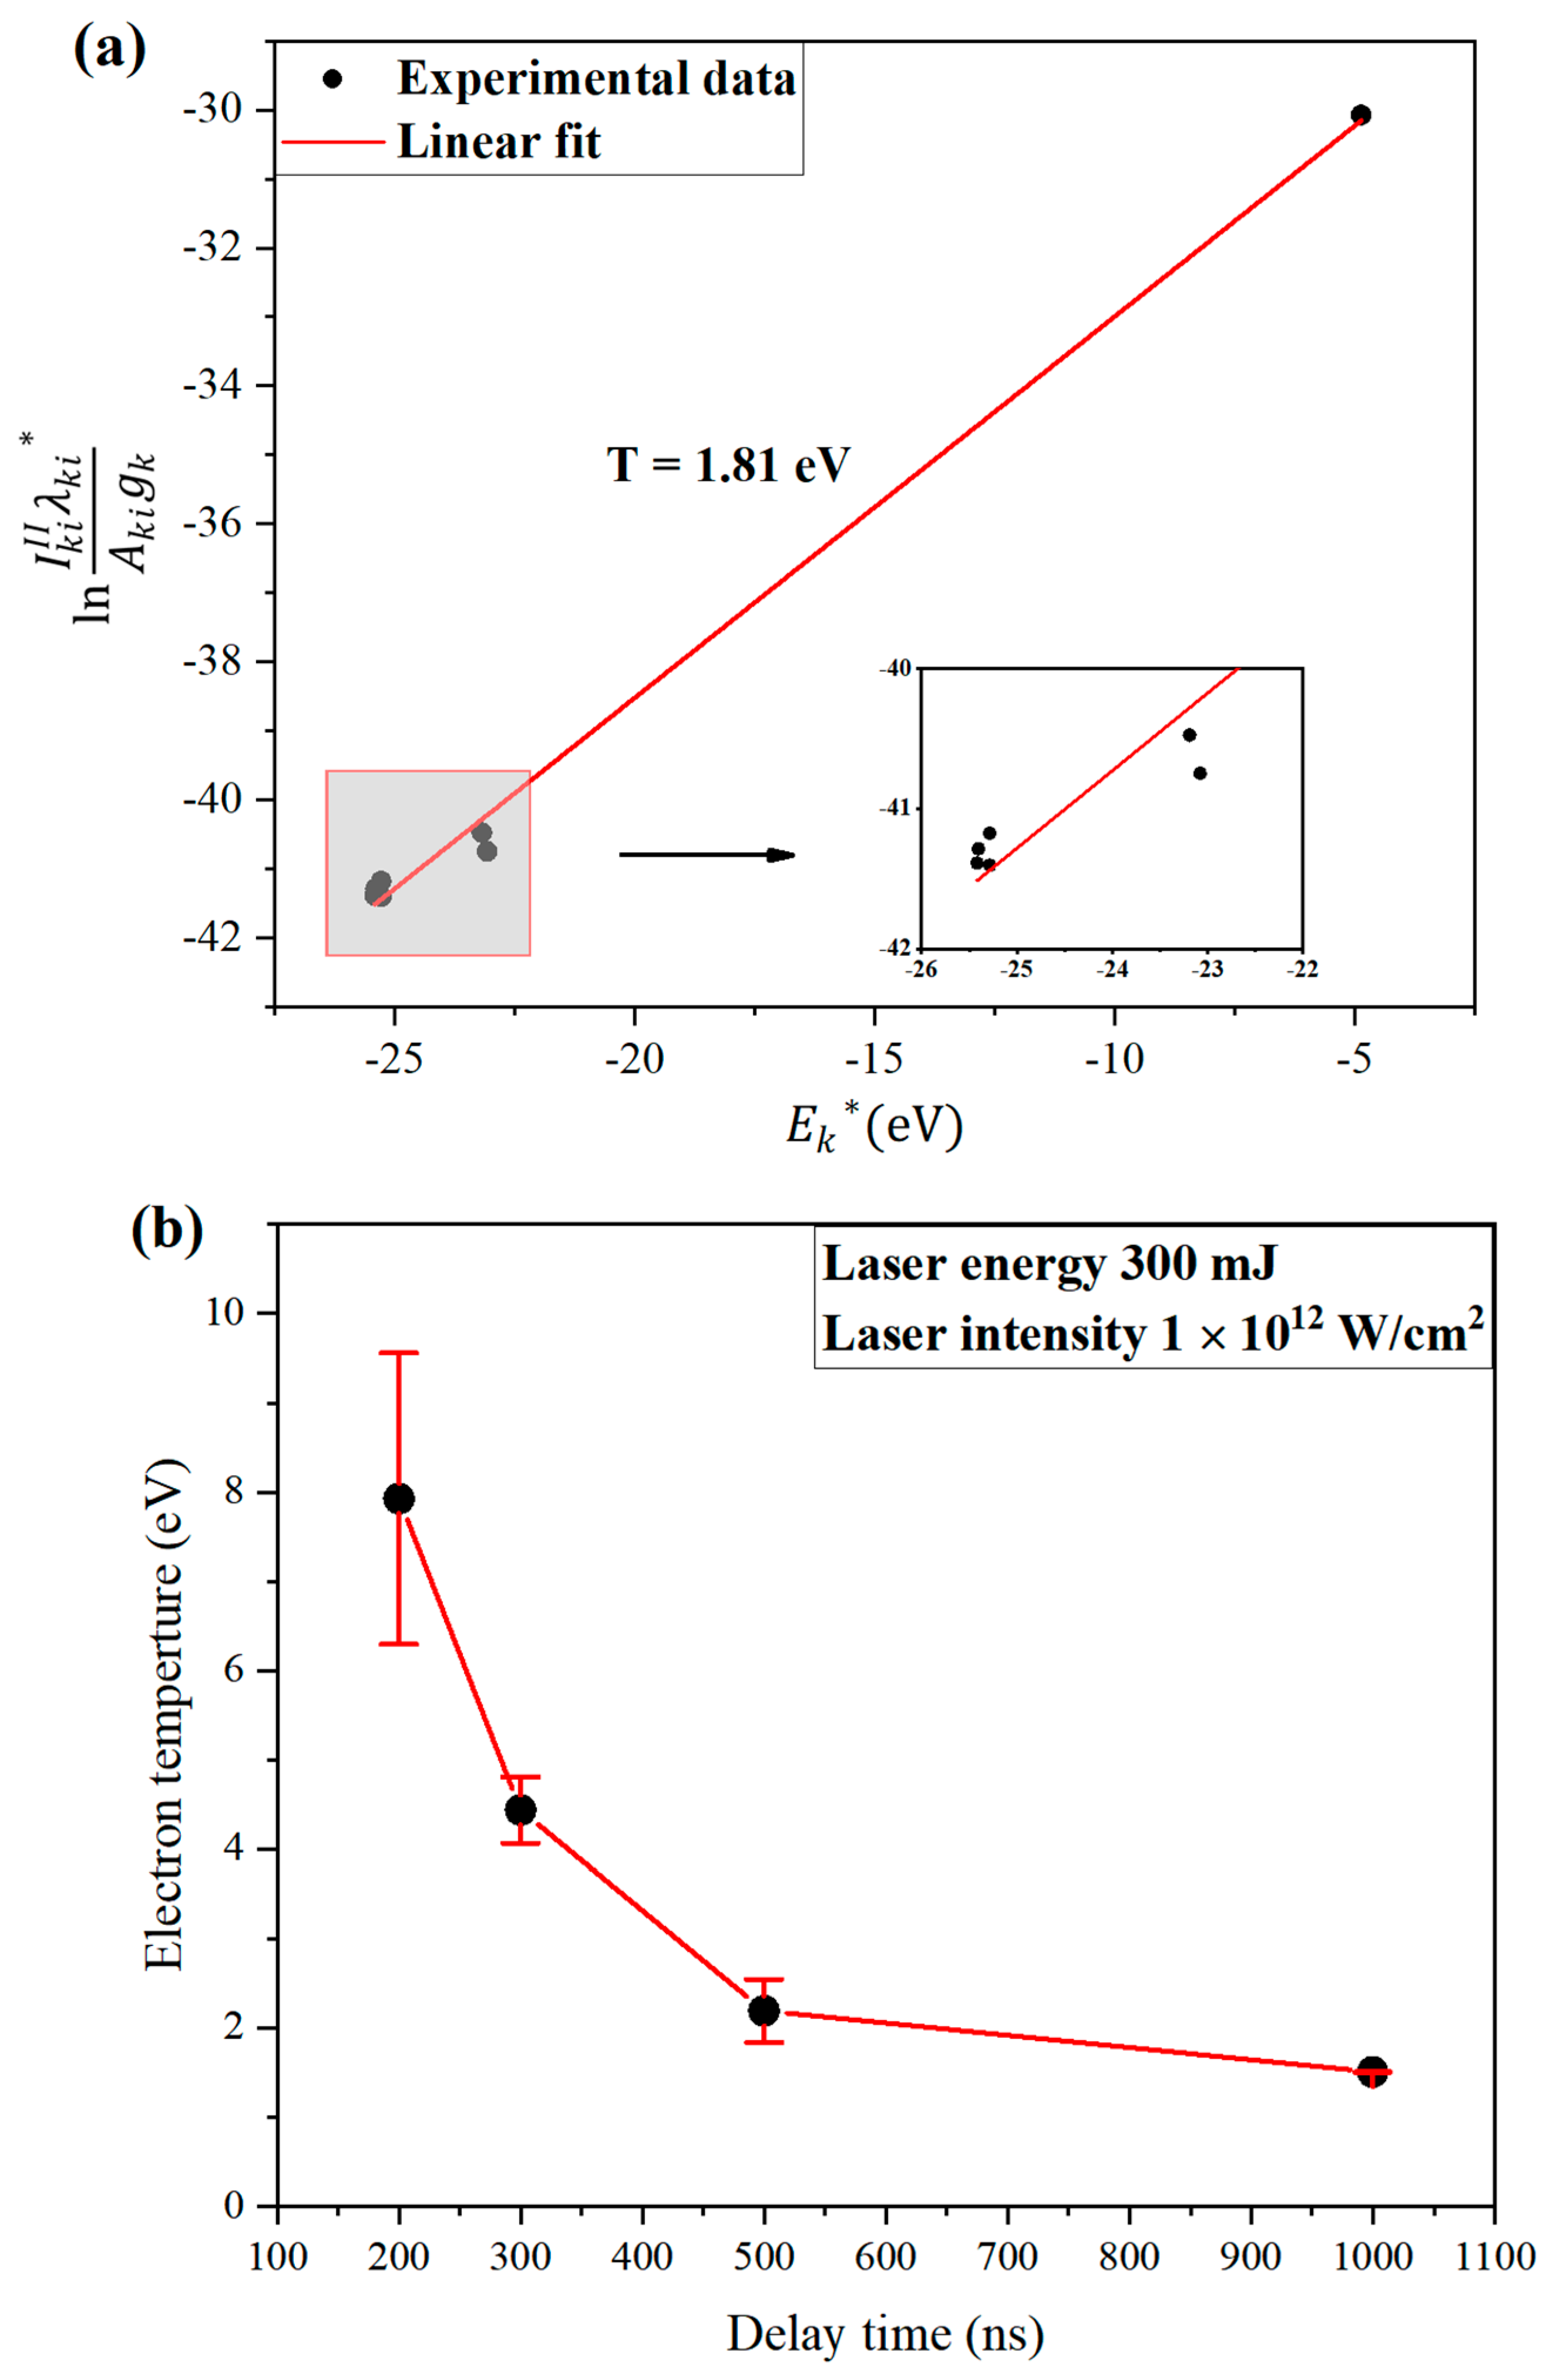
The electron temperature of laser−produced tin plasma with a laser pulse energy of 300 mJ and a delay time of 500 ns was determined using the Saha–Boltzmann method, based on the intensities of six singly ionized Sn II lines and one neutral Sn I atom line, as well as the corresponding energy level parameters from the NIST database. The measured spectral parameters are presented in Table 2. Multiple iterations were performed until convergence was achieved, resulting in a linear fit of the data. The iterative process ultimately resulted in the l n I k i I I λ k i A k i g k * E k * linear fit with a slope, denoted as a , which allows for the determination of the tin plasma electron temperature as T = 1.81 eV. The fitting results, shown in Figure 6a, demonstrate a correlation coefficient of 0.998 for the linear fit.
The electron temperature T e of laser–produced tin plasma was calculated for different delay times with laser pulse energy of 300 mJ using the Saha–Boltzmann method, as shown in Figure 6b, revealing that the electron temperature decreased from 7.93 eV to 1.51 eV with the increase in delay time. This decrease is attributed to the radiative de–excitation of the tin plasma, causing excited particles to transition to the ground state and release a certain amount of energy, as well as the continuous expansion of the tin plasma, resulting in the conversion of internal energy to kinetic energy.
Additionally, the overall trend of the evolution curve of tin plasma electron temperature exhibits a sharp decrease followed by a gradual decline. This is due to the adiabatic expansion of tin plasma after the termination of laser irradiation, where the plasma still expands at a relatively fast speed and its internal energy quickly converts into kinetic energy without additional laser energy injection, leading to a sharp decrease in the electron temperature with increasing delay time. As the delay time ranges from 300 to 1000 ns, the gradual decline in electron temperature is attributed to the collision excitation that causes the recombination of highly charged ions with free electrons in the tin plasma and thus leads to the formation of lowly charged ions and the storage of a portion of energy. Moreover, the sustained collision excitation during this period causes the emission spectrum to be dominated by spectral line emission, as illustrated in Figure 5.
Furthermore, it can also be observed that there is a large calculation error in the electron temperature when the delay time is 200 ns, which is due to the strong intensity of the continuum emission along with the relatively low intensities and unclear profile shapes of spectral Sn II lines. Consequently, the error of spectral line intensity measurement is introduced, which affects the accuracy of spectroscopic analysis.

3.2.2. Electron Density Diagnosis

The electron density of laser–produced tin plasma is related to the spectral line broadening of the emission spectrum, primarily originating from Stark broadening [24]. The relationship between the full width at half maximum (FWHM) of the Stark broadened line Δ λ 1 / 2 and the electron density n e is as follows [25,26]:
Δ λ 1 / 2 = 2 ω ( n e 1 0 16 ) + 3.5 A ( n e 1 0 17 ) 1 / 4 × ( 1 3 4 N D 1 / 3 ) ω ( n e 1 0 17 )
where, ω is the electron impact parameter, A is the ion broadening parameter, and N D is the number of particles in the Debye sphere. The first term in Equation (11) represents the broadening caused by electron impact, while the second term represents ion broadening. Since the line broadening of atomic and singly ionized lines is primarily caused by electron impact, the contribution of ion broadening is relatively minor and can be neglected. The relationship between Stark broadening and electron density is given as follows:
Δ λ 1 / 2 = 2 ω ( n e 1 0 16 )
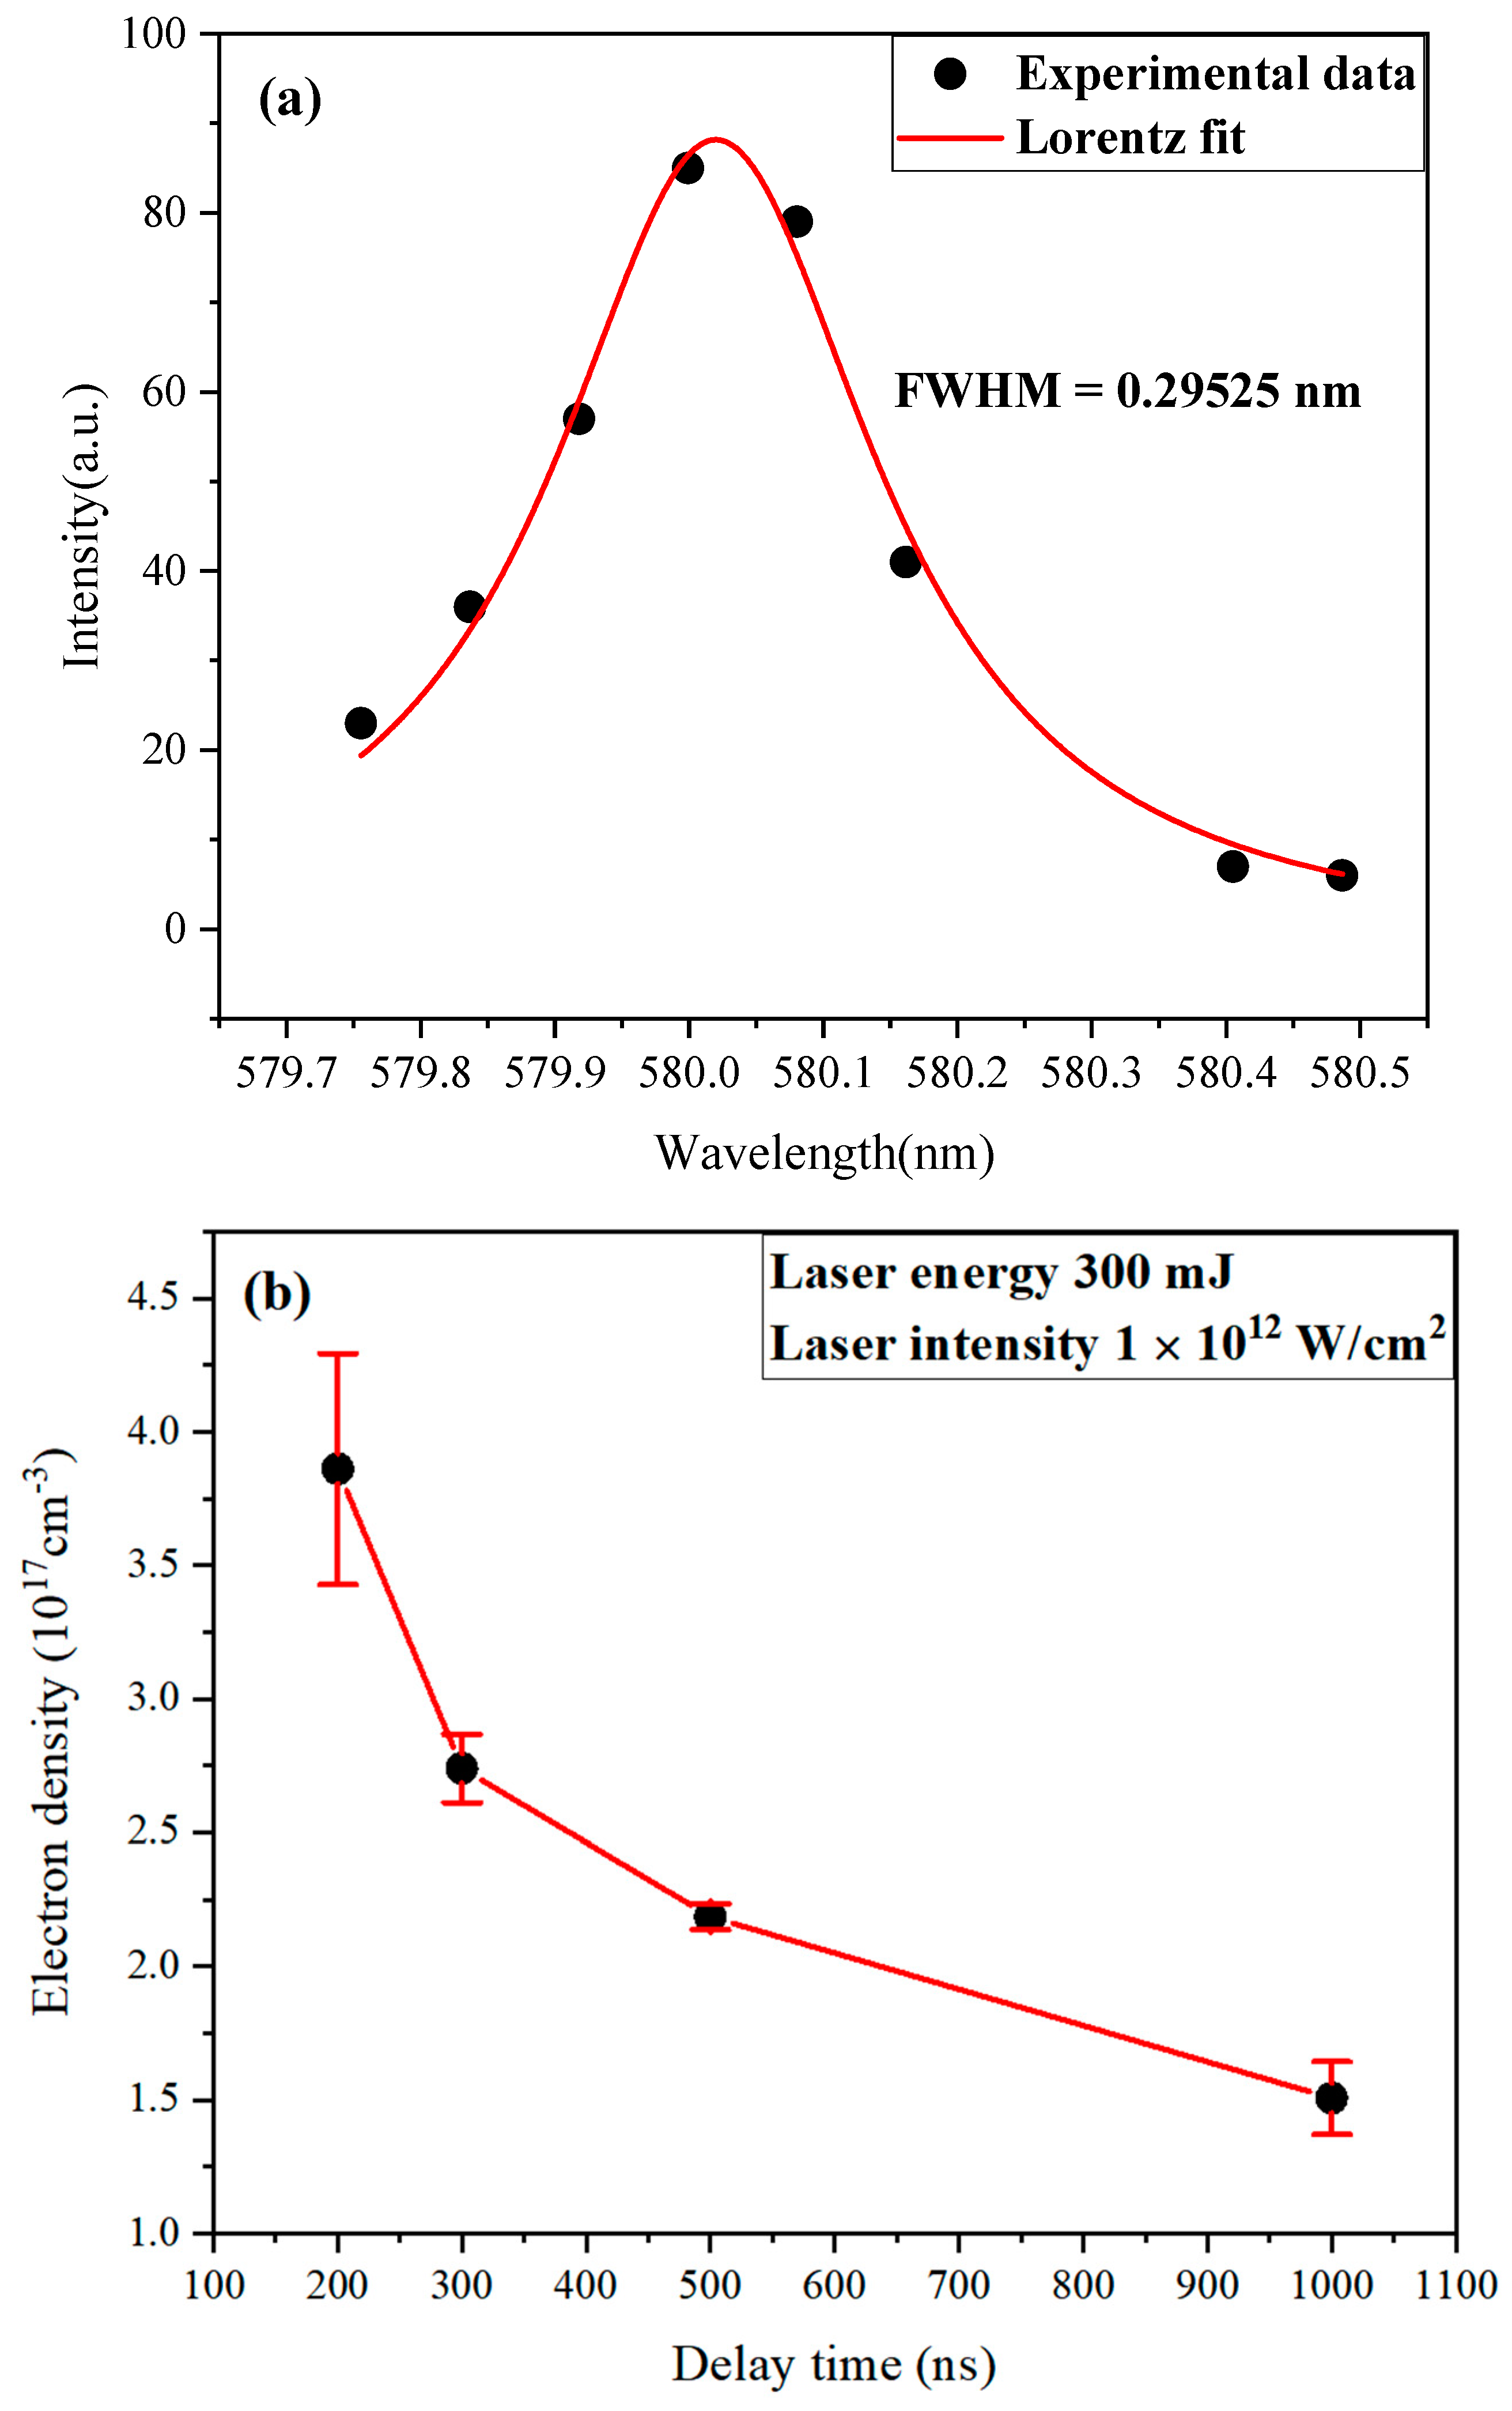
The electron density n e of tin plasma with laser pulse energy of 300 mJ and a delay time of 500 ns can be calculated by obtaining the FWHM of the Sn II line at 580.00 nm through fitting the Lorentzian profile. The FWHM of Stark–broadened lines Δ λ 1 / 2 = 0.29525 nm with a correlation coefficient of 0.990, as shown in Figure 7a. The electron impact parameter ω , with a value of 0.065 nm, can be obtained by referring to reference [27]. By utilizing Equation (12), the electron density n e of tin plasma was calculated to be n e = 2.160 × 1017 cm−3.
The electron density n e of laser–produced tin plasma was calculated for different delay times with laser pulse energy of 300 mJ using the Stark broadening method, as illustrated in Figure 7b, indicating that the electron density decreased from 3.86 × 1017 cm−3 to 1.51 × 1017 cm−3 as the delay time increased. This decrease due to the continuous capture of electrons by ions through three–body recombination and radiative recombination in the tin plasma.
Additionally, the overall trend of the evolution curve of tin plasma electron density exhibits a rapid initial decrease followed by a gradual decline. This is attributed to the fact that the radiative recombination rate in the laser–produced tin plasma is much higher than the ionization rate after the termination of laser irradiation, resulting in a rapid reduction in electron density. During this initial period, the electron–ion recombination process is dominant, and the emission spectrum is primarily dominated by continuum emission. As the delay time increases from 300 ns to 1000 ns, the process of radiative recombination weakens, leading to a slower decrease in electron density.
Furthermore, due to the low spectral resolution of the Sn II 580 nm line profile at a delay time of 200 ns, the uncertainty of the line profile fitting is introduced, resulting in a significant measurement error in the calculation of electron density.

3.3. Diagnosis of Laser–Produced Tin Plasma Parameters under Different Laser Pulse Energies

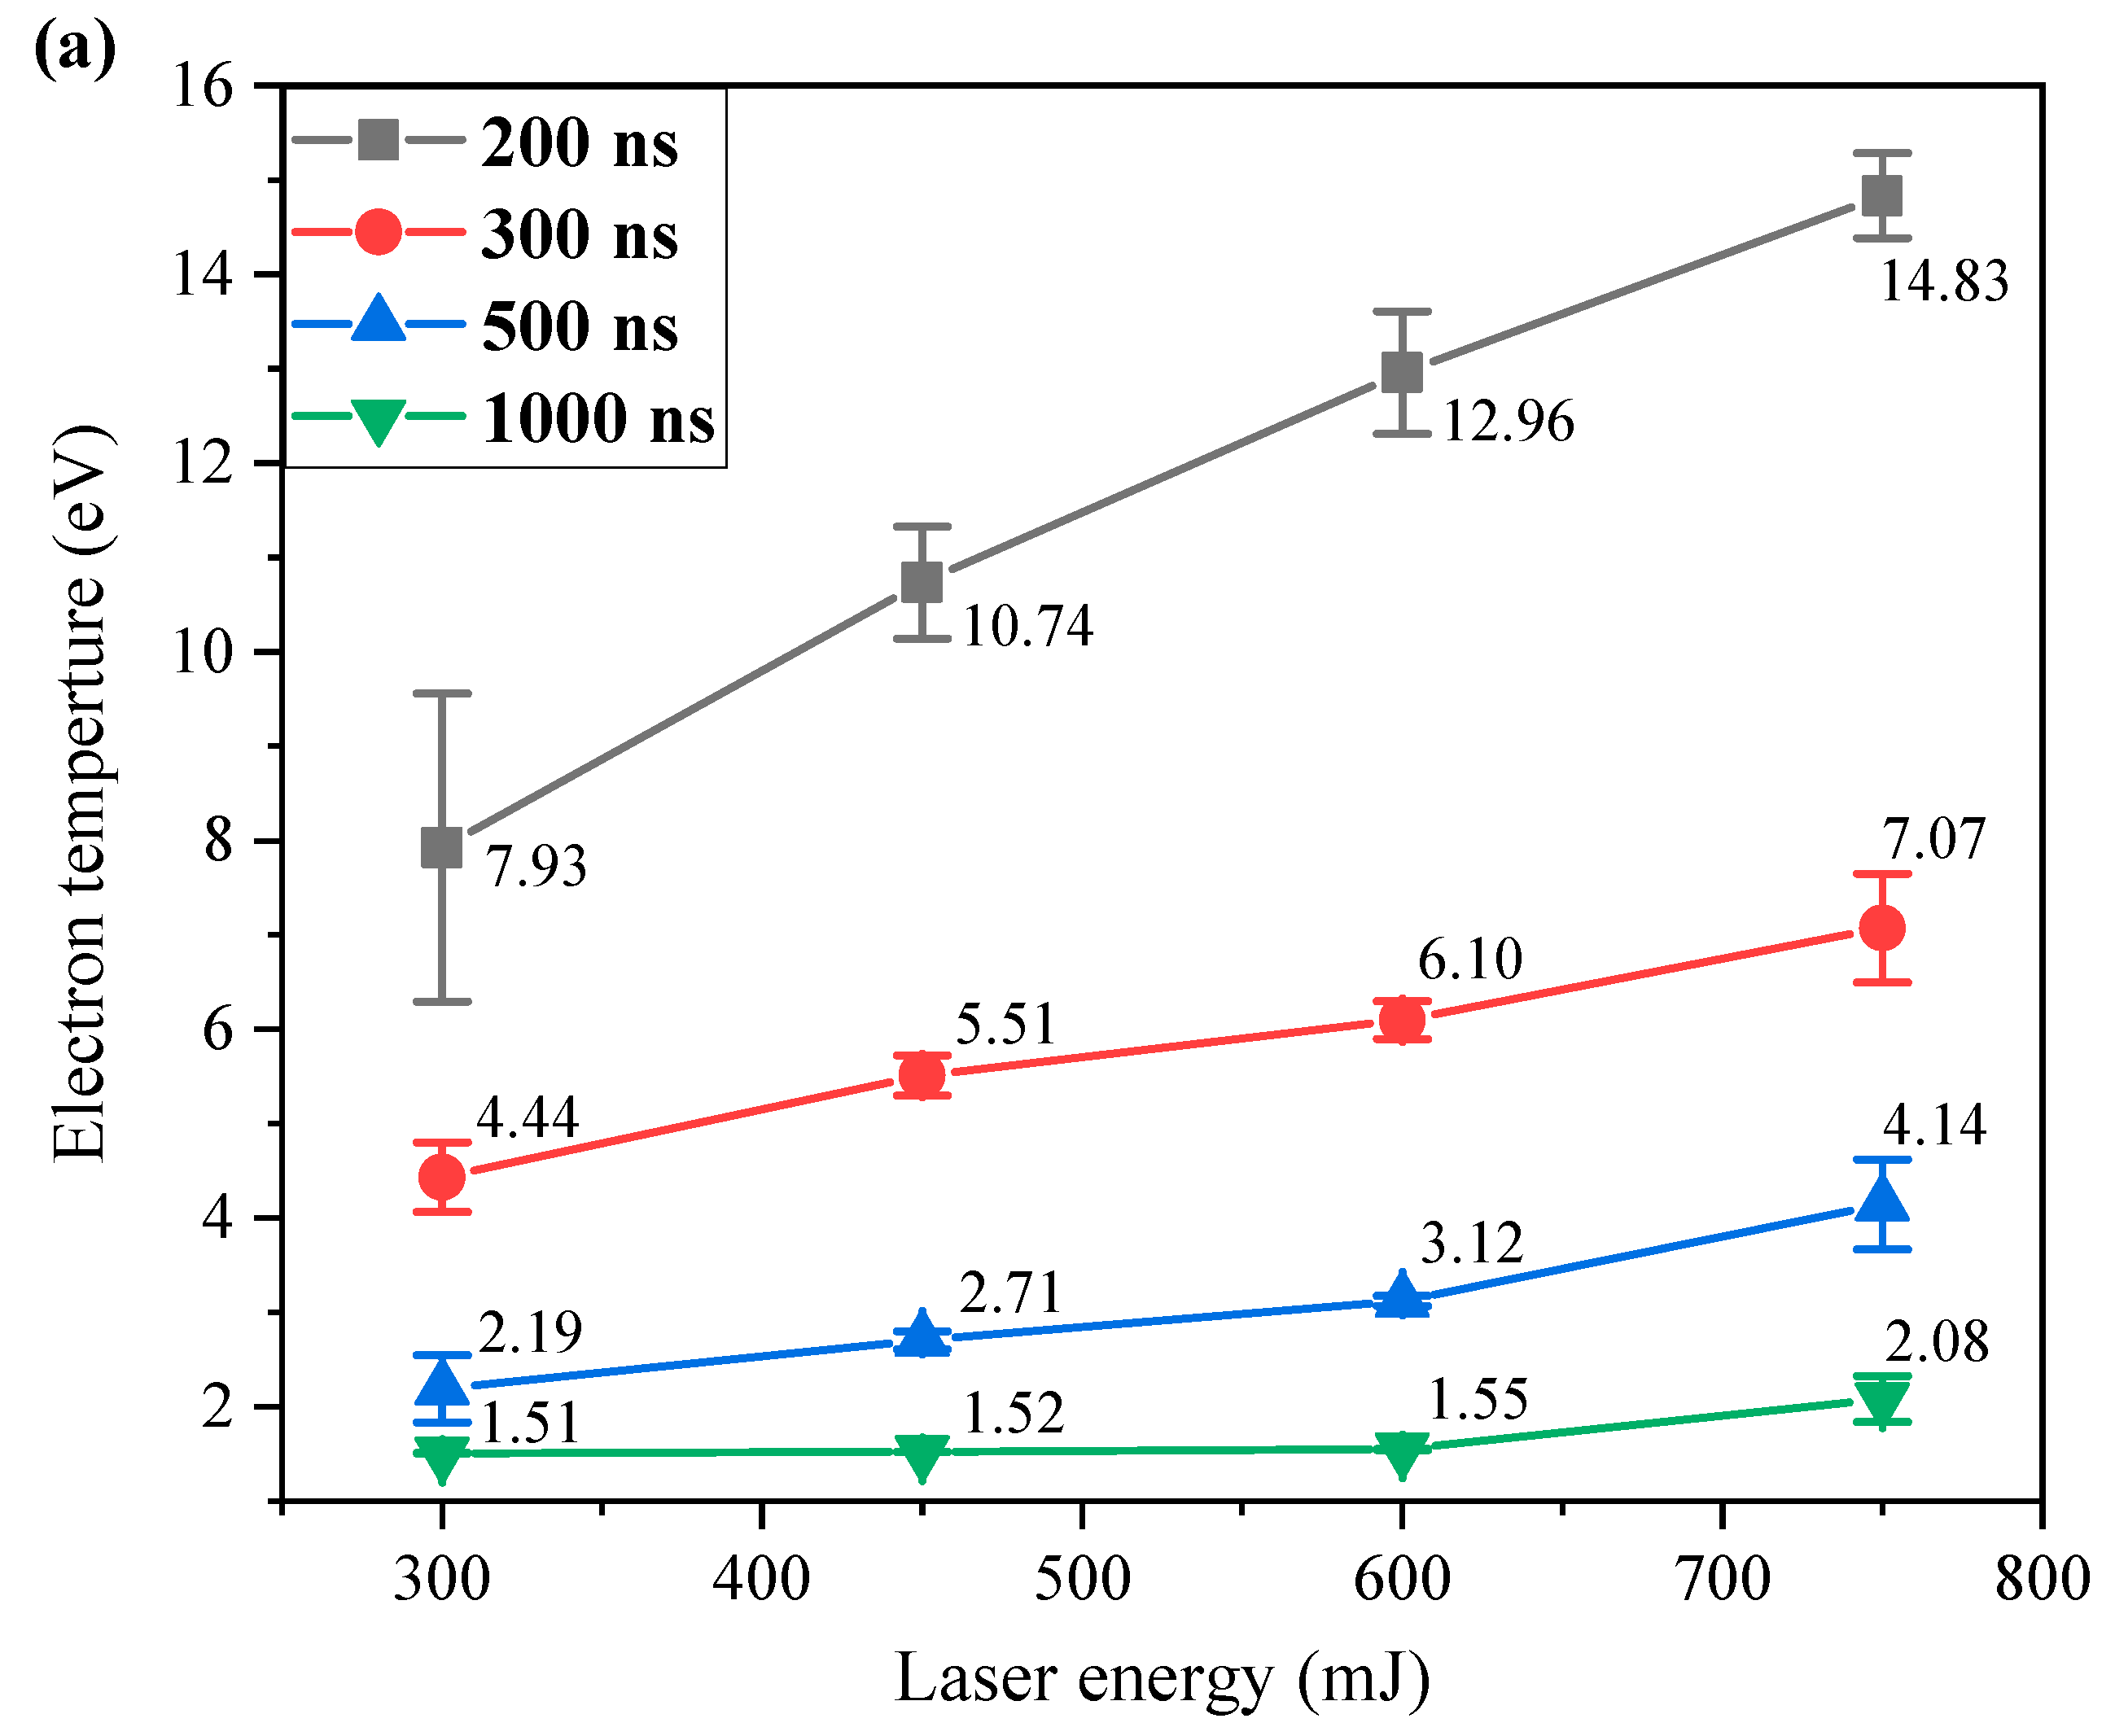
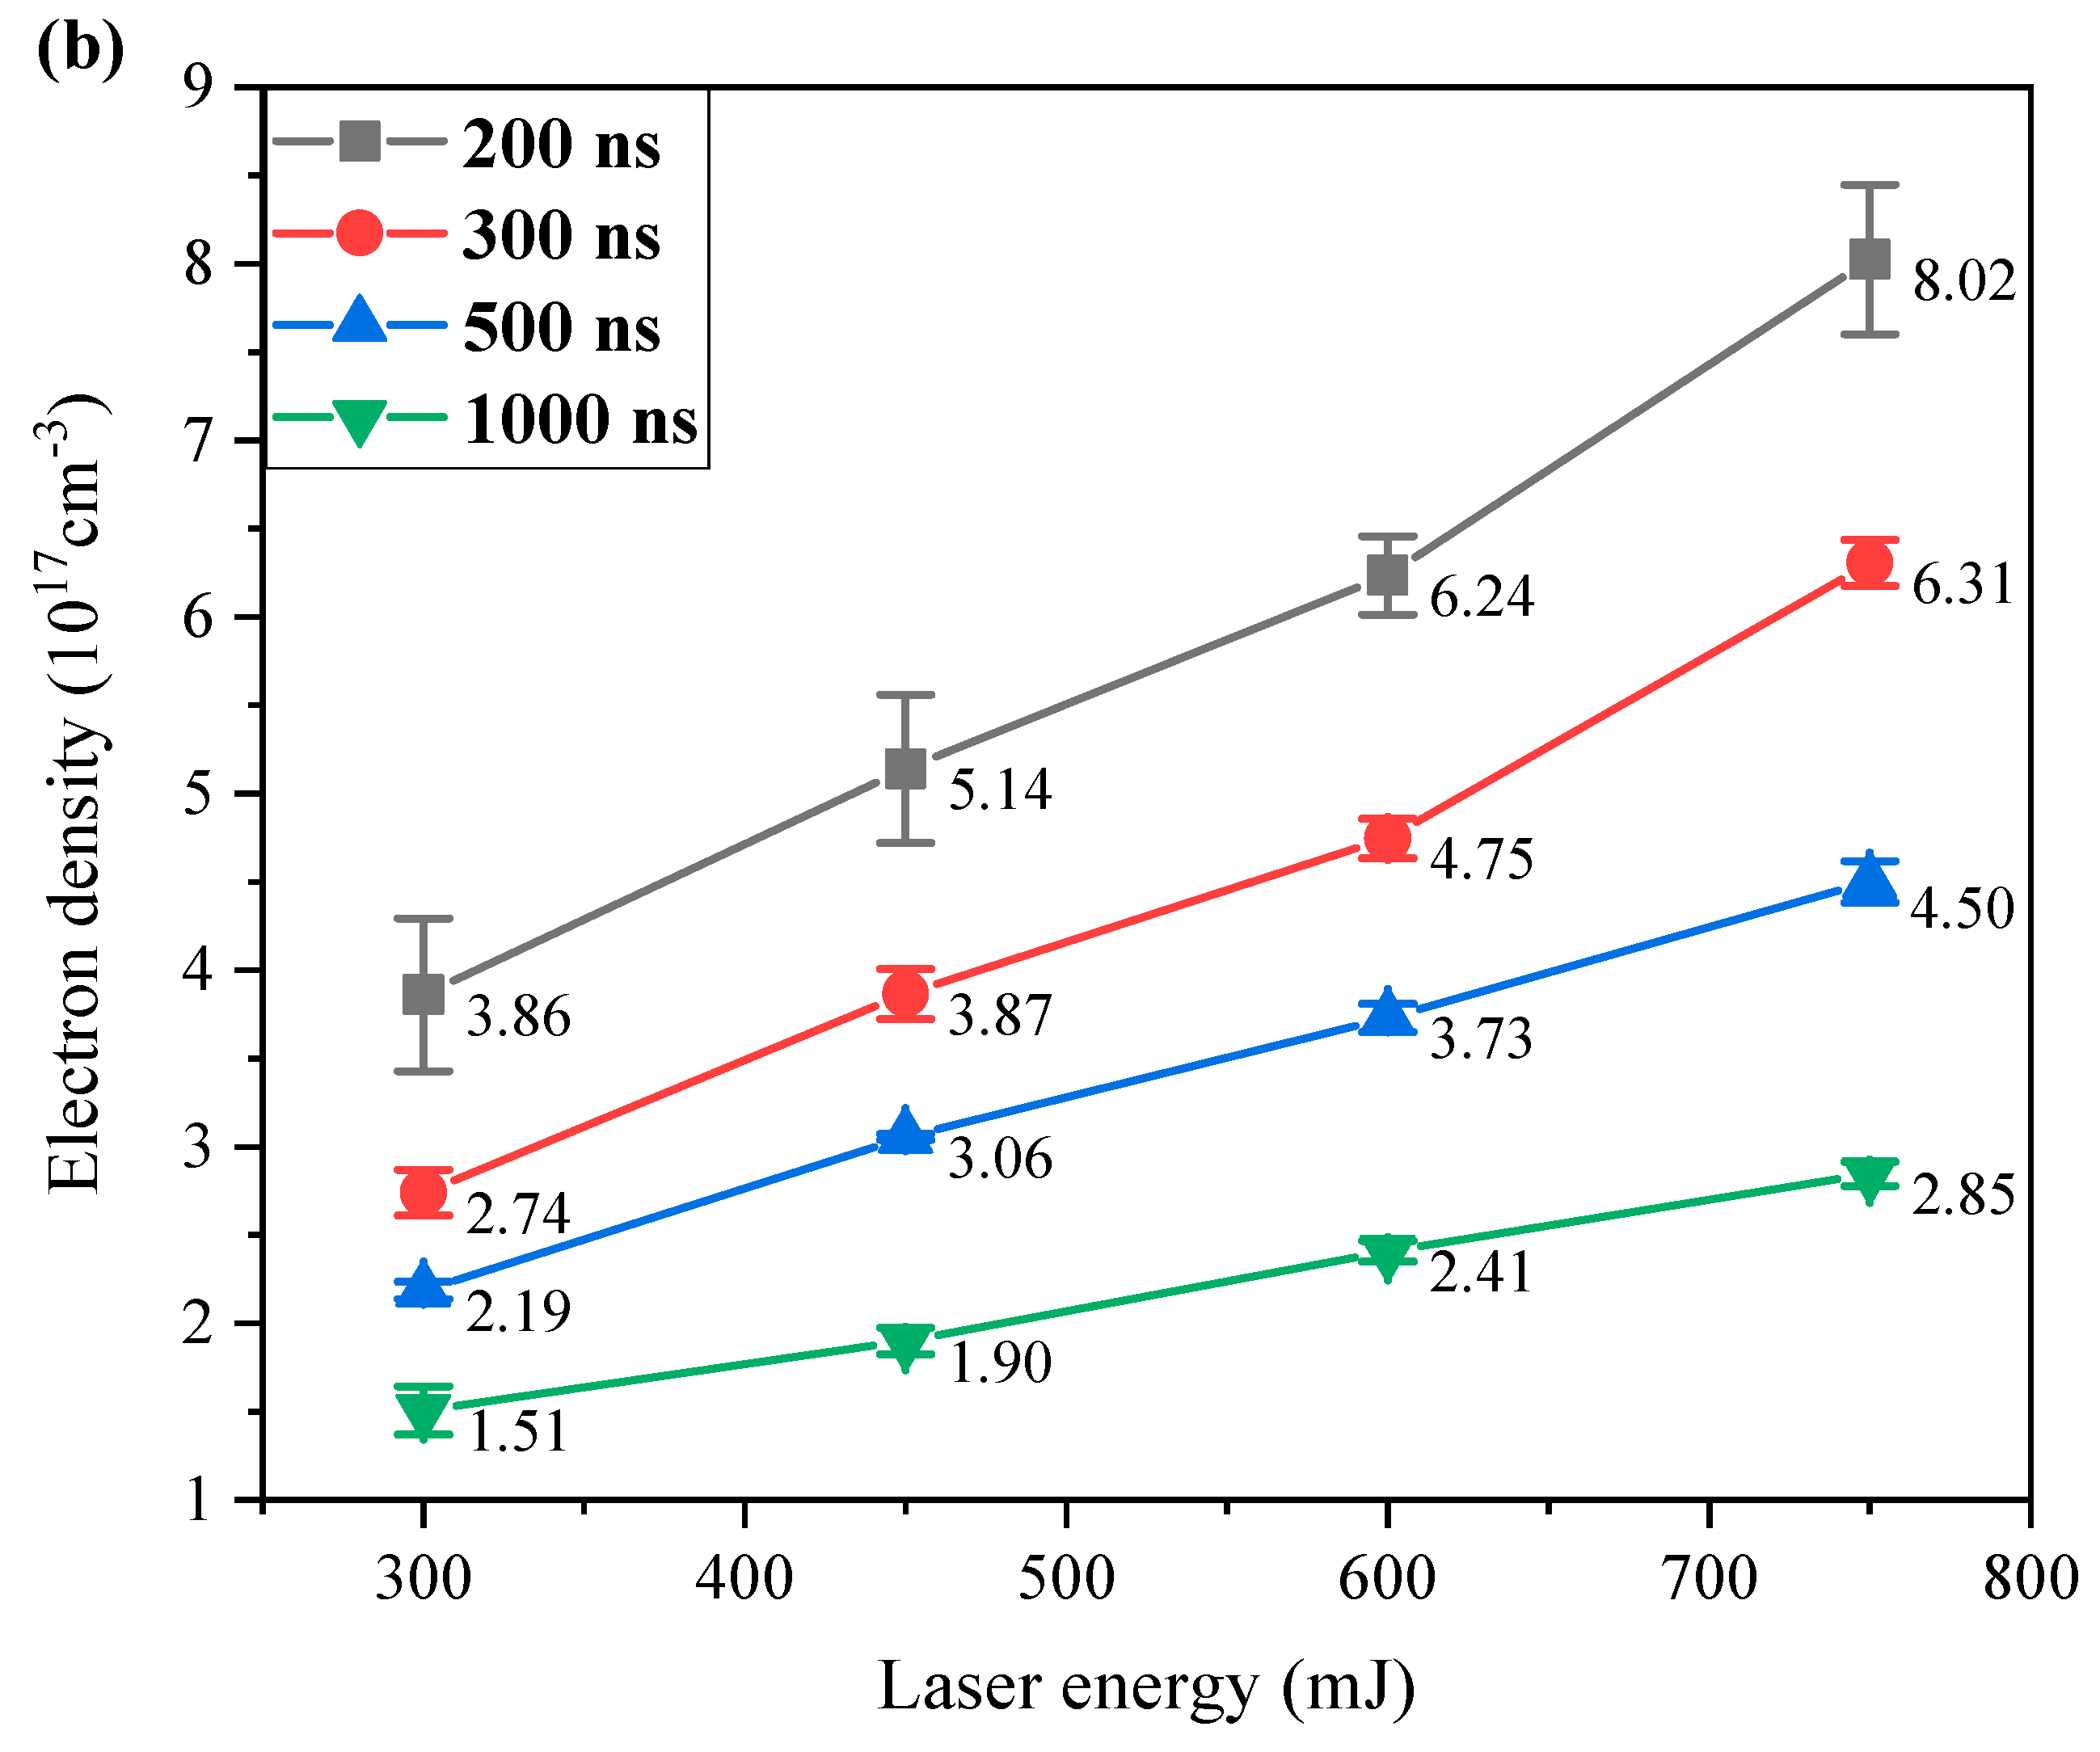
In order to investigate the influence of laser pulse energy on the parameters of laser–produced tin plasma, the time–resolved spectra of tin plasma was conducted at various laser pulse energies, including 300 mJ, 450 mJ, 600 mJ, and 750 mJ (corresponding to laser intensity of approximately 1.0 × 10¹² W/cm2, 1.5 × 10¹² W/cm2, 2.0 × 10¹² W/cm2, 2.5 × 10¹² W/cm2, respectively). The electron temperature and electron density of laser–produced tin plasma at different delay times were calculated using the Saha–Boltzmann plot and Stark broadening methods, respectively, as shown in Figure 8.
It can be observed that the electron temperature and electron density both increase with increasing laser pulse energy at the same delay time, and the laser–produced tin plasma parameters exhibit almost identical evolution trends under different laser pulse energies. This is primarily due to the gradual increase in the mass ablation rate with increasing laser pulse energy, which enhances the inverse bremsstrahlung process during the interaction between laser and target. This process injects more energy into the laser–produced tin plasma, leading to an increase in internal energy and further excitation and ionization processes, ultimately resulting in a higher degree of ionization. Consequently, the laser–produced tin plasma parameters demonstrate an overall upward trend with increasing laser energy.

4. Summary

The emission spectrum of tin plasma produced by a Nd:YAG laser was measured using the spectrometer and ICCD within the delay time range of 0–1000 ns. For delay times less than 50 ns, the emission spectrum of laser–produced tin plasma was primarily dominated by continuum emission. As the tin plasma expands, the contributions from bremsstrahlung and radiative recombination weakened, resulting in a gradual decrease in the intensity of the continuum spectrum. Simultaneously, line spectra began to emerge and gradually dominated the emission spectrum. By utilizing the Saha–Boltzmann plot and Stark broadening methods, one neutral atom Sn I line and six singly ionized Sn II lines in the emission spectrum were calculated and analyzed. With the laser pulse energy of 300 mJ, the electron temperature of laser–produced tin plasma decreased from 7.93 eV to 1.51 eV, while the electron density decreased from 3.86 × 1017 cm−3 to 1.51 × 1017 cm−3 within the delay time range of 200–1000 ns, both exhibiting a sharp decline followed by a gradual decrease. In addition, the time–resolved spectra of tin plasma was measured at different laser pulse energies, revealing that the tin plasma parameters gradually increased accompanying the rise in laser pulse energy, and the trends of the laser–produced tin plasma parameters evolution curves were nearly identical regardless of the laser pulse energy. Furthermore, this experimental study establishes a foundation for further investigation into the influence of laser parameters, such as wavelength, pulse width, and frequency, on laser–produced tin plasma characteristics, providing essential experimental guidance for further theoretical mechanism research.

Author Contributions

Conceptualization, F.C.; methodology, Y.C., C.Z. and X.L.; validation, C.Z. and R.Z.; formal analysis, Y.C.; investigation, Y.C. and Y.G.; resources, J.G. and Q.P.; data curation, Y.C. and C.Z.; writing—original draft preparation, Y.C.; writing—review and editing, Q.P., C.Z. and R.Z.; visualization, Y.C.; supervision, F.C., J.G. and Q.P.; project administration, F.C. and J.G.; funding acquisition, F.C. All authors have read and agreed to the published version of the manuscript.

Funding

This study has been supported by National Natural Science Foundation of China (Grant No. 62335016, Grant No. 12305222), State Key Laboratory of Laser Interaction with Matter Project (Grant No. SKLLIM2203), Natural Science Foundation of Jilin (20220101207JC), and Youth Innovation Promotion Association of the Chinese Academy of Sciences (2021216).

Data Availability Statement

The data that support the findings of this study are available from the corresponding author upon reasonable request.

Conflicts of Interest

The authors declared no potential conflict of interest with respect to the research, authorship, and/or publication of this article.

References

  1. Chen, M.; Luo, J.; Li, F.Y.; Liu, F.; Sheng, Z.M.; Zhang, J. Tunable synchrotron-like radiation from centimeter scale plasma channels. Light Sci. Appl. 2016, 5, e16015. [Google Scholar] [CrossRef]
  2. Jiang, B.; Feng, C.; Li, C.; Bai, Z.; Wan, W.; Xiang, D.; Gu, Q.; Wang, K.; Zhang, Q.; Huang, D.; et al. A synchrotron-based kilowatt-level radiation source for EUV lithography. Sci. Rep. 2022, 12, 3325. [Google Scholar] [CrossRef]
  3. Kruecken, T. Discharge plasmas as EUV sources for future micro lithography. AIP Conf. Proc. Am. Inst. Phys. 2007, 926, 259–269. [Google Scholar]
  4. Allaria, E.; Appio, R.; Badano, L.; Barletta, W.A.; Bassanese, S.; Biedron, S.G.; Borga, A.; Busetto, E.; Castronovo, D.; Cinquegrana, P.; et al. Highly coherent and stable pulses from the FERMI seeded free-electron laser in the extreme ultraviolet. Nat. Photonics 2012, 6, 699–704. [Google Scholar] [CrossRef]
  5. Labat, M.; Cabadağ, J.C.; Ghaith, A.; Irman, A.; Berlioux, A.; Berteaud, P.; Blache, F.; Bock, S.; Bouvet, F.; Briquez, F.; et al. Seeded free-electron laser driven by a compact laser plasma accelerator. Nat. Photonics 2023, 17, 150–156. [Google Scholar] [CrossRef]
  6. Popmintchev, T.; Chen, M.C.; Popmintchev, D.; Arpin, P.; Brown, S.; Ališauskas, S.; Andriukaitis, G.; Balčiunas, T.; Mücke, O.D.; Pugzlys, A.; et al. Bright coherent ultrahigh harmonics in the keV X-ray regime from mid-infrared femtosecond lasers. Science 2012, 336, 1287–1291. [Google Scholar] [CrossRef] [PubMed]
  7. Tomita, K.; Pan, Y.; Sunahara, A.; Kouge, K.; Mizoguchi, H.; Nishihara, K. Observation of plasma inflows in laser-produced Sn plasma and their contribution to extreme-ultraviolet light output enhancement. Sci. Rep. 2023, 13, 1825. [Google Scholar] [CrossRef]
  8. Benschop, J.; Banine, V.; Lok, S.; Loopstra, E. Extreme ultraviolet lithography: Status and prospects. J. Vac. Sci. Technol. B Microelectron. Nanometer Struct. Process. Meas. Phenom. 2008, 26, 2204–2207. [Google Scholar] [CrossRef]
  9. Torretti, F.; Sheil, J.; Schupp, R.; Basko, M.M.; Bayraktar, M.; Meijer, R.A.; Witte, S.; Ubachs, W.; Hoekstra, R.; Versolato, O.O.; et al. Prominent radiative contributions from multiply-excited states in laser-produced tin plasma for nanolithography. Nat. Commun. 2020, 11, 2334. [Google Scholar] [CrossRef]
  10. Zong, N.; Hu, W.M.; Wang, Z.M.; Wang, X.J.; Zhang, S.J.; Bo, Y.; Peng, Q.J.; Xu, Z.Y. Research progress on laser-produced plasma light source for 13.5 nm extreme ultraviolet lithography. Chin. Opt. 2020, 13, 28–42. [Google Scholar] [CrossRef]
  11. Mizoguchi, H.; Nakarai, H.; Usami, Y.; Kakizaki, K.; Fujimoto, J.; Saitou, T. High-power LPP-EUV source for semiconductor HVM: Lithography and other applications. In International Conference on Extreme Ultraviolet Lithography; SPIE: Bellingham, WA, USA, 2022; Volume 12292, pp. 255–260. [Google Scholar]
  12. Umstadter, K.; Graham, M.; Purvis, M.; Schafgans, A.; Stewart, J.; Mayer, P.; Brown, D. EUV light source for high-NA and low-NA lithography. In Optical and EUV Nanolithography XXXVI; SPIE: Bellingham, WA, USA, 2023; Volume 12494, pp. 335–342. [Google Scholar]
  13. Zeng, A. The Development of Photolithographic Technology and Machines. SHS Web Conf. EDP Sci. 2023, 163, 03021. [Google Scholar] [CrossRef]
  14. Harilal, S.S.; Sizyuk, T.; Hassanein, A.; Campos, D.; Hough, P.; Sizyuk, V. The effect of excitation wavelength on dynamics of laser-produced tin plasma. J. Appl. Phys. 2011, 109, 063306. [Google Scholar] [CrossRef]
  15. Wu, T.; Wang, X.; Tang, J. Extreme Ultraviolet and Visible Emission Spectroscopic Characterization of CO2 Laser Produced Tin Plasma for Lithography. Acta Opt. Sin. 2012, 32, 292–297. [Google Scholar]
  16. Lan, H.; Wang, X.B.; Zuo, D.L. Spectral and ion emission features of laser-produced Sn and SnO2 plasmas. Chin. Phys. B 2016, 25, 035202. [Google Scholar] [CrossRef]
  17. Lan, H.; Wang, X.; Zuo, D. Time-resolved optical emission spectroscopy diagnosis of CO2 laser-produced SnO2 plasma. Plasma Sci. Technol. 2016, 18, 902. [Google Scholar] [CrossRef]
  18. Amin, N.; Shaikh, N.M.; Tao, Y.; Ueno, Y.; Tillack, M.S. Influence of transverse magnetic field on dynamics of Sn plasma produced by CO2 laser. Phys. B Condens. Matter 2021, 602, 412560. [Google Scholar] [CrossRef]
  19. Du, Y. Study on Radiation Characteristics and Spatio-Temporal Evolution of Laser-Produced Al-Sn Plasmas. Master’s Thesis, Northwest Normal University, Lanzhou, China, 2022. [Google Scholar]
  20. Kramida, A.; Ralchenko, Y.; Reader, J.; NIST ASD Team. Atomic Spectra Database: NIST Standard Reference Database. Available online: https://www.nist.gov/pml/atomic-spectradatabase (accessed on 15 August 2023).
  21. Harilal, S.S.; Phillips, M.C.; Froula, D.H.; Anoop, K.K.; Issac, R.C.; Beg, F.N. Optical diagnostics of laser-produced plasmas. Rev. Mod. Phys. 2022, 94, 035002. [Google Scholar] [CrossRef]
  22. Li, X.; Zhou, W.; Qian, H.; Li, K. Electron Temperature and Density of Soil Plasma Generated by Laser Ablation Fast Pulse Discharge Spectroscopy. Acta Opt. Sin. 2011, 31, 1130001. [Google Scholar]
  23. Moon, H.Y.; Smith, B.W.; Omenetto, N. Temporal behavior of line-to-continuum ratios and ion fractions as a means of assessing thermodynamic equilibrium in laser-induced breakdown spectroscopy. Chem. Phys. 2012, 398, 221–227. [Google Scholar] [CrossRef]
  24. Man, B.Y.; Dong, Q.L.; Liu, A.H.; Wei, X.Q.; Zhang, Q.G.; He, J.L.; Wang, X.T. Line-broadening analysis of plasma emission produced by laser ablation of metal Cu. J. Opt. A Pure Appl. Opt. 2003, 6, 17. [Google Scholar] [CrossRef]
  25. Griem, H.R.; Scott, F.R. Plasma spectroscopy. Am. J. Phys. 1965, 33, 864–865. [Google Scholar] [CrossRef]
  26. Griem, H.R. Spectral Line Broadening by Plasmas; Academic Press: New York, NY, USA, 1974. [Google Scholar]
  27. Djeniže, S.; Srećković, A.; Labat, J. Stark width and shift of singly-ionized tin spectral lines. Z. Phys. D At. Mol. Clust. 1990, 17, 85–86. [Google Scholar] [CrossRef]
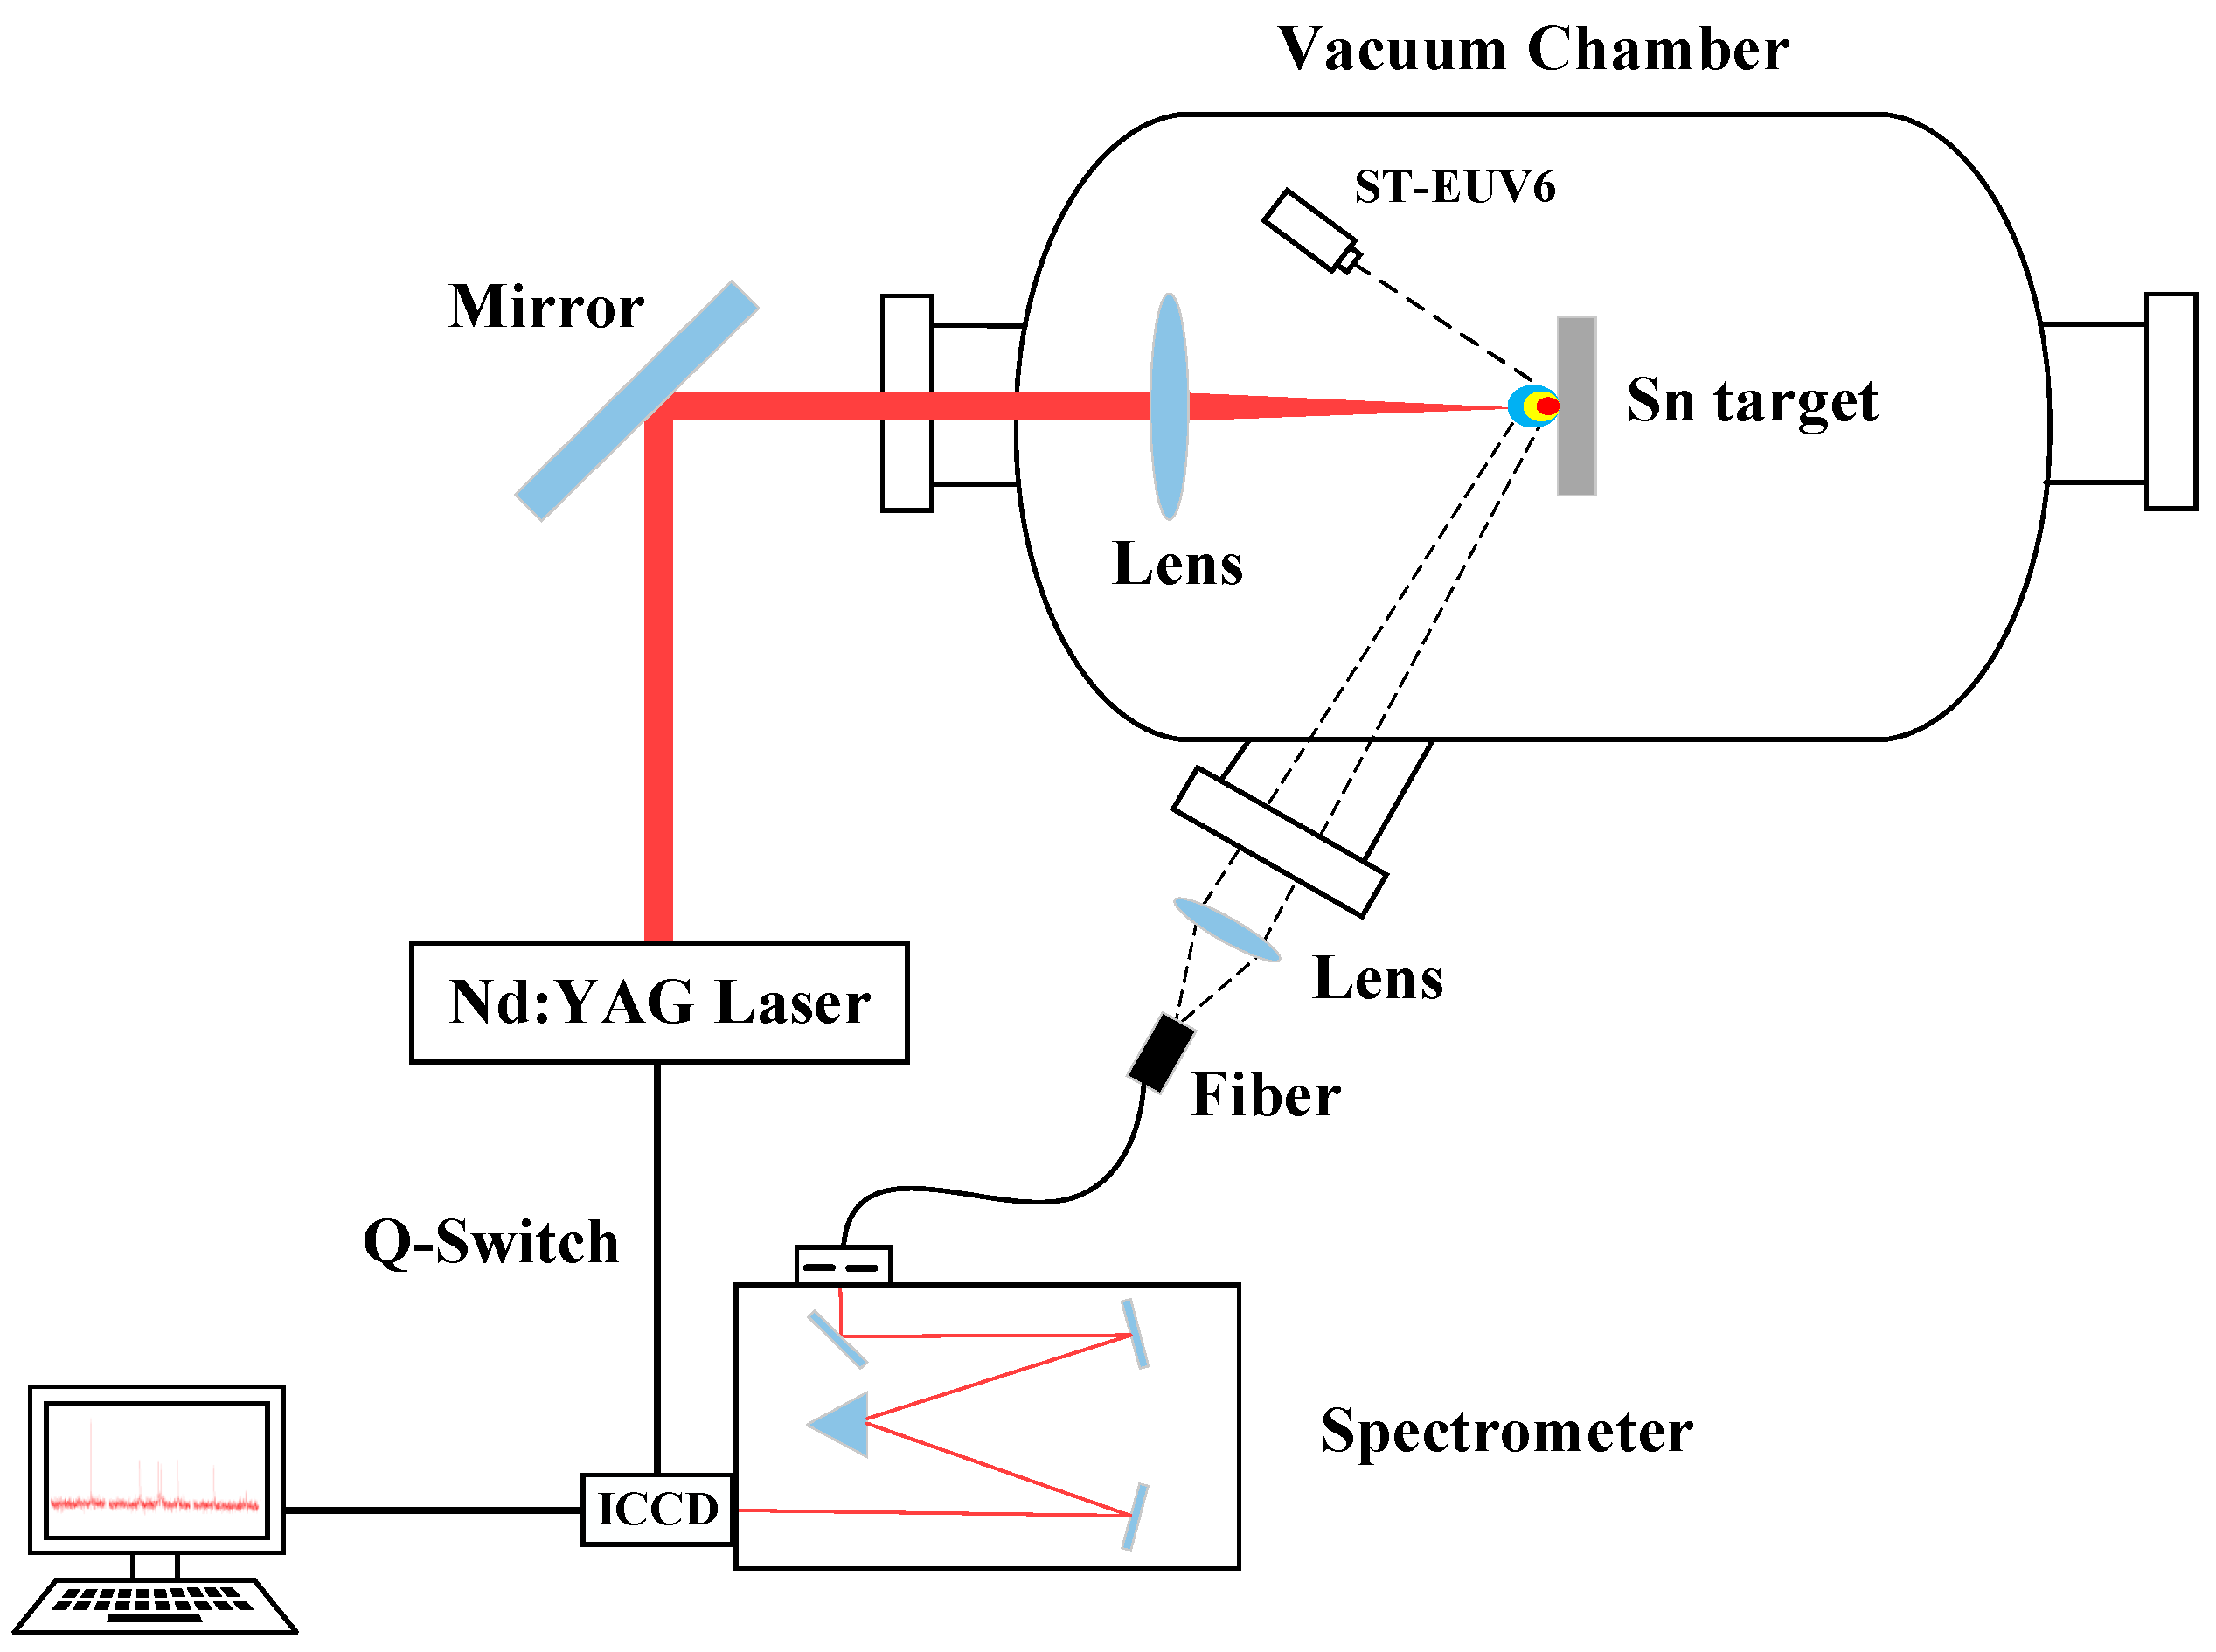
Figure 1. Diagram of time–resolved spectroscopic measurement setup.
Photonics 10 01339 g001
Figure 2. (a) Time sequence control diagram; (b) time−resolved EUV radiation characteristics of laser−produced tin plasma.
Photonics 10 01339 g002
Figure 3. The response curves of ST–EUV6.
Photonics 10 01339 g003
Figure 4. Laser–produced tin plasma imaging.
Photonics 10 01339 g004
Figure 5. Emission spectrum of laser–produced tin plasma at different delay times: (a) 0–50 ns, (b) 50–100 ns, (c) 100–200 ns, (d) 200–300 ns, (e) 300–500 ns, and (f) 500–1000 ns.
Photonics 10 01339 g005
Figure 6. (a) Saha–Boltzmann plot; (b) electron temperature evolution curve of laser–produced tin plasma versus delay time.
Photonics 10 01339 g006
Figure 7. (a) Lorentzian fitting curve for Sn II line at 580.00 nm; (b) electron density evolution curve of laser–produced tin plasma versus delay time.
Photonics 10 01339 g007
Figure 8. The temporal evolution of (a) electron temperature and (b) electron density with varying laser pulse energies.
Photonics 10 01339 g008aPhotonics 10 01339 g008b
Table 1. Parameters of Sn I and Sn II spectral lines.
SpeciesWavelength/nmgkAki/s−1Ei/eVEk/eV
Sn I452.607.8 × 1072.1284.867
Sn II533.384.0 × 1088.86411.189
Sn II556.356.78 × 1088.97411.202
Sn II559.044.7 × 1088.85311.071
Sn II580.056.2 × 1088.93311.070
Sn II645.532.8 × 1087.0538.974
Sn II684.611.2 × 1087.0538.864
Table 2. Measurement parameters for spectral line emission.
SpeciesWavelength/nmI
Sn I452.0915
Sn II533.2460
Sn II556.3288
Sn II559.0975
Sn II580.0076
Sn II645.4078
Sn II684.5224
Disclaimer/Publisher’s Note: The statements, opinions and data contained in all publications are solely those of the individual author(s) and contributor(s) and not of MDPI and/or the editor(s). MDPI and/or the editor(s) disclaim responsibility for any injury to people or property resulting from any ideas, methods, instructions or products referred to in the content.