Abstract
This article proposes a measurement method using a multi-dimensional LED detection array, which can be used to obtain the flight parameters (i.e., impact coordinates, flight velocity, and incident angle) of a small flying object. Firstly, the composition of the proposed system and its detection principle are described in detail. Then, a calculation model is derived according to the geometrical relationship between the different LED detection arrays, which can calculate the above flight parameters. Furthermore, numerical simulations are performed to analyze the change trend in the measurement error of the proposed system, and it can be verified that its measurement performance meets the related requirements in theory. Finally, we use the proposed system and a high-speed camera system to carry out comparison experiments with two different reference velocities of 900 m/s and 700 m/s, and the results show that the maximum deviation in the measured absolute velocity is always less than 1 m/s and that the maximum deviations of the measured coordinates of x and y are not more than 2 mm within the effective measurement range. Therefore, the proposed measurement method is feasible and effective, and it can also meet the requirements of the measurement system.
1. Introduction
Generally, investigations into protective materials often focus on how to reasonably and scientifically estimate the damage after impact of a small flying object (e.g., fragmentation, meteorite, hail, projectile, etc.) with a high velocity [1,2]. Accurately obtaining key parameters such as the hit position, flight speed, and attitude angle can provide some important references for improving the protective performance of the material [3]. Obviously, a non-contact measurement method should be used to obtain the above-mentioned key parameters. Otherwise, it will lead to serious deviations in these key parameters, thus affecting the accuracy and objectivity of the evaluation of the damage effect [4,5]. If a small flying object hits the surface of a target perpendicularly, this will cause the maximum damage to the protective material layer of the attacked target. Obviously, this can provide some scientific reference to improve the performance of the protective material. Generally speaking, the trajectory of small flying objects cannot be completely perpendicular to the protected target surface due to some disturbance factors. Typically, protected objects are often larger in volume, such as protective shelters, aircraft skins, windshields, and shellproof armor. This requires the ability to effectively, accurately, and reliably measure the above key parameters within a large area (e.g., 5 m × 5 m or even larger). Therefore, this presents a greater challenge to existing relevant measurement methods.
So far, many investigations have been carried out in this field. A measurement system based on LED array detection can simultaneously measure the impact coordinates, flight velocity, and incident angle of a high-velocity object. Its detection area is mainly generated by the LED array and the photodetector array, and thus the size of the detection area can be determined by adjusting the number of LEDs and detectors. In this measurement system, multiple detection areas are formed according to a certain structural relationship. When a small flying object passes through these detection areas, it blocks part of the light in the detection areas. Accordingly, this leads to a reduction in the light received by some photoelectric detectors, and then they output several signals correspondingly. Through a time-domain analysis, the time at which the projectile arrives at these detection areas can be obtained from these signals. According to the measurement model, some related parameters, including the impact coordinates, flight velocity, and incident angle of the projectile, are calculated in combination with these time parameters [6,7]. However, it is difficult to build a detection area larger than 5 m × 5 m due to the high cost and its insufficient mechanical strength. Similar to the measurement model of the above system, a passive photoelectric measurement system with intersecting detection areas can also realize the above functions. Unlike the above measurement system, it uses the sky background as the light source instead of the LED array; moreover, its detection area can be effectively formed without a support frame [8,9]. This system has some advantages such as a high precision, high sensitivity, and low cost, but its detection performance is also easily affected by the environment. More importantly, it is difficult to expand the size of the detection area of systems based on passive detection theory. Additionally, there is also a high-speed photography system which can effectively measure the above parameters. This system generally uses multiple high-speed cameras to capture a series of images of a high-velocity flying object, and then it can measure the spatial position of the small flying object according to the related image parameters. It has several characteristics such as real scene recording, non-contact measurements, and a high measurement accuracy. Through the interpretation and calculation of these sequence images, the impact coordinates, flight velocity, and incident angle of the impact object are effectively obtained [10,11]. Moreover, an acoustic target system uses sensor arrays to obtain the shock wave signal generated during the flight of a small supersonic object in order to calculate the impact coordinates. A large test area (up to 20 m × 20 m) can be achieved by increasing the number of sensors and proper array placement. However, this means more inconvenience and costs, and its measurement model requires the flying object to be perpendicular to the target surface. Otherwise, significant theoretical errors will be introduced. It is also more affected by environmental factors, as the wind speed can change the path of the sound waves [12,13]. Therefore, it is necessary to develop a novel method to efficiently acquire these parameters over larger detection areas.
In this article, we propose a measurement method to obtain the flight parameters of a small flying object. Firstly, we develop a measurement system based on a multi-dimensional LED detection array and describe its composition and detection principle. Then, the measurement model of the system is derived according to the spatial structure relationship among six laser screens of the LED detection array. Furthermore, we analyze the systematic errors of velocity and impact coordinate measurements. Finally, comparison experiments were performed to show the validity and feasibility of the proposed measurement method.
2. Materials and Methods
In this research, we develop a measurement system with a six-screen detection array to obtain the three-dimensional velocity vector and the impact coordinates of a small flying object. The proposed system is mainly composed of a laser detection array, a signal-processing device, and a computer, as shown in Figure 1. In this system, the laser detection array consists of six detection units. The detection principle of a single detection unit is shown in Figure 2. When a small flying object passes through a detection area (also called a laser screen), a part of the reflected laser is received by a receiving device equipped with an optical lens, filter, slit diaphragm, photodiode, and signal-processing circuit. This causes the photocurrent of the photodiode to suddenly change. After the circuit processing, a trigger signal is generated [14,15]. Different wavelengths of lasers can distinguish adjacent LED detection arrays combined with narrow band filters [16]. In order to output the trigger signals in the effective detection area, this system must have sufficient sensitivity, which mainly depends on the laser power, the size of the flying object, and the height of the trajectory. Therefore, we can adjust the laser power and the amplification factor of the signal amplification circuit to ensure the detection performance of the flying object in the effective detection area.
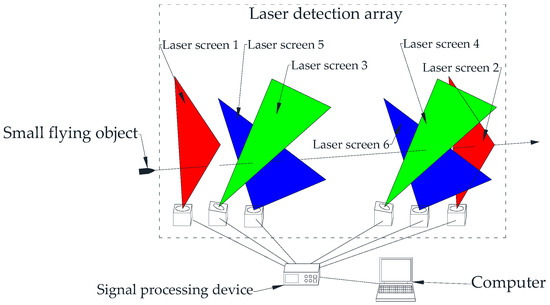
Figure 1.
Main components of the system.
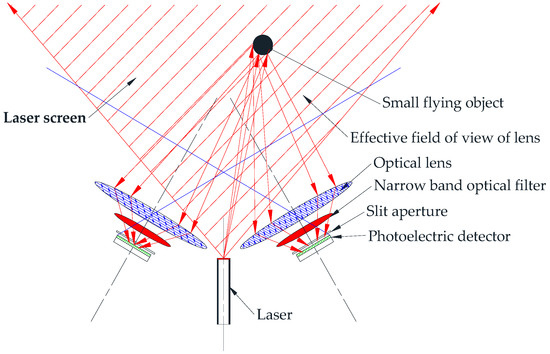
Figure 2.
Diagram of the detection principle of a single detector.
Similarly, when the small flying object passes through the six LED detection arrays, six trigger signals are correspondingly generated. There is a certain spatial geometry relationship of the six LED detection arrays. The arrival time series can be obtained by a time estimation algorithm [17,18], and it contains several time parameters when the measured target arrives at the detection areas in turn. Finally, the flight velocity and impact coordinates of the small flying object can be calculated using the measurement model with the structure parameter and arrival time series, and it will be described in the following text.
Make a series of assumptions as follows. LS1, LS2, LS3, LS4, LS5, and LS6 are six LED detection arrays, respectively, as shown in Figure 3. Note that LS1–LS2, LS3–LS4, and LS5–LS6 are three pairs of parallel LED detection arrays. In the measurement, the left-hand Cartesian coordinate system is established, and O is the origin of the coordinate system. The positive direction of the Y-axis is vertical upward, and the X-axis and Z-axis are in the horizontal plane. In this coordinate system, there is an invisible target plate which is parallel to the XOY plane. In addition, the laser output points of the six detection units are located on the Z-axis. LS1 and LS2 are placed vertically on the ground (LS1 in the XOY plane), and d12 is the distance between them. The angle between LS3 and LS1 is α, and that between LS5 and LS1 is β. In the Z-axis direction, the distance between LS3 and LS4 is d34. Similarly, the distance between LS5 and LS6 in the Z-axis direction is d56. According to the related general knowledge of the geometric principle, the distances between LS3 and LS4 should be calculated to be d34·cosα, and that between LS5 and LS6 should be d56·cosα. Based on some test conditions, the detection area (about 1.1 m2) of the laser screen is an isosceles triangle with a height of 2 m and an effective viewing angle of 30°. In addition, d12, d34, and d56 are set to 3 m, 2.4 m, and 2.4 m, respectively. The distances from the output point of laser 3 and laser 5 to O are d13 and d15, which are 0.2 m and 0.4 m, respectively.
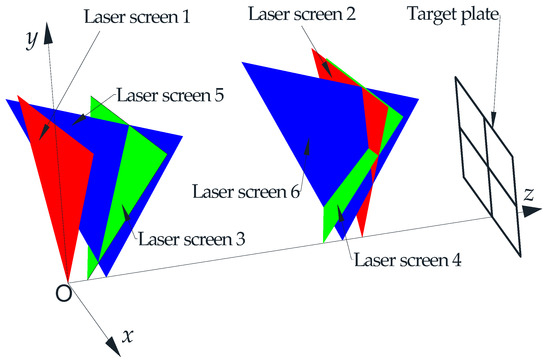
Figure 3.
Diagram of coordinate system and six laser screen positions.
After assembling the measurement system, its structure parameters can be known. Accordingly, the plane equations of the six LED detection arrays can also be obtained. The unit normal vectors of LS1, LS3, and LS5 (LS2, LS4, and LS6) are as follows, respectively,
and
Additionally, the velocity vector of the measured object can be expressed as
where vx, vy, and vz are the value of each component of the velocity vector, respectively; θ and γ are the pitch and azimuth of the measured flying object, respectively; in addition, i, j, and k are the unit vectors in the positive direction of the X-, Y-, and Z-axes, respectively.
The arrival time series T, which is [t1 t2 t3 t4 t5 t6], contains the six time parameters when the measured object arrives at LS1, LS2, LS3, LS4, LS5, and LS6, respectively.
Therefore, we can obtain the following equations as follows.
and
where d12(S) is the distance between LS1 and LS2, d34(S) is the distance between LS3 and LS4, and d56(S) is the distance between LS5 and LS6.
Substituting (1) to (3) into (5) to (7) and transforming the result into a matrix form, we can obtain the velocity vector, which is as follows.
with
Furthermore, the relationship between the velocity vector and the target position vector is as follows.
In (10), r is written as
where (x0, y0, z0) are the coordinates of the measured object at the initial time.
If P1 (x1, y1, z1), P3 (x3, y3, z3), and P5 (x5, y5, z5) are the intersection points of the trajectory and LS1, LS3, and LS5, respectively, then the position vectors of the three points are
By eliminating (x0, y0, z0), we can obtain the following equations, which are
and
In (13) and (14), t13 is the deviation between t1 and t3, and t15 is the deviation between t1 and t5.
Let the plane equations of the LED detection array LS1, LS2, ... , LS6 be
The coefficients of the plane equation can be obtained if the structural parameters of the system are known. By substituting P1 (x1, y1, z1) into the equation of LS1, the following equation can be obtained as follows.
Substitute P3 (x3, y3, z3) and P5 (x5, y5, z5) represented by P1 into the plane equation of LS3 and LS5, as shown below.
and
Equation (19) can be obtained by combining (16) to (18), and it is
In addition, Equation (19) is written in the matrix form as follows.
By solving (x1, y1, z1), the position vector can be obtained, and thus the target position coordinates at any given time can be solved as follows.
The distance between the target plate and the XOY plane is set to DT. Furthermore, the time parameter when the small flying object hits the target plane is set to tT. Thus, the impact coordinates (xt, yt, zt) of the measured object on the target plate can be expressed as
with
t1T = tT − t1
3. Results
3.1. System Error
3.1.1. System Error of the Velocity Measurement
To analyze the system error, we use projectiles instead of small high-velocity flying objects for numerical simulations, since projectiles can reach centimeter-scale caliber. We mainly use two kinds of projectiles with a reference velocity of 900 m/s and 700 m/s for 5.8 mm and 7.62 mm standard rifles, respectively. In addition, the firing pitch range is from 0° to −30°, and the horizontal swing angle and vertical one do not exceed ±10° when firing continuously at the highest firing rate in the air.
Taking the unit normal vectors of LS1, LS3, and LS5 as (0, 0, 1), (0, −sin α, cos α), and (−sin β, 0, cos β), respectively, (8) can be written as
Compared with the velocity vector, its modulus is more important in practical testing. Combined with the composition of the velocity vector, the modulus of the velocity vector can be obtained as follows.
Therefore, the modulus is a function of the variables, including d12, d34, d56, t12, t34, t56, α, and β. According to the total differential equation, the measurement error in the term of the modulus can be given by
Through analyzing (24), we can obtain the following equations as below.
t12 = d12/vz
t56 = d56/(vz − vxtan β)
t34 = d34/(vz − vytan α)
For better analysis of the system error in the velocity measurement, we take (4), (27), (28a) and (28b) into (26). Assume that some parameters, including d12, d34, d56, α, β, and their errors (i.e., Δd12, Δd34, Δ d56, Δα, and Δβ), are known and constant; moreover, some measurement errors (i.e., Δt12, Δt34, and Δt56) of interval time (i.e., t12, t34, and t56) are also known and constant. The above measurement errors are listed in Table 1. In the analysis, we use projectiles with a reference velocity of 900 m/s. This can further simplify the analysis of the system error in the velocity measurement.

Table 1.
System parameter errors in the analysis of the measurement error of velocity.
Obviously, Δ|v|, which is the error of |v|, varies only with θ and γ. Typically, θ is from −40° to 10°, and γ is from −10° to 10°. Based on the above assumed condition, we use numerical simulation to analyze Δ|v|, and its changing trend is shown in Figure 4.
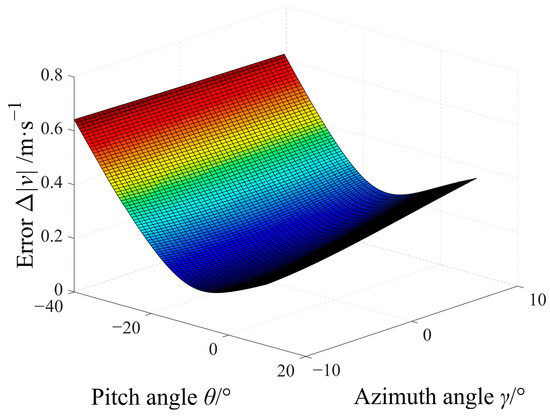
Figure 4.
Changing trend of Δ|v| along with θ and γ if using the projectile with a reference velocity of 900 m/s.
As can be seen in Figure 4, for the given range of θ and that of γ, Δ|v| does not exceed 0.65 m/s. When θ is changed from −40° to 10° and γ is invariant, the former changing trend of Δ|v| is decreased and then the latter is increased. When γ is −10°, Δ|v| is minimal at θ of −7°; moreover, when γ is 10°, Δ|v| is minimal at θ of −13°. When γ changes from −10° to 10°, the changing trend of Δ|v| is related to θ. When θ is from −40° to −20° and γ is from −10° to 10°, Δ|v| decreases slowly. When θ is from −20° to 10° and γ is from −10° to 10°, Δ|v| increases.
Using the projectile with the reference velocity of 700 m/s, another numerical simulation is also performed. Similarly, the changing trend of Δ|v| is shown in Figure 5. We can observe that Δ|v| is not more than 0.5 m/s, and the changing trend of Δ|v| with θ and γ is smoother than that of the first numerical simulation. In other words, Δ|v| becomes smaller in this case.
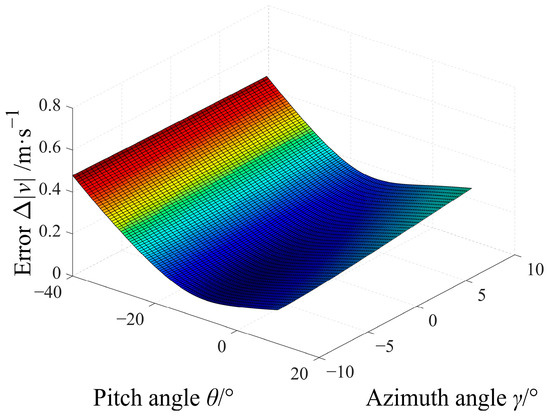
Figure 5.
Changing trend of Δ|v| along with θ and γ when using the projectile with a reference velocity of 700 m/s.
3.1.2. System Error of the Impact Coordinate Measurement
According to (22), the impact coordinates of (xT, yT) in the given target plane are
with
where x1 and y1 are the impact coordinates in LS1.
Obviously, xT is a function of d12, d56, t12, t56, t15, β, and DT, and yT is a function of d12, d34, t12, t34, t13, α, and DT. Considering the above factors, we can obtain the following two equations related to the error of xT and that of yT.
and
To analyze the change trend of the errors with pitch and azimuth, the following equations can be obtained by inversely solving t13 and t15, which are, respectively,
and
where t12, t34, and t56 have been solved in the previous section.
The given target plane is set to 1m behind LS2, that is, DT = 4 m, and the system parameter error settings of each parameter are shown in Table 2.

Table 2.
System parameter errors in the analysis of the measurement error of the impact coordinate.
It is assumed that |v|, xT, and yT are 900 m/s, 0 m, and 1 m, respectively; moreover, θ is from −40° to 10° and γ is from −40° to 10°. Through numerical simulation, the change trends of ΔxT and ΔyT with θ and γ are as shown in Figure 6 and Figure 7.
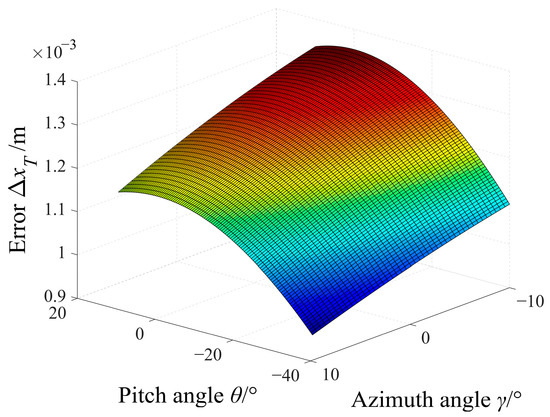
Figure 6.
Changing trend of ΔxT along with θ and γ when using the projectile with a reference velocity of 900 m/s.
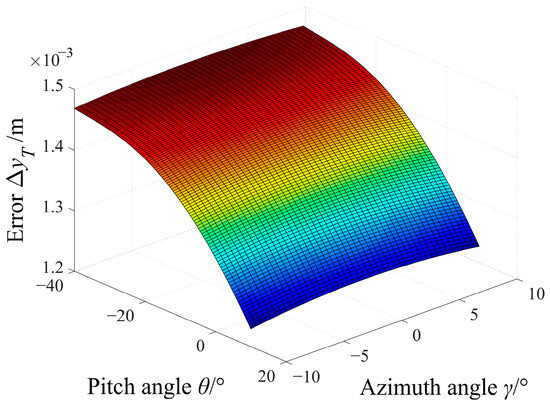
Figure 7.
Changing trend of ΔyT along with θ and γ when using the projectile with a reference velocity of 900 m/s.
As can be seen from Figure 6 and Figure 7, the maximum error of the impact coordinate xT is not more than 1.4 mm when θ and γ are in the range of −40° to 10° and −10° to 10°, respectively. When θ is from −40° to 10° and γ is invariant, ΔxT first increases and then decreases and has a maximum at about 0° of θ. In addition, when θ is invariant and γ is from −10° to 10°, ΔxT gradually decreases. As shown in Figure 7, the maximum error of yT is less than 1.5 mm, and when θ is from −40° to 10° and γ is fixed, ΔyT decreases gradually. In addition, when θ is constant and γ is from −10° to 10°, ΔyT first increases and then decreases, and the overall change in the error value is very small.
When |v| is set to 700 m/s, the change trend of ΔxT and ΔyT with θ and γ can be obtained, as shown in Figure 8 and Figure 9.
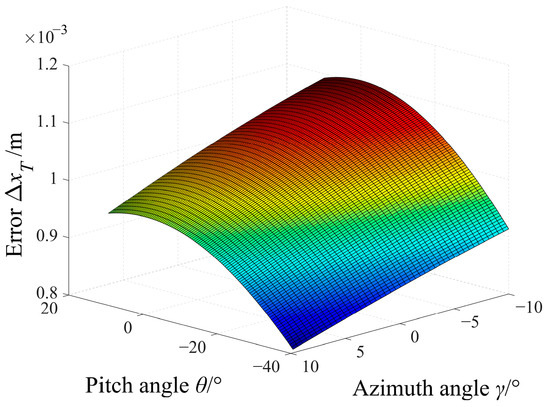
Figure 8.
Changing trend of ΔxT along with θ and γ when using the projectile with a reference velocity of 700 m/s.
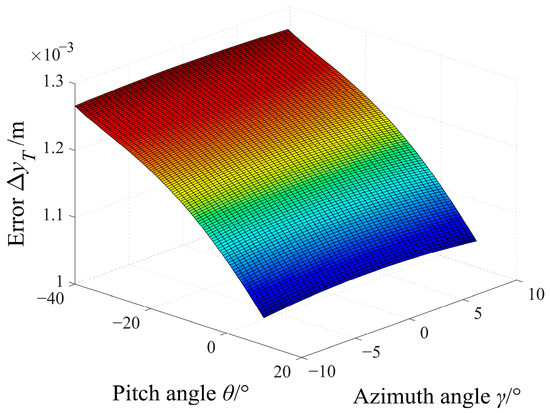
Figure 9.
Changing trend of ΔyT along with θ and γ when using the projectile with a reference velocity of 700 m/s.
It can be seen from Figure 8 and Figure 9 that θ and γ are respectively in the range of −40° to 10° and −10° to 10° when |v| is set to 700 m/s. In addition, the maximum xT error does not exceed 1.2 mm and the maximum yT error does not exceed 1.3 mm. Moreover, the variation trends of ΔxT and ΔyT with θ and γ are the same as those in Figure 6 and Figure 7, but the errors are smaller.
Above are the simulation results for the center position of the target plane. Through simulating other locations (randomly generated with a Gaussian distribution around the target center) within the range of projectile dispersion in the target plane, it is found that the error distribution is consistent with the simulation results of the center position. In addition, when |v| is set to 900 m/s, ΔxT and ΔyT are not greater than 1.5 mm and 1.7 mm, respectively. When |v| is set to 700 m/s, ΔxT and ΔyT are not greater than 1.3 mm and 1.5 mm, respectively.
3.2. Experiment
To compare the effect of the flight parameters (i.e., |v|, θ, and γ) on systematic error, we carried out a series of experiments on the shooting range. We developed an experimental setup, as shown in Figure 10. The given target position and coordinate system are the same as the above simulation. We use standard projectiles for our experiments, and their weight, powder charge, and shape are strictly controlled. In addition, a high-speed camera system was arranged to capture a large number of projectile images and then calculate their flight parameters. The high-speed camera system has been strictly calibrated in advance with high accuracy, so its measurement results can be considered as reference data. To verify the feasibility and validity of the method, the measurement data of the proposed system are compared with the reference data.
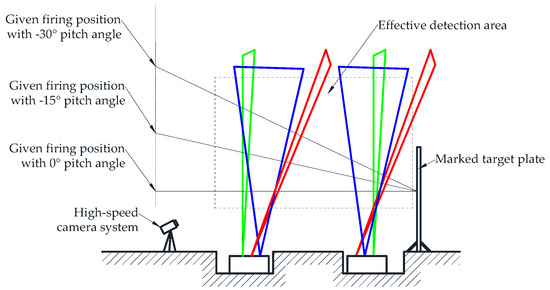
Figure 10.
Schematic diagram of experimental setup at the different pitches.
In the experiment, 50 standard projectiles are fired with a reference velocity of 900 m/s at different pitches (i.e., −30°, −15°, and 0°, respectively); however, the azimuth angle is constant and set to 0°. In the proposed system, the absolute velocity of |v| and impact coordinates (xT, yT) can be measured, and they are compared with the measurement data from the high-velocity camera system which is considered as reference data. Some results are shown in Table 3, Table 4 and Table 5.

Table 3.
Comparison of two sets of measurement data using the 50 projectiles with 900 m/s at the pitch angle of −30°.

Table 4.
Comparison of two sets of measurement data using the 50 projectiles with 900 m/s at the pitch angle of −15°.

Table 5.
Comparison of two sets of measurement data using the 50 projectiles with 900 m/s at the pitch angle of 0°.
Similarly, many projectiles with a reference velocity of 700 m/s were used in the following experiment, and the experimental results are presented in Table 6, Table 7 and Table 8.

Table 6.
Comparison of two sets of measurement data using the 50 projectiles with 700 m/s at the pitch angle of −30°.

Table 7.
Comparison of two sets of measurement data using the 50 projectiles with 700 m/s at the pitch angle of −15°.

Table 8.
Comparison of two sets of measurement data using the 50 projectiles with 700 m/s at the pitch angle of 0°.
4. Discussion
In Section 3.1, we performed the simulation of the impact points within the dispersion range in the target plate, and then it was observed that the errors of xT and yT are not greater than 1.5 mm and 1.7 mm, respectively, when |v| is set to 900 m/s. In addition, when |v| is set to 700 m/s, the error of xT and that of yT are not greater than 1.3 mm and 1.5 mm, respectively. According to the test requirements [19,20], the measurement method is feasible if the relative measurement error of |v| is less than 2‰ and the measurement errors of x and y are less than 3 mm, respectively [10]. The simulation results show that the system can theoretically achieve the measurement of |v| and impact coordinates of the small flying object at different pitches and meet the above test requirements.
As can be seen from Table 3, Table 4 and Table 5, in the three groups of shooting experiments at three pitch angles (i.e., −30°, −15°, and 0°), through using our proposed system and high-speed camera system, their maximum deviation of |v| is 0.66 m/s, their maximum deviation of xT is 1.8 mm, and their maximum deviation of yT is 1.9 mm. Additionally, Table 6, Table 7 and Table 8 show that the maximum deviation of |v| is 0.64 m/s through the proposed system and high-speed camera system, the maximum deviation of xT is 1.9 mm, and the maximum deviation of yT is 1.6 mm in the three groups of firing experiments using projectiles with a reference velocity of 700 m/s at different pitch angles (i.e., −30°, −15°, and 0°).
Similarly, we can also use the experimental setup to perform another investigation. In the experiment, 50 projectiles are fired with the reference velocity of 900 m/s (or 700 m/s) at different azimuth angles (i.e., −20°, 0°, and 20°), respectively; however, the pitch angle is constant and set to 0°. In the proposed system, the absolute velocity of |v| and the impact coordinates (xT, yT) can be measured, and they are compared with the measurement data from the high-speed camera system. To avoid an excessive length of our article, measurement data related to the investigation are not listed in Section 3.2. Thus, we give the related results directly as follows. The maximum value of |v| is not more than 0.42 m/s, and the maximum value of xT (or yT) is not more than 1.5 mm. Therefore, this indicates that the proposed measurement method is feasible, and its measurement accuracy is high enough.
5. Conclusions
In summary, the proposed measurement method using a multidimensional LED detection array can effectively obtain the key flight parameters of the projectile. Firstly, we introduced the main composition of the proposed system; in particular, the basic working principle of the laser screen detector. Then, we established a calculation model whose constant coefficients and independent variables are structural parameters (i.e., geometric relationship between different LED detection arrays) and arrival time series, respectively. Thus, its output value contains the velocity vector of the flight object and its impact coordinates in the given target plate. In addition, according to the calculation model, the change trends of measurement errors are analyzed by numerical simulation. Theoretically, the measurement accuracy is verified to meet the corresponding requirements [19,20]. Finally, the comparison experiments based on our proposed system and high-speed camera system are carried out synchronously. By adopting two different projectiles with the reference velocities of 900 m/s and 700 m/s, the experimental results show that the maximum deviation of the measured absolute velocity is always less than 1 m/s, and the maximum deviations of the measured X- and Y-coordinates are not more than 2 mm within the effective measurement range. Therefore, the proposed method is feasible and correct, and it also has the higher measurement performance.
In future research, we will focus on how to measure the flight parameters of multiple different high-velocity objects simultaneously and how to obtain larger target areas to achieve higher accuracy to meet the measurement requirements of different-caliber objects. This will provide important support for target protection testing and can also be used for space debris impact damage assessment testing on spacecraft.
Author Contributions
Conceptualization and methodology, T.D.; software, Z.Y.; validation, S.L. and D.C.; formal analysis, S.L.; investigation, T.D. and D.C.; data curation, Z.Y.; writing—original draft preparation, review and editing, D.C. and Z.Y.; supervision and project administration, T.D. All authors have read and agreed to the published version of the manuscript.
Funding
This research was funded by the Project Supported by Natural Science Basic Research Plan in Shaanxi Province of China, grant number 2022JM-399 and the Young Scientists Fund of the National Natural Science Foundation of China, grant number 61905187.
Institutional Review Board Statement
Not applicable.
Informed Consent Statement
Not applicable.
Data Availability Statement
Data are contained within the article.
Acknowledgments
We gratefully acknowledge important technical support from Jiuqi Yang, who is a doctoral candidate in Xi’an University of Technology.
Conflicts of Interest
The authors declare no conflict of interest.
References
- Han, H.; Zhao, L.; Zheng, S.; Cao, J.; Fu, Y. Space Debris Protection Design and Assessment for Thermal Control Radiator of Spacecraft. Spacecr. Eng. 2023, 32, 60–64. [Google Scholar] [CrossRef]
- Zhou, J.; Zhao, Z.; Shi, Y.; Wang, X.; Chen, X.; Shan, C. Hail Impact Responses and Residual Tensile Properties of CFRP T-joints. Chin. J. Aeronaut. 2023, 36, 430–443. [Google Scholar] [CrossRef]
- Ni, J.P. Technology and Application of Measurement of the Light Screen Array; National Defense Industry Press: Beijing, China, 2014; pp. 2–22. [Google Scholar]
- Li, J.; Luo, B.; Xu, M.; Song, W.; Bai, J.; Pei, X.; Yu, J.; Li, P. Research Progress of Aluminum Projectile Hypervelocity Impact Protection Structure. Chin. J. High Press. Phys. 2019, 33, 164–196. [Google Scholar] [CrossRef]
- Li, H.; Zhang, X. Flight Parameter Calculation Method of Multi-projectiles Using Temporal and Spatial Information Constraint. Def. Technol. 2023, 19, 63–75. [Google Scholar] [CrossRef]
- Chu, W.; Zhang, B.; Liu, B.; Gui, Z.; Zhao, D. An Optoelectronic Targeting System for Measuring the Distribution of Projectile Motion Based on the Subdivision of a Light Screen. Photonics 2019, 6, 126. [Google Scholar] [CrossRef]
- Tian, H.; Yuan, Y.; Ni, J. Testability of Six-Intersection Detection Area Measurement Method Based on Photoelectric Detection. Optik 2020, 216, 164963. [Google Scholar] [CrossRef]
- Li, H.; Zhang, X.; Zhang, X.; Lu, L. Model Optimization and Calculation Method of Multi-Target Curved Motion Parameters Measurement Using Multi-Screen Intersection Test Mechanism. IEEE Access 2020, 2020, 147872–147879. [Google Scholar] [CrossRef]
- Li, H.; Ni, J.; Yang, X.; Dong, Q. Test Influence of Screen Thickness on Double-n Six-Light-Screen Sky Screen Target. Open Phys. 2022, 20, 1–8. [Google Scholar] [CrossRef]
- Schyma, C.; Infanger, C.; Muller, R.; Bauer, K.; Brunig, J. The Deceleration of Bullets in Gelatine—A Study Based on High-velocity Video Analysis. Forensic. Sci. Int. 2019, 296, 85–90. [Google Scholar] [CrossRef] [PubMed]
- Park, Y.; Woo, H. A Prediction Method for Sabot-Trajectory of Projectile by Using High velocity Camera Data Analysis. J. Kimst. 2018, 21, 1–9. [Google Scholar] [CrossRef]
- Feng, B.; Shi, X. Studies of Acoustic Target with Two Equilateral Triangle Arrays. J. Appl. Acoust. 2012, 31, 140–144. [Google Scholar] [CrossRef]
- Lin, Y.; Di, C.; Di, C.; Gong, X.; Ji, H. Double Triangle Array Model of Bullet Oblique Penetration Based on Shockwave Propagation Path. Acta Armamentarii 2019, 40, 251–256. [Google Scholar] [CrossRef]
- Chu, W.; Zhao, D.; Liu, B.; Zhang, B.; Gui, Z. Research on Target Deviation Measurement of Projectile Based on Shadow Imaging Method in Laser Screen Velocity Measuring System. Sensors 2020, 20, 554. [Google Scholar] [CrossRef] [PubMed]
- Wu, Z.; Liu, L.; Zhang, X. Study on Large Area Laser Reflective Precision Target. Optik 2020, 224, 165730. [Google Scholar] [CrossRef]
- Dong, T.; Gao, F.; Chen, D.; Yang, J. Recognition method of the dual objective in a linear array CCD-based improved photoelectric measurement system using two lasers with different wavelengths. Optik 2020, 217, 164857. [Google Scholar] [CrossRef]
- Chen, D.; Ni, J. Pulse Compression-Based Improvement on the Estimation Accuracy of Time Interval between Two Trigger Signals in Light Screen Array. Optik 2018, 158, 675–683. [Google Scholar] [CrossRef]
- Tian, H.; Ni, J.; Jiao, M. Moment Acquisition of a Projectile Passing through a Trapezoidal Screen. Acta Photonica Sin. 2014, 43, 114–118. [Google Scholar] [CrossRef]
- GJB 3196.33a; Test Methods of Cartridge—Part 33: Measurement of Impact Velocity. Standards Press of China: Beijing, China, 2006; pp. 153–154.
- GJB 3995-2000; Precision Process Methods of Small Arms Firing Accuracy. Standards Press of China: Beijing, China, 2000; pp. 1–17.
Disclaimer/Publisher’s Note: The statements, opinions and data contained in all publications are solely those of the individual author(s) and contributor(s) and not of MDPI and/or the editor(s). MDPI and/or the editor(s) disclaim responsibility for any injury to people or property resulting from any ideas, methods, instructions or products referred to in the content. |
© 2023 by the authors. Licensee MDPI, Basel, Switzerland. This article is an open access article distributed under the terms and conditions of the Creative Commons Attribution (CC BY) license (https://creativecommons.org/licenses/by/4.0/).