Article

UNet-Based Framework for Predicting the Waveform of Laser Pulses of the Front-End System in a Current High-Power Laser Facility

Laser Fusion Research Center, China Academy of Engineering Physics, Mianyang 621900, China
*
Author to whom correspondence should be addressed.
Photonics 2023, 10(11), 1244; https://doi.org/10.3390/photonics10111244
Submission received: 26 September 2023 / Revised: 30 October 2023 / Accepted: 6 November 2023 / Published: 8 November 2023

Abstract

:
Performing data mining on large waveform datasets of a high-power laser facility is an important way to achieve precise regulation of a device. However, there are currently issues with missing values, noise, and inconsistency in this database of measuring pulse waveform in a current high-power laser facility. In this paper, a UNet of a series residual module is presented to predict the pulse waveform of a front-end chained system in a current high-power laser facility. The designed network is trained on grouped sequences formed by experimentally measuring pulse waveforms of a high-power laser facility. The strategies of relay output and relay loss are employed in training in order to enable the network to predict two kinds of pulse waveforms simultaneously. The trained network achieved an RMSE of 3.38% on the testing set of measuring pulse waveform at a frequency of 1 Hz, and an RMSE of 0.84% on the testing set of setting the voltage of the Arbitrary Waveform Generator (AWG). These results indicate that this method can accurately fill in paired missing values in the waveform database of a high-power laser facility. The main advantage of this method is that it can quickly couple operational parameters for prediction, and this method can be applied to predicting laser performance, cleaning one-dimensional sequences, and maintaining a waveform database.

1. Introduction

The precise regulation of each laser pulse of a high-power laser facility is an important factor affecting the successful implementation of inertial confinement fusion (ICF). Precise physical experiments place high demands on power balance, and pulse waveform is one of the most important indicators that determines power balance [1]. Due to the large size and complex system of the high-power laser facility, many environmental and operational parameters, including time of experiment, environmental temperature and humidity, terminal crystal temperature, in-service time of optical component, and so on, can affect the precise regulation of pulse waveform [2,3,4]. Mining the waveform database of a large-scale laser facility is one of the most important ways to further achieve precise regulation of pulse waveform.
Traditional methods mainly use principles of solid-state laser engineering to model and simulate laser systems for predicting laser performance. Lawrence Livermore National Laboratory (LLNL) has developed the Laser Performance Operation Model (LPOM) for 192 laser beam lines in the National Ignition Facility (NIF) [5,6,7]. LPOM predicts and analyzes laser performance during operation in order to better regulate it. And, based on this result, LPOM defines the shape parameters of laser pulse and the splitting proportion of each beam line within the beam group to meet the performance requirements of power balance for each beam line. The core of LPOM is a propagation model of laser beams rewritten based on Prop92 [8], which is a four-dimensional (x, y, z, t) beam simulation code. It uses fast Fourier-transform decomposition, the addition of Maxwell phase, field recombination method, and Talanov transform to handle many highly nonlinear processes. The overall performance of laser beams can be described by a series of transfer functions and inverse transfer functions, which are related to the pulse input and output of each part of the laser facility.
In recent years, with the rapid development of deep learning in the field of predicting system performance, deep models have shown better flexibility and speed than traditional techniques. Deep neural networks have been successfully applied in the analysis of pulse waveforms and system simulation in a large laser facility. In 2018, Humbird et al. utilized a dataset of multiple physical simulation to optimize the predictive performance of the Seq2seq model, building capacity to simulate complex systems and achieving a wide range of applications from simple one-dimensional diffusion calculations to implosion simulation [9]. In 2019, Spears et al. adopted transfer learning technology to adjust simulation models using sparse experimental data, reducing the deviation between simulation and experimental results, providing support for the cognitive expansion of physics and the establishment of predictive models [10]. In 2020, Anirudh et al. used neural networks to establish a one-dimensional semi analytical numerical surrogate model consistent with physical manifolds, generating physically meaningful predictions. Through multiple data patterns generated by different particles such as X-rays with different energy, time, and other conditions, the diagnostic image of ignition was predicted and reconstructed [11]. In 2021, the Laser Megajoule (LMJ) used deep learning to handle disturbances that exist in the actual measurement process, including modulation, noise, etc. By filtering out disturbance, a more satisfactory template of pulse waveform can be obtained [12]. In 2022, Lu Zou et al. used a data-driven model based on a convolutional neural network (CNN) to accurately predict the temporal shape of laser pulses of the main amplifier system. By introducing 16 parameters ignored in the model based on the F-N equation into the neural network model to expand the representation dimension, the prediction accuracy of the network model has been greatly improved [13]. In 2023, Jun Luo et al. proposed an artificial intelligence-assisted method to improve the efficiency of the traditional closed-loop control process. By training the U-Net model to predict the initial AWG pulse waveform in the closed-loop process, the closed-loop control process of pulse shaping is greatly accelerated [14].
Inspired by the application of deep learning in various major facilities, we perform data mining on large datasets of pulse waveform from a high-power laser facility in order to support the precise regulation. However, there are issues with missing values, noise, and inconsistency in the waveform database of the high-power laser facility currently, which affects the quality of mining results. A feasible approach is to supplement the measurement system from a hardware perspective and re-collect data. But, this method is time-consuming and laborious, and it is inevitable to encounter the problem of missing values caused by the hardware system. We hope to explore an economical and efficient way to fully utilize the data accumulated over the years, and to continuously fill in missing values caused by hardware system in the future.
The measurement system of laser pulses in the facility [15] is a chained system that takes the output of the previous system as the input of the subsequent system, as shown in Figure 1. Therefore, we have established a deep learning model based on the characteristics of the chained system. The trained model can predict missing pulse waveforms according to the data stored in the waveform database. Due to the high cost of conducting experiments, the number of samples stored in the database is limited. In recent years, fully convolutional networks with U-shaped architecture (UNet) [16,17] have been lauded for the efficient use of available samples. Inspired by the advantages of UNet, we propose a method for filling in missing values in the waveform database using a neural network of U-shaped architecture. We conducted end-to-end training on grouped waveform data of a large laser facility. The main advantage of this method is that the network can quickly couple operational parameters for prediction in order to quickly and accurately fill in the missing waveform data in real time.
The main contributions in this paper are listed as follows:
  • rUNet: We propose an innovative architecture of UNet of a series residual module to predict the temporal shape of laser pulses according to the chained features of the front-end laser system.
  • Missing values are filled in in the database of measuring pulse waveform in a current high-power laser facility from the perspective of analyzing and summarizing historical data of pulse waveform for the first time.
  • The strategy of relay output and relay loss is employed in training in order to enable the model to predict two kinds of pulse waveforms simultaneously.
The paper is outlined as follows. First, the current status of waveform data stored in the database and the structure of the model based on UNet of a series residual module are introduced. Then, the methodology used in building the model is explained in detail, including the overall architecture, the preparation of the training set, and the specifics of its implementation and training procedure. Finally, the robustness and adaptability of the model for filling in missing pulse waveforms are shown by using a testing set that the network has never seen before and comparing the prediction results of rUNet with the other method.

2. Current Status of Waveform Database and rUNet for Predicting Pulse Waveform

2.1. Current Status of Waveform Database of the Current High-Power Laser Facility

Over the past seven years, we have conducted thousands of important experiments on a current high-power laser facility and collected a large amount of data from each measurement location of laser pulses from each beam line. Table 1 shows part of the storage status of the experimental data link in the database of pulse waveform on 13 May 2022. The missing values in the database are mainly manifested as the paired missing of setting the voltage of AWG and measuring the pulse waveform at a frequency of 1 Hz. The reason for missing values is that in the early stage of construction, the construction of the front-end hardware system of the facility was not fully considered. Building a new hardware system to supplement data and re-collecting data are feasible to solve this problem, but this method still has three issues. First, it consumes time and money. Second, historical data lose value for data mining because of their inconsistency. Third, it is always inevitable that hardware failure results in missing values [18]. We hope to complete the data link in the waveform database through our work. Considering that missing values mainly appear in pairs at the front-end system, when establishing a model for completing the data link, the measurement waveforms of pre-amplifier modules are used as an input.

2.2. rUnet for Predicting Pulse Waveform of the Front-End Laser System

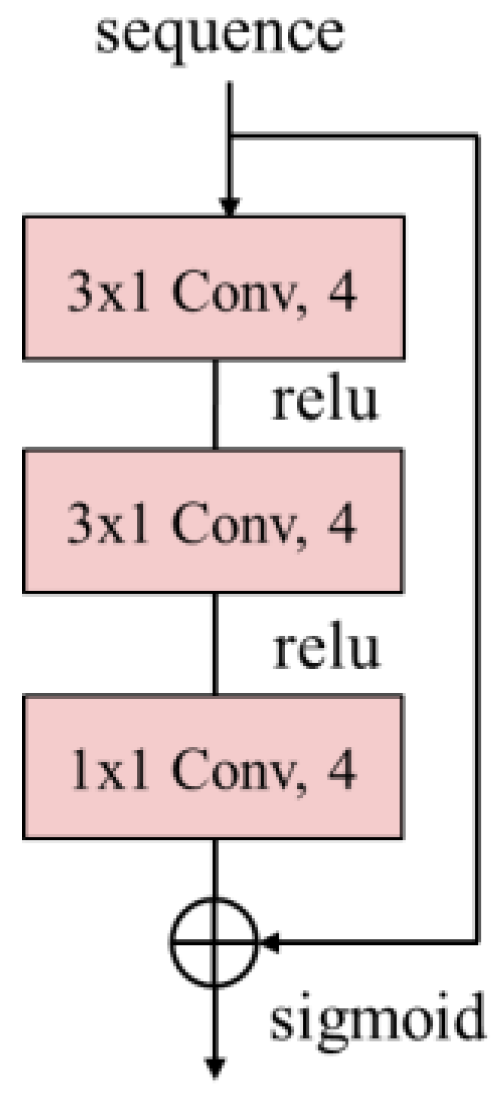
Convolutional layers have sufficient representation ability and filter sharing characteristics, making them the backbone of networks. A schematic diagram of our model for predicting pulse waveforms of a chained front-end laser system is shown in Figure 2. The network is mainly composed of a residual module [19] and a U-shaped module. The structure of the residual module is shown in Figure 3. Two modules are connected in series. The former residual module is the encoder, which performs automatic feature engineering on the input sequence, and then puts its output and other features together. The subsequent fully convolutional network serves as the learner. At the same time, UNet itself also has encoding functions. UNet is based on the encoder–decoder structure. It consists of a contraction path to capture context and a symmetric expanding path that supports precise localization. The network mainly consists of four major operations, convolution, up-convolution, max-pooling, and feature forwarding. Convolutional operations use receptive fields that detect specific attributes such as lines and edges. As the layers go deeper, more complex attributes can be detected. An up-convolution is a transposed matrix operation on positive convolution, which maps the detected attributes back into the sequence space. Inserted pooling layers between the successive convolutional layers reduce the amount of parameters and computational cost. The high-resolution features from the left contracting path are forwarded to the expanding path by combining with the up-sampled output. We adjust kernel size, the number of convolutional kernels, and other hyper-parameters of the network based on the original architecture to make it more suitable for our task.
The network input consists of the measuring pulse waveform of pre-amplifier modules and the number of the beam line. The residual module represents the laser system between the measurement position of 1 Hz and the measurement position of pre-amplifier modules, and it outputs the prediction of pulse waveform at a frequency of 1 Hz. The U-shaped module represents the laser system between AWG and the measurement position of 1 Hz, and outputs the prediction of setting the voltage of AWG. The entire process can be simplified by a formula as
x = f 1 1 ( f 2 1 ( y ; θ ) ) ,
where y denotes the measuring pulse waveform of pre-amplifier modules, θ denotes operating parameters such as the number of the beam line, f2 represents the laser system between the AWG and the measurement location of pulse waveform at a frequency of 1 Hz based on the U-shaped module, f1 represents the laser system between the measurement location of pulse waveform at a frequency of 1 Hz and of the pre-amplifier modules, based on convolutional layers and the residual module, and x represents the predicted setting voltage of AWG.

3. Methodology

3.1. Overall Architecture

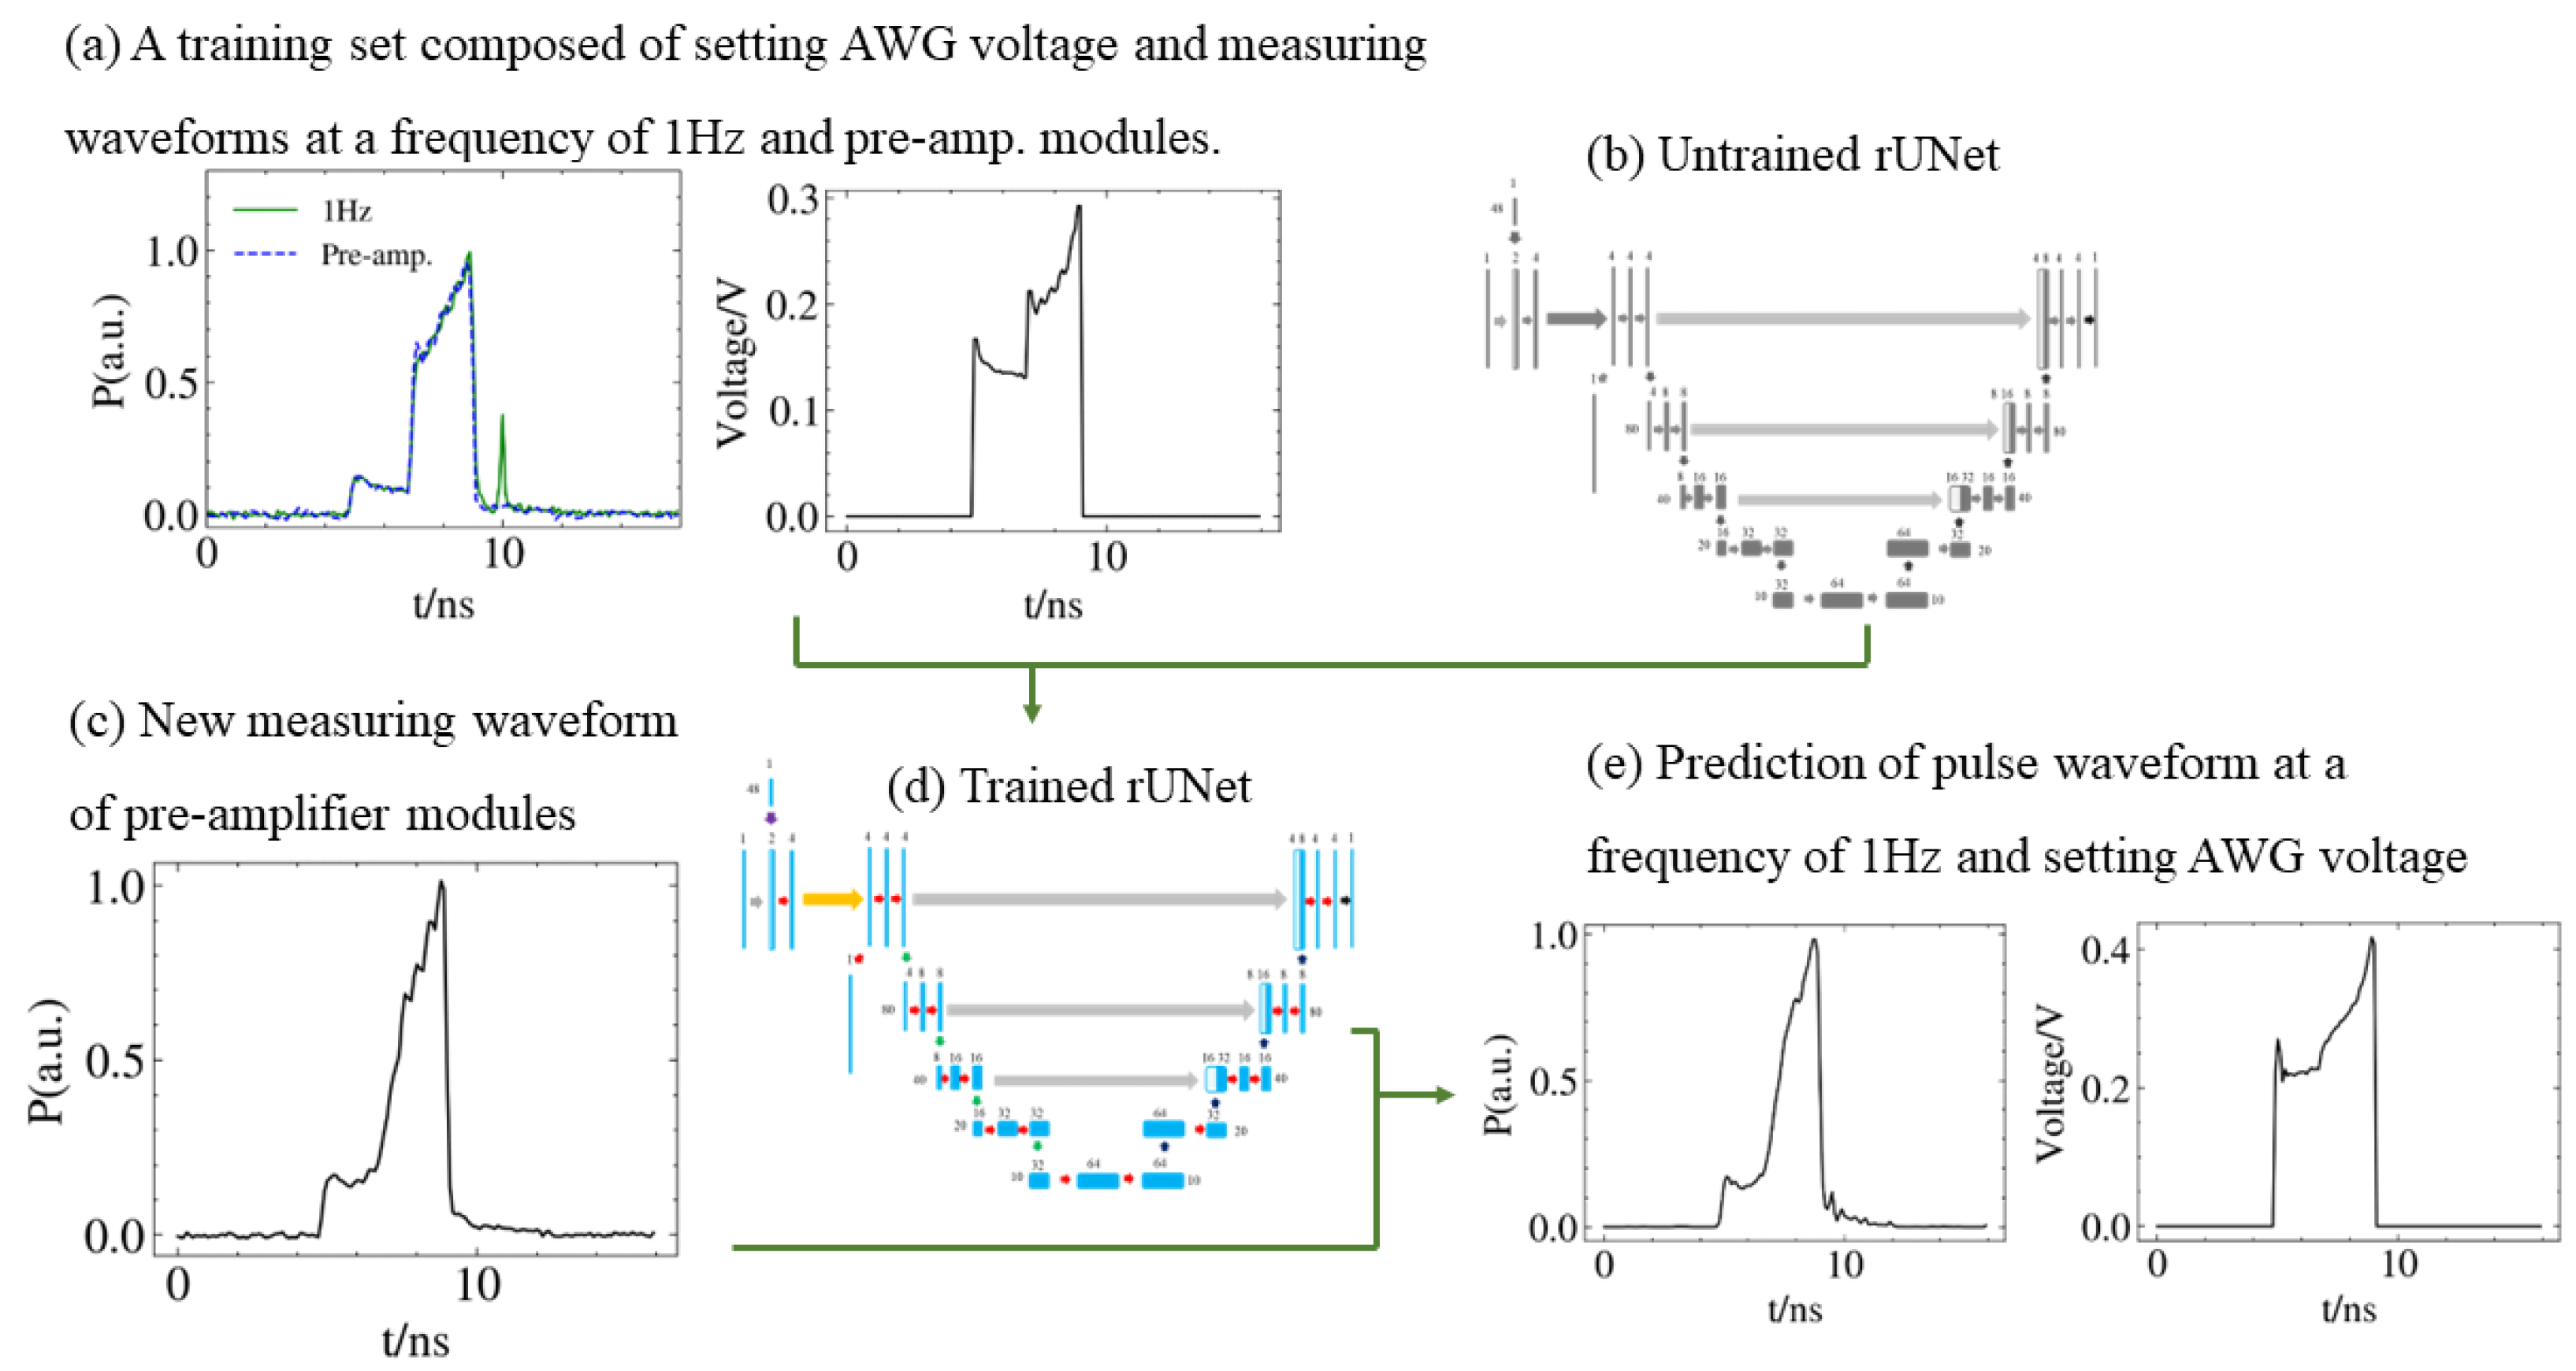
Figure 4 shows the overall architecture of our method to train the network for filling in paired missing values in the database of pulse waveform. Raw data of pulse waveform are taken from the monitoring system of a large laser facility. The training set consists of a pair of pre-amplified repeat AWG sequence data. Figure 4b shows the unfitted rUNet model with an untrained parameter. The structure of the model is shown in Section 2.2. We used the training set (Figure 4a) to train the model to learn the inverse calculation process of the pulse waveform from the pre-amplifier modules to the AWG. In order to test whether the model can make accurate predictions for the new measurement of pulse waveform of pre-amplifier modules, we used the trained rUNet (Figure 4d) to perform inverse calculations on new data. Therefore, the input of the trained rUNet is a new measurement pulse waveform of pre-amplifier modules and the corresponding number of the beam line. The output (Figure 4e) is the pulse waveform at a frequency of 1 Hz and the setting voltage of AWG predicted by the network.

3.2. Data Collection and Preprocessing

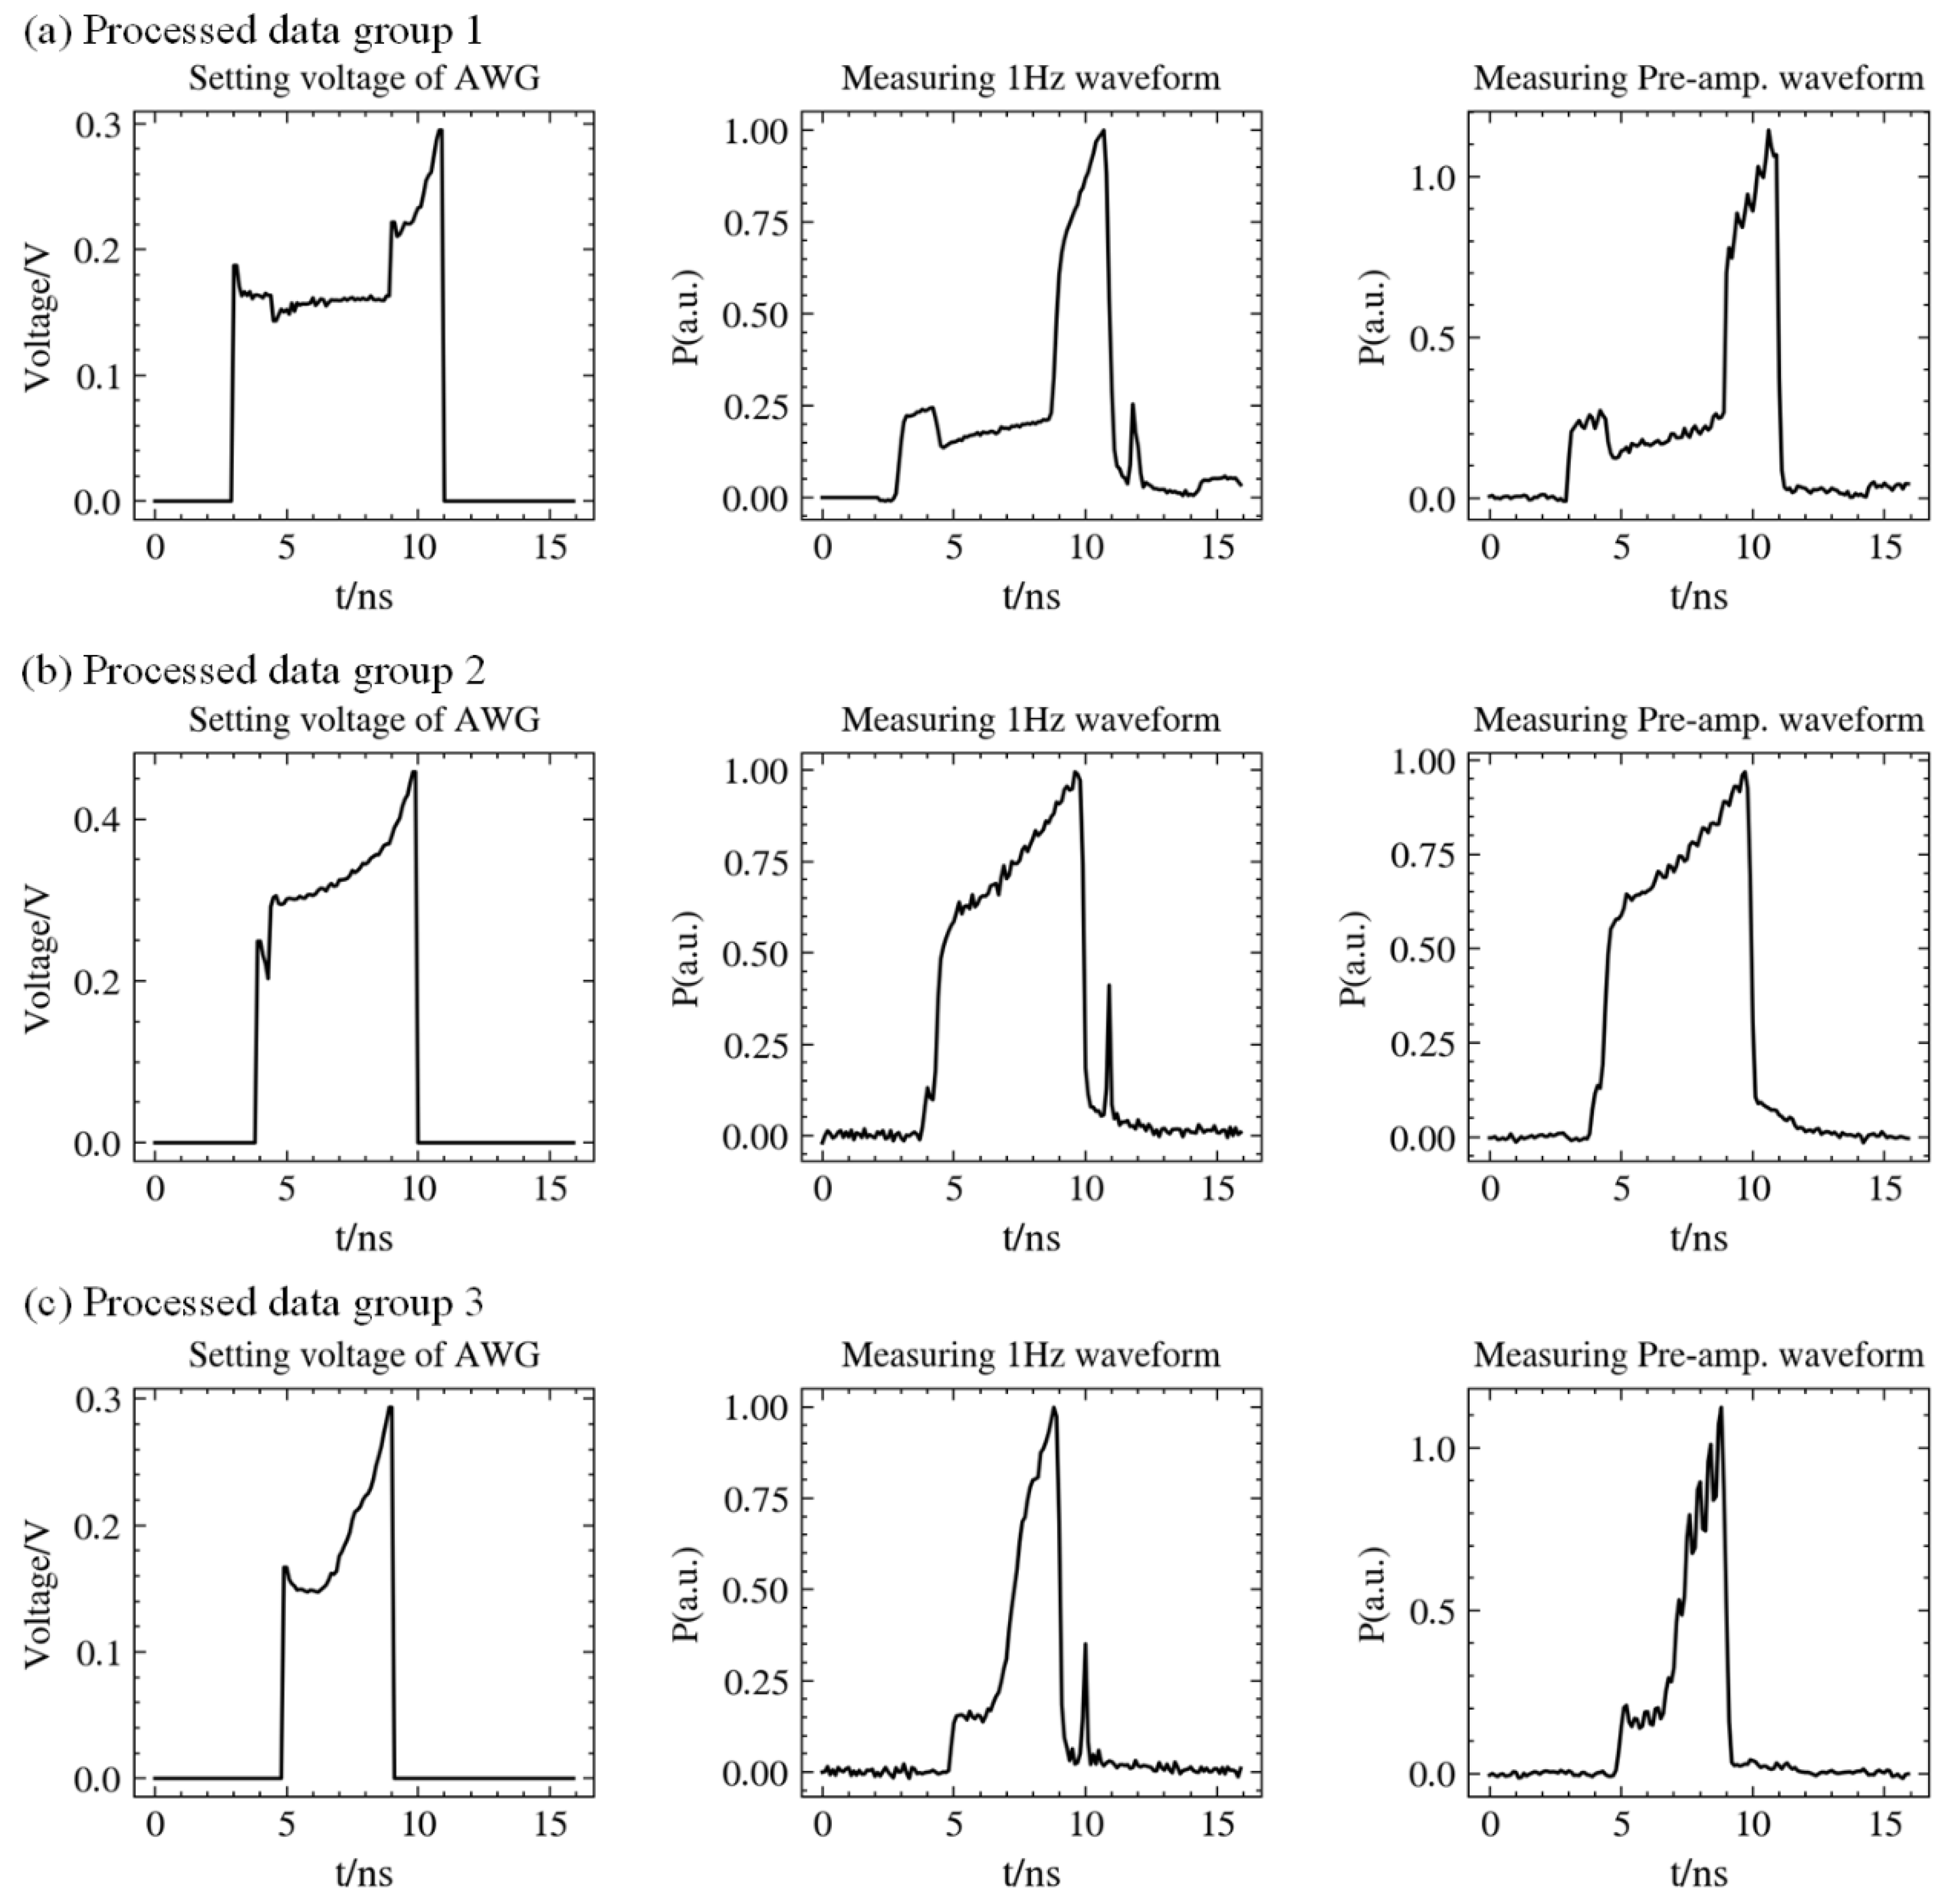
To train rUNet to predict front-end pulse waveforms from the measuring pulse waveform of pre-amplifier modules, we first prepared a dataset of training samples, which is made of groups of measured pulse waveforms of pre-amplifier modules with corresponding measured pulse waveforms at a frequency of 1 Hz and a setting voltage of AWG stored in a database. We collected the results of the waveform closed-loop of the front-end system in the past seven years for constructing our training dataset. The construction method of the dataset mainly consists of the following three steps. The first step is to clean the three kinds of waveforms and delete the abnormal data with low signal-to-noise ratio or incomplete pulse recording. The second step is to roughly align three kinds of pulse waveform according to the similarity of the waveform shape. The last step is carrying out fine alignment based on the conversion variance with minimum efficiency of each point of the waveform. Figure 5 shows some examples of the prepared dataset for illustration.

3.3. Implementation and Training

In the rUNet, the input vector consists of two vectors, namely the measuring pulse waveform of the pre-amplifier modules and the number of the beam line. The middle output is the pulse waveform at a frequency of 1 Hz, and the final output is the setting voltage of the AWG. All waveform sequences to the network were cropped into 160 resolutions with a sampling interval of 100 ps. After data cleaning, the total number of grouped waveforms used for the training the network was 7549. The samples were randomly divided into 6040 training samples and 1509 testing samples in a ratio of 4:1. The training process ceased in advance when the network started to overfit the noise in the training samples. The data samples and parameters were wrapped in a data generator, which generated batches of vectors for each training epoch.
The training process is used to find appropriate parameters to minimize the loss. In this study, MSE loss is used, which is defined as
L = 1 2 m i = 1 m ( y ^ i y i ) 2 + 1 2 m j = 1 m ( y ^ j y j ) 2 ,
where m is the number of training samples, y ^ i is the predicted pulse waveform at a frequency of 1 Hz, y i is the measuring pulse waveform at a frequency of 1 Hz, y ^ j is the predicted setting voltage of the AWG, and y j is the AWG voltage used in the experiment.
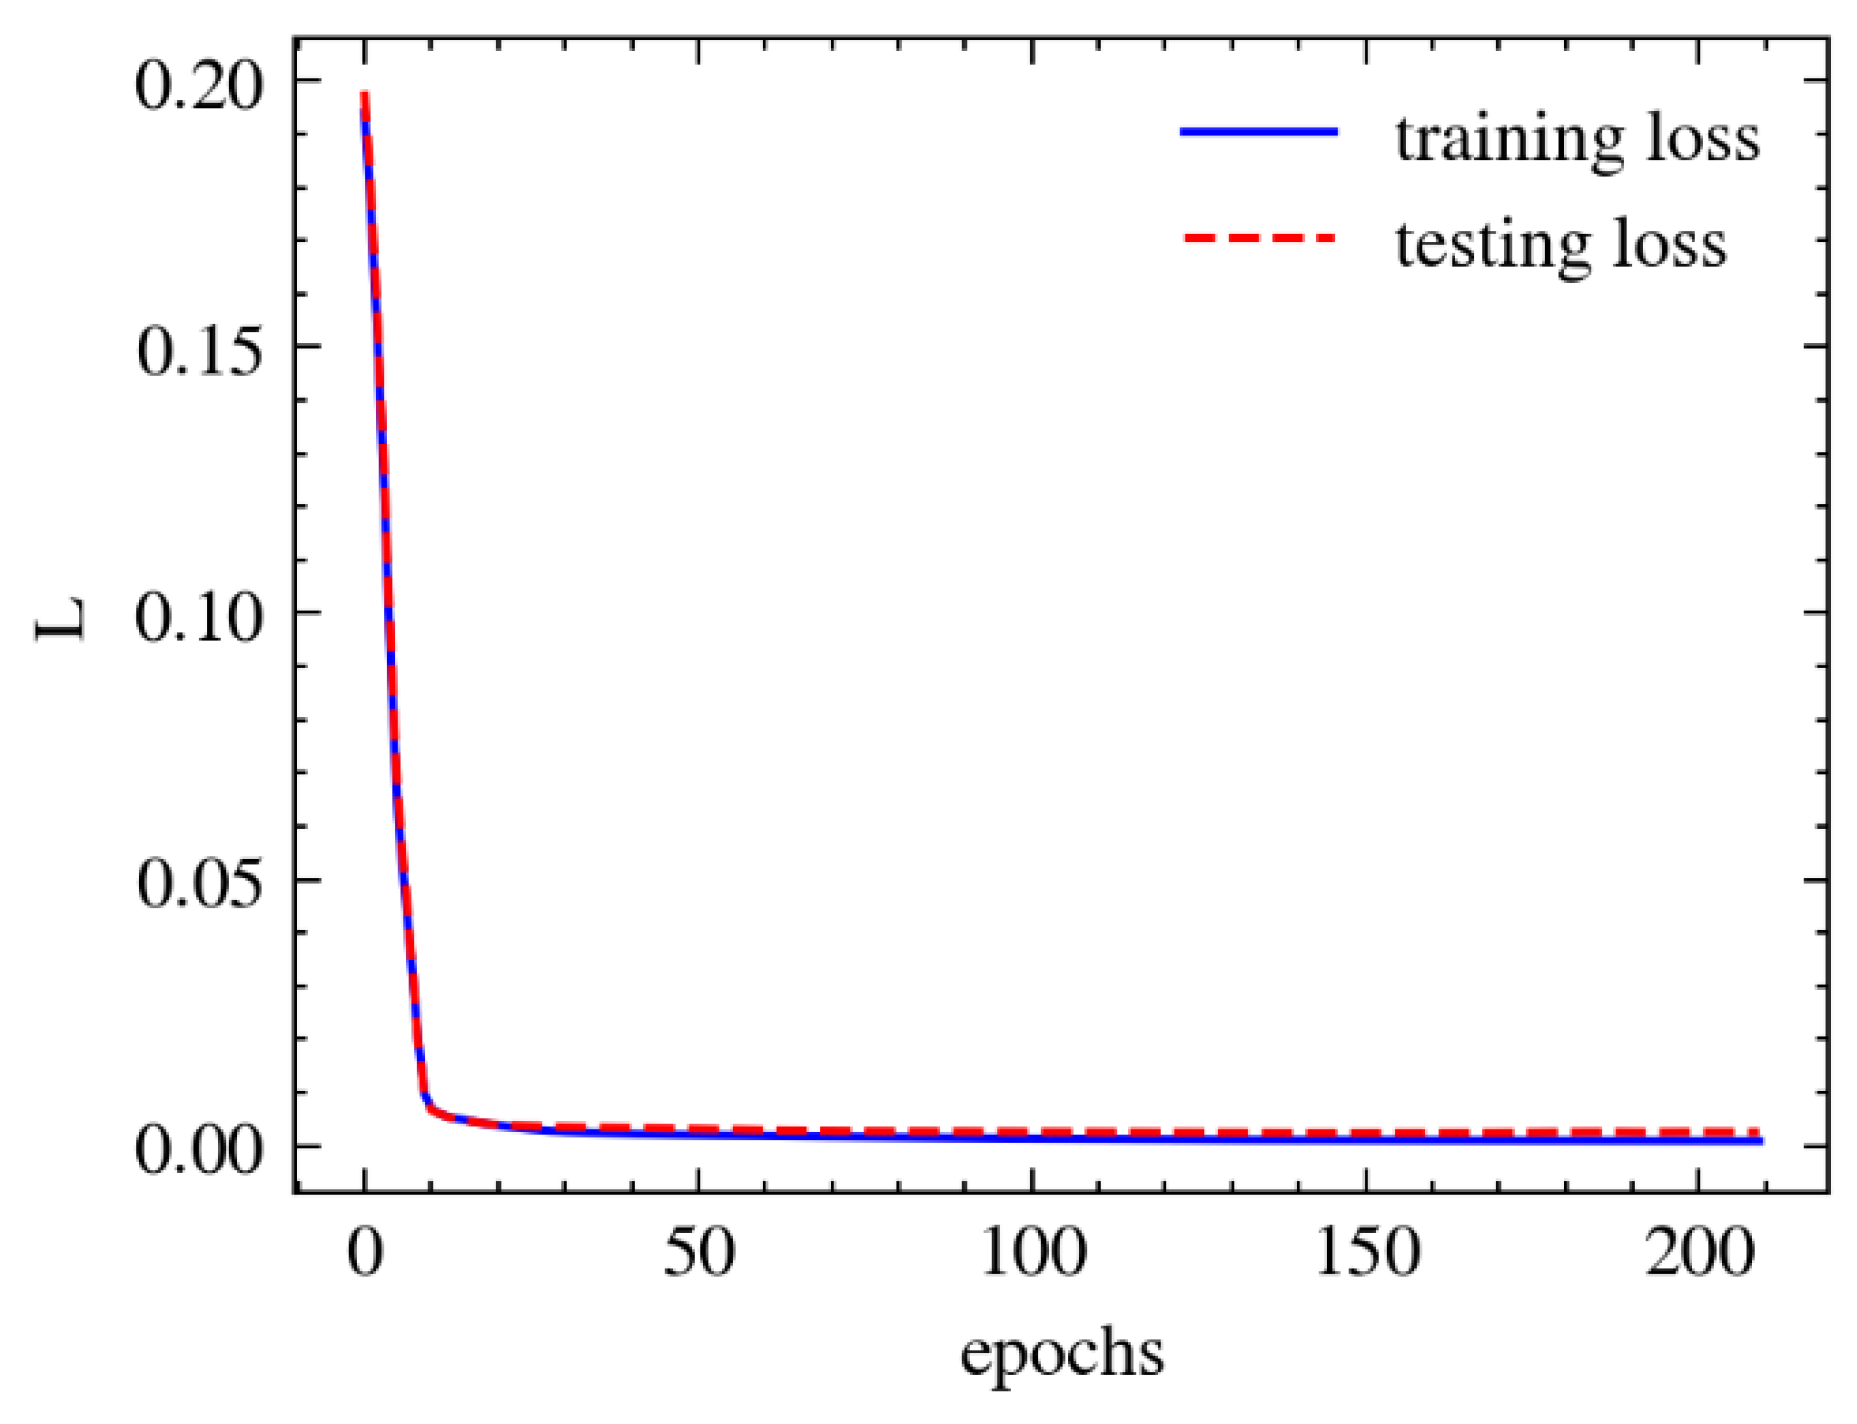
We used Adam optimizer [20] to train the network. Adam optimization is an extension of random gradient descent and can be used to update network weights. The rUNet is trained by Adam optimization with randomly initialized parameters for 2000 epochs, unless the output meets the accuracy requirements, or the loss function measuring output performance gets worse and worse for 20 consecutive iterations. The initial learning rate is 10−4, which enables the network to converge quickly. The network is trained with 50 batch iterations until the loss of validation samples stops decreasing. For each iteration, we use randomly scrambled samples as the input of the network. Then, we change the learning rate to 10−5, and repeat the above process to fine tune the model. Figure 6 shows the curves of training and testing loss with respect to the number of iterations.

4. Results

4.1. Testing Results

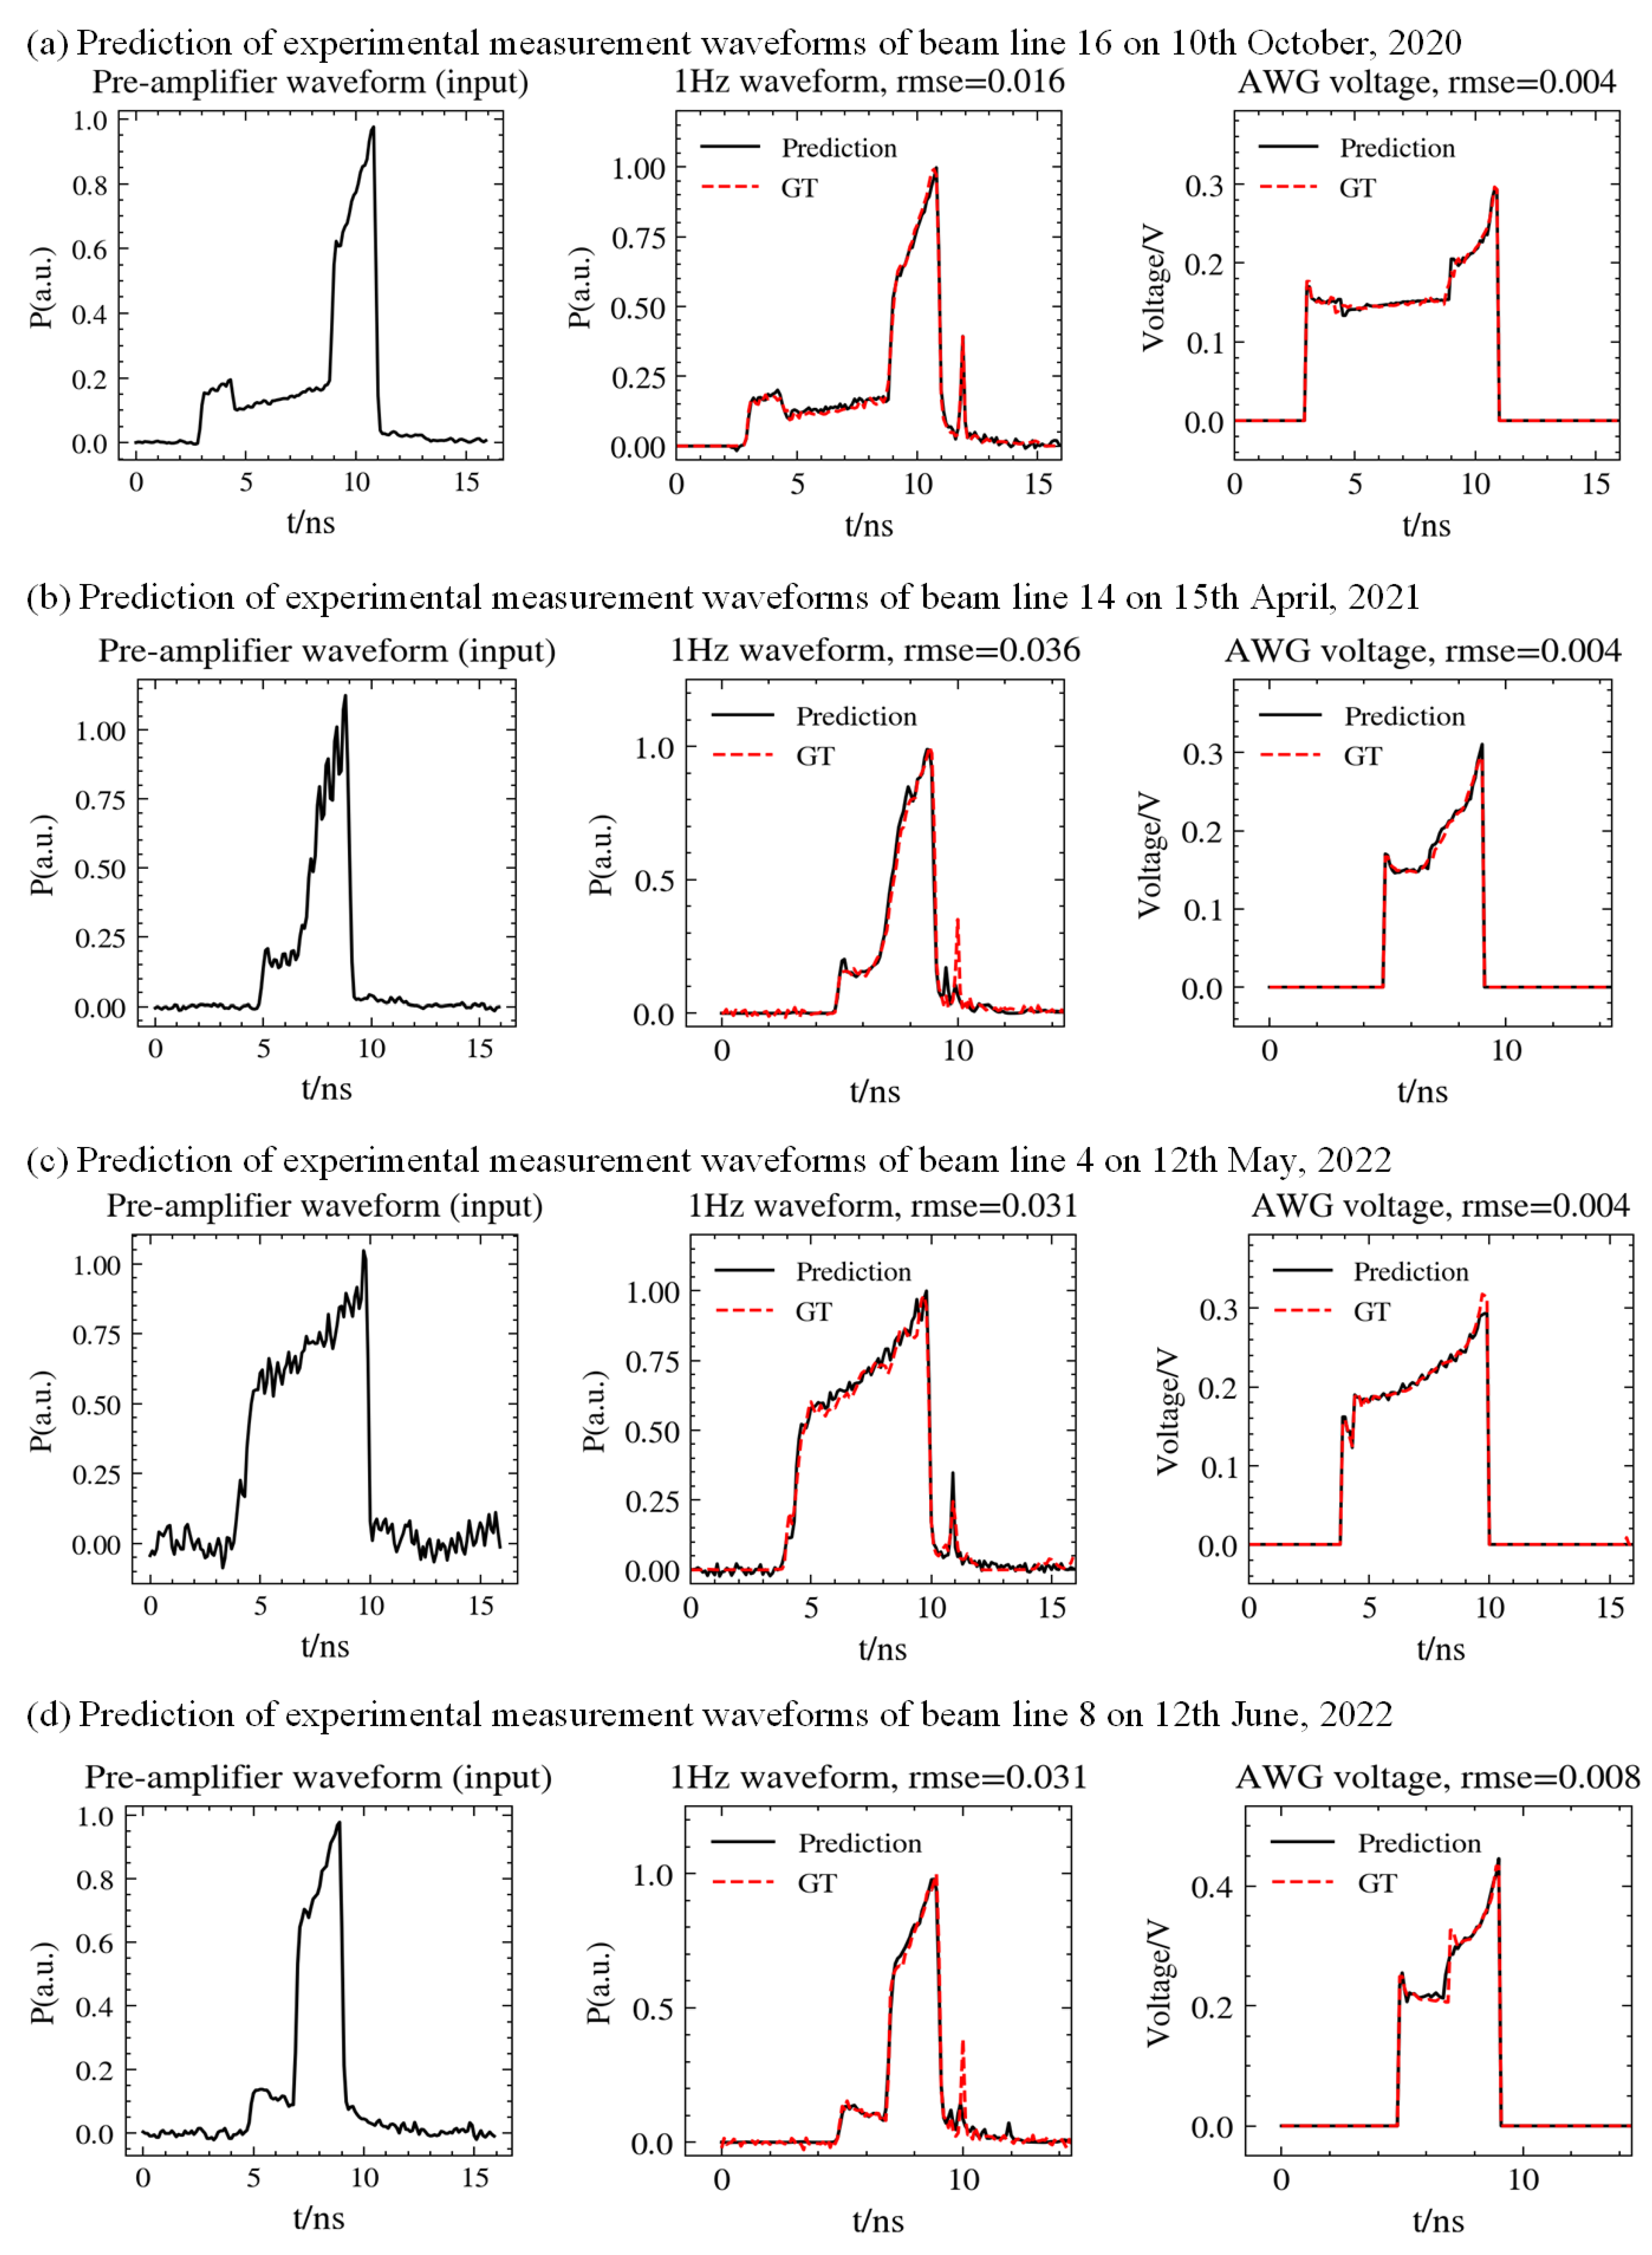
To test the robustness and adaptability of our network for predicting the pulse waveform of a front-end laser system according to a new input, we collected more recent pulse waveforms, which are not in the training set, from different beamlines, and prepared the testing set following the same method as was used to produce the training set. The measurements of pulse waveforms of pre-amplifier modules were processed into a sequence with a length of 160 and fed as an input into the trained rUNet together with the corresponding number of the beam line. Then, the prediction results of the model were compared with the ground truth. The total number of testing samples was 1509. The trained network achieved an RMSE of 3.38% on the testing set of measuring pulse waveform at a frequency of 1 Hz, and an RMSE of 0.84% on the testing set of setting the voltage of AWG [21]. Figure 6 shows a comparison between the predicted pulse waveform and the real measured pulse waveform. As shown in Figure 7, the trained model can accurately predict the pulse waveform at a frequency of 1 Hz and set the voltage of the AWG.

4.2. Comparison Results

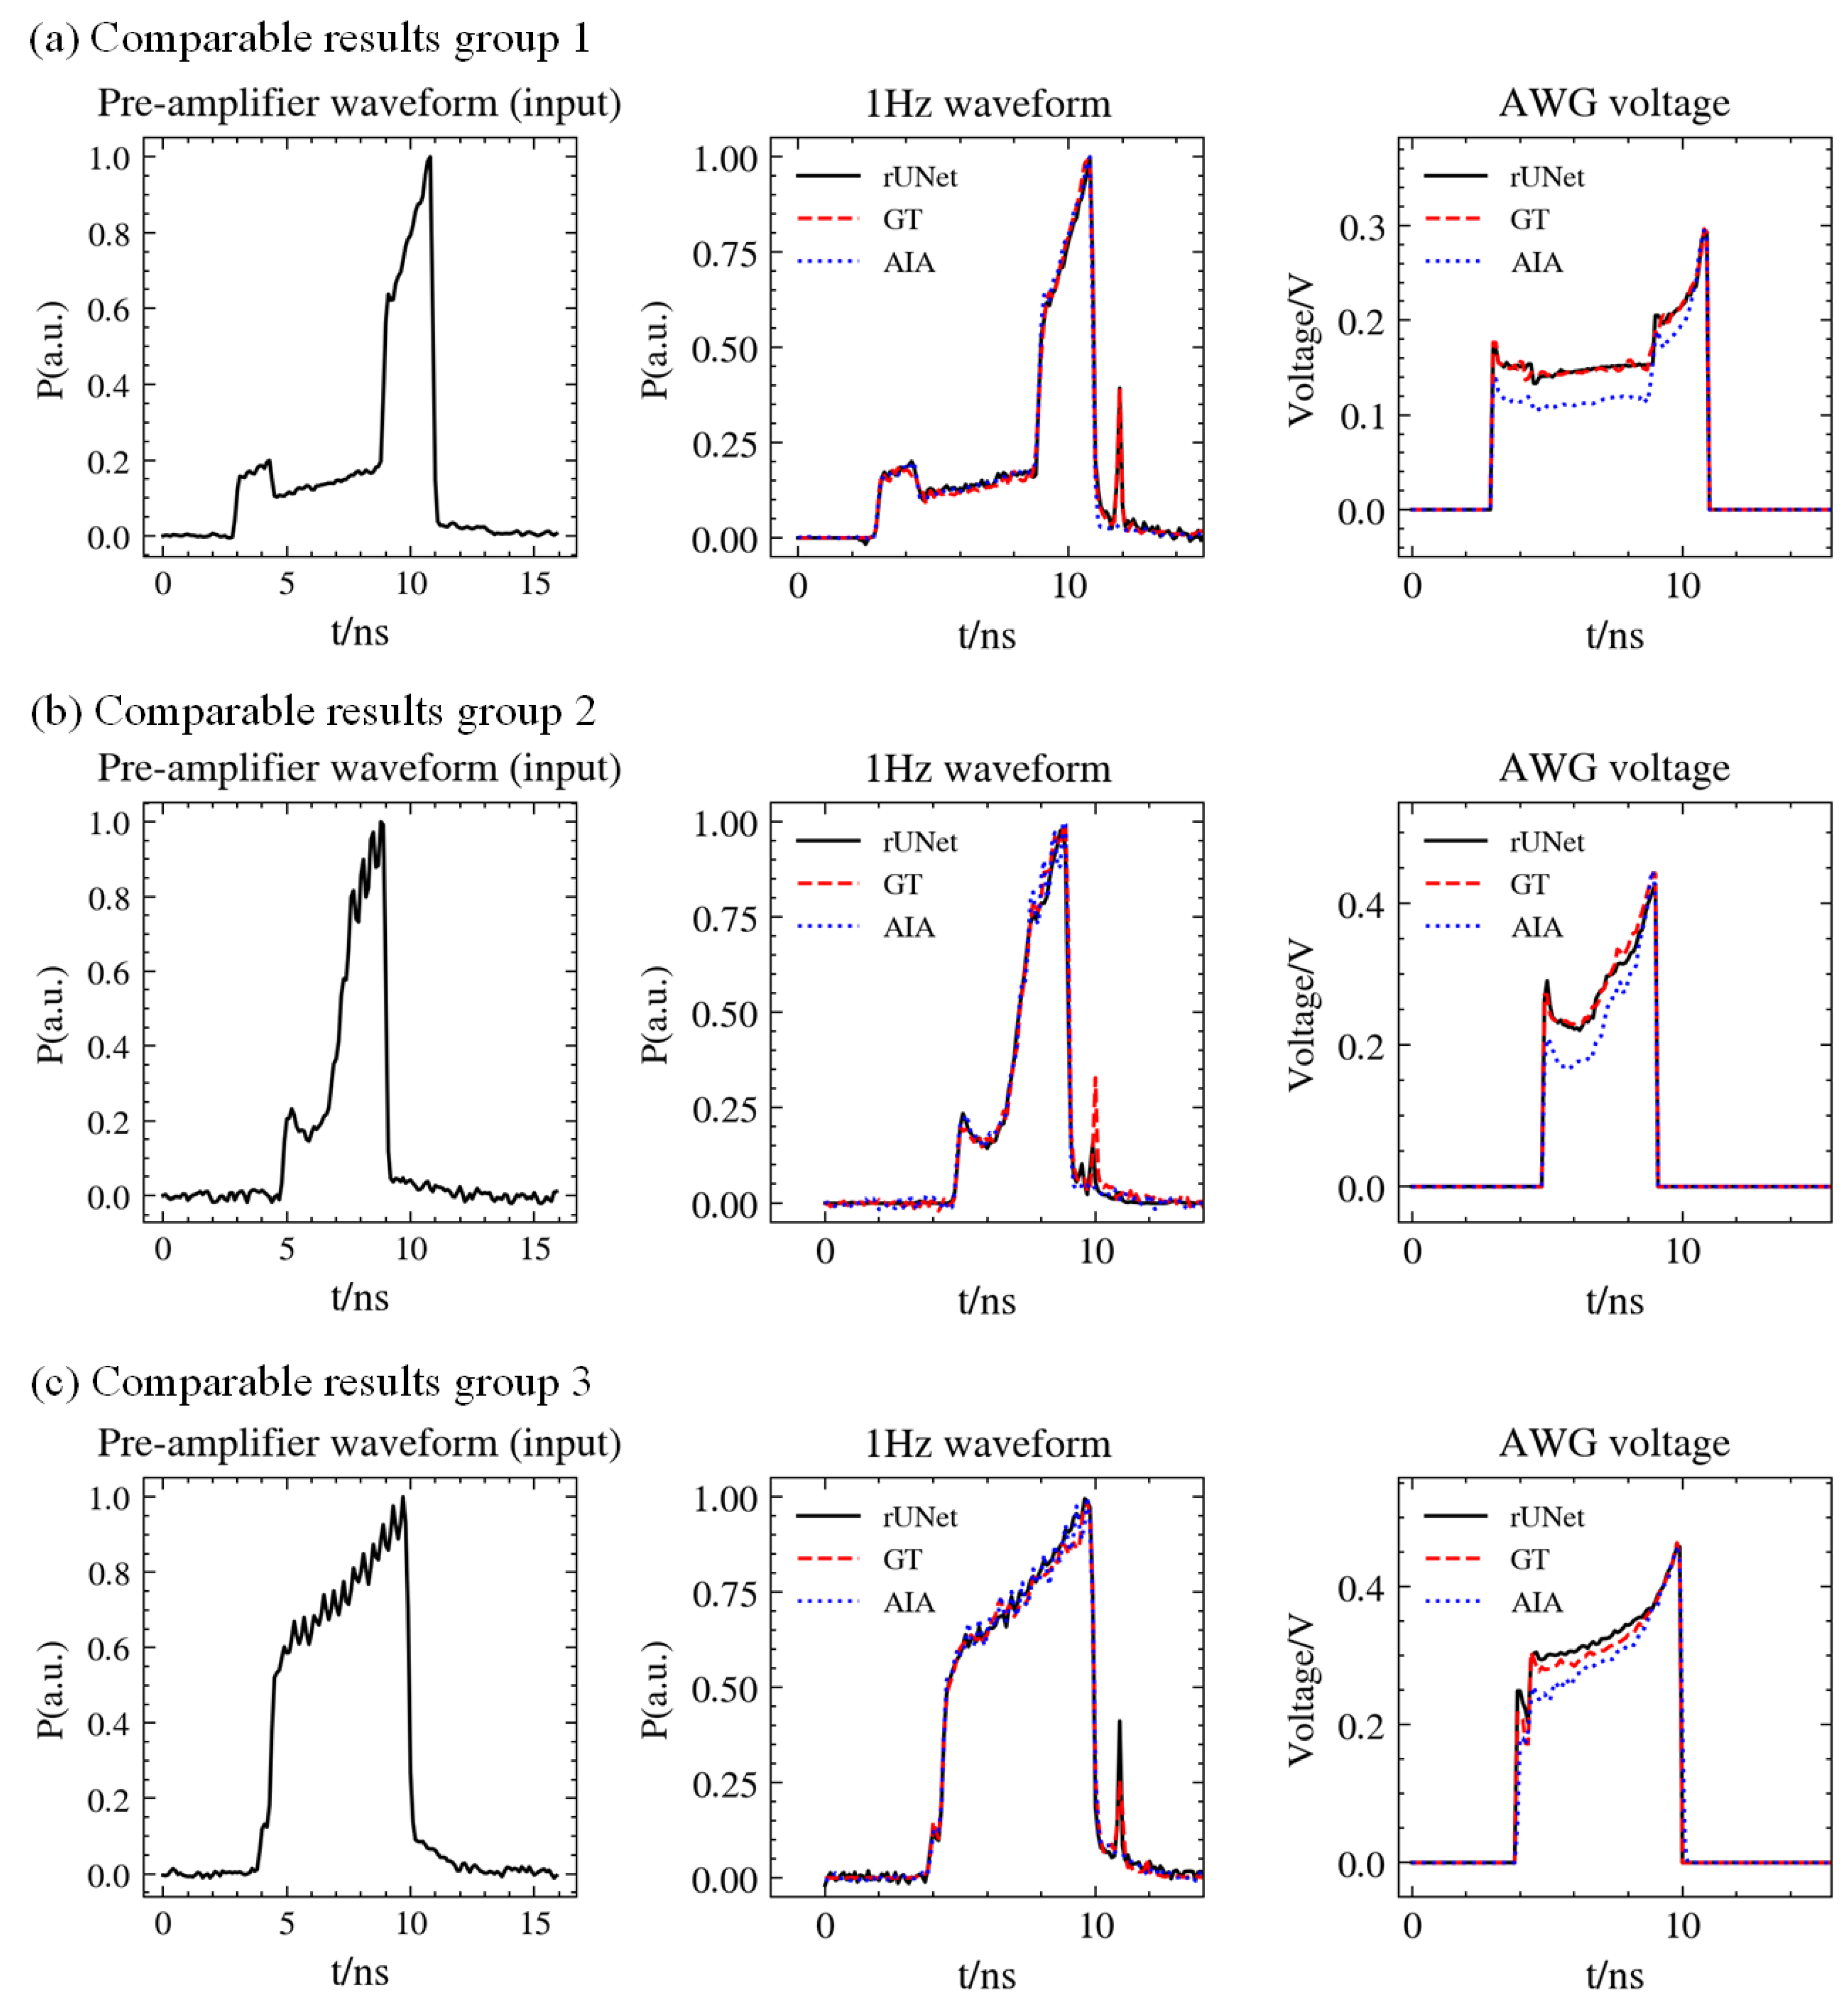
The closed-loop control method used for pulse shaping on a current high-power laser facility is an artificial intelligence-assisted (AIA) method, as described in detail in reference [14]. The core of the AIA method is to assign an initial value to the set voltage of AWG during the closed-loop process through a trained UNet. We quantitatively compare the average prediction performance and accuracy of our proposed method with the AIA method. The prediction results of the proposed prediction model and the AIA method are compared to the measurement data in experiments, as shown in Figure 8. And, the specific performances of the two methods are shown in Table 2.
The results of our proposed model have less RMSE than the other method, which means that the pulse shapes predicted using our proposed method are closer to the true values for the whole testing set, and the details are more accurate. Taking all samples into account, compared to the other method, the incremental prediction accuracy of the proposed network evaluated by an RMSE is 0.31% on the testing set of setting the voltage of AWG and 0.90% on the testing set of pulse waveform at a frequency of 1 Hz.

4.3. Discussion

Compared with the current AIA method, rUNet has significantly improved prediction performance and accuracy, which shows our proposed method’s robustness and adaptability for predicting the pulse waveform of a front-end chained laser system. We provide the following explanations for the significant predictive performance and accuracy improvement of our proposed network. The most important reason is that although both methods have the function of predicting the pulse waveform of the front-end laser system, the specific factors considered in the design of the two methods differ greatly. The AIA method is designed for closed-loop pulse shaping, with efficiency being the most important consideration. Therefore, the AIA method ignores the difference between measurement waveforms of the pre-amplifier modules and measured pulse waveforms at a frequency of 1 Hz. It directly assumes that the relationship between the two measurement waveforms is linear. Our proposed rUNet is mainly used to fill in paired missing values of data links in the waveform database, and accuracy is a more important factor. So, linear approximation has not been adopted. In the proposed method, the chained features of the front-end laser system were considered, and a series residual module was designed to extract the features of the relationship between measurement waveforms of the pre-amplifier modules and the measured pulse waveforms at a frequency of 1 Hz. From the quantitative comparison of the prediction performance of the two methods for pulse waveforms at a frequency of 1 Hz, it is obvious that the series residual module has effectively improved the prediction accuracy. Meanwhile, compared to the UNet used in the AIA method, the U-shaped network structure in our proposed method has more numbers of convolutional kernels and different approaches for feature concatenation. The state of the facility is dynamically changing, and changes in laser parameters can also affect the prediction performance of the method [13]. According to the quantitative comparison results of prediction performance, the network structure we use has better adaptability to changes in laser parameters that will affect the prediction performance of pulse waveforms of the front-end laser system over the next few years, thus possessing higher prediction accuracy.
Nevertheless, the drawbacks of the proposed method cannot be totally ignored. Above all, operating and environmental parameters, including shots in service, time interval with last shot, month, day of the week, the shot number of the day, temperature and humidity information measured by several sensors, and so on, will affect the prediction results. But, these parameters have not been added to the network. Furthermore, the network performance depends on the quality of the measurement and control system, but, at present, the input and output conditions of the AWG have never been calibrated. Improving the construction of our database and adding operation parameters into our model will be an important topic for future research [22]. Last but not least, it is necessary to further study how to quantify the impact of different laser parameters on the prediction performance of the proposed model. During our research, we found that changes in the state of the facility have a significant impact on the generalization of the model. Just updating the network parameters did not solve this problem, and it may be necessary to redesign the network structure. It means that the proposed method has a huge challenge to generalize itself to different laser facilities or configurations. In future research, we will use methods of interpretability in deep learning to quantify the impact of different laser parameters on the prediction performance of the model.

5. Conclusions

In this paper, a UNet of a series residual module is presented to predict the pulse waveform of a front-end chained system in a current high-power laser facility. The chained feature of the front-end laser system is studied, and the effects of the series residual module on the prediction performance of pulse waveforms at a frequency of 1 Hz are thoroughly discussed. Based on an origin U-shaped framework, rUNet is proposed to significantly improve the accuracy of predicting pulse waveforms of the front-end laser system. Comparison experiments are performed to investigate the effects of different hyperparameters on the prediction performance. The main conclusions that can be drawn are as follows: The series residual module has effectively improved the prediction accuracy of pulse waveforms at a frequency of 1 Hz. The network hyperparameters used in our method improve the performance of waveform prediction for the front-end system. Our proposed neural network can accurately fill in missing values in the waveform database, so as to further mine the influencing factors in precise control of the high-power laser system in the future. The results on the testing set show that this method can quickly couple operation parameters. Moreover, it is feasible in the management of the waveform database in a current high-power laser facility. We propose an economic and fast method which can be applied to cleaning a one-dimensional sequence and maintaining a waveform database.

Author Contributions

Conceptualization, Y.L. and D.H.; Methodology, Y.L. and Y.G.; Supervision, D.H.; Writing—Original Draft, Y.L.; Writing—Review and Editing, X.H. and Q.Y. All authors have read and agreed to the published version of the manuscript.

Funding

This research was funded by Talent Foundation of Sichuan Province, grant number 21-TFWR-10-01.

Institutional Review Board Statement

Not applicable.

Informed Consent Statement

Not applicable.

Data Availability Statement

The data presented in this study are available on request from the corresponding author.

Conflicts of Interest

The authors declare no conflict of interest.

References

  1. Perry, T.S.; Wilde, B.H. NIF system-design requirements for nuclear-weapons physics experiments. Off. Sci. Tech. Inf. Tech. Rep. 1995. [Google Scholar] [CrossRef]
  2. Le Garrec, B.; Nicolas, O. Laser performance operation model and its application to LIL energy and power balance. J. Phys. Conf. Ser. 2008, 112, 032019. [Google Scholar] [CrossRef]
  3. Zacharias, R.A.; Beer, N.R.; Bliss, E.S.; Burkhart, S.C.; Cohen, S.J.; Sutton, S.B.; Van Atta, R.L.; Winters, S.E.; Salmon, J.T.; Stolz, C.J. National Ignition Facility alignment and wavefront control. In Proceedings of the Optical Engineering at the Lawrence Livermore National Laboratory II: The National Ignition Facility, San Jose, CA, USA, 28 May 2004; pp. 168–179. [Google Scholar]
  4. Zacharias, R.A.; Beer, N.R.; Bliss, E.S.; Burkhart, S.C.; Cohen, S.J.; Sutton, S.B.; Van Atta, R.; Winters, S.E.; Salmon, J.T.; Latta, M.R. Alignment and wavefront control systems of the National Ignition Facility. Opt. Eng. 2004, 43, 2873–2884. [Google Scholar] [CrossRef]
  5. Shaw, M.; House, R. Laser performance operations model (LPOM): The computational system that automates the setup and performance analysis of the National Ignition Facility. In Proceedings of the High Power Lasers for Fusion Research III, San Francisco, CA, USA, 26 February 2015; pp. 91–106. [Google Scholar]
  6. Shaw, M.; Williams, W.; House, R.; Haynam, C. Laser performance operations model. Opt. Eng. 2004, 43, 2885–2895. [Google Scholar] [CrossRef]
  7. Shaw, M.J.; Williams, W.H.; Jancaitis, K.S.; Widmayer, C.C.; House, R. Preformance and operational modeling of the National Ignition Facility. In Proceedings of the Optical Modeling and Performance Predictions, San Diego, CA, USA, 22 January 2004; pp. 194–203. [Google Scholar]
  8. Sacks, R.; Henesian, M.; Haney, S.; Trenholme, J. The PROP92 Fourier beam propagation code. Foreword iii WARP3d, a Three-Dimensional PIC Code for High-Current 129 Ion-Beam Propagation Developed for Heavy-Ion Fusion. Foreword Iii WARP3d A Three-Dimens. PIC Code High-Curr. 129 Ion-Beam Propag. Dev. Heavy-Ion Fusion 1996, CRL-LR-105821-96, 207–216. [Google Scholar]
  9. Humbird, K.D.; Peterson, J.L.; McClarren, R.G. Predicting the time-evolution of multi-physics systems with sequence-to-sequence models. arXiv 2018, arXiv:1811.05852. [Google Scholar]
  10. Kustowski, B.; Gaffney, J.A.; Spears, B.K.; Anderson, G.J.; Thiagarajan, J.J.; Anirudh, R. Transfer learning as a tool for reducing simulation bias: Application to inertial confinement fusion. IEEE Trans. Plasma Sci. 2019, 48, 46–53. [Google Scholar] [CrossRef]
  11. Anirudh, R.; Thiagarajan, J.J.; Bremer, P.-T.; Spears, B.K. Improved surrogates in inertial confinement fusion with manifold and cycle consistencies. Proc. Natl. Acad. Sci. USA 2020, 117, 9741–9746. [Google Scholar] [CrossRef] [PubMed]
  12. Denis, V.; Nicolaizeau, M.; Néauport, J.; Lacombe, C.; Fourtillan, P. LMJ 2021 facility status. In Proceedings of the High Power Lasers for Fusion Research VI, Online, 6 May 2021; pp. 5–14. [Google Scholar]
  13. Zou, L.; Geng, Y.; Liu, B.; Chen, F.; Zhou, W.; Peng, Z.; Hu, D.; Yuan, Q.; Liu, G.; Liu, L. CNN-based neural network model for amplified laser pulse temporal shape prediction with dynamic requirement in high-power laser facility. Opt. Express 2022, 30, 29885–29899. [Google Scholar] [CrossRef] [PubMed]
  14. Luo, J.; Tian, Z.; Li, L.; Ni, Z.; Xie, X.; Zhou, X. Embedding AI into laser pulse shaping closed-loop control. Fusion Eng. Des. 2023, 194, 113888. [Google Scholar] [CrossRef]
  15. Hu, D.; Dong, J.; Xu, D.; Huang, X.; Zhou, W.; Tian, X.; Zhou, D.; Guo, H.; Zhong, W.; Deng, X. Generation and measurement of complex laser pulse shapes in the SG-III laser facility. Chin. Opt. Lett. 2015, 13, 041406. [Google Scholar]
  16. Ronneberger, O.; Fischer, P.; Brox, T. U-net: Convolutional networks for biomedical image segmentation. In Proceedings of the Medical Image Computing and Computer-Assisted Intervention–MICCAI 2015: 18th International Conference, Munich, Germany, 5–9 October 2015; Proceedings, Part III 18. pp. 234–241. [Google Scholar]
  17. Stoller, D.; Tian, M.; Ewert, S.; Dixon, S. Seq-u-net: A one-dimensional causal u-net for efficient sequence modelling. arXiv 2019, arXiv:1911.06393. [Google Scholar]
  18. Acock, A.C. Working with missing values. J. Marriage Fam. 2005, 67, 1012–1028. [Google Scholar] [CrossRef]
  19. He, K.; Zhang, X.; Ren, S.; Sun, J. Deep residual learning for image recognition. In Proceedings of the IEEE Conference on Computer Vision and Pattern Recognition, Las Vegas, NV, USA, 26 June–1 July 2016; pp. 770–778. [Google Scholar]
  20. Kingma, D.P.; Ba, J. Adam: A method for stochastic optimization. arXiv 2014, arXiv:1412.6980. [Google Scholar]
  21. Spaeth, M.L.; Manes, K.R.; Bowers, M.; Celliers, P.; Nicola, J.-M.D.; Nicola, P.D.; Dixit, S.; Erbert, G.; Heebner, J.; Kalantar, D. National ignition facility laser system performance. Fusion Sci. Technol. 2016, 69, 366–394. [Google Scholar] [CrossRef]
  22. Osthus, D.; Vander Wiel, S.A.; Hoffman, N.M.; Wysocki, F.J. Prediction uncertainties beyond the range of experience: A case study in inertial confinement fusion implosion experiments. SIAM/ASA J. Uncertain. Quantif. 2019, 7, 604–633. [Google Scholar] [CrossRef]
Figure 1. Measurement location of laser pulses in current high-power laser facility.
Photonics 10 01244 g001
Figure 2. Our proposed rUNet for predicting pulse waveform. The boxes correspond to multi-channel feature maps, connected by different operations (denoted by arrows). The length and height of each box represent the number of convolutional kernels and the length of the waveform sequence, respectively.
Photonics 10 01244 g002
Figure 3. Structure of residual module used in our rUNet.
Photonics 10 01244 g003
Figure 4. The overall structure to train the model for predicting pulse waveform of frond-end chained laser system. The preprocessed waveform data is fed into untrained rUNet to obtain a trained neural network. Then, new measuring waveform of pre-amplifier modules is fed into the trained rUNet to predict the pulse waveform of the front-end system.
Photonics 10 01244 g004
Figure 5. Processed data groups of pulse waveforms. The left column is setting the voltage of AWG. The middle column is measuring the pulse waveforms at a frequency of 1 Hz. The right column is measuring the pulse waveforms of pre-amplifier modules.
Photonics 10 01244 g005
Figure 6. The curves of training and testing loss with respect to the number of iterations.
Photonics 10 01244 g006
Figure 7. Prediction of the pulse waveform at a frequency of 1 Hz and the setting voltage of the AWG. The red line is real pulse waveform (ground truth, GT), and the black line is the network prediction. The left column is the measured pulse waveform of pre-amplifier modules as a network input. The middle column is the comparison between the predicted pulse waveform at a frequency of 1 Hz and its ground truth. The right column is a comparison between the predicted setting voltage of the AWG and its ground truth.
Photonics 10 01244 g007
Figure 8. The prediction results of different methods for different temporal shapes. The red line is measurement data (GT). The black line is the prediction of our proposed method. The blue line is the prediction of the AIA method. The left column is the measured pulse waveform of pre-amplifier modules as the input of different methods. The middle column is the prediction results of the pulse waveform at a frequency of 1 Hz of two methods compared to GT. The right column is the prediction results of setting the voltage of AWG of two methods compared to GT.
Photonics 10 01244 g008
Table 1. Part of the storage status of the experimental data link in the database of pulse waveform on 13 May 2022. The number 1 represents normal data storage, while the number 0 represents missing values.
The Number of Beam LineSetting Voltage of AWGPulse Waveform at a Frequency of 1 HzPre-Amplifier ModulesMain AmplifierTarget Chamber
111111
211111
311111
411111
511111
600111
711111
811111
911111
1000111
1100111
1200111
1311111
1400111
1500111
1600111
Table 2. Prediction performance of different approaches.
MethodsRMSE of 1 Hz Waveform/%RMSE of AWG Voltage/%
AIA3.691.74
rUNet3.380.84
Disclaimer/Publisher’s Note: The statements, opinions and data contained in all publications are solely those of the individual author(s) and contributor(s) and not of MDPI and/or the editor(s). MDPI and/or the editor(s) disclaim responsibility for any injury to people or property resulting from any ideas, methods, instructions or products referred to in the content.