Article

Phase State Influence on Photoluminescence of MAPb(BrxI1−x)3 Perovskites towards Optimized Photonics Applications

Physics and Astronomy Department, College of Science, King Saud University, Riyadh 11451, Saudi Arabia
*
Author to whom correspondence should be addressed.
Photonics 2023, 10(1), 21; https://doi.org/10.3390/photonics10010021
Submission received: 18 October 2022 / Revised: 17 November 2022 / Accepted: 6 December 2022 / Published: 24 December 2022

Abstract

:
Perovskite halide has many advantages that attracted the attention of researchers in the last years, but many challenges prevent the use of halide perovskites in different applications. One of these challenges is the low thermal stability resulting in phase transitions with temperatures. Here, the photoluminescence (PL) characteristics and related phase transitions of different CH3NH3Pb(BrxI1−x)3 (MA(BrxI1−x)3)3 perovskites structures have been investigated under a wide temperature range. The work that has been conducted demonstrates that under temperature, the exciton behavior of the halide anions, I and Br, has a considerable impact on structural phases and the fluorescence process. The obtained results for the temperature dependence of PL for MAPb(BrxI1−x)3 showed a wide range of emission wavelengths, between 500–800 nm with a decrease in PL intensity with increasing temperature. In addition, the ratio of both bromine and iodine in MAPb(BrxI1−x)3 affects the range of phase transition temperatures, where at x = 0.00, 0.25, and 0.50 the first transition occurs below room temperature (orthorhombic to tetragonal) phase and the other occurs above room temperature (tetragonal to cubic) phase. Furthermore, increasing the proportion of bromine causes all the transitions to occur below room temperature. The presented findings suggest a suitable halide component under a temperature-controlled phase transformation to benefit these materials in photonics devices.

1. Introduction

Lead-halide hybrid perovskite crystals have emerged as promising materials due to their unique chemical and physical properties such as broad absorption range, bandgap tunability, high carrier mobility, relatively long carrier lifetime, long carrier diffusion length, low non-radiative recombination rates, balanced electron/hole transportation, high photo conversion efficiencies, and their relative ease of synthesis from simple starting materials through solution processing or vapor deposition [1,2,3,4,5]. Perovskite basically adopts a crystal structure consisting of corner-sharing TiO6 octahedra in three dimensions, with Ca occupying the cuboctahedra cavity in each unit cell [6]. The same crystal structure is also found for a broad range of materials with ABX3 stoichiometry [7], where A is an organic cation or an inorganic cation, B is a metal cation (e.g., Pb, Sn), and X is a halide anion (I, Br, Cl) dependent Goldschmidt’s tolerance factor [8,9,10].
Methylammonium lead halide, MAPbX3, has received increasing attention as an absorber material for perovskite solar cells. The halide anion was the most efficiently varied component in hybrid perovskites. With the increasing atomic size of group VIIA (Cl → Br → I), the absorption spectra shifts to longer wavelengths with reduction in energy. This can be attributed to the decrease in electronegativity to better match that of Pb, effectively reducing ionic and increasing covalent character Iodide (I) [11,12]. MAPbI3 crystallizes in the tetragonal phase at room temperature. The addition of iodine gives many advantages, the most important of which is the small value of the band gap, for example, in solar cells it helps by increasing their efficiency [4,13].
MAPbBr3 is another model of the organic-inorganic halide perovskite (OIHP) group. It crystallizes in the cubic phase at room temperature. However, MAPbI3 is more efficient than MAPbBr3 in photovoltaics applications, whilst MAPbBr3 is more stable in ambient conditions [14]. The value of bandgap MAPbI3 is 1.51–1.55 eV, which is close to the optimal bandgap range for a single-junction solar cell is 1.1–1.4 eV, [15]. The ideal MAPbI3 perovskite structure typically has the lowest bandgap and highest electron mobility. Distortions from the ideal symmetry cubic phase (space group Pm3m) have an impact on the bandgap and electronic transport properties, where the temperature change is one of the reasons for the transition [16]. MAPbBr3 has a larger band gap (2.2 eV) than MAPbI3, despite that MAPbBr3 has better stability under air and moist conditions, compared to MAPbI3.
Phase transition due to temperature variations of single crystal structure MAPb(BrxI1−x)3 has been studied by several groups of research. The phase transitions of MAPbI3 from tetragonal to cubic at around 315–330 K and from orthorhombic to tetragonal 144–160 K [1,17] have been confirmed in different ways, approved by spectroscopic Ellipsometry techniques [18], and XRD technique [19], for single crystal MAPbBr3 the phase transitions from cubic to tetragonal phase at around 230 K and then to orthorhombic phase around 150 K [19,20]. Temperature-dependent PL studies for thin film of MAPbI3 showed the phase transitions followed by PL shifts [21,22,23]. Therefore, MAPb(BrxI1−x)3 perovskites with heating undergo two-phase transitions, orthorhombic (Pnam) to tetragonal (I4/mcm), then to cubic(Pm3m).
This study shows how to make high-quality perovskite films, as well as temperature-dependent PL and related phase transitions of different MAPb(BrxI1−x)3, and finally, how the anion ratio affects the activation energy value of MAPb(BrxI1−x)3.

2. Materials and Methods

2.1. Materials

Lead(II) iodide (PbI2, 99.999% trace metals basis); methylammonium iodide (MAI, 99.999% trace metals basis); lead(II) bromide (PbBr2, 99.999% trace metals basis); and methylammonium bromide (MABr, 99.999% trace metals basis) used in this study were purchased from Sigma Aldrich and were used as received. All materials were used as received from the company with any further treatment or purification.

2.2. Methods

The studied films were basically formed by depositing the suitable mixture of the primary components CH3NH3X(MAX) and PbX2 (X = Br, I), with the favorite stoichiometric ratios on glass substrate using single-source thermal evaporator system (Edwards 306 Coating System). The film could be experimentally synthesized using the two precursor (PbX2) and (MAX) and summarized in the following reaction:
PbX2 + MAX → MAPbX3
For example, to produce MAPbl3, at first, glass substrate should be cleaned carefully and placed on a holder fronting the precursor sources. The material sources were first charged on a molybdenum boat sequentially with 46.10 mg (~0.1 mmol) of PbI2 and 158.97 mg (~1.00 mmol) of (MAI). After having a relatively low pressure ~10−4 mbar in the vacuum chamber, the PbI2 was first started to evaporate onto the glass. MAI was then evaporated on top of the evaporated PbI2. After that, sample was taken out and annealed using a hot plate at 120 °C for 10 min. The film thickness was measured using a Dektak 150 stylus profiler (Bruker, Billerica, MA, USA). The schematic diagram of the thermal evaporation system parts is shown below in Figure 1.
By repeating the previous method in the same way, another sample with different structure could be synthesized and summarized in the following reactions:
PbI2 + MAI MAPbI3
PbBr2 + MABr MAPbBr3
0.5 PbBr2 + 0.5 PbI2 + 0.5 MABr + 0.5 MAI → 0.5MAPbBr3 + 0.5 MAPbl3 → MAPb(Br0.5 l0.5)3

2.3. Characterization

2.3.1. Structural Characterization

All measurements were recorded at room temperature in an ambient environment. The morphology was investigated by using scanning electron microscopy (SEM-JEOL-7600F, JEOL, Japan) and the crystal phases of the films were verified (XRD—Miniflex 600, Rigaku, Japan) with copper Kα radiation (λ = 1.5418 Å). The scanning angle (2θ) varied between 10° to 80° at a scanning rate (step size) of 0.02° at 3°/min.

2.3.2. Optical Characterization

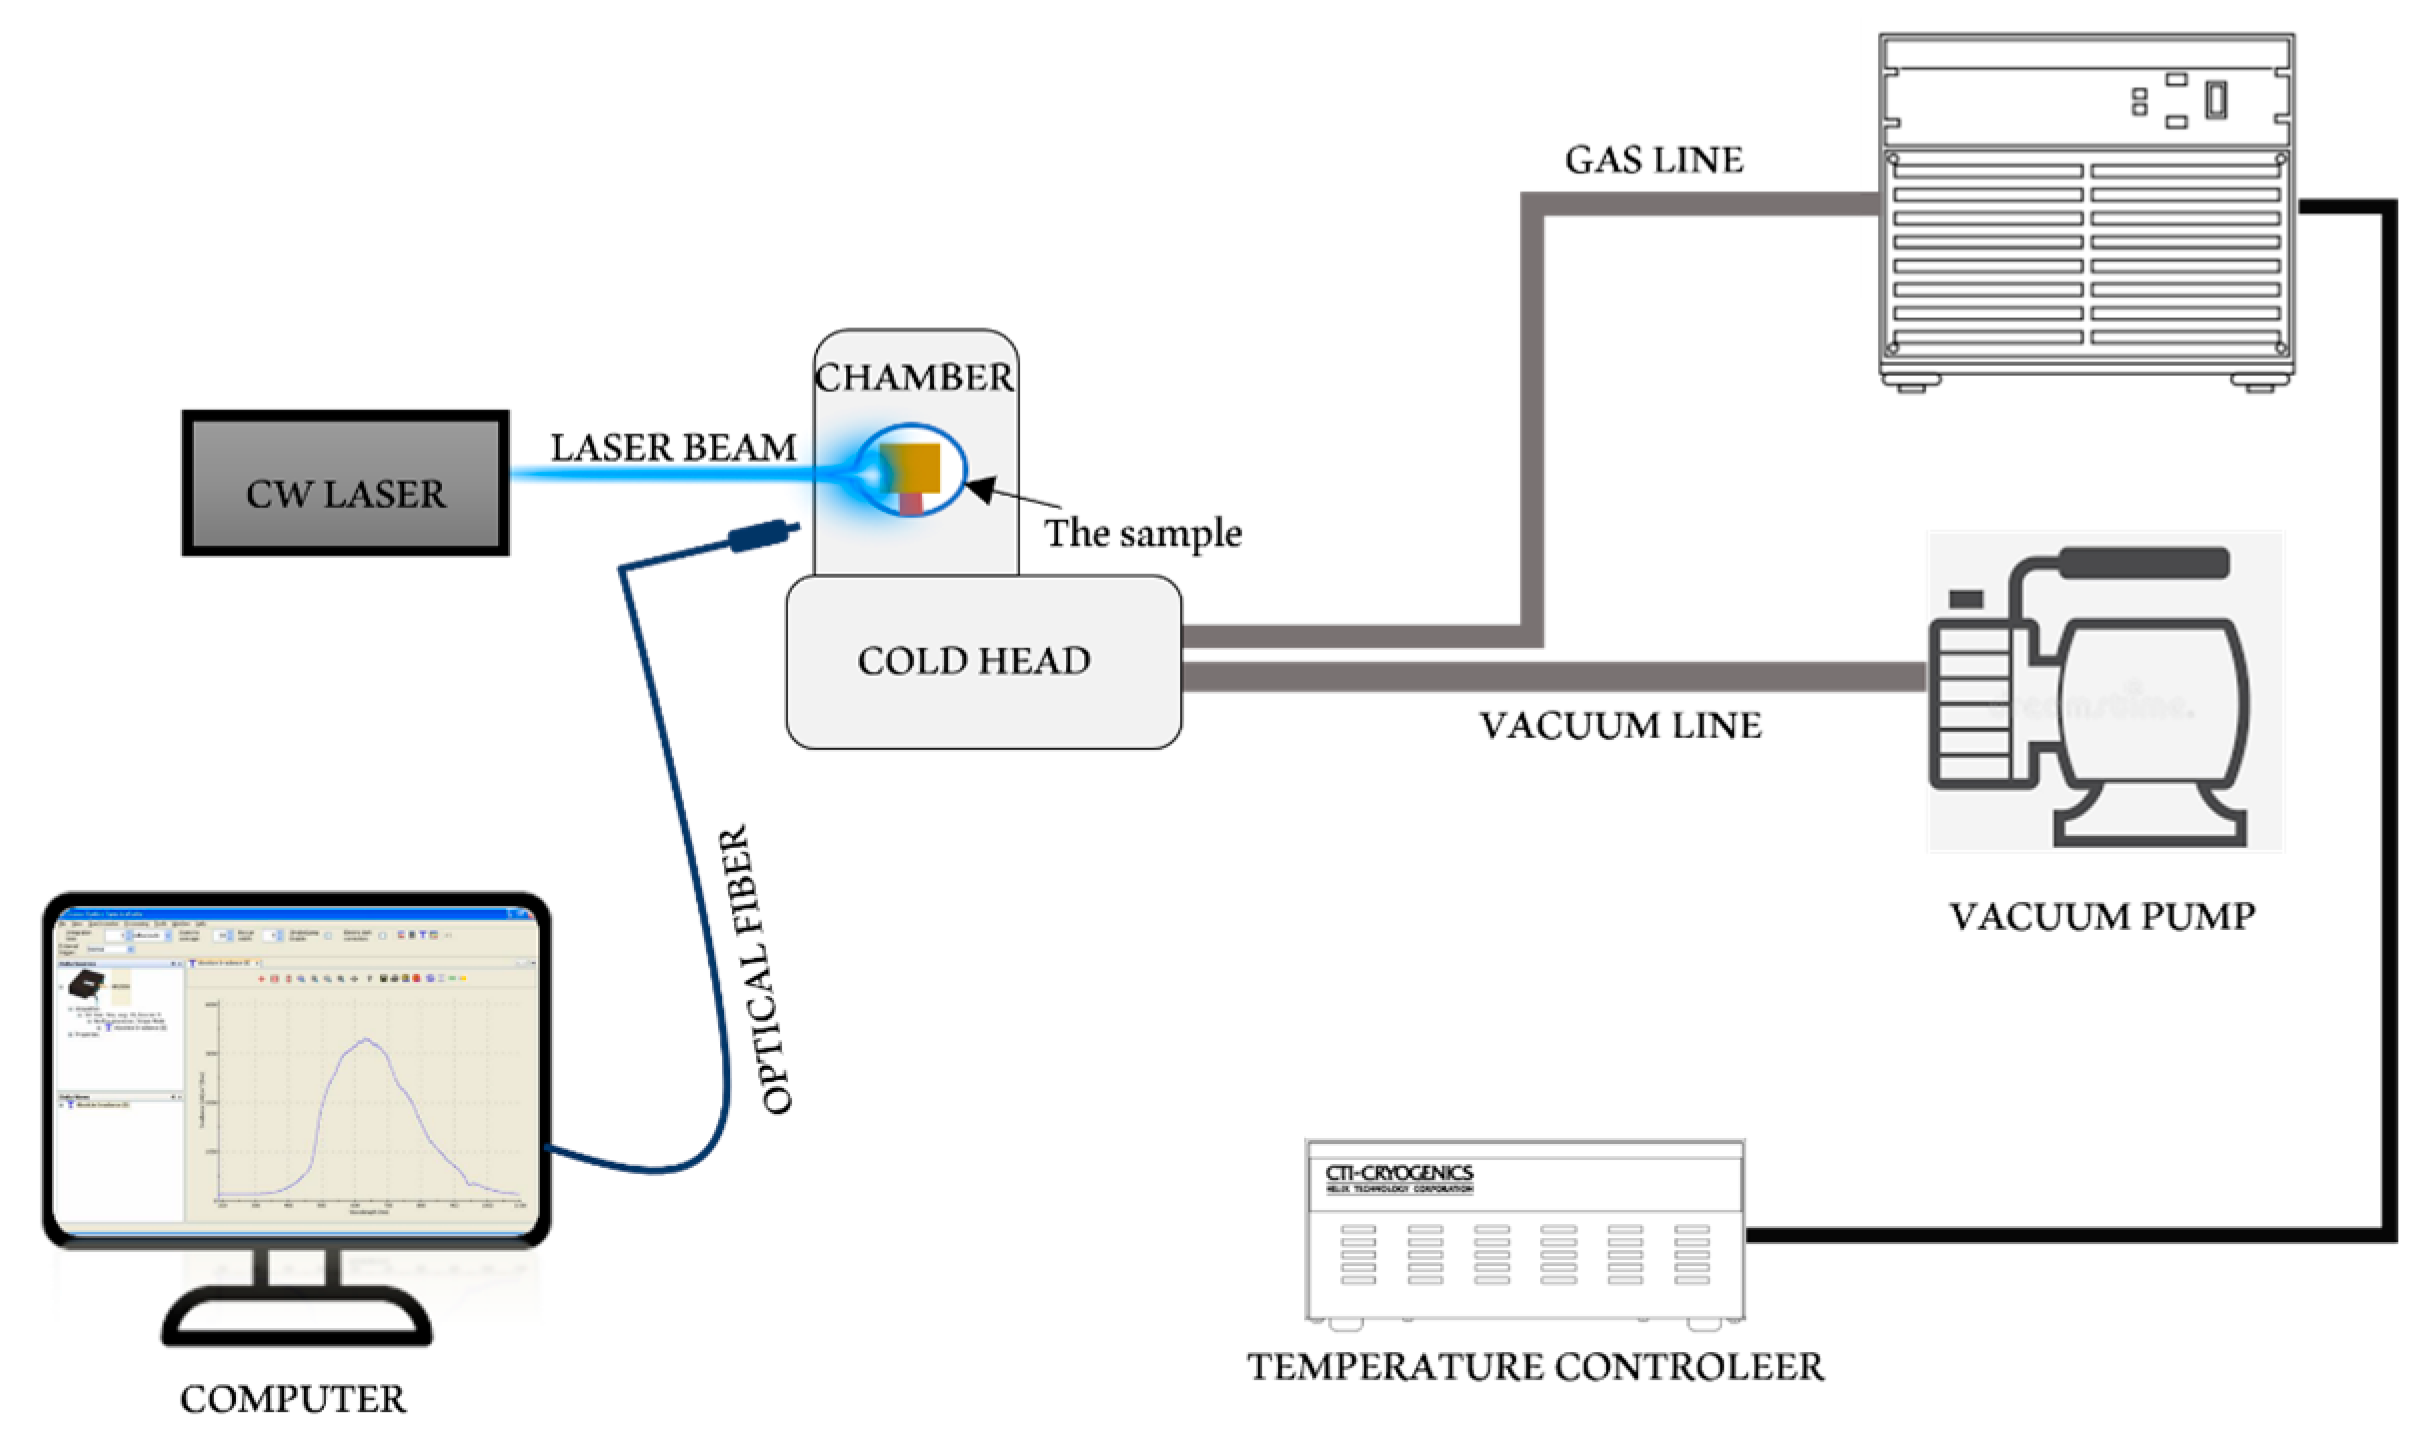
For optical characterization, the absorption spectra of the samples were recorded by an ultraviolet-visible (UV–vis) spectrophotometer (V-670, JASCO, Tokyo, Japan). The PL spectra were obtained by using a fluorescence spectrophotometer (FP-8200, JASCO, Tokyo, Japan) over the wavelength range of 350–800 nm. For temperature-dependent emission, the sample holder temperature was controlled using CTI-Cryogenics (CTI, 8200, Helix Technology Corporation, Mansfield, Massachusetts, USA) over the temperature range of 10–400 K. The sample was placed on a copper sample holder to fit a 1 cm × 1 cm slide and closed by a vacuum shroud. A schematic diagram of the low-temperature measurement setup is shown in Figure 2. The chamber is emptied after the vacuum pump connected to it is turned on, and the pressure reduces to approximately 8 × 10⁻³. The compressor works to cool the environment that surroundings of the sample.
(Cryoudyne Refrigeration System Model 22) and (Lakeshore- Model 325 dual-channel) connected to the cold head and was used in monitoring and controlling the sample temperature. The sample was shined to be excited by continuous wave (CW) laser beam (Vortran Laser Technology, Inc., Rocklin, CA, USA) with a wavelength of 473 ± 5 nm with power controlled remotely to the desired level. The signals emitted by the samples were directed through an optical fiber to a computerized spectrograph (Ocean Optics QE65 Pro spectrograph) based on Spectra Suite Spectroscopy Software to read the data related to the sample PL spectroscopy.

3. Results and Discussion

3.1. Samples Morphology and Crystalline Structure

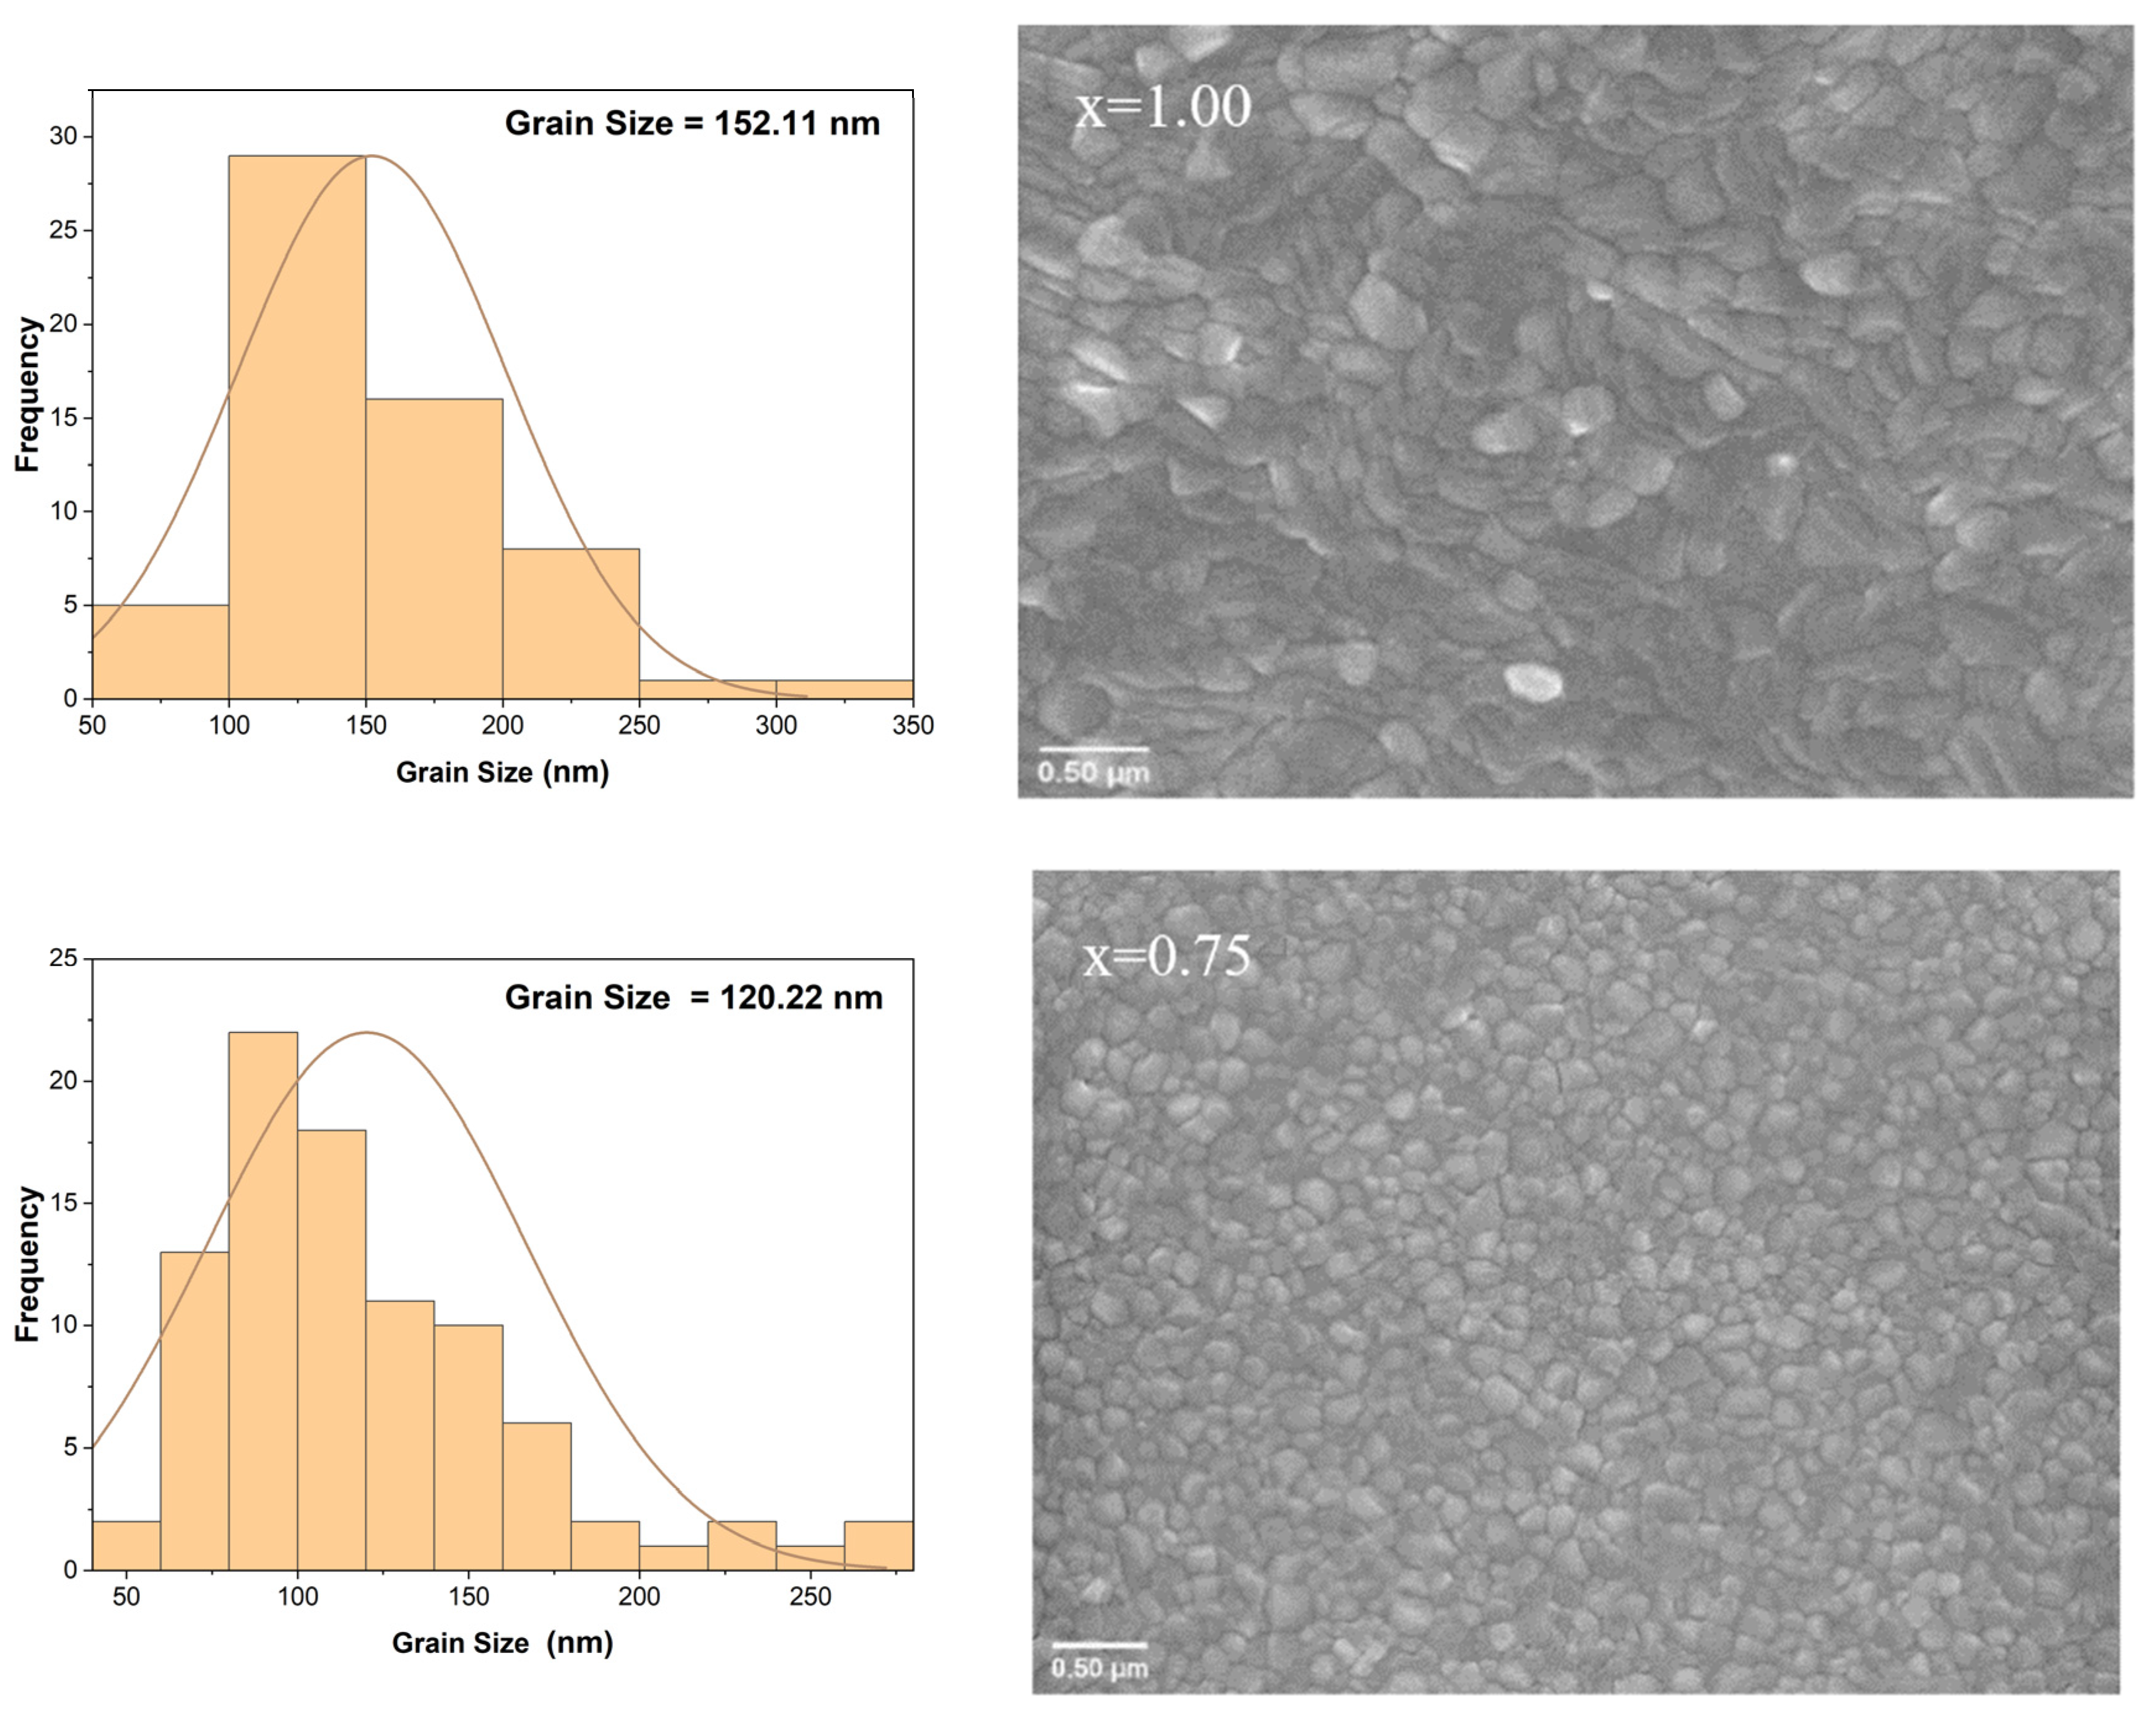
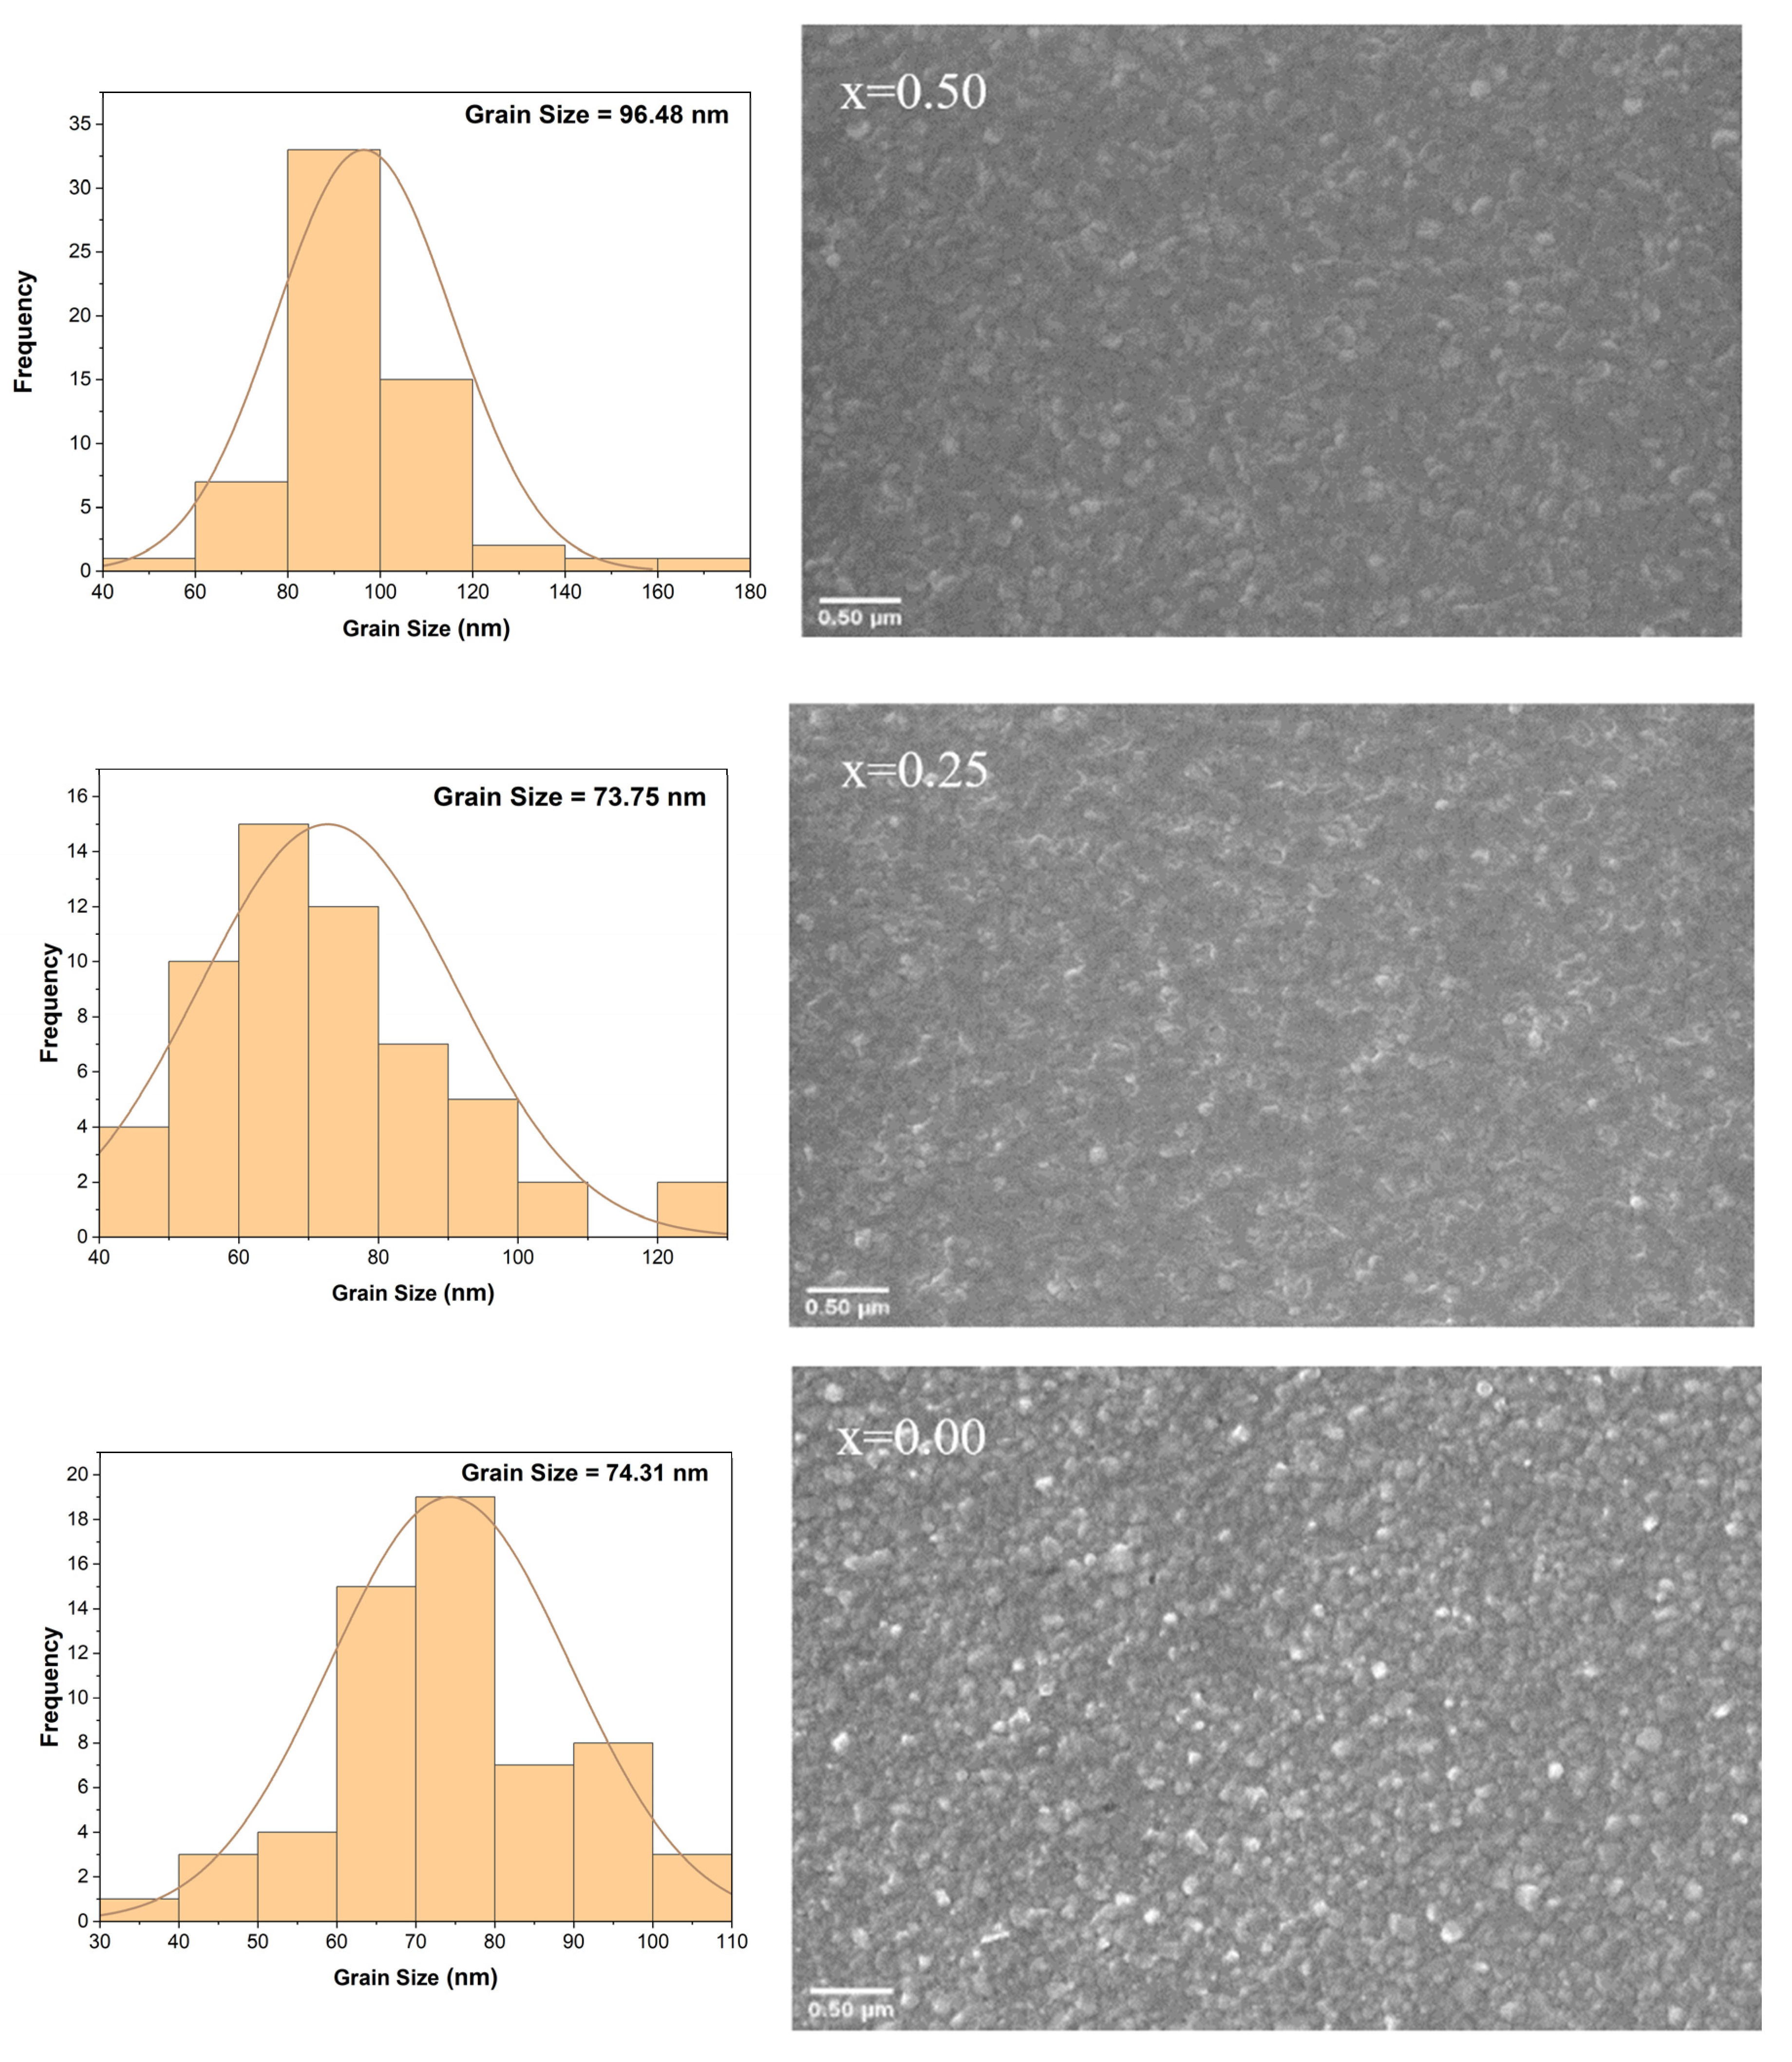
The sample of a surface morphology of prepared thin MAPb(BrxI1−x)3 films is shown in Figure 3. The perovskite material was distributed homogeneously and uniformly of the substrate surface with grains of an average length of 152 nm for MAPbBr3 films. The average grain size appeared to be decreasing with decreasing (x) value. In Figure 3 for instance, the values of (74, 96, 125 nm) correspond to x = (0.25, 0.50, 0.75), respectively. For MAPbI3 perovskite, the average length of ~74 nm could be obtained. Perovskites cover the entire substrate surface completely for all samples prepared without the presence of voids, pits, or cracks.
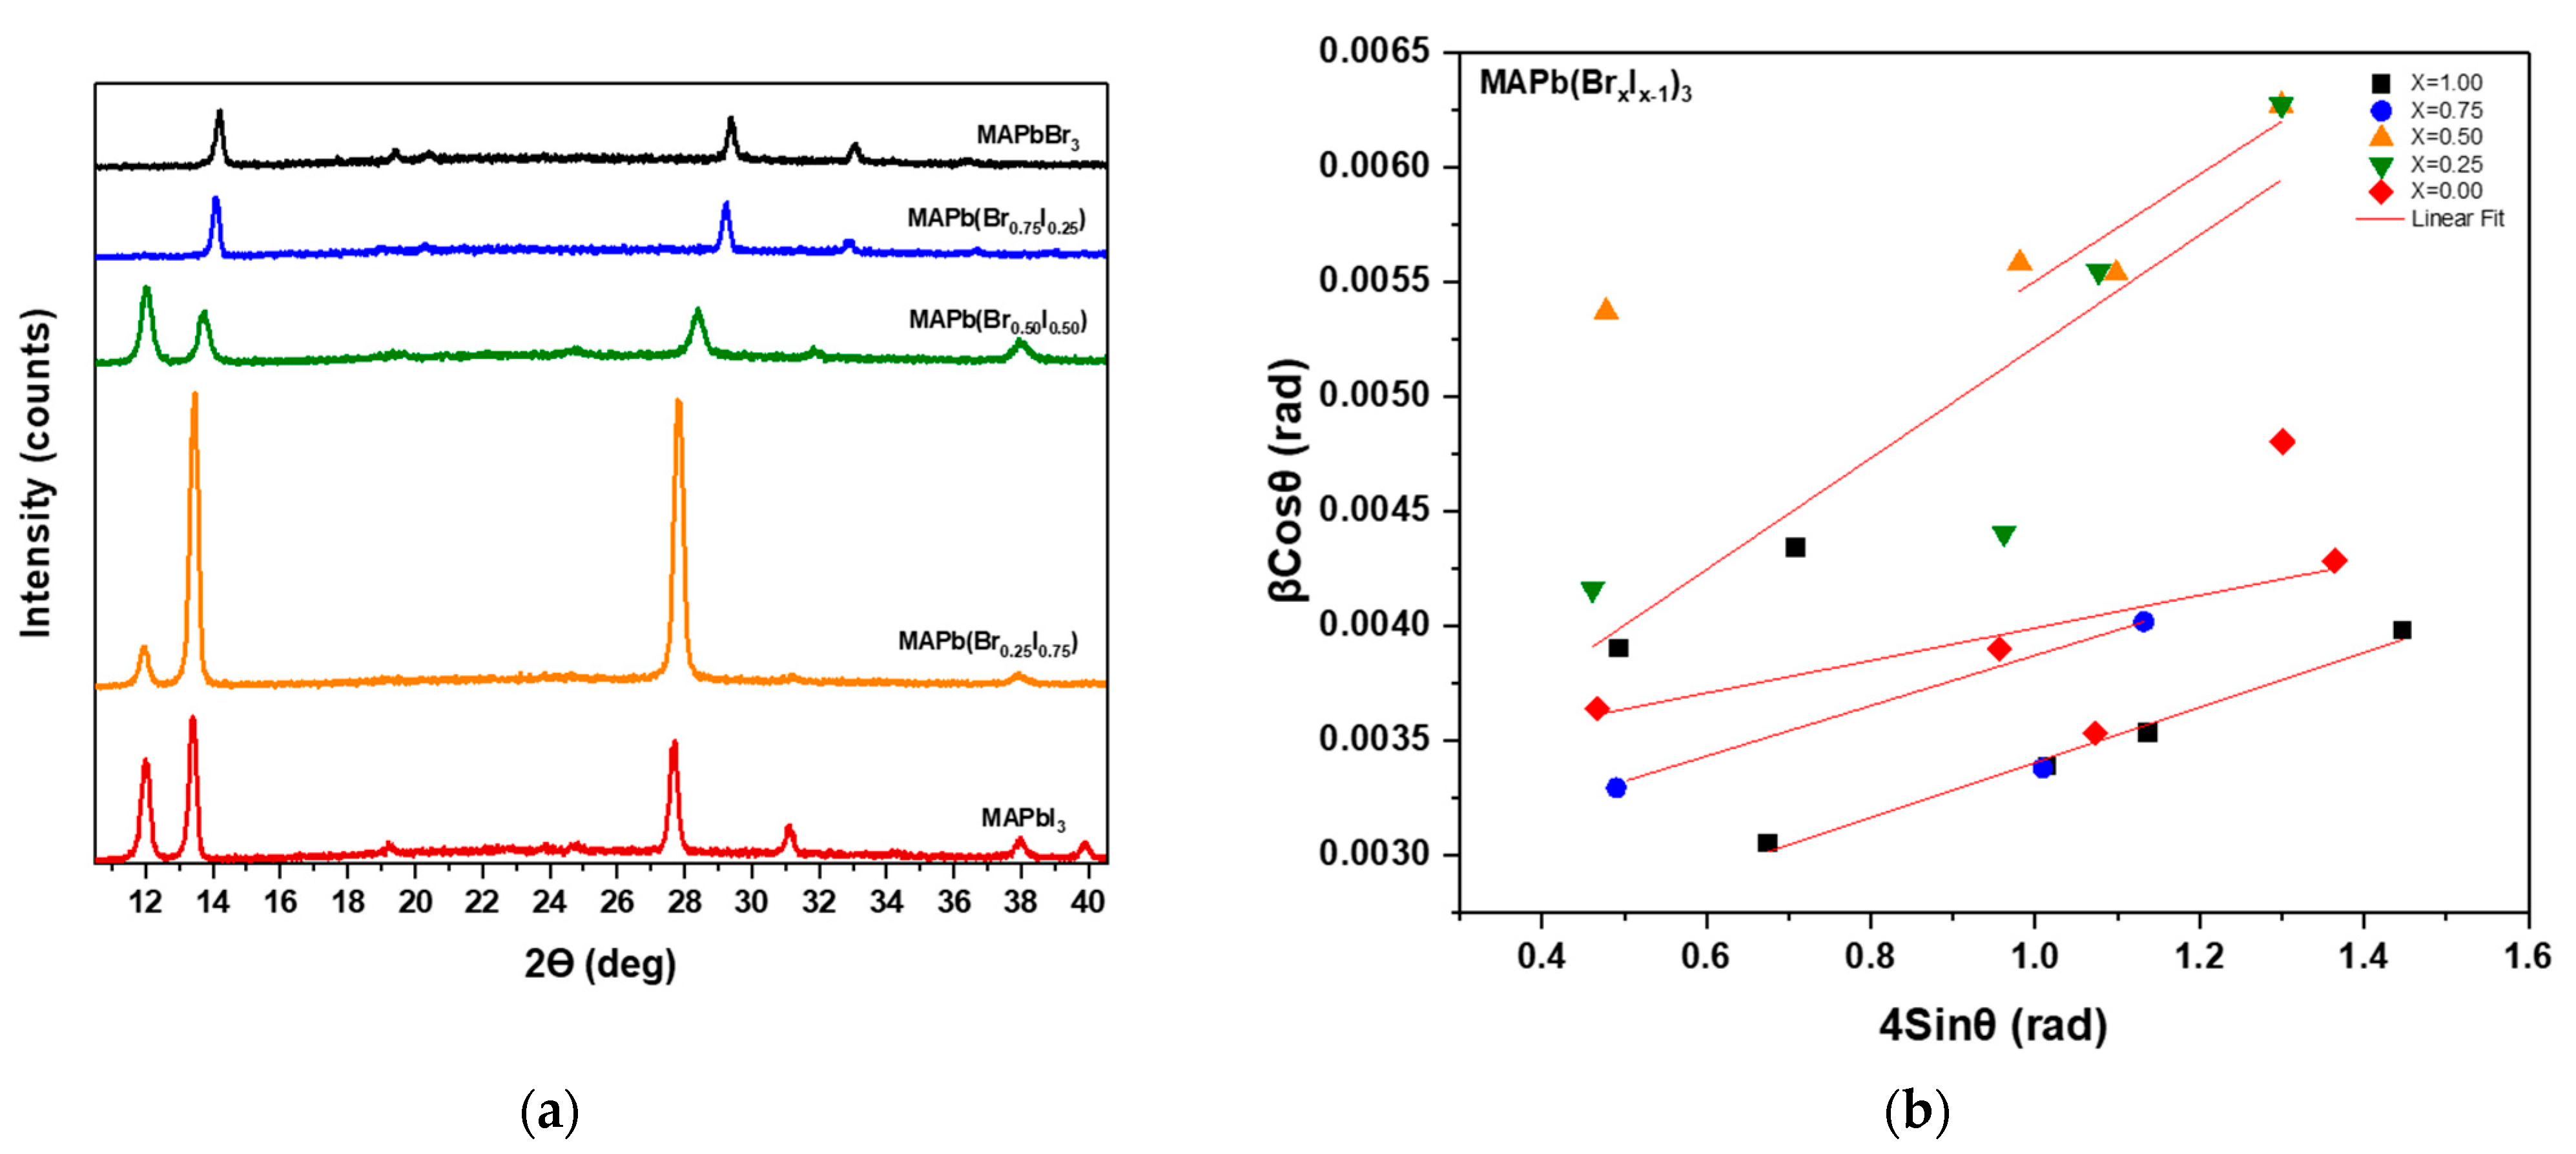
Crystalline structures of MAPb(BrxI1−x)3 has been investigated at various values of x. Figure 4a shows the typical XRD pattern for studied samples at five values of X at room temperature. For MAPbI3 (without Br), the planes (110), (220), and (310) belonging to the tetragonal structure [24], appear at around 2θ~13°, 27°, and 31°, respectively. By increasing the (Br) portion, the lattice parameters were affected, and these lines are getting shifted to appear at 2θ~14.21°, 29.42°, and 33.01°, respectively. Lattice parameters of the phases decrease with the increase in the total amount of bromine. For example, at x = 1.00, 0.75 the values of 2θ were around 14.08°, 29.24°and 32.84° which correspond to (hkl) values of (100), (200), and (210) which belong to cubic phase [25,26,27]. In this situation, the tetragonal superlattice phase disappeared. Values of 2θ and FWHM for each plane in five perovskites structures were tabulated in Table 1.
To estimate the average grain size and strain of the films, a modified version of the Williamson–Hall (W–H) analysis, namely, the Uniform Deformation Model was employed. This model is governed by [28]:
β h k l cos θ = k λ D + 4 ε sin θ  
where, β h k l is the peak broadening, λ is the wavelength of incident radiation, ε is the strain, D is the crystallite size, and k is a constant (~0.9). The dislocation density (δ) is defined by δ = 1 D 2 . The results obtained from Figure 4a and redrawn in Figure 4b according to the W-H plot have been tabulated and listed in Table 2, for the different values of Brx, I1−x compositions. The results show a reduction in the grain size, increase in the lattice strain, and dislocation density as the percentage of I increases.

3.2. Spectral Characteristics

Absorbance, emission, and PL properties were studied for MAPb(BrxI1−x)3 at various values of halides compositions. The absorbance was obtained using Ultraviolet-visible (UV-Vis) spectroscopy at room temperature and shown in Figure 5 from which data were extracted to calculate the direct band-gap energy (Eg) using by the well-known Tauc Plot equation:
α h v γ = A h v E g
where α is the absorption coefficient, A is a proportionality constant. Calculated Eg values are listed in Table 3 Blue shift in the absorption wavelength peaks (excitonic peaks), or increase in Eg value, as the Br percentage increases could be observed.
The normalized emission spectrum was recorded for samples at room temperature. The emission wavelength peak of MAPbI3 appears at around 760 nm and around 530 nm for MAPbBr3; Figure 6, as agrees with others [19,29,30,31]. The peaks of emission for the rest of the samples with mixed halides were located between these two values. The related Eg is listed in Table 3. One could notice that the interval of peak values was not equal, or in other words, does not change systematically with x value. Peak values were aligned to the long wavelength side of the spectrum for the Br-free perovskite sample. This is an indication that the expected and recorded values of x were not very accurate. It means that some quantity of Br, but not I, that was confirmed by Energy-dispersive X-ray spectroscopy (EDX) results.

3.3. Temperature-Dependent of Phase Structure and PL for MAPb(BrxI1−x)3 Perovskites

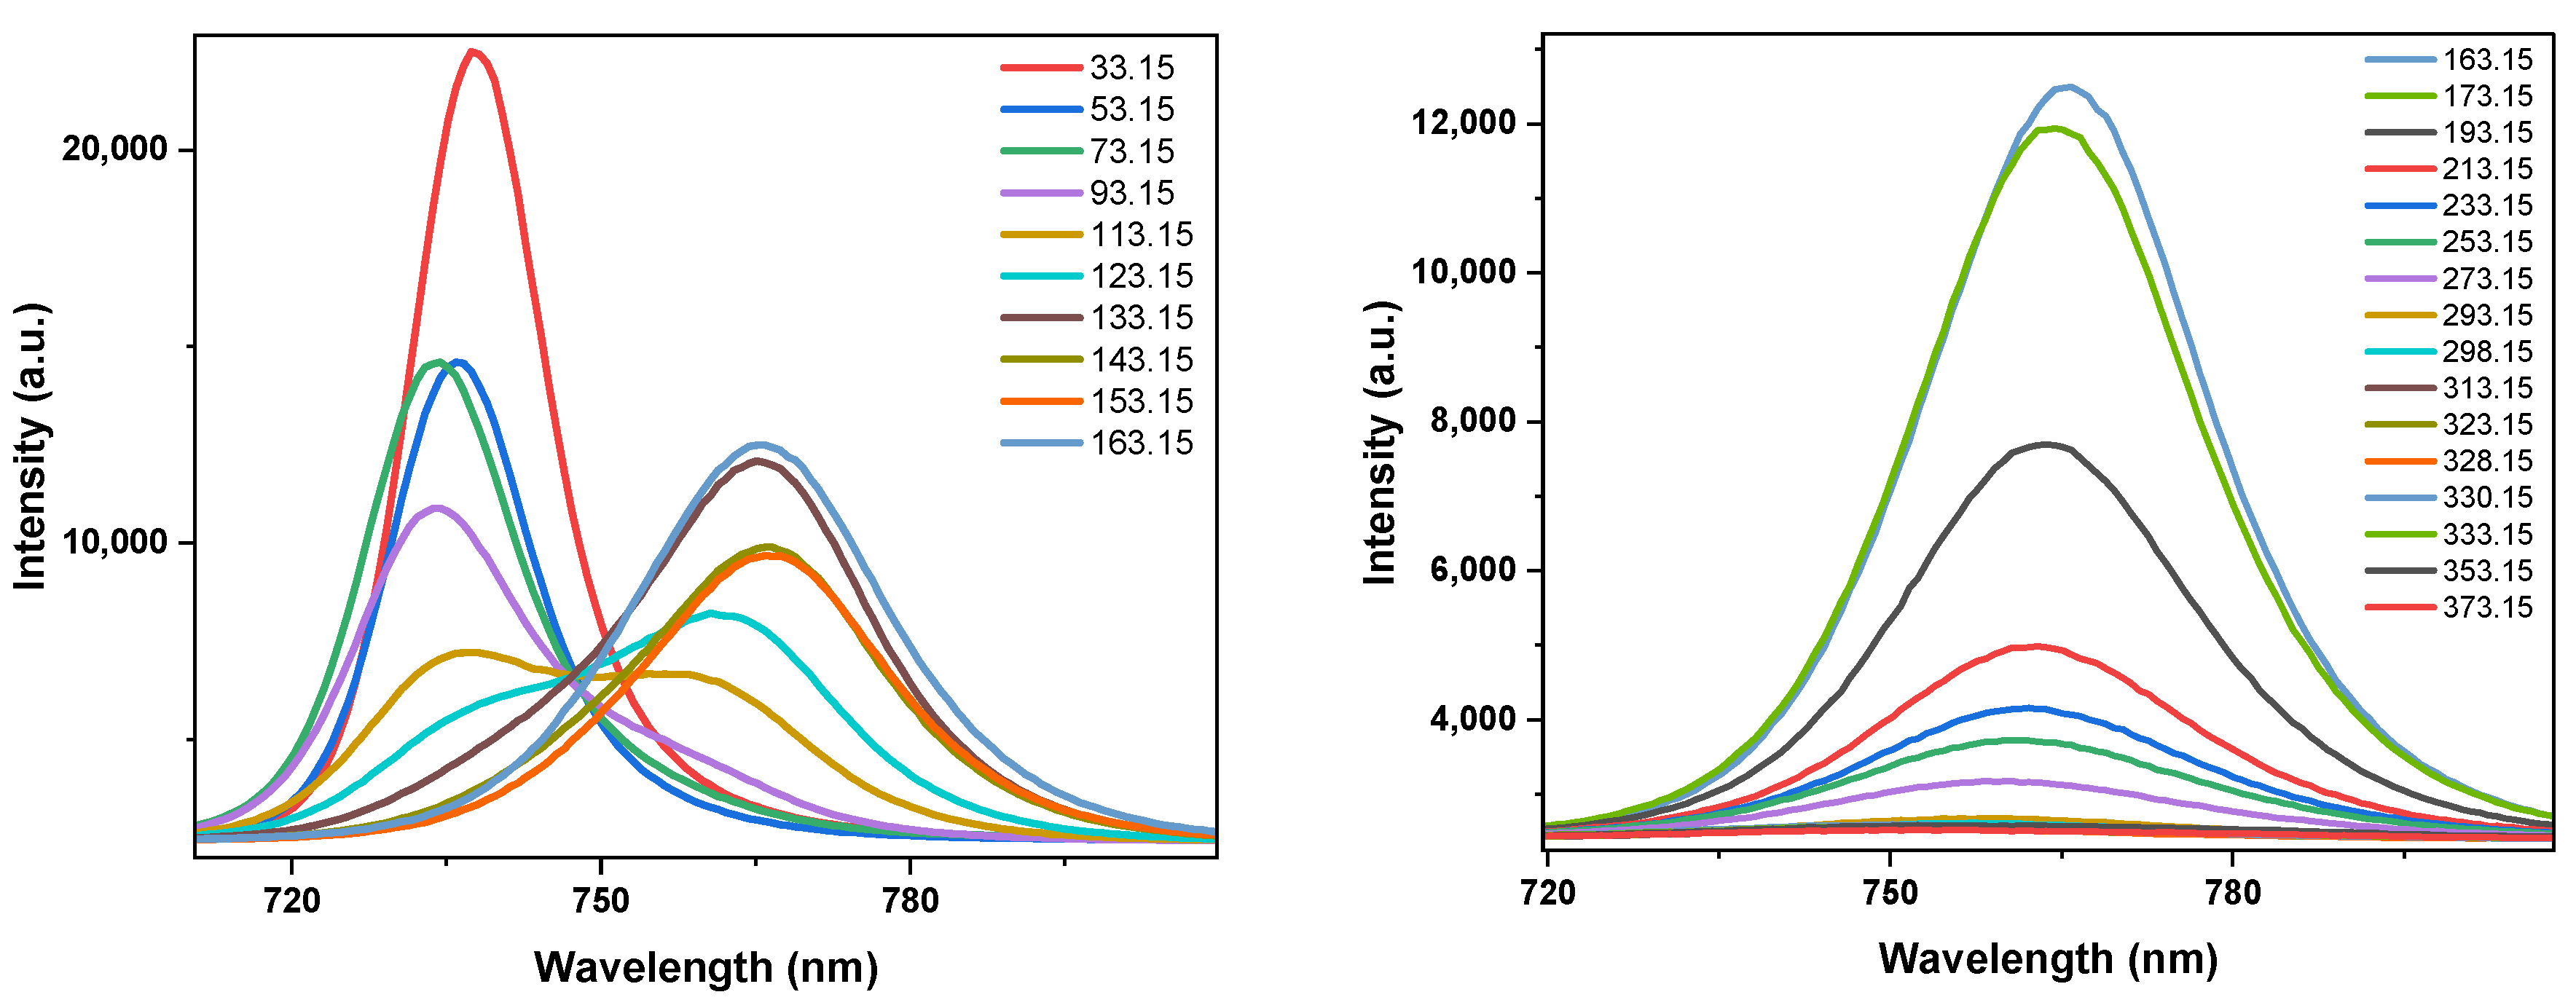
Temperature-dependent PL of MAPb(BrxI1−x)3 has been studied over a wide range of temperature (10–400 K) under a low power density (7.9 mW cm−2) CW laser beam of 473 nm excitation wavelength. Figure 7 shows a sample of PL recorded from MAPb(BrxI1−x)3 within 500–800 nm range of emission wavelength. The samples show an Inverse relationship between emission intensity and temperature, As the temperature increases, the value of the emission intensity decreases. On the other side, lowering temperatures lead to an increase in emissions intensity. The photoluminescence quantum yield (PLQY) with decreasing temperature is increasing, this increase leads to an increase in the intensity value of the PL, and the PLQY value is associated with radiative recombination and non-radiative recombination [32,33]. The charge carriers become less mobile with lower temperature, therefore they are frequently unable to reach the non-radiative recombination centers that are present in perovskite. Instead, they must recombine radiatively which gives rise to an increase in PLQY with decreasing temperature [34,35]. Phonon interactions have an effect on the luminescence and charge transport properties of these perovskites. Overall, the PL peak narrows as the temperature is lowered. It is the result of a decrease in the population of phonons, and therefore less homogenous broadening of the PL due to phonon coupling, as the temperature decrease [35].
The trend of variation in emission wavelength due to the sample’s temperature change does not obey the familiar manner of semiconductors. It was common in semiconductor materials that Eg decreases (result in red shifts of emission) as the temperature increases [36,37]. Whereas in studied perovskites with increasing temperature, blue shifts were observed with no continuity; Figure 8a–e. This unusual behavior was attributed to the stability of the maximum valence band [21] or due to irregular phase transition [21].
MAPbBr3 and MAPbI3 pass through two-phase transitions with a temperature increase: from the orthorhombic to tetragonal phase and then, from the tetragonal to cubic phases. For MAPbI3 and MAPbBr3, the first transition occurs around 150 K while and the second transition for MAPbI3 occurs above room temperature around 330 K. However, MAPbBr3 shows the second transition below room temperature around 230 K. This can occur because of the difference in ionic radius of the two halides [29,36,37,38]. Phase transition can follow by tracking the change in the position of the peak with increasing temperature. In addition, changing in the structural phase will lead to a change in the value of the energy bandgap and a change in the optical properties, which will notably affect the PL spectrum. Therefore, based on PL observations, phase structures could be recognized where the XRD data were used to know the phase type at room temperature, as shown in Figure 4.
Two emission bands have been observed from the MAPbI3 samples at low temperature (<160 K) which was attributed to the coexisting of two (orthorhombic and tetragonal) phases simultaneously. The temperature ranges of the two phases coexisting start at 93 K and end at 156 K as shown in Figure 8a. Below this range, the material was in the orthorhombic phase and beyond that range it was in the tetragonal phase state. This means that there was a gradual transition along with slow wavelength variation of emission as indicated by two simultaneous bands of emission from the same intra-band transition on both sides of the structural phases [35]. Figure 7 shows that the intensity of the peak in the long wavelength band (LWB) will continue to increase as the temperature increases. The peak of the short wavelength band (SWB) decreases until it is no longer apparent, clearly at 133 K. With increasing temperature, a blue shift of SWB can be noticed up to 93 K.
Afterwards, a red shift was observed with heating the sample more until LWB starts glowing. Over this transition region, both SWB and LWB show a red shift as the temperature increases which agrees with other studies [16,21,37]. It is worth mentioning that a blue shift in the LWB maxima starts to occur after reaching 163 K of heating. It is expected that the LWB may be attributed to the tetragonal phase regime and the SWB to the orthorhombic phase. Therefore, the tetragonal phase dominates after the temperature exceeds 163 K. A blue shift in the LWB emission continues with increasing the temperature up to 330 K after which a red-shift occurs as the temperature reaches 350 K followed by blue shift again [1]. Over the red shift range (330–350 K), a transition from tetragonal phase state to the cubic one was expected.
For the MAPbBr3 sample, the blue shift was observed as the temperature increases up to 157 K. Some fluctuation in the emission wave length was observed over a small range of temperature (157–163 K) which could be attributed to the beginning of the transition from the orthorhombic to the tetragonal phase of structure which was in agreement with others’ studies [19,20,30,39,40]. A red shift in the emission appeared again over the temperature range of 257–317 K during which the structure started to take the cubic shape.
For MAPb(BrxI1−x)3, perovskites with mixed I and Br halides, the phase transition from the orthorhombic to the tetragonal phase occurs over the temperature range (120–160) K depending on the portion (x) value, Figure 8c–e. The phase transition from the tetragonal to the Cubic phase occurs over the temperature range (290–318) K. It is summarized in Table 4. Generally speaking, the addition of more Bromine (increase x) to the MAPb(BrxI1−x)3 results in reduced phase transformation temperature. MAPbI3 and MAPbBr3 shared the temperature transition from the tetragonal to the orthorhombic phase, but the mixture of bromine and iodine in perovskite led to a transition degree below 163 K. For the second transformation from the tetragonal to the cubic phase, the increase in bromine in MAPb(BrxI1−x)3 led to a decrease in the degree temperature of transformation, as shown in Table 4.

3.4. Activation Energy

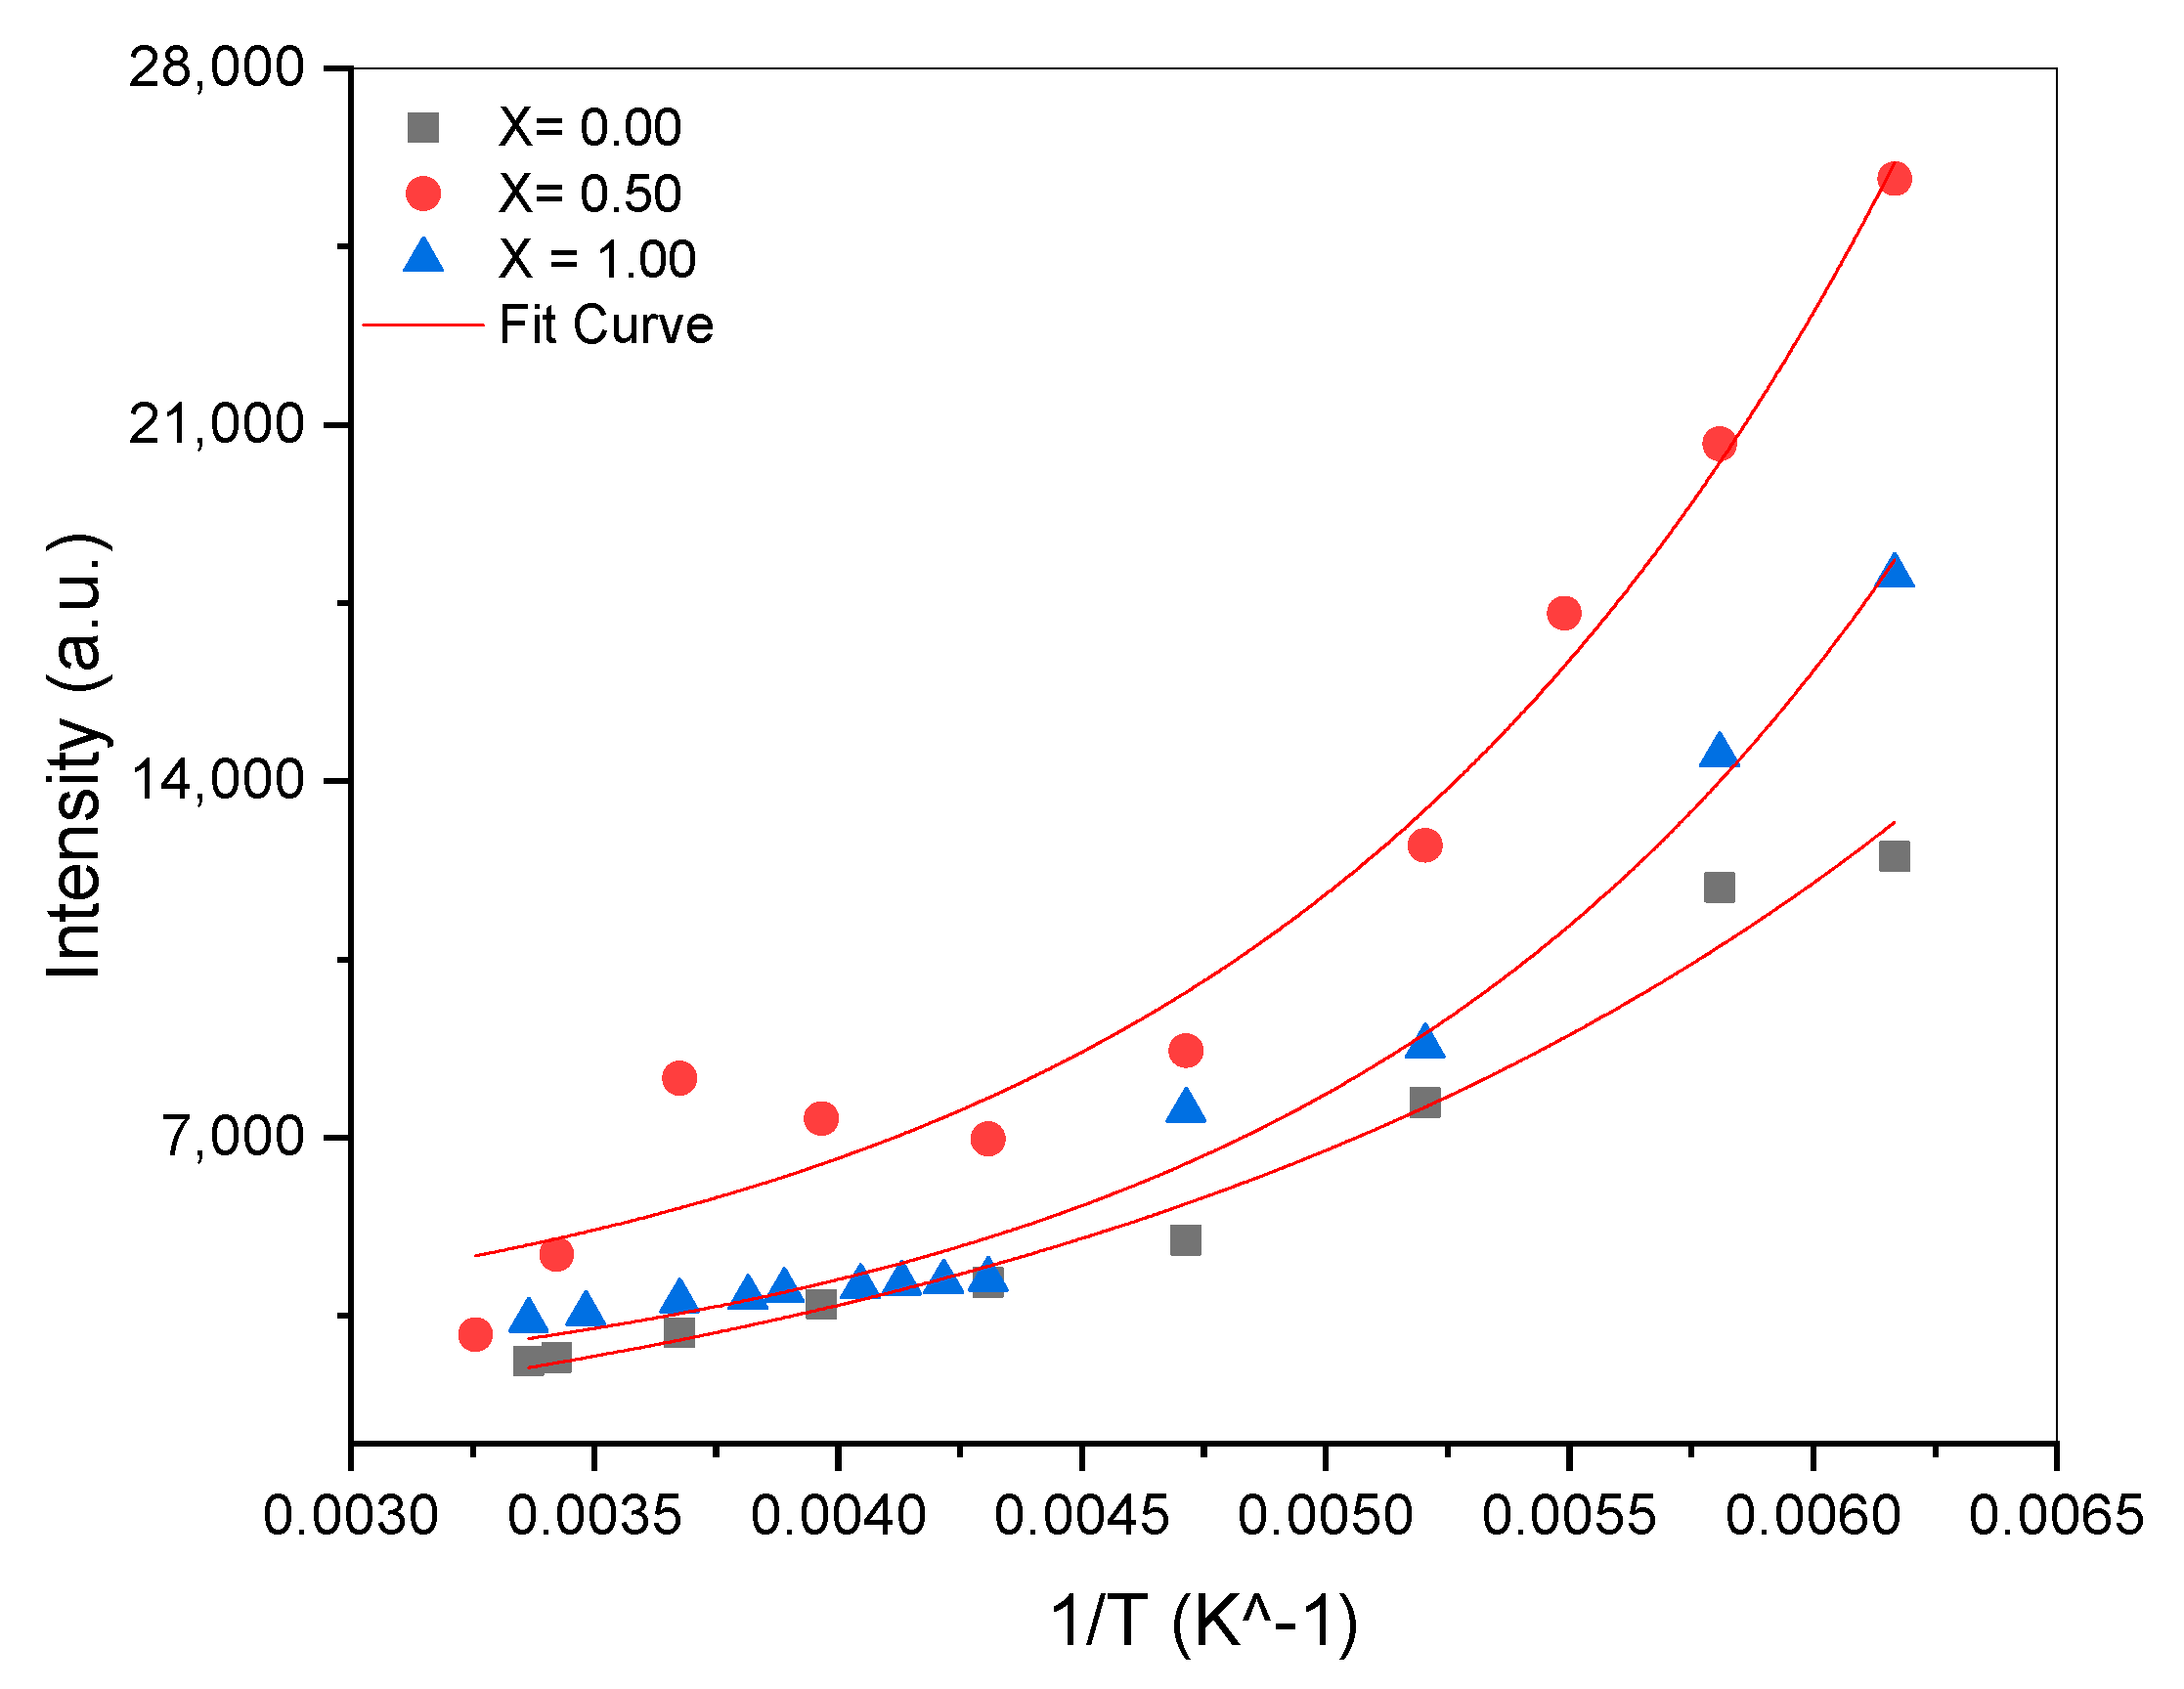
Activation Energy (Ea) is the minimum amount of energy that must be provided to lead active atoms or molecules in the materials to undergo a chemical or physical reaction. The activation energy of different perovskite samples varies due to several reasons, including the difference in the structural phase with different external factors, the difference in the particle size of the film [41], and the difference in the temperature range. The Ea of MAPbI3 in the tetragonal phase is 20 meV and increases to 200 meV in the cubic phase [1], where [40] concludes the value around 150 K is 29 meV for MAPbI3 and 38 meV for MAPbBr3. Another study calculated 65 meV for bulk [42] and 86.6 meV for a single crystal [43]. For CsPbBr3 nanocrystals (NCs), Ea is 63.9 meV and decreases with increases the size of NCs to be 54.7, 43 and 35 meV [44]. Table 5 shows the values of Ea for some of the studied samples. An increase in Ea could be noticed as the portion of Br increases. This observation is consistent with the values of energy band gap. By temperature dependence of the integrated PL, emission intensities can be fitted using the Arrhenius equation [45].
I T = I 0 1 + A e x p E a k B T
where I0 is the PL intensity at the lowest temperature and kB is the Boltzmann constant. PL intensity is plotted as a function of temperature and calculated as the activation energy by the Arrhenius equation fitted. The resulting figures found from the above equation were plotted in Figure 9.
As it is expected that the increase in bromine will lead to an increase in the value of Ea, this agrees with our results shown in Table 5.
Finally, parameter verification, optimization, and modification are fundamental to learning how to exploit the material’s advantages in various applications. This paper provides an overview of MAPb(BrxI1−x)3 band gap expansion and activation energy change with anion ratio change between (Br, I), which aids in understanding halide perovskite and future development in this field. The thermal evaporation method of preparation yields high-quality nanocrystal films with no difficulties in preparation and no need for any solvent, facilitating their manufacture for different applications. Determining the type and percentage of the anion (x) helps to broaden the range of absorption and emission spectra, giving better efficiency in using it—for example, as sensors in solar cells with low energy consumption or use as active layers in photodetectors (highly efficient and polarization sensitive)—by taking advantage of the large absorption coefficients of perovskite that are controlled by the type and ratio of anion.

4. Conclusions

The obtained results of temperature (18 to 373 K) dependence of PL for MAPb(BrxI1−x)3 perovskites showed wide range of emission wavelengths: 500–800 nm with a decrease in PL intensity as the temperature increases. The phase transitions go along with temperatures variation for studied films, have been studied. The effects of anion replacement in MAPb(BrxI1−x)3 on phase transitions with temperature changes have been investigated. In general, there were two phase transitions for MAPb(BrxI1−x)3 samples. One transition occurred below room temperature (orthorhombic to tetragonal) and the other occurred above room temperature (tetragonal to cubic) at X = 0, 0.25, and 0.50, down room temperature at X= 0.75 and 1.00. The temperature needed for such transitions can be controlled by varying the value of x (ratio of I to Br). In contrast to other semiconductor material, blue shifts in the emission wavelength were observed in the studied materials. A red shift could be noticed over the range of phase transition temperature. Over this range, a dual wavelength of emission was observed of MAPbI3. In addition, by the different ratios of X, the value of the activation energy of the perovskite changes, which increases with the increase in bromine. Therefore, the determination of a suitable halide component for a perovskite for controlling the phase structure, with temperature and activation energy value, helps to benefit these materials in photovoltaics or light-emitting devices.

Author Contributions

Conceptualization, H.S.B. and S.M.H.Q.; methodology, H.S.B. and S.M.H.Q. software, S.M.H.Q.; validation, S.M.H.Q. and H.S.B.; formal analysis, H.S.B.; investigation, H.S.B., S.M.H.Q., H.M.G., K.K.A., A.F.B.A. and A.S.A.; resources, H.S.B. and S.M.H.Q.; data curation, H.S.B.; writing—original draft preparation, H.S.B., S.M.H.Q., and A.S.A.; writing—review and editing, H.S.B., A.S.A., S.M.H.Q., H.M.G., K.K.A., and A.F.B.A.; visualization, H.S.B.; supervision, S.M.H.Q., and A.S.A.; project administration, A.S.A.; funding acquisition, A.S.A. All authors have read and agreed to the published version of the manuscript.

Funding

This research received no external funding.

Acknowledgments

The authors thank the researchers supporting project number (RSP2022R445), King Saud University, Riyadh, Saudi Arabia.

Conflicts of Interest

The authors declare no conflict of interest.

References

  1. Milot, R.L.; Eperon, G.E.; Snaith, H.J.; Johnston, M.B.; Herz, L.M. Temperature-Dependent Charge-Carrier Dynamics in CH3NH3PbI3 Perovskite Thin Films. Adv. Funct. Mater. 2015, 25, 6218–6227. [Google Scholar] [CrossRef] [Green Version]
  2. Wang, H.; Zhou, M.; Luo, H. Electric-Field-Induced Dynamic Electronic Junctions in Hybrid Organic–Inorganic Perovskites for Optoelectronic Applications. ACS Omega 2018, 3, 1445–1450. [Google Scholar] [CrossRef] [PubMed] [Green Version]
  3. Ghaithan, H.M.; Qaid, S.M.H.; Alharbi, K.K.; Bin Ajaj, A.F.; Al-Asbahi, B.A.; Aldwayyan, A.S. Amplified Spontaneous Emission from Thermally Evaporated High-Quality Thin Films of CsPb(Br1- xYx)3(Y = I, Cl) Perovskites. Langmuir 2022, 38, 8607–8613. [Google Scholar] [CrossRef]
  4. Al-Asbahi, B.A.; Qaid, S.M.; Hezam, M.; Bedja, I.; Ghaithan, H.M.; Aldwayyan, A.S. Effect of deposition method on the structural and optical properties of CH3NH3PbI3 perovskite thin films. Opt. Mater. 2020, 103, 109836. [Google Scholar] [CrossRef]
  5. Verduci, R.; Romano, V.; Brunetti, G.; Yaghoobi Nia, N.; Di Carlo, A.; D’Angelo, G. Solar Energy in Space Applications: Review and Technology Perspectives. Adv. Energy Mater. 2022, 12, 2200125. [Google Scholar] [CrossRef]
  6. Bhalla, A.; Guo, R.; Roy, R. The perovskite structure—A review of its role in ceramic science and technology. Mater. Res. Innov. 2000, 4, 3–26. [Google Scholar] [CrossRef]
  7. Stoumpos, C.C.; Malliakas, C.D.; Kanatzidis, M.G. Semiconducting Tin and Lead Iodide Perovskites with Organic Cations: Phase Transitions, High Mobilities, and Near-Infrared Photoluminescent Properties. Inorg. Chem. 2013, 52, 9019–9038. [Google Scholar] [CrossRef]
  8. Zhou, Y.; Chen, J.; Bakr, O.M.; Sun, H.-T. Metal-Doped Lead Halide Perovskites: Synthesis, Properties, and Optoelectronic Applications. Chem. Mater. 2018, 30, 6589–6613. [Google Scholar] [CrossRef] [Green Version]
  9. Li, C.; Lu, X.; Ding, W.; Feng, L.; Gao, Y.; Guo, Z. Formability of ABX3 (X = F, Cl, Br, I) halide perovskites. Acta Cryst. Sect. B Struct. Sci. 2008, 64, 702–707. [Google Scholar] [CrossRef]
  10. Ghaithan, H.M.; Qaid, S.M.H.; Alahmed, Z.A.; Hezam, M.; Lyras, A.; Amer, M. Anion Substitution Effects on the Structural, Electronic, and Optical Properties of Inorganic CsPb(I1-xBrx)3 and CsPb(Br1-xClx)3 Perovskites: Theoretical and Experimental Approaches. J. Phys. Chem. C 2021, 125, 886–897. [Google Scholar] [CrossRef]
  11. Whitcher, T.J.; Gomes, L.C.; Zhao, D.; Bosman, M.; Chi, X.; Wang, Y.; Carvalho, A.; Hui, H.K.; Chang, Q.; Breese, M.B.H.; et al. Dual phases of crystalline and electronic structures in the nanocrystalline perovskite CsPbBr3. NPG Asia Mater. 2019, 11, 70. [Google Scholar] [CrossRef] [Green Version]
  12. Qaid, S.M.H.; Ghaithan, H.M.; Al-Asbahi, B.A.; Aldwayyan, A.S. Tuning of amplified spontaneous emission wavelength for green and blue light emission through the tunable composition of cspb(Br1-xClx)3 inorganic perovskite quantum dots. J. Phys. Chem. C 2021, 125, 9441–9452. [Google Scholar] [CrossRef]
  13. Park, B.W.; Seok, S.I. Intrinsic Instability of Inorganic–Organic Hybrid Halide Perovskite Materials. Adv. Mater. 2019, 31, 1805337. [Google Scholar] [CrossRef]
  14. McGovern, L.; Futscher, M.H.; Muscarella, L.A.; Ehrler, B. Understanding the Stability of MAPbBr3 versus MAPbI3: Suppression of Methylammonium Migration and Reduction of Halide Migration. J. Phys. Chem. Lett. 2020, 11, 7127–7132. [Google Scholar] [CrossRef]
  15. Chen, Q.; De Marco, N.; Yang, Y.; Song, T.-B.; Chen, C.-C.; Zhao, H.; Hong, Z.; Zhou, H.; Yang, Y. Under the spotlight: The organic–inorganic hybrid halide perovskite for optoelectronic applications. Nano Today 2015, 10, 355–396. [Google Scholar] [CrossRef] [Green Version]
  16. Dar, M.I.; Jacopin, G.; Meloni, S.; Mattoni, A.; Arora, N.; Boziki, A.; Zakeeruddin, S.M.; Rothlisberger, U.; Grätzel, M. Origin of unusual bandgap shift and dual emission in organic-inorganic lead halide perovskites. Sci. Adv. 2016, 2, e1601156. [Google Scholar] [CrossRef] [PubMed] [Green Version]
  17. Whitfield, P.S.; Herron, N.; Guise, W.E.; Page, K.; Cheng, Y.Q.; Milas, I.; Crawford, M.K. Structures, Phase Transitions and Tricritical Behavior of the Hybrid Perovskite Methyl Ammonium Lead Iodide. Sci. Rep. 2016, 6, 35685. [Google Scholar] [CrossRef] [PubMed] [Green Version]
  18. Jiang, Y.; Soufiani, A.M.; Gentle, A.; Huang, F.; Ho-Baillie, A.; Green, M.A. Temperature dependent optical properties of CH3NH3PbI3 perovskite by spectroscopic ellipsometry. Appl. Phys. Lett. 2016, 108, 61905. [Google Scholar] [CrossRef]
  19. Chen, C.; Hu, X.; Lu, W.; Chang, S.; Shi, L.; Li, L.; Zhong, H.; Han, J. Elucidating the phase transitions and temperature-dependent photolu-minescence of MAPbBr3 single crystal. J. Phys. D Appl. Phys. 2018, 51, 45105. [Google Scholar] [CrossRef]
  20. Lehmann, F.; Franz, A.; Daniel, M.T.; Levcenco, S.; Unold, T.; Taubert, A.; Schorr, S. The phase diagram of a mixed halide (Br, I) hybrid perovskite obtained by synchrotron X-ray. RSC Adv. 2019, 9, 11151–11159. [Google Scholar] [CrossRef]
  21. Kong, W.; Ye, Z.; Qi, Z.; Zhang, B.; Wang, M.; Rahimi-Iman, A.; Wu, H. Photoluminescence behavior upon crystal-phase. Phys. Chem. Chem. Phys. 2015, 17, 16405–16411. [Google Scholar] [CrossRef] [PubMed]
  22. Park, S.; Seo, Y.-S.; Ahn, C.W.; Woo, W.S.; Kyhm, J.; Lee, S.A.; Kim, I.W.; Hwang, J. Temperature-dependent optical properties of hybrid organic–inorganic perovskite single crystals (CH3NH3PbI3 and CH3NH3PbBr3). J. Phys. D Appl. Phys. 2019, 52, 335302. [Google Scholar] [CrossRef]
  23. Schötz, K.; Askar, A.M.; Köhler, A.; Shankar, K.; Panzer, F. Investigating the Tetragonal-to-Orthorhombic Phase Transition of Methylammonium Lead Iodide Single Crystals by Detailed Photoluminescence Analysis. Adv. Opt. Mater. 2020, 8. [Google Scholar] [CrossRef]
  24. Qaid, S.M.H.; Ghaithan, H.M.; Al-Asbahi, B.A.; Aldwayyan, A.S. Solvent Effects on the Structural and Optical Properties of MAPbI3 Perovskite Thin Film for Photovoltaic Active Layer. Coatings 2022, 12, 549. [Google Scholar] [CrossRef]
  25. Fan, P.; Gu, D.; Liang, G.-X.; Luo, J.-T.; Chen, J.-L.; Zheng, Z.-H.; Zhang, D.-P. High-performance perovskite CH3NH3PbI3 thin films for solar cells prepared by single-source physical vapour deposition. Sci. Rep. 2016, 6, 29910. [Google Scholar] [CrossRef] [Green Version]
  26. Shen, H. Materials Defect step controlled growth of perovskite MAPbBr3 single crystal. J. Mater. Sci. 2019, 54, 11596–11603. [Google Scholar] [CrossRef]
  27. Fru, J.N.; Nombona, N.; Diale, M. Characterization of Thin MAPb(I1–xBrx)3 Alloy Halide Perovskite Films Prepared by Sequential Physical Vapor Deposition. Front. Energy Res. 2021, 9, 196. [Google Scholar] [CrossRef]
  28. Nath, D.; Singh, F.; Das, R. X-ray diffraction analysis by Williamson-Hall, Halder-Wagner and size-strain plot methods of CdSe nanoparticles- a comparative study. Mater. Chem. Phys. 2019, 239, 122021. [Google Scholar] [CrossRef]
  29. Saxena, R.; Kangsabanik, J.; Kumar, A.; Shahee, A.; Singh, S.; Jain, N.; Ghorui, S.; Kumar, V.; Mahajan, A.V.; Alam, A.; et al. Contrasting temperature dependence of the band gap in CH3NH3PbX3( X = I, Br, Cl ): Insight from lattice dilation and electron-phonon coupling. Phys. Rev. B 2020, 102, 81201. [Google Scholar] [CrossRef]
  30. Liu, Y.; Lu, H.; Niu, J.; Zhang, H.; Lou, S.; Gao, C.; Zhan, Y.; Zhang, X.; Jin, Q.; Zheng, L. Temperature-dependent photoluminescence spectra and decay dynamics of MAPbBr3 and MAPbI3 thin films. AIP Adv. 2018, 8, 095108. [Google Scholar] [CrossRef]
  31. Qaid, S.M.; Al Sobaie, M.S.; Khan, M.M.; Bedja, I.M.; Alharbi, F.H.; Nazeeruddin, M.K.; Aldwayyan, A.S. Band-gap tuning of lead halide perovskite using a single step spin-coating deposition process. Mater. Lett. 2015, 164, 498–501. [Google Scholar] [CrossRef]
  32. Pereira, L.; Ferreira, I.; Thomaz, M.P. Temperature effects on fluorescence quantum efficiency of 9,10-diphenylanthracene. J. Photochem. 1978, 9, 363–367. [Google Scholar] [CrossRef] [Green Version]
  33. An, P.; Thomson, S.; Tesa, M.; Gakamsky, A. Temperature-Dependent Absolute Photoluminescence Quantum Yield Measure-ments of a Halide Perovskite Temperature-Dependent Absolute Photoluminescence Quantum Yield Measurements of a Halide Perovskite. Edinburgh Instruments; Edinburgh Instruments: Livingston, UK, 2018; pp. 2–5. [Google Scholar]
  34. Agrawal, G.P.; Dutta, N.K. Recombination Mechanisms in Semiconductors. Long-Wavel. Semicond Lasers 1986, 70–141. [Google Scholar]
  35. Wehrenfennig, C.; Liu, M.; Snaith, H.J.; Johnston, M.B.; Herz, L.M. Charge carrier recombination channels in the low-temperature phase of organic-inorganic lead halide perovskite thin films. APL Mater. 2014, 2, 081513. [Google Scholar] [CrossRef]
  36. Phys, J.C.; Yamaguchi, A.; Uehara, R.; Yasuhara, S.; Hoshina, T.; Miyauchia, M. Temperature dependence on bandgap of semiconductor photocatalysts Temperature dependence on bandgap of semiconductor photocatalysts. J. Chem. Phys. 2020, 152, 231101. [Google Scholar]
  37. Guha, S.; Rice, J.D.; Yau, Y.T.; Martin, C.M.; Chandrasekhar, M.; Chandrasekhar, H.R.; Guentner, R.; Scanduicci de Freitas, P.; Scherf, U. Temperature dependent photolumi-nescence of organic semiconductors with varying backbone conformation. Phys. Rev. B 2003, 67, 125204. [Google Scholar] [CrossRef] [Green Version]
  38. Buckner, C.A.; Lafrenie, R.M.; Dénommée, J.A.; Caswell, J.M.; Want, D.A.; Gan, G.G. Structural Phase Transitions of Hybrid Perovskites CH3NH3PbX3 (X = Br, Cl) from Synchrotron and Neutron Diffraction Data. IntechOpen 2016, 11, 13. [Google Scholar]
  39. Tingting, Y.; Yan, J. Stability of CH3NH3PbBr3 and evolution of H-bonding during its polymorphic transformations. In Proceedings of the 2017 Opto-Electronics and Communications Conference (OECC) and Photonics Global Conference (PGC), Singapore, 31 July 2017–4 August 2017. [Google Scholar]
  40. Ruf, F.; Aygüler, M.F.; Giesbrecht, N.; Rendenbach, B.; Magin, A.; Docampo, P.; Kalt, H.; Hetterich, M. Temperature-dependent studies of exciton binding energy and phase-transition suppression in (Cs,FA,MA)Pb(I,Br)3 perovskites. APL Mater. 2019, 7, 031113. [Google Scholar] [CrossRef] [Green Version]
  41. Li, J.; Yuan, X.; Jing, P.; Mechanics, F.; Ji, L. Temperature-dependent photoluminescence of inorganic perovskite nanocrystal films. RSC Adv. 2016, 6, 78311–78316. [Google Scholar] [CrossRef]
  42. Zhang, F.; Zhong, H.; Chen, C.; Wu, X.G.; Hu, X.; Huang, H.; Han, J.; Zou, B.; Dong, Y. Brightly luminescent and color-tunable colloidal CH3NH3PbX3 (X = Br, I, Cl) quantum dots: Potential alternatives for display technology. ACS Nano 2015, 9, 4533–4542. [Google Scholar] [CrossRef]
  43. Park, Y.; Jana, A.; Myung, C.W.; Yoon, T.; Lee, G.; Kocher, C.C.; Ying, G.; Osokin, V.; Taylor, R.A.; Kim, K.S. Enhanced photoluminescence quantum yield of MAPbBr3 nanocrystals by passivation using graphene. Nano Res. 2020, 13, 932–938. [Google Scholar] [CrossRef]
  44. Yuan, X.; Hou, X.; Li, J.; Qu, C.; Zhang, W.; Zhao, J.; Li, H. Thermal degradation of luminescence in inorganic perovskite CsPbBr3nanocrystals. Phys. Chem. Chem. Phys. 2017, 19, 8934–8940. [Google Scholar] [CrossRef] [PubMed]
  45. Ai, B.; Liu, C.; Deng, Z.; Wang, J.; Han, J.; Zhao, X. Low temperature photoluminescence properties of CsPbBr3 quantum dots embedded in glasses. Phys. Chem. Chem. Phys. 2017, 19, 17349–17355. [Google Scholar] [CrossRef] [PubMed]
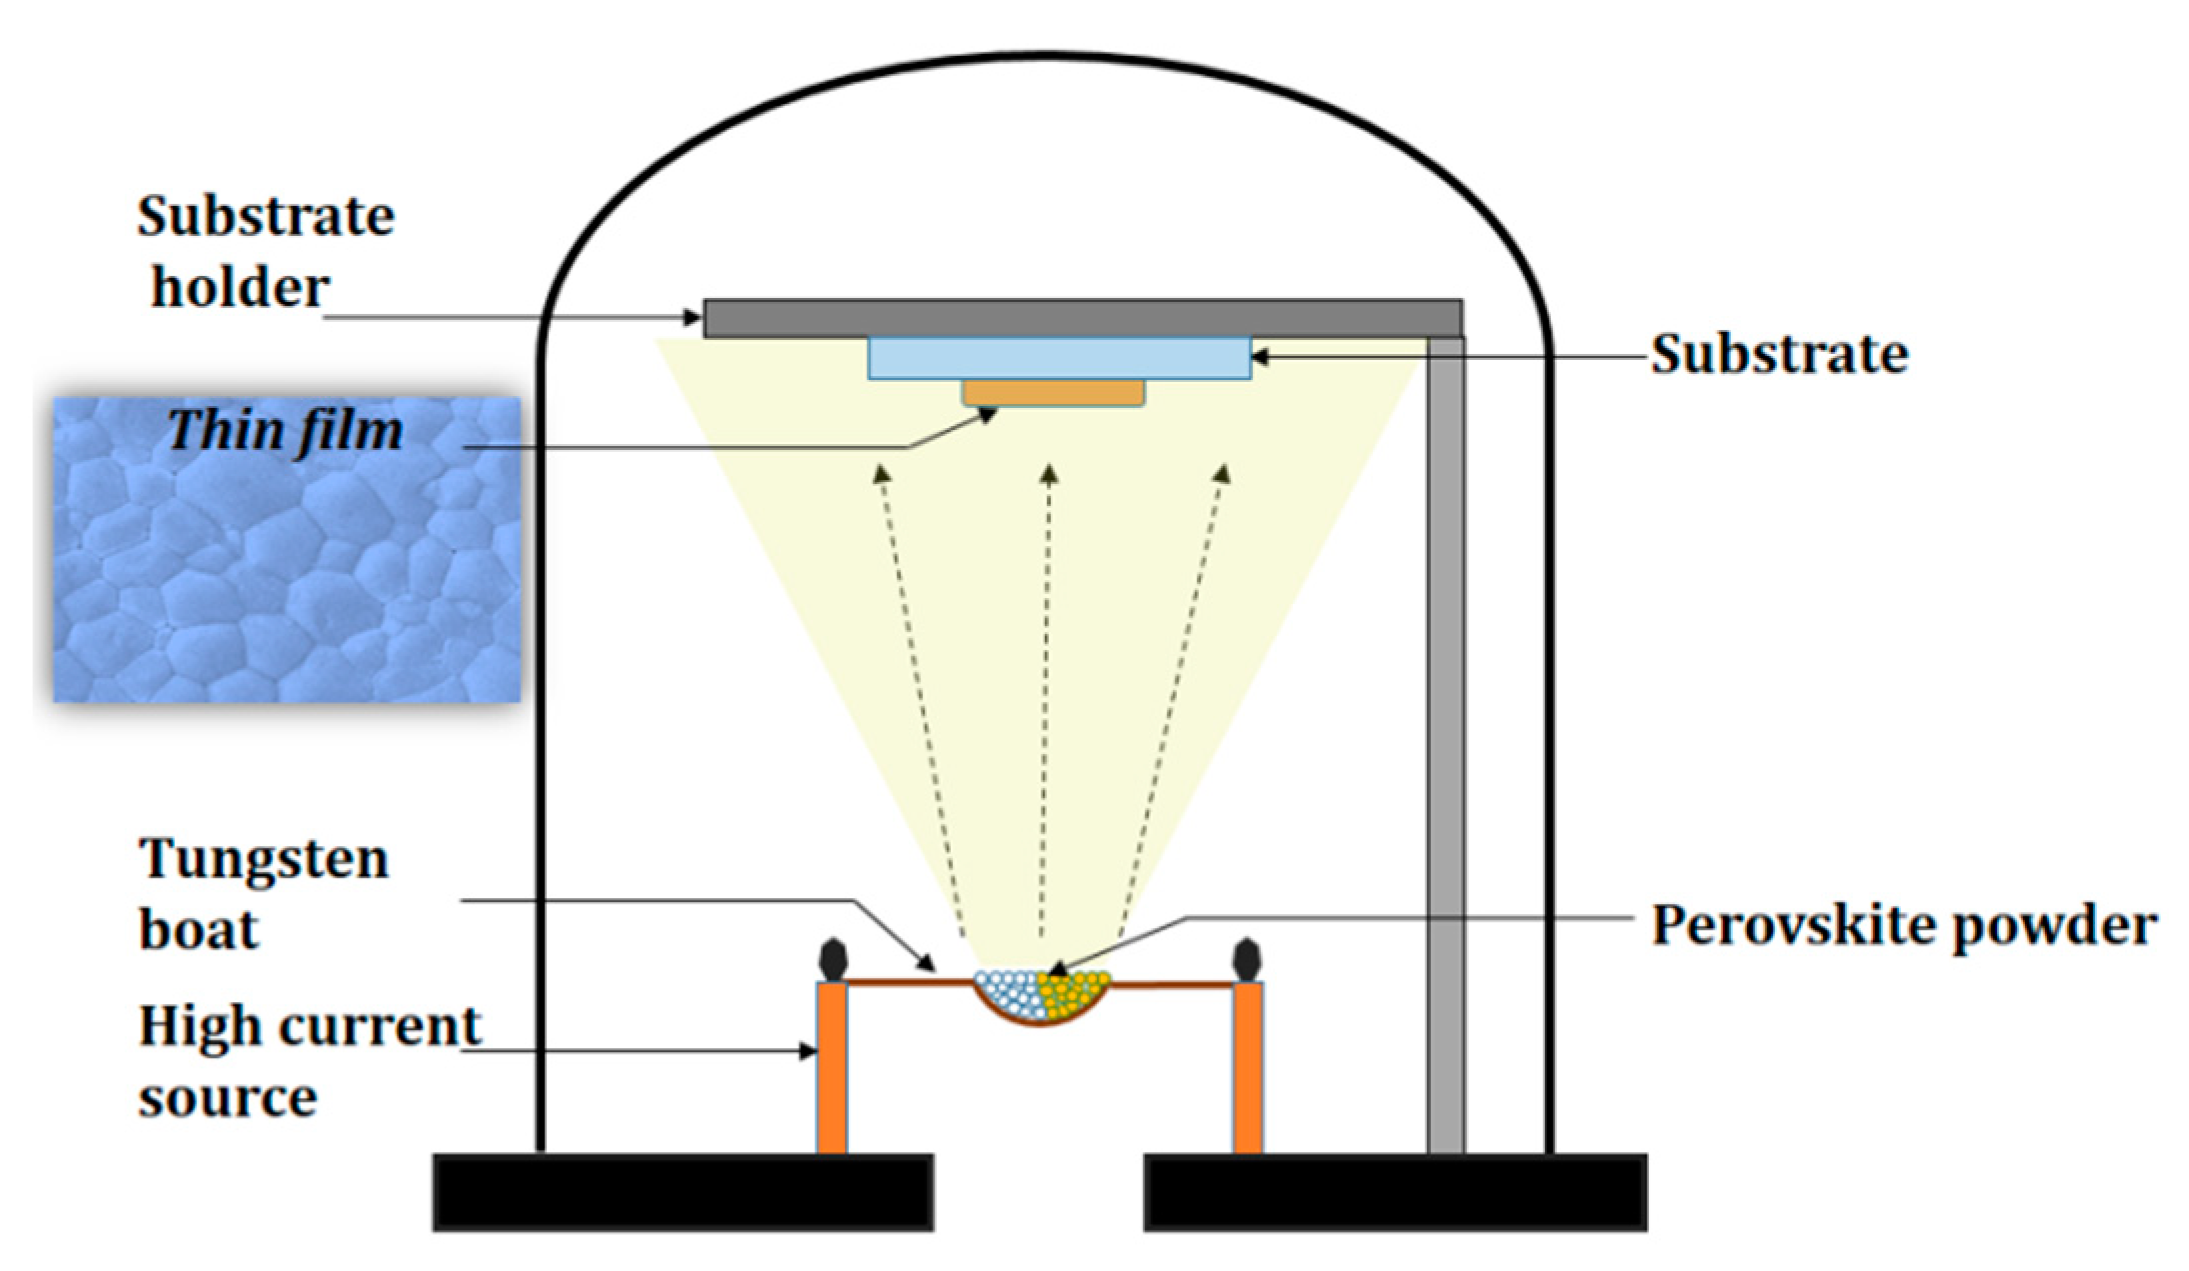
Figure 1. Schematic diagram of the thermal evaporation setup [10].
Photonics 10 00021 g001
Figure 2. Schematic diagram of the low-temperature measurements setup.
Photonics 10 00021 g002
Figure 3. SEM images of the MAPb(BrxI1-x) thermally evaporated perovskite films.
Photonics 10 00021 g003aPhotonics 10 00021 g003b
Figure 4. (a) XRD pattern and (b) W-H plot, of the MAPb(BrxI1−x)3 thin films.
Photonics 10 00021 g004
Figure 5. The absorbance values of MAPb(BrxI1−x)3 perovskite films.
Photonics 10 00021 g005
Figure 6. The Photoluminescence spectra of MAPb(BrxI1−x)3 perovskite films.
Photonics 10 00021 g006
Figure 7. PL spectra of MAPbI3 in the temperature range 33–353 K. excitation laser intensity of 7.9 mW cm−2 by 473 nm CW laser.
Photonics 10 00021 g007
Figure 8. Temperature dependence of the emission band peak for the MAPb(BrxI1−x)3 perovskite films, (a) for MAPbI3, (b) MAPbBr3, (c) MAPb(Br0.25I0.75)3, (d) MAPb(Br0.50I0.50), (e) MAPb(Br0.75I0.25)3.
Photonics 10 00021 g008
Figure 9. Temperature dependence of integrated PL intensity with Arrhenius equation fitting for MAPb(BrxI1−x)3 perovskite films.
Photonics 10 00021 g009
Table 1. Values for an XRD pattern at three peaks.
Compound Peak (1) Peak (2) Peak (3)

(deg)
FWHM (meV)
(deg)
FWHM (nm)
(deg)
FWHM (nm)
MAPbBr314.210.19329.420.233.010.217
MAPb(Br0.75I0.25)14.080.1929.240.2032.840.24
MAPb(Br0.50I0.50)13.720.3128.390.3331.240.22
MAPb(Br0.25I0.75)13.430.2427.820.2631.870.33
MAPbI313.40.2127.670.2331.110.21
Table 2. The X-Ray diffraction parameters estimated from the W-H plot.
MAPb(BrxI1−x)310.750.500.250.00
Crystallize size, D (nm)5951.3543.646.2142.2
Micro strain ε × 10−31.081.132.32.40.71
Dislocation density (δ) × 10−3 (nm)−25.455.2814.968.446.46
Table 3. The Band-gap values and Wavelength position of peaks at room temperature.
MAPb(BrxI1−x)3x Values
1.000.750.500.250.00
Energy bandgap (eV) at RT3.543.352.82.991.56
Peak Emission (nm) at RT541.45715.85728.2743.39765.85
Table 4. The transition point with the temperature of MAPb(Brx,I1−x)3 perovskite films.
MAPb(BrxI1−x)300.250.500.751
The transition from
(orthorhombic to
tetragonal) phase
163 ± 10 132 ± 10122 ± 10163 ± 10
The transition from
(tetragonal to
cubic) phase
330 ± 10318 ± 10312 ± 10290 ± 10263 ± 10
Table 5. Ea calculated by Arrhenius plots of perovskite films above 160 to 300 K range of temperature.
XThe MaterialActivation Energy (meV)
0.00MAPbI347
0.50MAPb(Br0.50I0.50)367
1.00MAPbBr371
Disclaimer/Publisher’s Note: The statements, opinions and data contained in all publications are solely those of the individual author(s) and contributor(s) and not of MDPI and/or the editor(s). MDPI and/or the editor(s) disclaim responsibility for any injury to people or property resulting from any ideas, methods, instructions or products referred to in the content.