Article

Total Differential Photometric Mesh Refinement with Self-Adapted Mesh Denoising

1
School of Geodesy and Geomatics, Wuhan University, Wuhan 430079, China
2
School of Geomatics and Urban Spatial Informatics, Beijing University of Civil Engineering and Architecture, Beijing 102616, China
3
School of Computer Science, Hubei University of Technology, Wuhan 430068, China
4
Wuhan Tianjihang Information Technology Co., Ltd., Wuhan 430010, China
*
Author to whom correspondence should be addressed.
Photonics 2023, 10(1), 20; https://doi.org/10.3390/photonics10010020
Submission received: 26 October 2022 / Revised: 20 December 2022 / Accepted: 21 December 2022 / Published: 24 December 2022

Abstract

:
Variational mesh refinement is a crucial step in multiview 3D reconstruction. Existing algorithms either focus on recovering mesh details or focus on suppressing noise. Approaches with consideration of both are lacking. To address this limitation, we proposed a new variational mesh refinement method named total differential mesh refinement (TDR), which mainly included two improvements. First, the traditional partial-differential photo-consistency gradient used in the variational mesh refinement method was replaced by the proposed total-differential photo-consistency gradient. With consideration of the photo-consistency correlation between adjacent pixels, our method can make photo-consistency achieve a more effective convergence than traditional approaches. Second, we introduced the bilateral normal filter with a novel self-adaptive mesh denoising strategy into the variational mesh refinement. This strategy maintains a balance between detail preservation and effective denoising via the zero-normalized cross-correlation (ZNCC) map. Various experiments demonstrated that our method is superior to traditional variational mesh refinement approaches in both accuracy and denoising effect. Moreover, compared with the mesh generated by open-source and commercial software (Context Capture), our meshes are more detailed, regular, and smooth.

1. Introduction

A well-established pipeline of image-based 3D reconstruction technology mainly in-cludes structure from motion (SFM), multiview stereo (MVS), surface reconstruction, mesh refinement, and texture. In this pipeline, the surface reconstruction step reconstructs an initial coarse 3D mesh that may lack details and contain noise due to occlusion and non-Lambertian materials. Photometric stereo [1,2] and mesh refinement are popular methods to reconstruct high-quality mesh shapes. Photometric stereo recovers pixel-wise surface normals from a fixed scene under varying shading cues, which are widely used in the industrial field [3,4,5]. The mesh refinement method evolves the initial mesh to fine details using multiview images. In this paper, we mainly talk about the mesh refinement method for large-scale reconstruction. Variational mesh refinement is the most commonly used refinement method, and it improves mesh details and accuracy by iteratively updating all vertex positions to maximize the photo-consistency between images [6]. However, due to its isotropic regularization term, this method tends to smooth sharpened structures and cannot sufficiently remove excessive mesh noises in texture-less and non-Lambertian regions.
To solve this problem, Li et al. [7] used a content-aware mesh denoising approach as a regularization term for mesh refinement, which was effective in suppressing mesh noise while preserving sharp features. However, without the assistance of image information, some distinct errors and noises of the mesh may be wrongly identified as sharp features and preserved.
Other studies aimed to improve the accuracy of the variational mesh refinement: some researchers selected the best image pairs to refine the mesh [8]. Blaha et al. [9] and Romanoni et al. [10] used semantic information to improve mesh accuracy. However, the improvement is limited when there are few images and little semantic information. In addition, existing variational mesh refinement methods calculate the gradient of each pixel independently and do not consider the photo-consistency of neighboring pixels.
In this study, a total differential mesh refinement (TDR) approach was developed to address the abovementioned problems. First, we proposed to use the total-differential photo-consistency gradient (TDPG) to replace the partial-differential photo-consistency gradient (PDPG) calculation in the variational mesh refinement approach. The TDPG considers the influence of the gradient between adjacent pixels so that the photo-consistency can obtain more effective convergence than the PDPG via gradient descent. Second, we incorporated bilateral normal filtering [11] into the variational mesh refinement to improve the denoising and edge-preserving capabilities. A self-adaptive mesh denoising strategy was adopted to balance detail preservation and effective denoising. Specifically, the zero-normalized cross-correlation (ZNCC), which measures the photo-consistency in the image domain, was transformed to mesh vertices to form a ZNCC map indicative of the uncertainty of the mesh vertices. Then, denoising gradients are self-adaptive and weighted depending on their ZNCC. Thus, our method can remove mesh noise while preserving the details of the mesh. An overview of our method is shown in Figure 1.
Our contributions are as follows:
We proposed the TDPG method, which considers the partial derivative of all pixels in the neighborhood, makes the photo-consistency error converge to a low level, and obtains a fine-details mesh model.
We introduced the bilateral normal filtering [11] to the variational mesh refinement and adopted the self-adaptive mesh denoising strategy that utilized a ZNCC map to guide mesh denoising. This strategy enabled effective denoising while preserving mesh details (Section 2.3).
We used photo-consistency information to guide mesh denoising, which provided a new idea for the study of feature-preserving denoising.

2. Methodology

We enhanced the variational mesh refinement from two aspects. First, the total-differential photo-consistency gradient (TDPG) calculation was proposed for more effective convergence of the photo-consistency. Second, bilateral normal filtering was utilized in mesh refinement for mesh denoising, flattening planes, and sharpening edges. In order to avoid the loss of details that may be caused by denoising, we proposed the self-adaptive mesh denoising strategy. In this section, we first briefly introduce the variational mesh refinement approach (Section 2.1). Then, we present our mesh refinement method (TDR), including TDPG calculation (Section 2.2) and self-adaptive mesh denoising (Section 2.3).

2.1. Preliminaries on Variational Mesh Refinement

The variational mesh refinement approach was introduced by Pons et al. [12] and expanded by Vu et al. [13]. This method minimizes the photo-consistency error between image pairs by iteratively refining the mesh vertex. For one image pair I p and I q , image I q can be projected onto the mesh S and then reprojected to image I p to form a predicted image I p q S [7,14]. The photo-consistency between the predicted image and the reference image measures the correctness of the mesh, and the goal of variational mesh refinement is to minimize this photo-consistency error between all image pairs.
The energy function is expressed as:
E S = E p h o t o S + E r e g u l a r i z a t i o n S
S is the mesh surface, E S is the total energy function, E r e g u l a r i z a t i o n S enforces the smoothness of the surface. The E p h o t o S is defined as:
E p h o t o S = p , q Ω p q S   M z n c c I p , I p q S x i d x i
M z n c c I p , I p q S x i is the ZNCC measurement between images I p and I p q S at pixel x i . Ω p q S is the map of the reprojection from image I p to image I q via the surface.
To minimize E p h o t o S , the gradient is calculated using chain rules (see [13]):
g p h o t o V = d E p h o t o S d V = p , q Ω p q S   ϕ X i M x i D I q ( x j ) D Π q X i d i N T d i N d x i
V represents all mesh vertices, g p h o t o V is the vertices gradient induced by the photo in each iteration. M is the abbreviation for M z n c c I p , I p q S , M x i is photo-consistency gradient at pixel x i . X i is the intersection of S and the ray from the camera center of I p to x i .   ϕ X i is the barycentric coordinate weight of X i . Π q represents the projection from the world to the I q , x j = Π q X i and D I q ( x j ) is image gradient at x j .   D denotes the Jacobian matrix of a function. d i is the vector joining the camera center of I p and point X i . N is the outward surface normal at X i .
For mesh regularization, this method adds thin plate energy [15] that penalizes mesh bending to prevent excessive bending of the mesh and excessive deviation of the gradient flow.
E r e g u l a r i z a t i o n S = S   ( k 1 2 + k 2 2 ) d S
where k 1 and k 2 are the principal curvatures of the mesh. The linear combination of Laplacian and Bi-Laplacian operators minimizes this energy [15].

2.2. Total-Differential Photo-Consistency Gradient Calculation

A key step in variational mesh refinement is the calculation of the vertex gradient (Equation (3)), which determines how the vertices are updated to minimize photo-consistency error. In the baseline method [13], the photo-consistency gradient ( M in (Equation (3))) is calculated separately at each pixel and the potential contradictions between pixel gradients are ignored. In our approach, we proposed to calculate the photo-consistency gradient for each pixel with consideration of the surrounding related pixels. To distinguish those two methods, we denote the baseline method by M P D P G and our method by M T D P G   . The following describes the differences between the two methods.
ZNCC is a ubiquitously used photo-consistency measurement in variational mesh refinement, and its formula is as follows:
M z n c c x i = 1 n m = 1 n ( a m μ A ) b m μ B σ A σ B ,   M z n c c x i 1 , 1
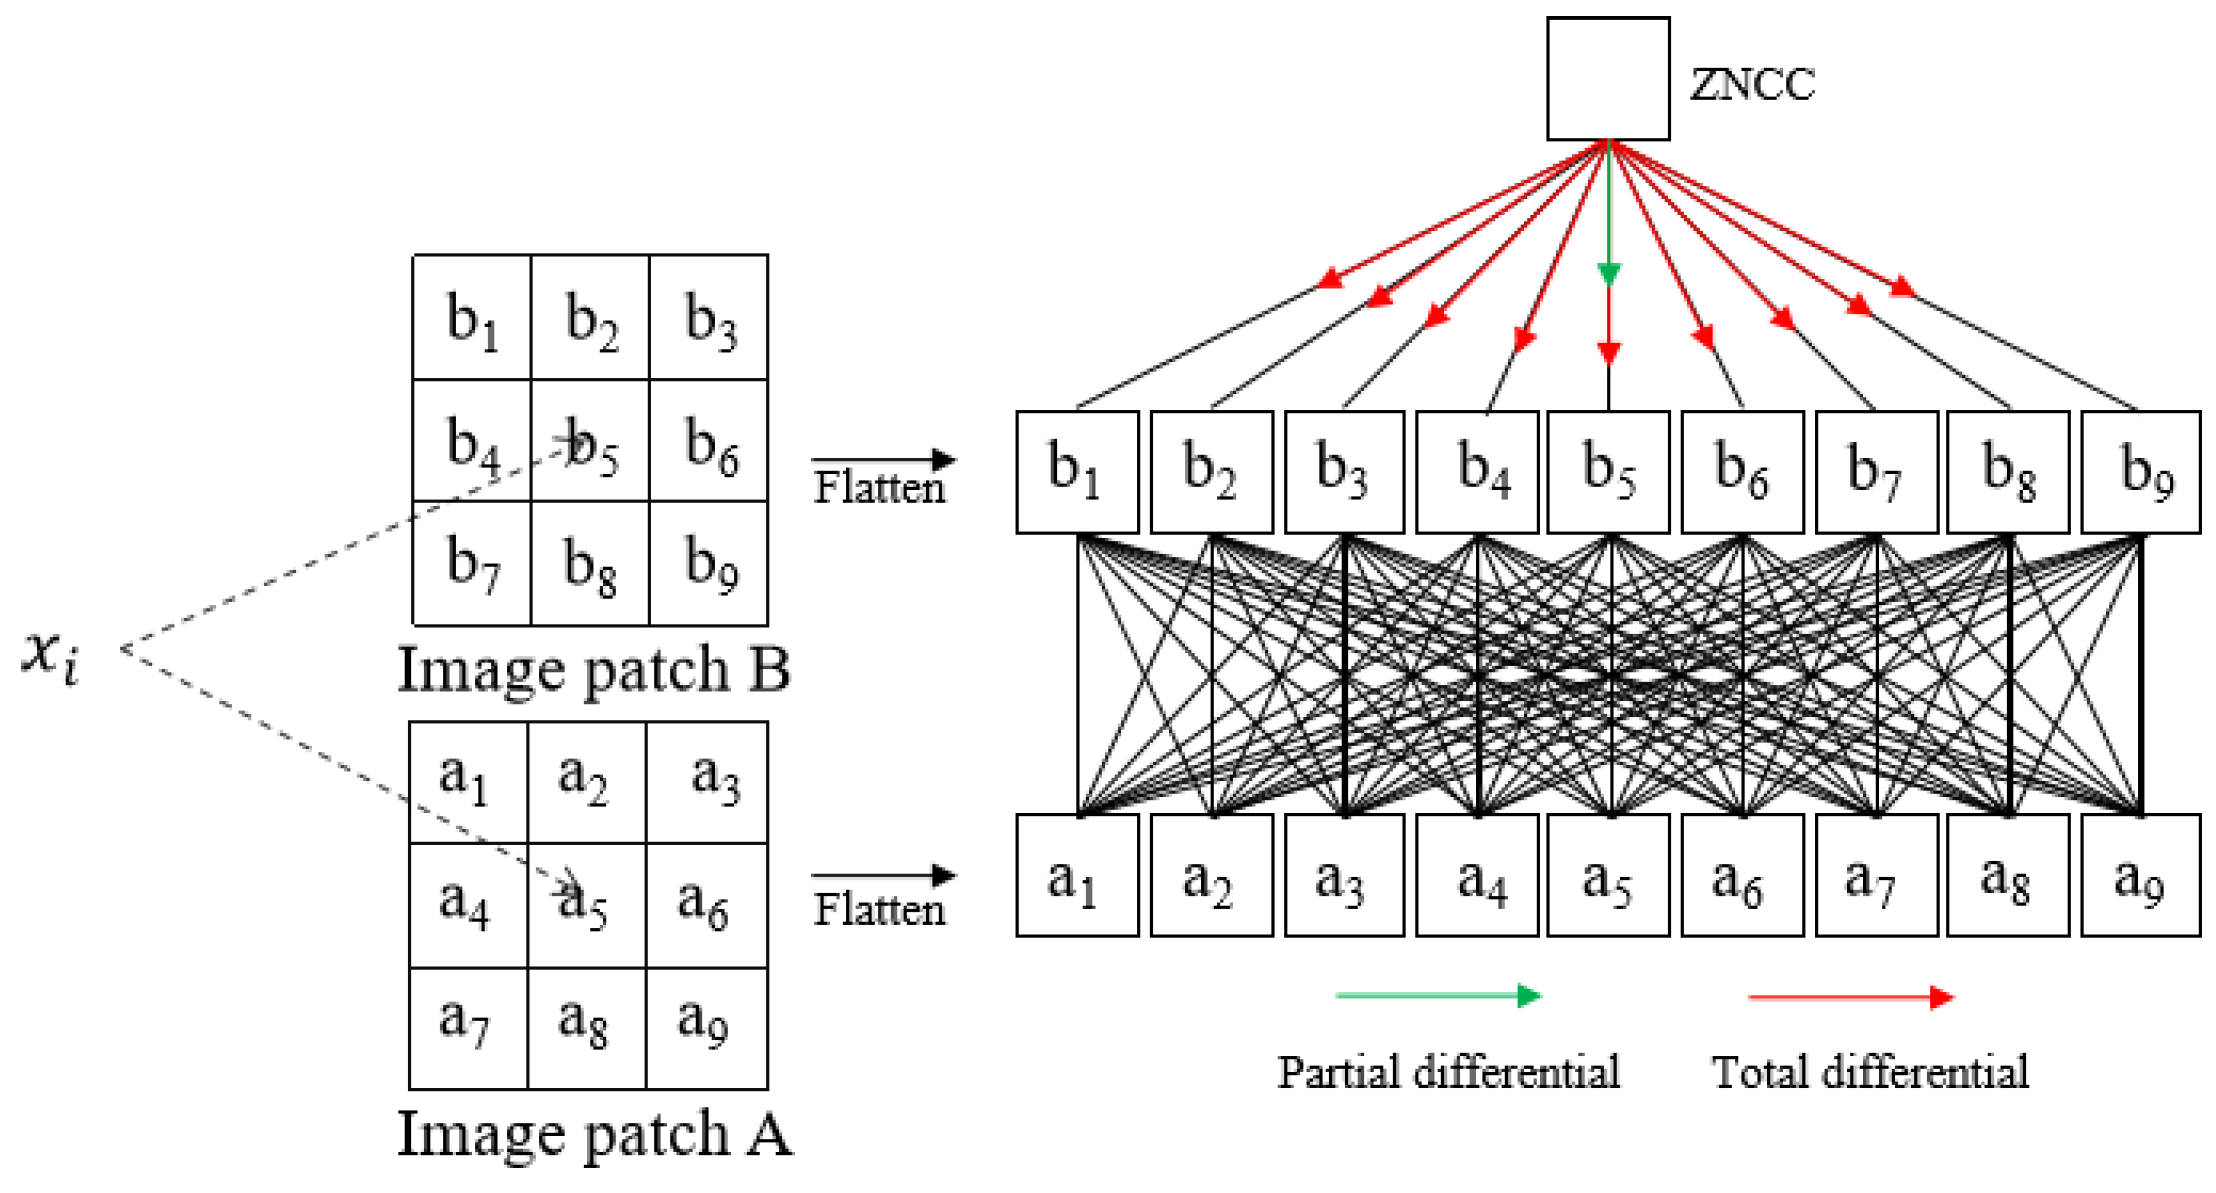
where x i is the position of a pixel in the reference image, M z n c c x i is the ZNCC measurement at x i , while A and B are two image patches of equal size from the reference and predicted images at x i (see Figure 2). a m and b m ( m 1 , n ) denote the m-th pixel in A and B , respectively and n is the number of pixels in each image patch; μ A / μ B and σ A / σ B are the mean and standard deviations of the pixel values in A and B , respectively.
A and B are two image patches from the reference and predicted images at x i . The black lines indicate that the two image patches are combined to calculate the ZNCC value. The arrows represent the differential of ZNCC with respect to the pixels in B. The right part of Figure 2 shows that ZNCC is jointly calculated by a m and b m . To minimize the ZNCC error, the partial differential only changes the center pixel, while the total differential changes all the pixels in B .
The ZNCC error is defined as 1 M z n c c . The variational mesh refinement [13] changes the center pixel value to reduce this error, and the partial derivative is calculated [12,14]:
M P D P G   x i = M z n c c x i b c e n t e r = 1 n a c e n t e r μ A σ A σ B M z n c c x i b c e n t e r μ B σ B 2
where M P D P G   x i denotes the PDPG at position x i , a c e n t e r / b c e n t e r is center pixels of image patches A and B .
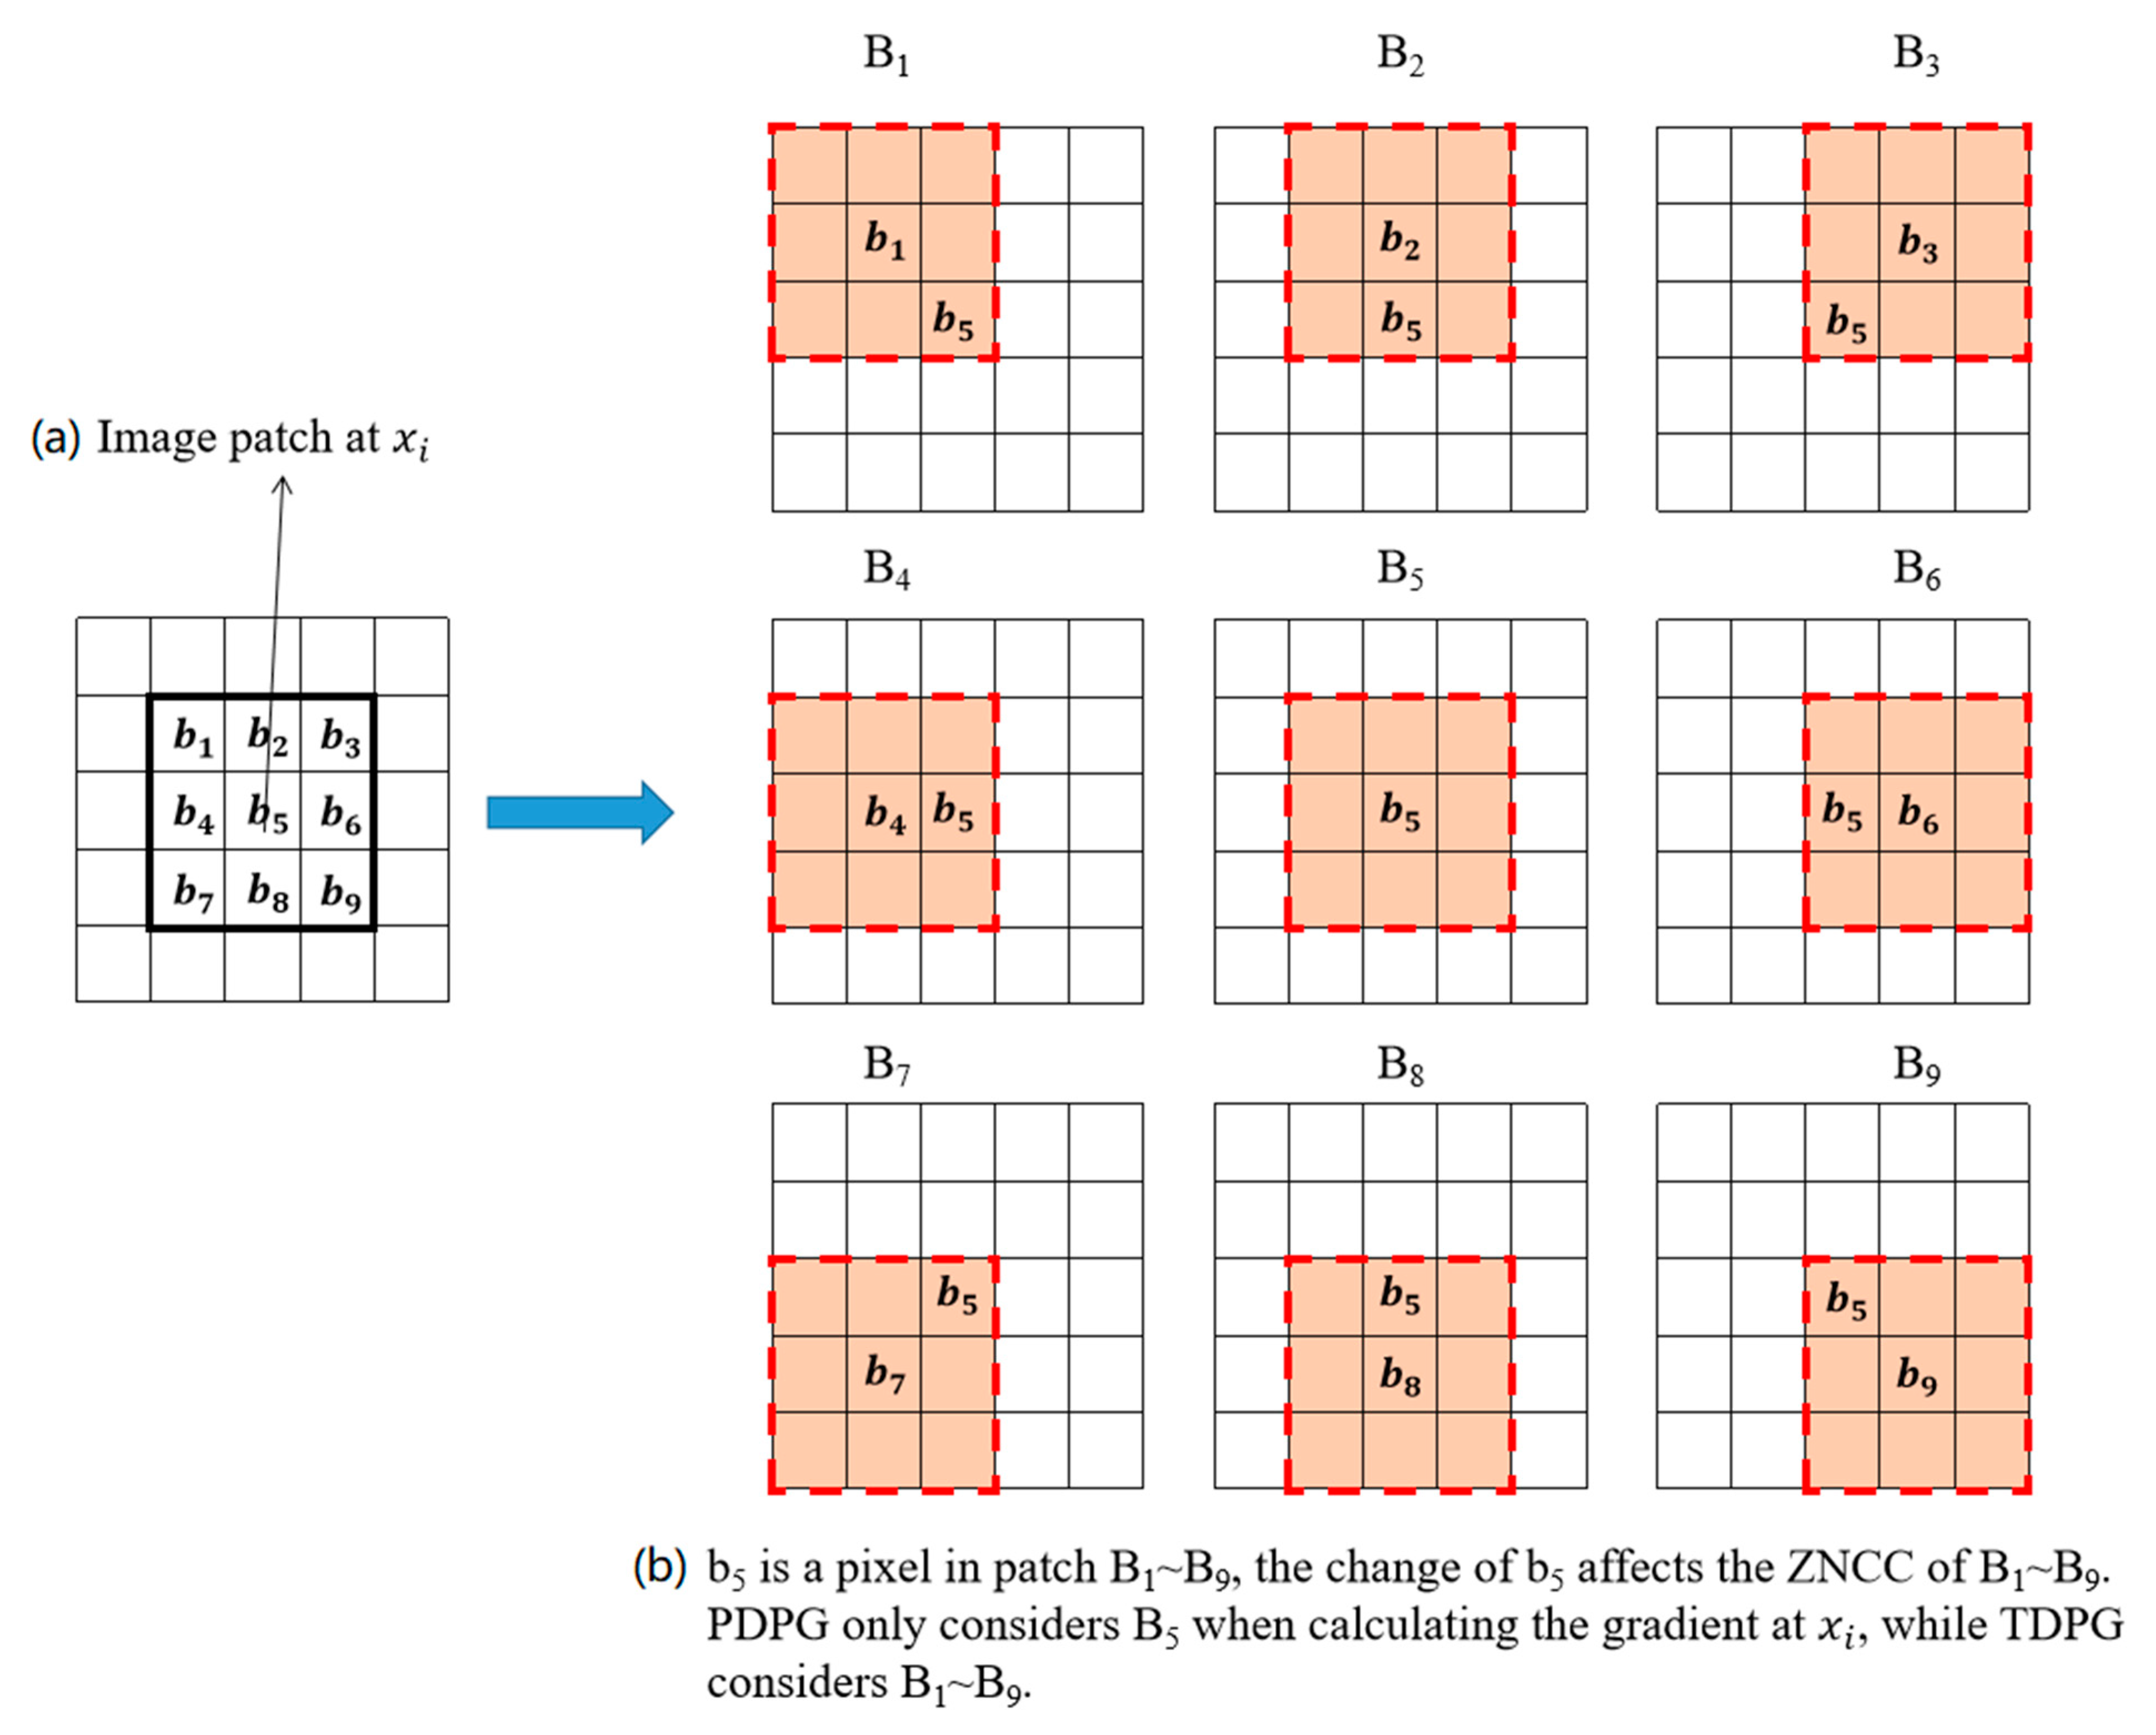
On the one hand, PDPG only calculates the partial derivative of the center pixel. As in Figure 2, the ZNCC is determined by all patch pixels, and the total differential should be considered. On the other hand, the PDPG is individually calculated in each image patch. As in Figure 3, pixel x i is contained by nine image patches, but the gradient is only determined by the center patch. The gradient calculated in this way is expected to reduce the ZNCC error of x i . However, it may increase the ZNCC error of the neighboring pixels, which is not conducive to the convergence of the photo-consistency on the entire image.
In our method, the photo-consistency gradient of a pixel is jointly determined by all image patches that contain it. Based on this idea, we propose the TDPG calculation method:
M T D P G   x i = m = 1 n W g d x i b m , x i M z n c c x i b m b c e n t e r
M z n c c x i b m b c e n t e r = 1 n a m μ A m σ A m σ B m M z n c c x i b m b m μ B m σ B m 2
where M T D P G   x i is the TDPG at x i and x i b m is the position of b m in the image patch of x i (see Figure 3a), d x i b m , x i is the Euclidean distance between x i b m and x i . W g d is the Gaussian weight. M z n c c x i b m b c e n t e r is the partial derivative of ZNCC at x i b m with respect to b c e n t e r . A m and B m are two image patches from the reference and predicted images at x i b m . μ A m / μ B m and σ A m / σ B m are the mean and standard deviations of the pixel values in A m and B m , respectively. The equation shows that the gradient of each pixel is jointly determined by the partial derivative of all pixels within the image patch and that pixels closer to x i have a more significant impact.
Figure 4 shows the difference between the convergence process of the PDPG and TDPG on the entire image. We found that TDPG converges after ~25 iterations while PDPG takes ~35 iterations (Figure 4b). TDPG achieves a more effective convergence in that it considers the partial derivative of all pixels in the neighborhood and increases the area affected by the gradient, which thereby facilitates photo-consistency convergence on the entire image. Furthermore, TDPG also yielded a much lower ZNCC error than PDPG. The local magnification area in Figure 4c,d shows that the TDPG method makes the predicted image closer to the reference image in the iterative process.

2.3. Self-Adaptive Mesh Denoising

Although the photo-consistency gradient improves accuracy and enriches the mesh details, noise and errors in the initial mesh cannot be effectively removed, especially in the texture-less and non-Lambertian regions. The mesh regularization of variational mesh refinement is a combination of the Laplacian and Bi-Laplacian operation [15], an isotropic and one-step mesh denoising method. The one-step property means that the method cannot effectively remove the mesh noise in limited iterations, and the isotropic property makes it hard to retain high-frequency details [11,16]. Therefore, we propose to use the two-step and anisotropic bilateral normal filtering as a regularization term for mesh refinement. However, directly applying the bilateral normal filtering with its strong mesh deformation capability is inappropriate because the small mesh details that are difficult to distinguish from noise will be erased.
We utilized the image ZNCC metric, which indicates the mesh accuracy, to guide mesh denoising. For image pair I p and I q , x i p , q is the position of a pixel in image I p . The ray formed by the camera center of I p and x i p , q intersects the mesh at the 3D position X i p , q . The ZNCC value at face f k can be calculated from all the image pairs visible to it (Figure 5):
C f k = p , q X i p , q f k α p , q v i s X i p , q · M z n c c x i p , q p , q X i p , q f k α p , q v i s X i p , q ,     p , q X i p , q f k α p , q v i s X i p , q 0               0 ,                   p , q X i p , q f k α p , q v i s X i p , q = 0
where C f k represents the ZNCC value of face f k . α p , q v i s X i p , q describes whether the 3D point X i p , q is simultaneously visible by image I p and image I q . If it is visible, α p , q v i s X i p , q = 1 ; otherwise, α p , q v i s X i p , q = 0 . X i p , q f k denotes X i p , q is on face f k . M z n c c x i p , q is the ZNCC value at x i p , q . Then, C f k is transferred from mesh face to mesh vertex to form a ZNCC map:
C V i = k N V i A f k C f k k N V i A f k
in which, V i is a vertex of the mesh. C V i represents the ZNCC value of the mesh vertex V i . N V i is the one-ring face neighborhood of V i . A f k is the area of the face f k .
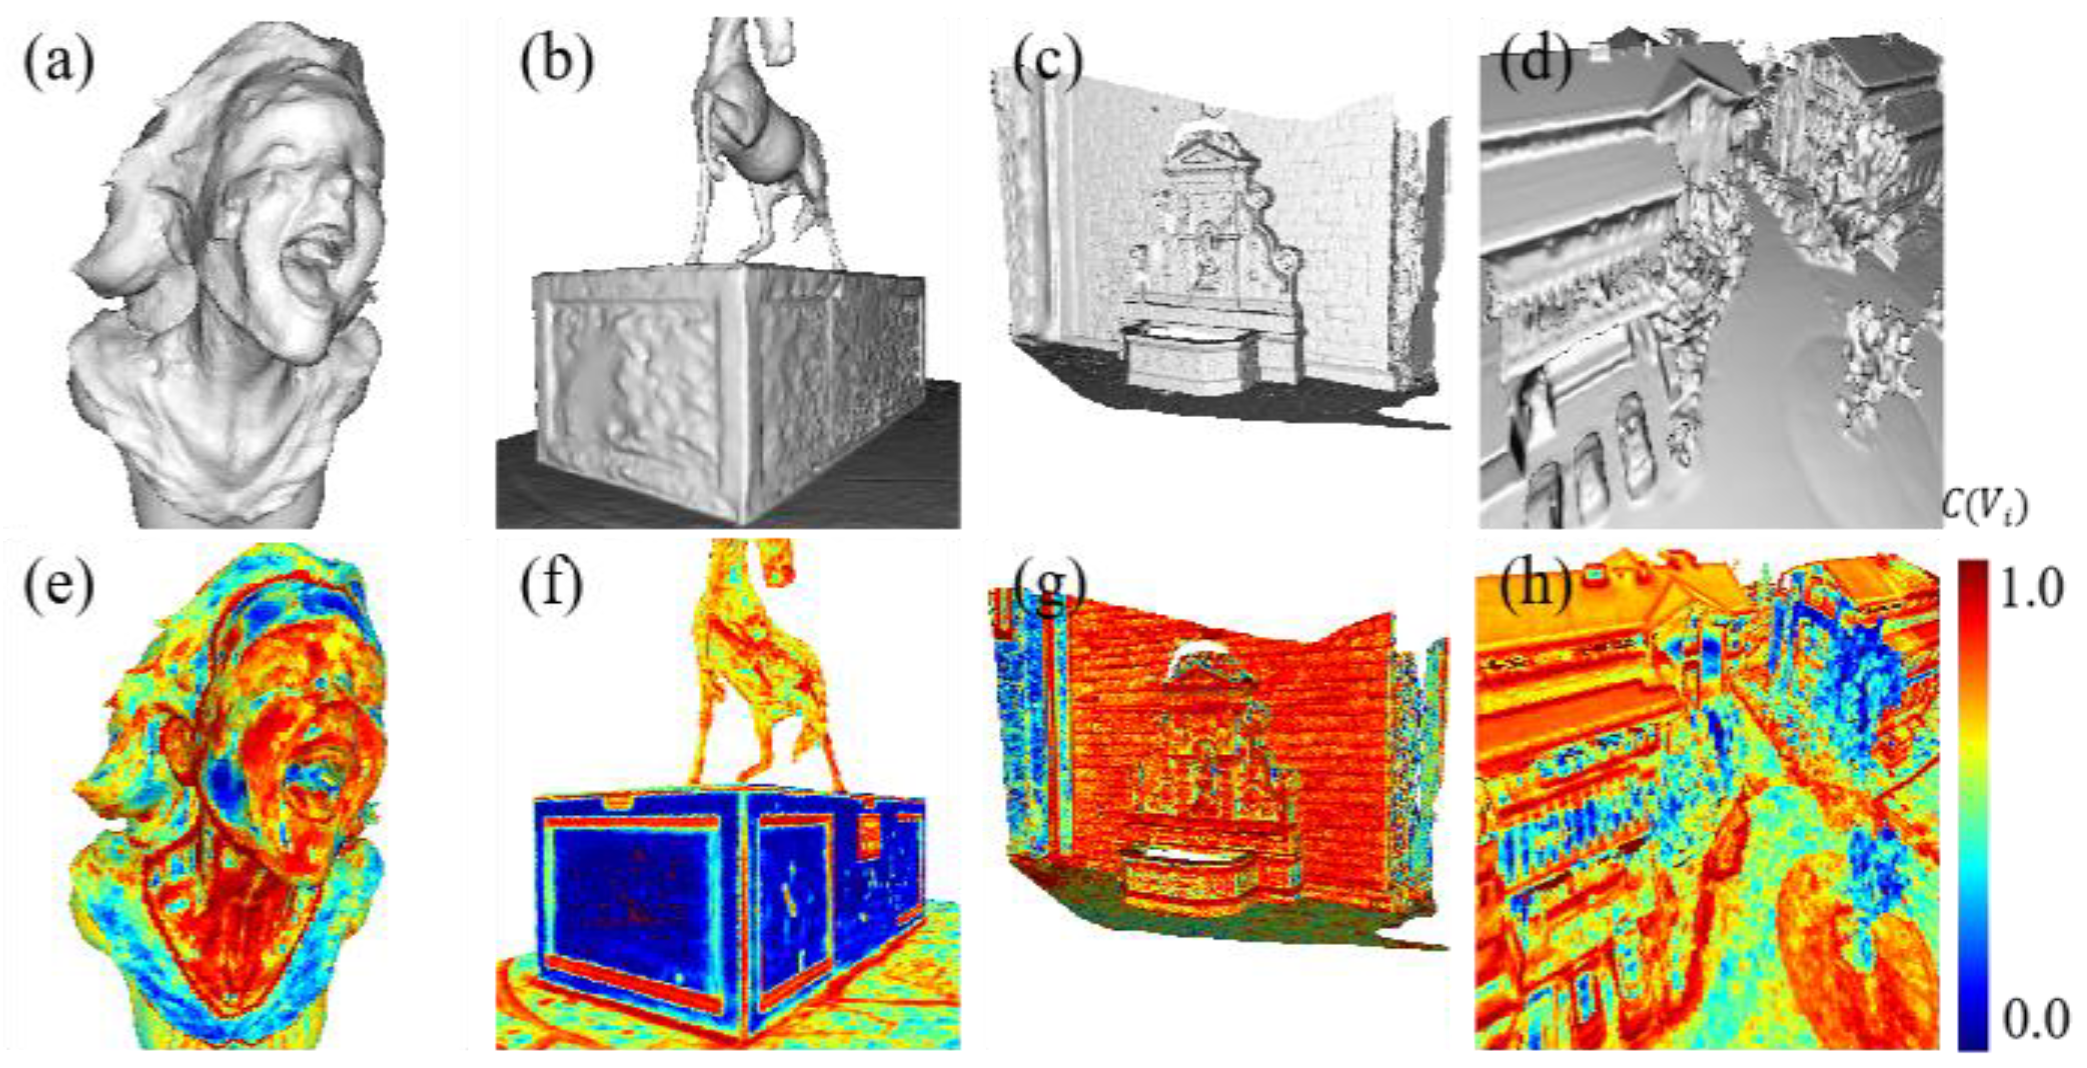
The ZNCC maps of different meshes are shown in Figure 6. We found that the noise area in the mesh has a low value of C V i due to the error of the mesh shape. In addition, in the area with a high C V i , the mesh shape conforms to multiview photo-consistency. We use a C V i -weighted denoising gradient to achieve self-adaptive mesh denoising:
g r e g u l a r i z a t i o n V i = 1 C V i · g b i l a t e r a l V i
g r e g u l a r i z a t i o n V i is the regularization gradient at each vertex, and g b i l a t e r V i is the bilateral denoising gradient at each vertex which is described in [11].
It is worth noting that general mesh denoising methods only remove noise based on geometric information. In contrast, this paper adaptively applies a denoising gradient based on the photo-consistency metric, which is conducive to removing significant errors in the initial mesh (see Figure 1).
Finally, our TDR combines the photometric gradient and regularization gradient by β :
g T D R V = g p h o t o T D R V + β g r e g u l a r i z a t i o n V
g is an abbreviation for gradient. g p h o t o T D R V is the photometric gradient of our TDR method in each iteration. g p h o t o T D R V replaces the M x i as M T D P G   x i in (Equation (3)).

2.4. Initialization and Implementation Details

We implemented the variational mesh refinement method [13], where ray tracing is used to calculate the projection between images, the image patch size is 5 × 5, β is set to 0.2. Those parameters are the same as that used in [13]. The Gaussian weights W g d are normalized according to the image patch size. The mesh denoising scheme is local for the bilateral normal filtering algorithm, and the normal iterations and the vertex iterations are set to 20 and 10, respectively. To solve the nonconvex problem, we utilize the L-BFGS optimization algorithm [17,18]. The parameter setting of the TDR method is the same as the variational mesh refinement. Our algorithm is implemented with C++. All experiments were conducted on a single PC machine with Intel(R) Core(TM) i7-8700 CPU (12-core), 64 GB RAM, and Nvidia GTX 2070 GPU.
We used a variety of mainstream meshes as the initial inputs, including the OpenMVS [19] mesh, which is reconstructed by the built-in surface reconstruction function, the COLMAP [20] mesh, and the CMP-CMVS mesh [21]. We used the OpenMVS mesh as the initial mesh by default, as the mesh faces are uniformly sized, and the scene reconstruction is complete.

3. Experiments

3.1. Dataset and Evaluation Metrics

Dataset: We use six datasets that cover different scenes, including UAV (unmanned air vehicle) scenes, close-range scenes, and simulation scenes. Information about these datasets is given in Table 1.
(1)
Tanks And Temples [22] is a benchmark for image-based 3D reconstruction. The image sequences come from video streams. We picked the Family, Francis, Horse, and Panther data for close-range scene evaluation.
(2)
ETH3D [23] is a benchmark for multiview stereo (MVS) evaluation. It provides ultrahigh-resolution images registered to the 3D laser scan point clouds. We picked its facade, delivery_area, relief, and relief_2 data for close-range scene evaluation.
(3)
BlendedMVS [24] is a large-scale simulation MVS dataset. It provides ground-truth meshes and rendered images. We selected four outdoor scenes captured by UAVs, namely, UAV_Scene1, UAV_Scene2, and UAV_Scene3, for UAV scene evaluation.
(4)
Custom simulation dataset. We picked computer graph (CG) mesh models Joyful [25] as ground-truth mesh and utilized the same lighting to render 70 images from fixed perspectives using Blender [26].
(5)
The EPFL dataset [27] provides two ground-truth meshes captured by LIDAR sensors, namely, Herz-Jesu-P8 and Fountain-P11, and provides the images registered with the meshes.
(6)
Personal Collection Dataset. We collected multiview images from the internet and natural scenes for qualitative evaluation.
Evaluation Metrics: Similar to [22,23], we use the shortest distance from a point to the surface to evaluate the precision of a mesh. I is the input mesh to be evaluated, and R is the reference mesh. For a vertex i I , its distance to the reference mesh is defined as d i R . These distances can be aggregated to define the accuracy of the input mesh I for any distance threshold d :
P d = 100 i I d i R < d I
where · is the Iverson bracket. I is the number of vertices for mesh I .
Similarly, for a reference mesh vertex r R , its distance to the input mesh is defined as d r I . The completeness of the input mesh for any distance threshold d is defined as:
C d = 100 r R d r I < d R
Accuracy and completeness can be combined to calculate the F-score:
F d = 2 P d C d P d C d
The F-score is the harmonic mean of the accuracy and completeness at threshold d . Threshold d varies according to the different scales of the dataset. Moreover, we also use the mean of d i R of all vertices as the mean-accuracy metric and the mean of d r I of all vertices as the mean-completeness metric.

3.2. Comparison with the Baseline Method

3.2.1. Performance on the UAV Dataset

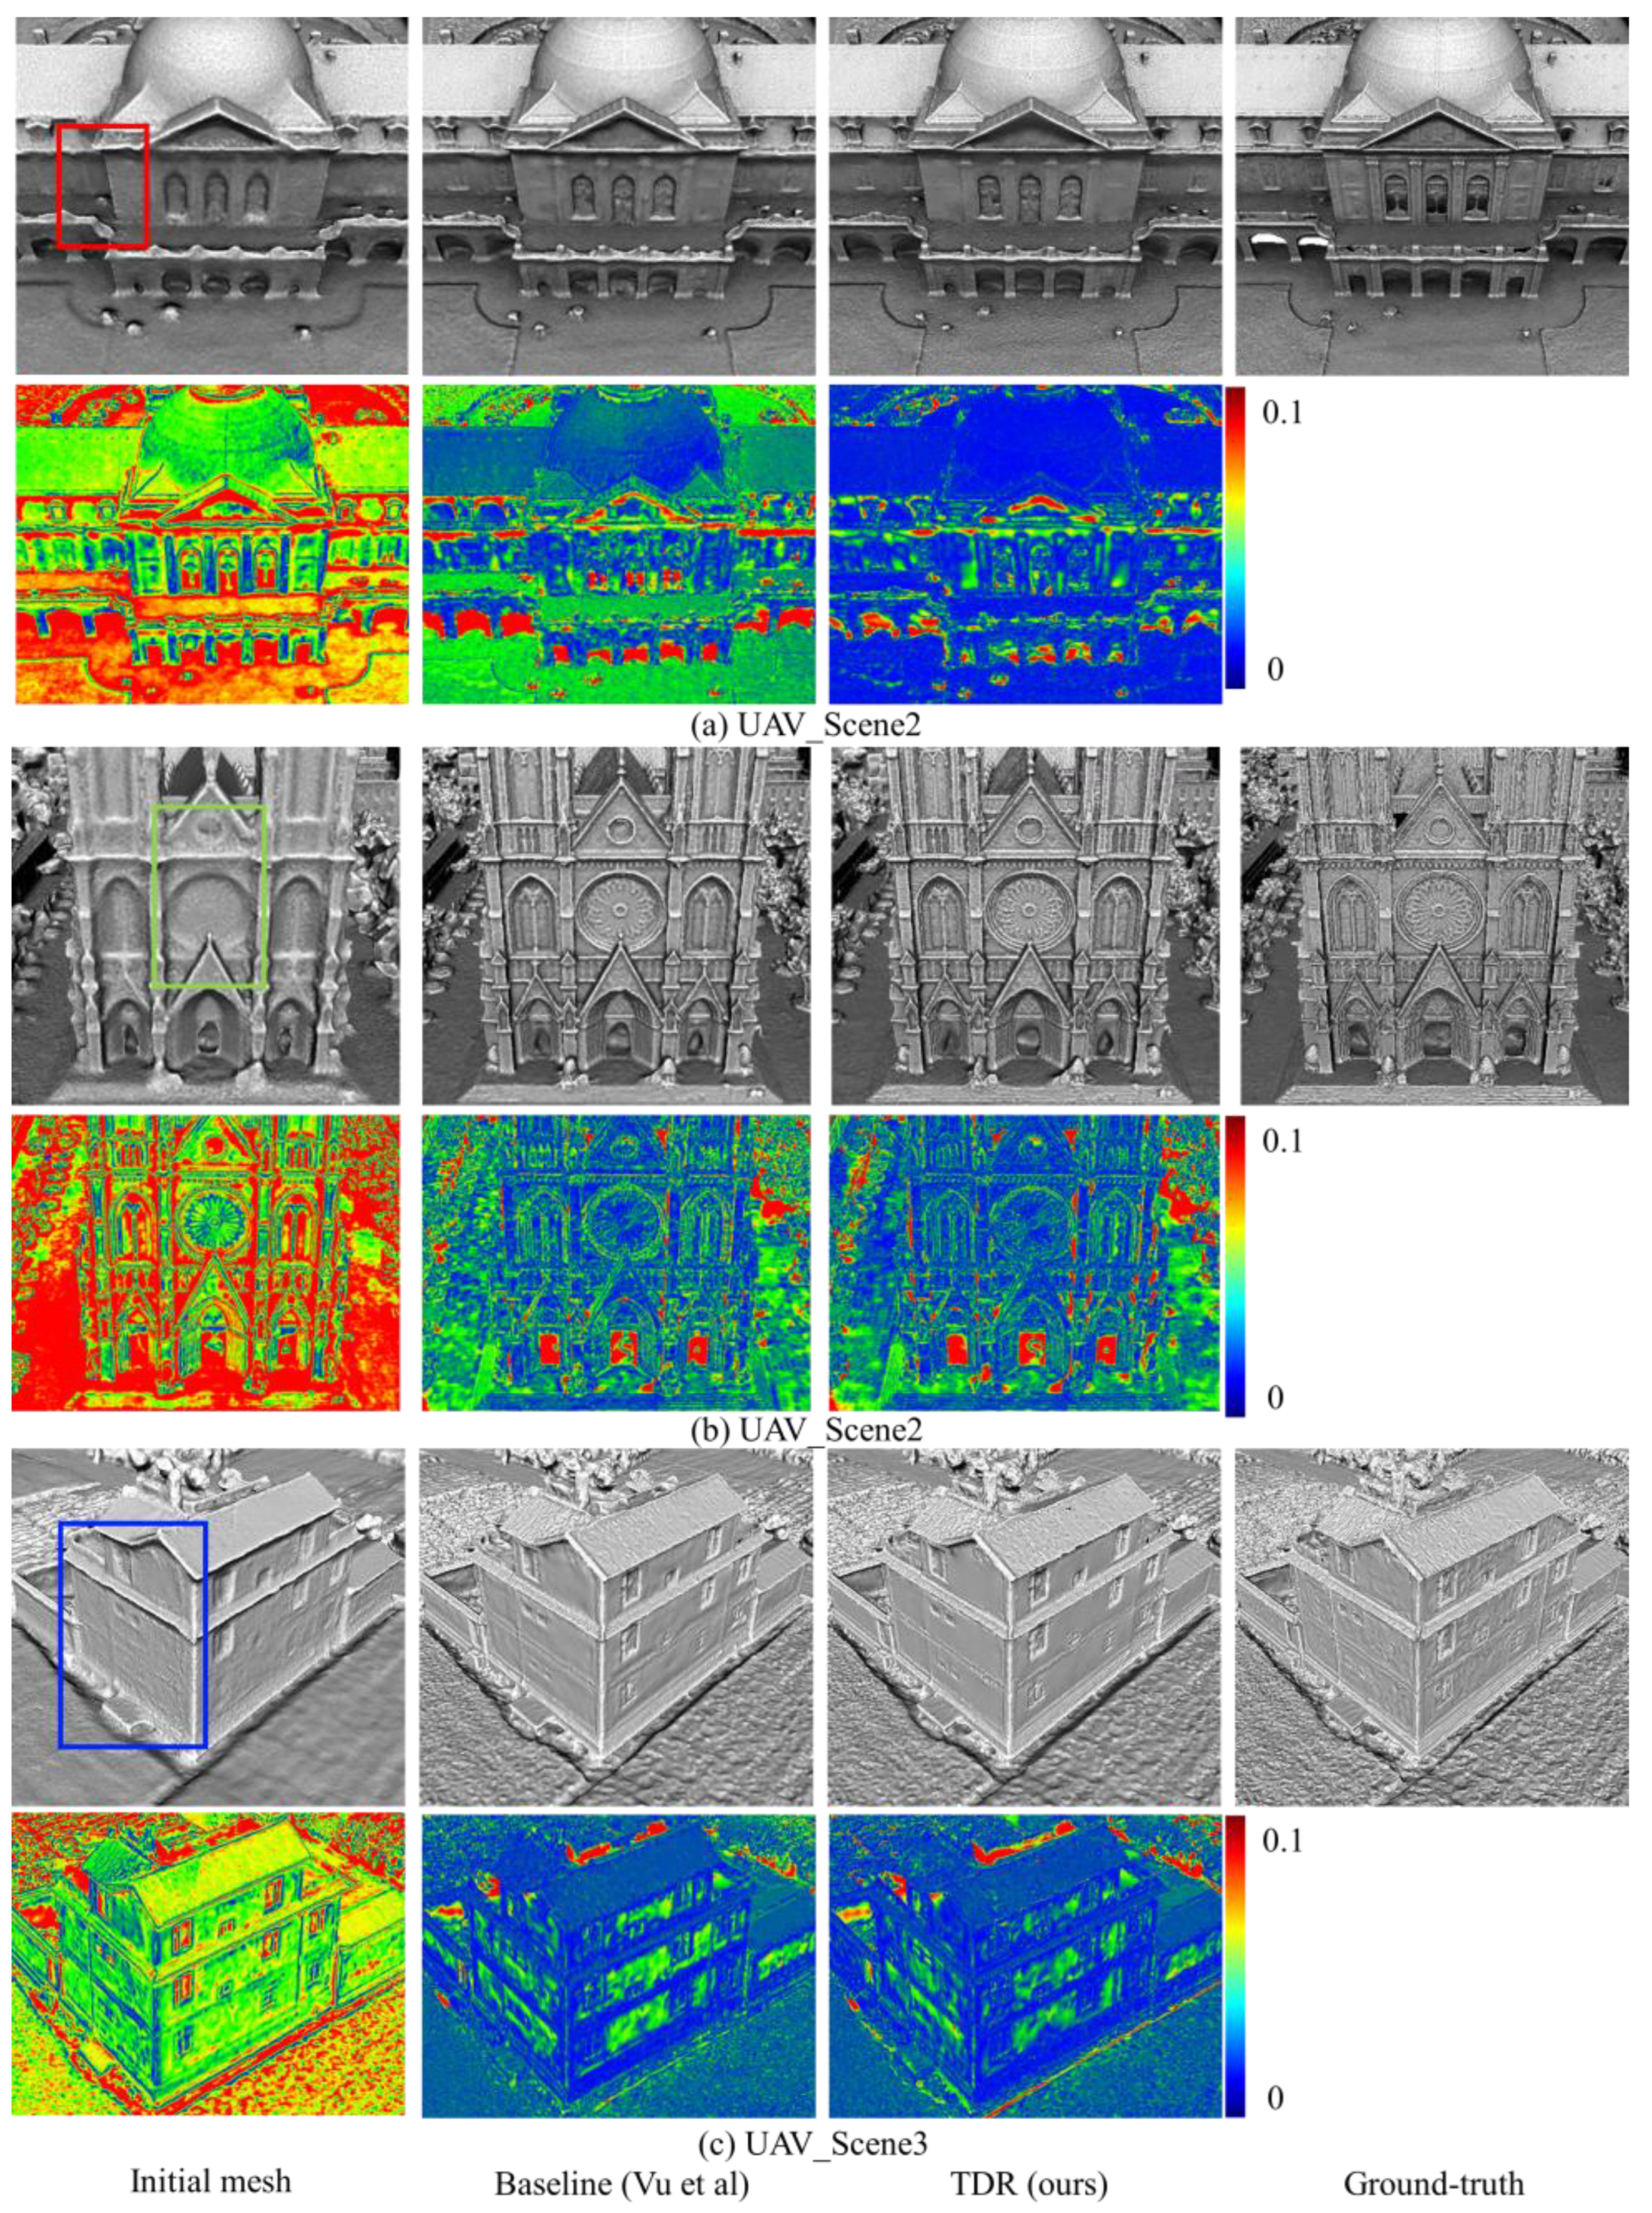
In urban scenes, the 3D reconstruction of structures (such as planes and edges) is the critical point. BlendedMVS provides urban meshes that are difficult to capture by a laser scanner fully. We selected the UAV_Scene1-UAV_Scene3 from BlendedMVS for experiment. Figure 7 shows the visual results. Compared with the baseline method [13], the mesh refined by our TDR approach is sharper in the edge region (see the red boxes in Figure 7a) because we utilize the bilateral normal filtering with an edge-preserving effect. In addition, our method obtains a better mesh detail than the baseline method (see the green box in Figure 7b) because our TDPG converges better on photo-consistency. Furthermore, in a limited number of iterations, the Laplace operator used in the baseline method does not remove the undulation in the initial mesh (see the blue box in Figure 7c). In contrast, our method makes the surface flatter due to the bilateral normal filtering with a better denoising ability.
Table 2 shows the quantitative results of the BlendedMVS dataset. Since the captured images are far from the objects, we set the cutoff distance d as 0.05 m. Table 2 shows that the baseline method and our TDR method both improve the precision of the initial mesh, but the improvement brought by our method is much more evident than that of the baseline method. The error ( d i R ) distribution of Figure 7 shows that compared with the baseline method, the accuracy improvement brought by our TDR method is reflected in the flat area. This shows that the proposed TDR method has a stronger ability to regularize the mesh than the baseline method.
In summary, the TDR method can reconstruct sharp features and flat planes even under poor initial conditions, making our method very suitable for reconstructing urban scenes.

3.2.2. Performance on the Close-Range Dataset

For the close-range dataset, we test our method on the recently published close-range MVS datasets, i.e., ETH3D and Tanks and Temples.
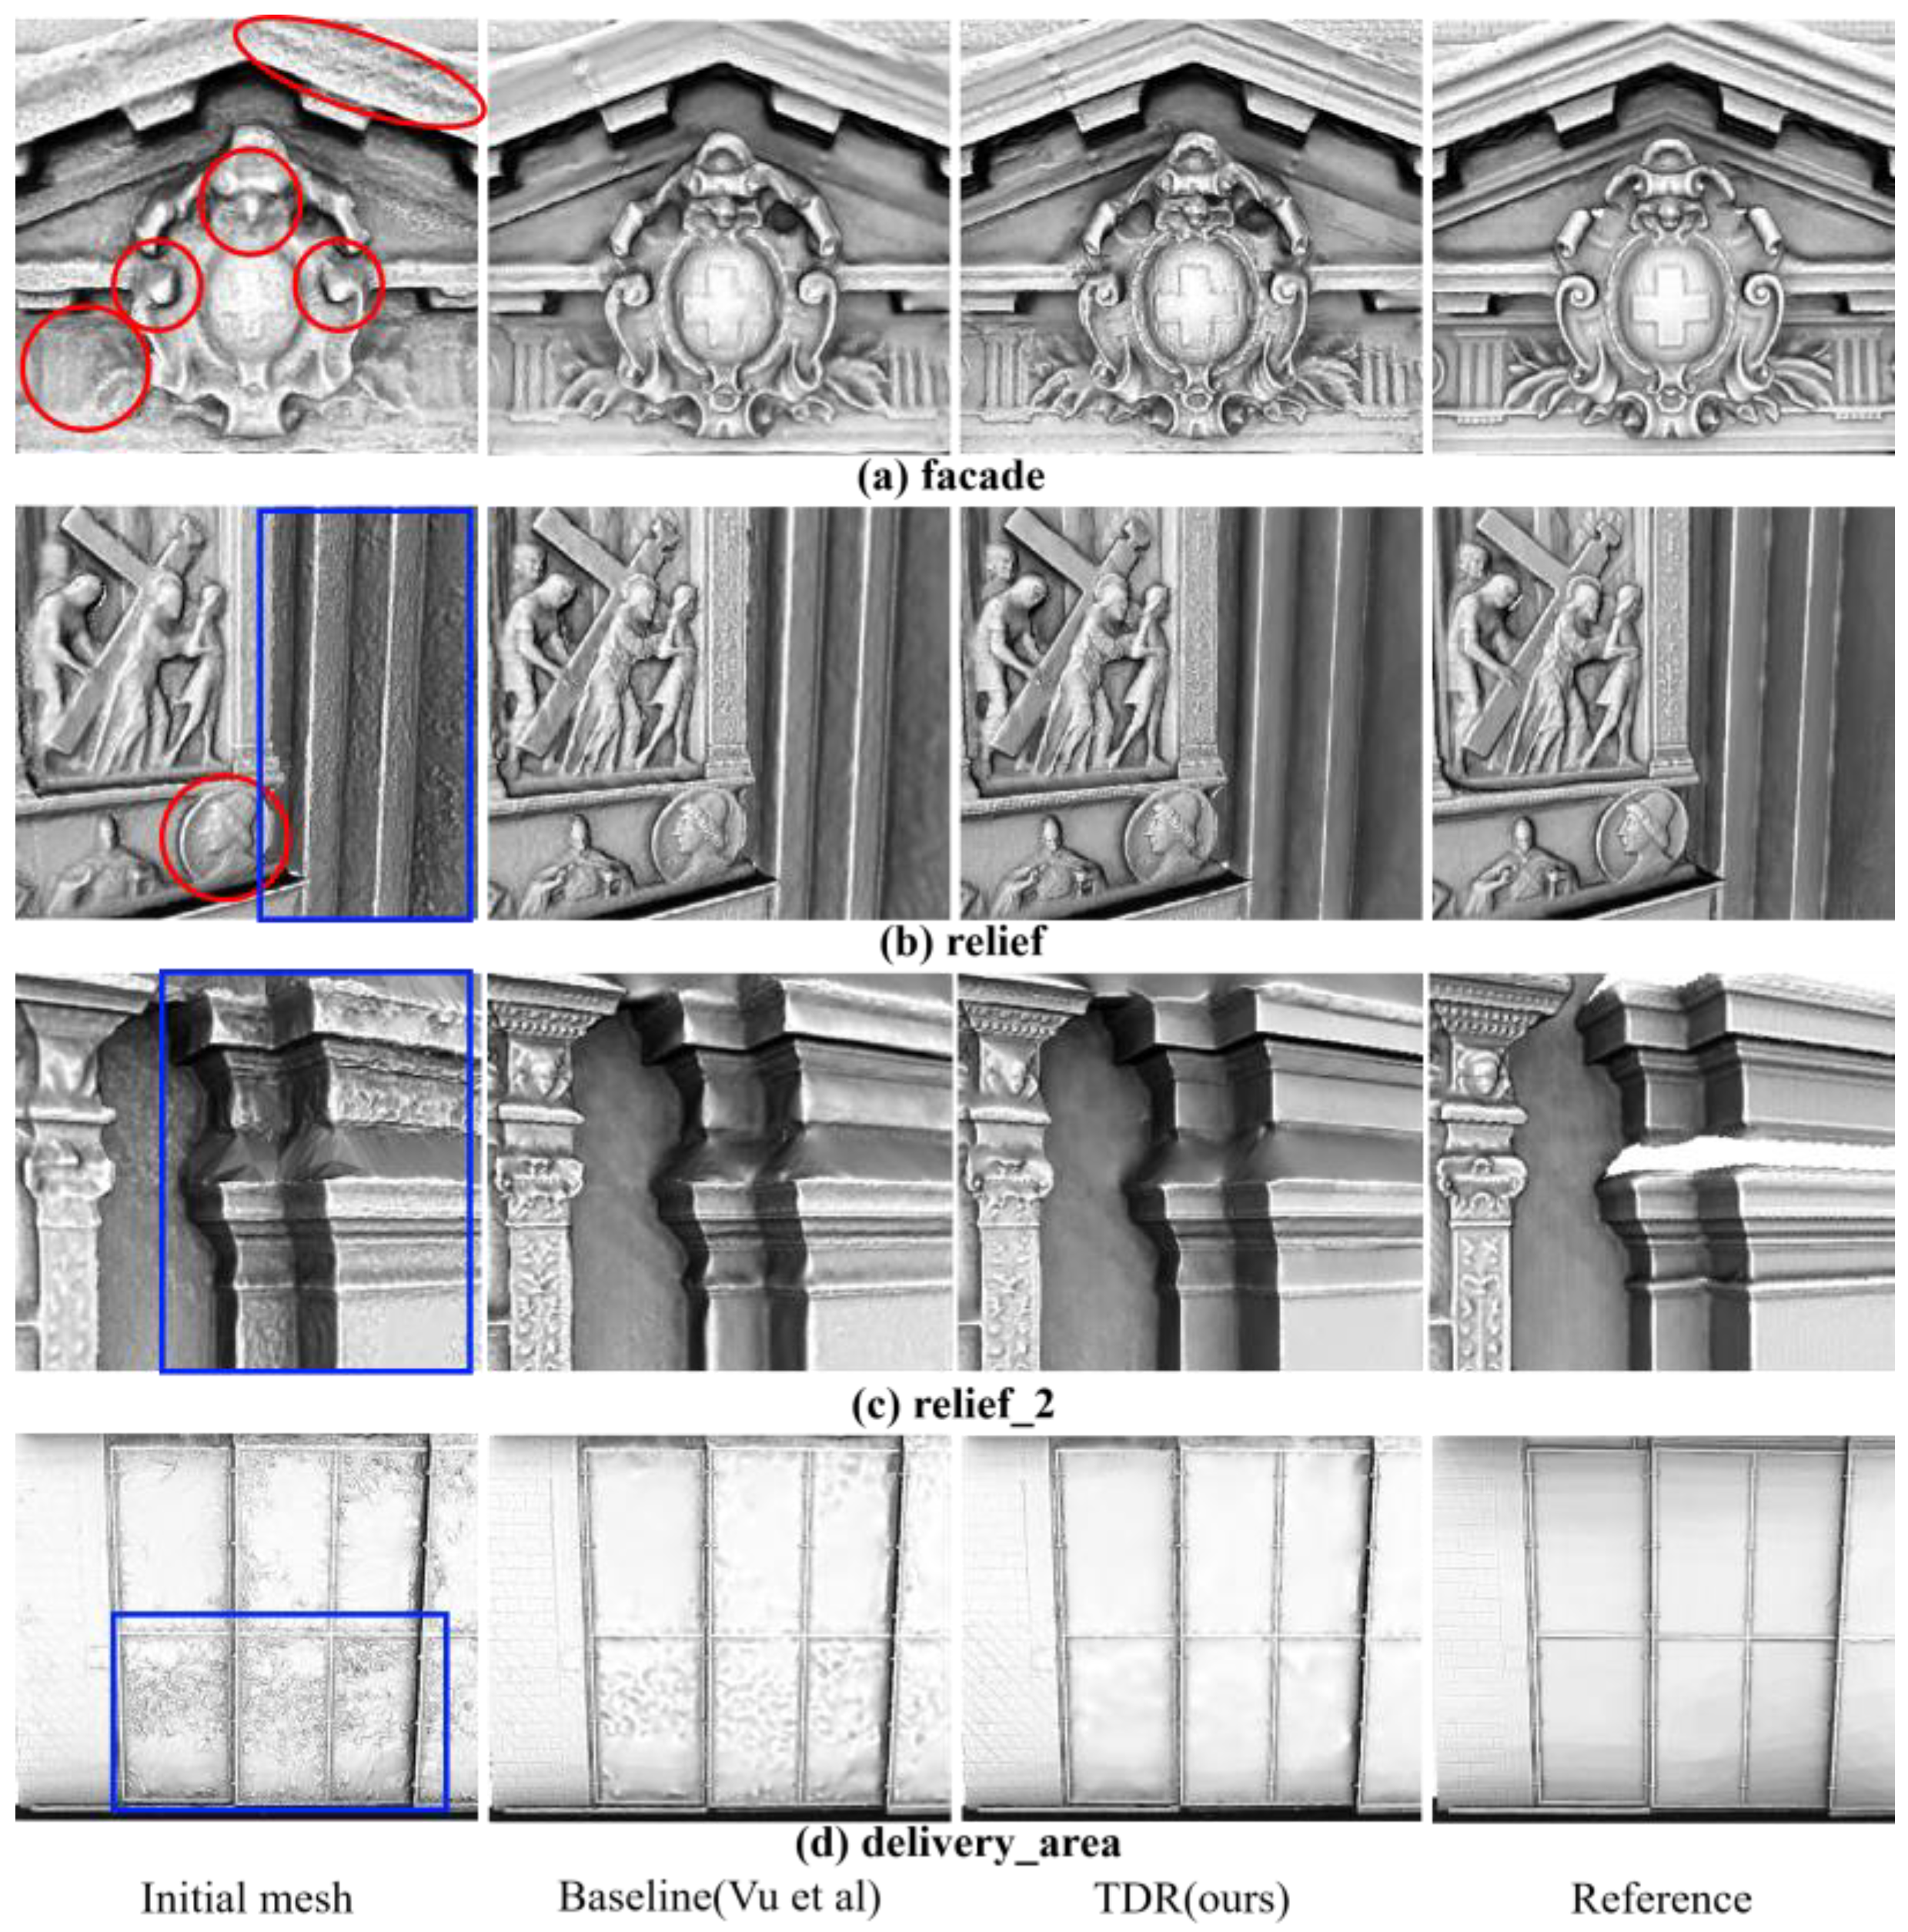
ETH3D dataset: This dataset has ultrahigh-resolution images and provides the laser scan point cloud with the registered images. We use the Poisson surface reconstruction [28] to obtain the reference mesh. Figure 8 shows the results of our experiment. Comparing the baseline method, our TDR method which utilized TDPG has better mesh details (see the red ellipses in Figure 8). Then, Figure 8c,d show that the initial mesh has substantial noise in texture-less regions. The baseline method using the isotropic denoising method cannot effectively remove this noise and retain sharp edges, while our TDR methods can effectively achieve these effects (see the blue rectangles in Figure 8). The results of the accuracy evaluation are shown in Table 3. Since the captured images are close to objects, we set d as 0.005 m. Table 3 shows that the proposed TDR algorithm achieves the best results in terms of almost all quantitative metrics.
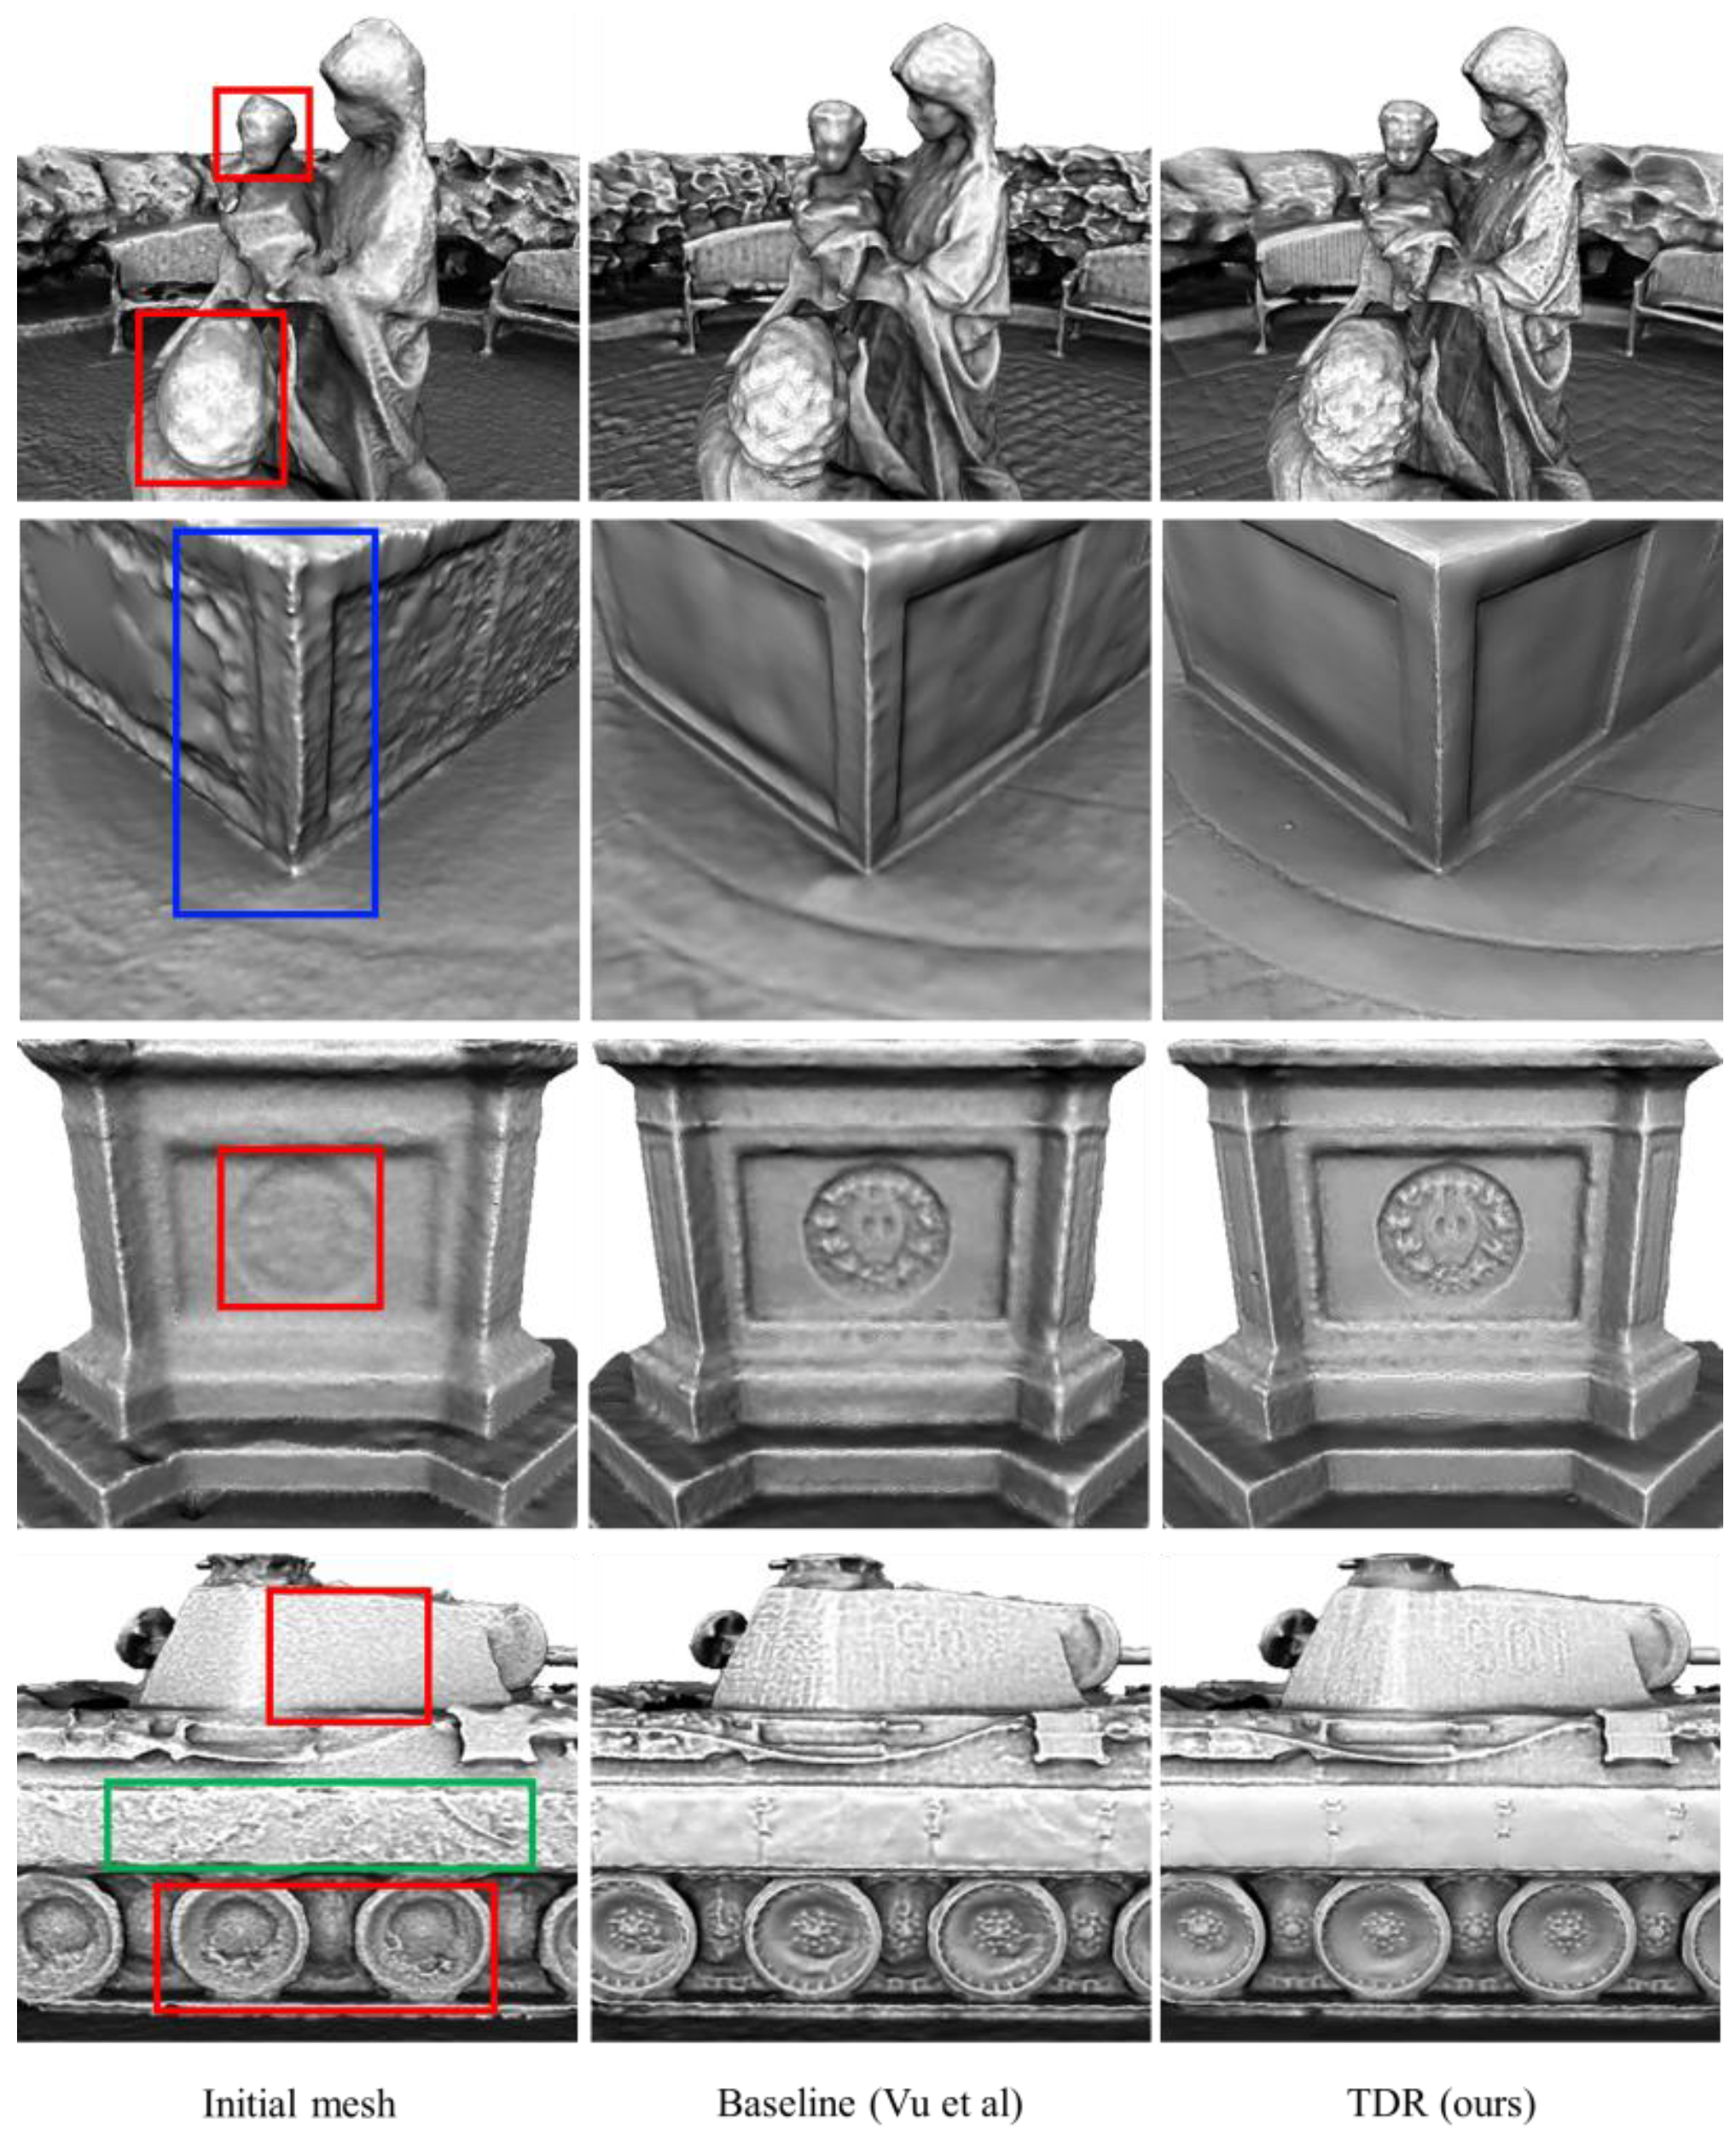
Tanks and Temples dataset: This dataset does not provide image poses that are registered with the reference point cloud. Therefore, the results of this experiment are qualitatively evaluated. Compared with the baseline algorithm, results of the proposed TDR method have finer details (the red boxes in Figure 9), flatter planes (the green boxes in Figure 9), and sharper edges (the blue boxes in Figure 9). This proves the effectiveness of the two improvements in this paper.

3.3. Discussion

3.3.1. Ablation Experiment

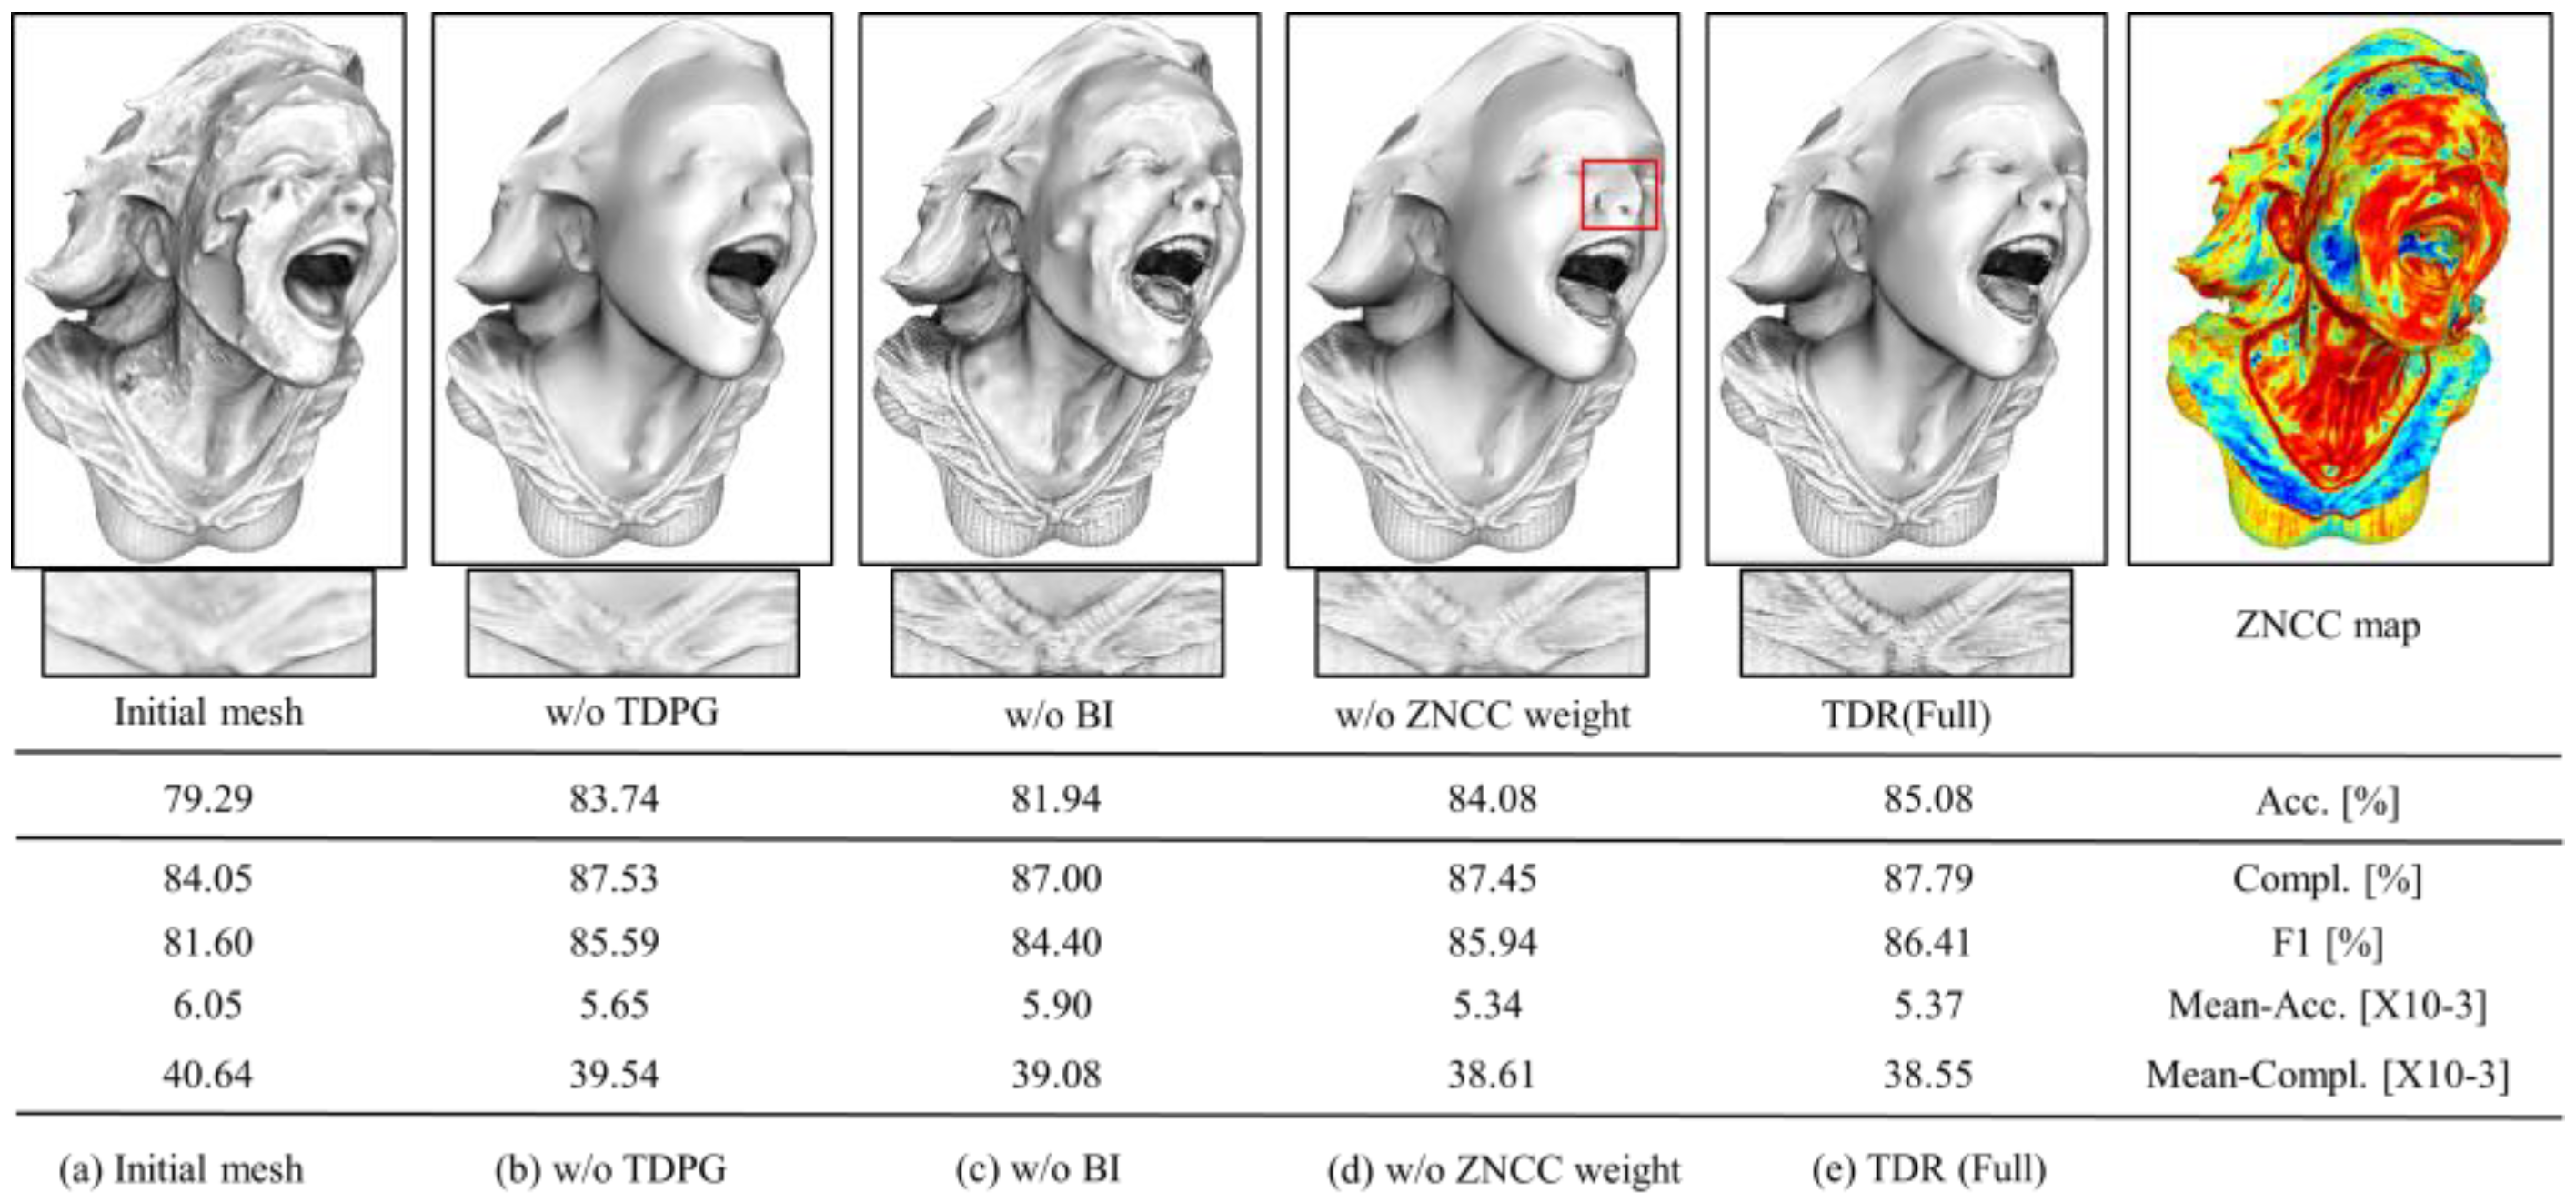
We evaluated the effectiveness of the two improvements in TDR in the simulated CG dataset (see Figure 10), and ablation experiments were conducted. We tested four different configurations: (1) w/o TDPG: using PDPG and self-adaptive bilateral regularization. (2) w/o BI: using TDPG and Laplace regularization. (3) w/o ZNCC weighted: using TDPG and bilateral regularization without ZNCC weighted. (4) Full TDR: using TDPG and self-adaptive bilateral regularization. Figure 11 shows the results. There are giant pits in the face of the initial mesh due to a sizeable texture-less area in the rendered images (Figure 11). The meshes using bilateral regularization (b–d) do not show this error. Comparing (b) with (e) in Figure 11, we found that TDPG presents a more detailed and accurate result than PDPG. Comparing (d) with (e), the ZNCC weighted strategy succeeded in preserving mesh details (see the red box in Figure 11d).

3.3.2. The Influence of Initial Meshes

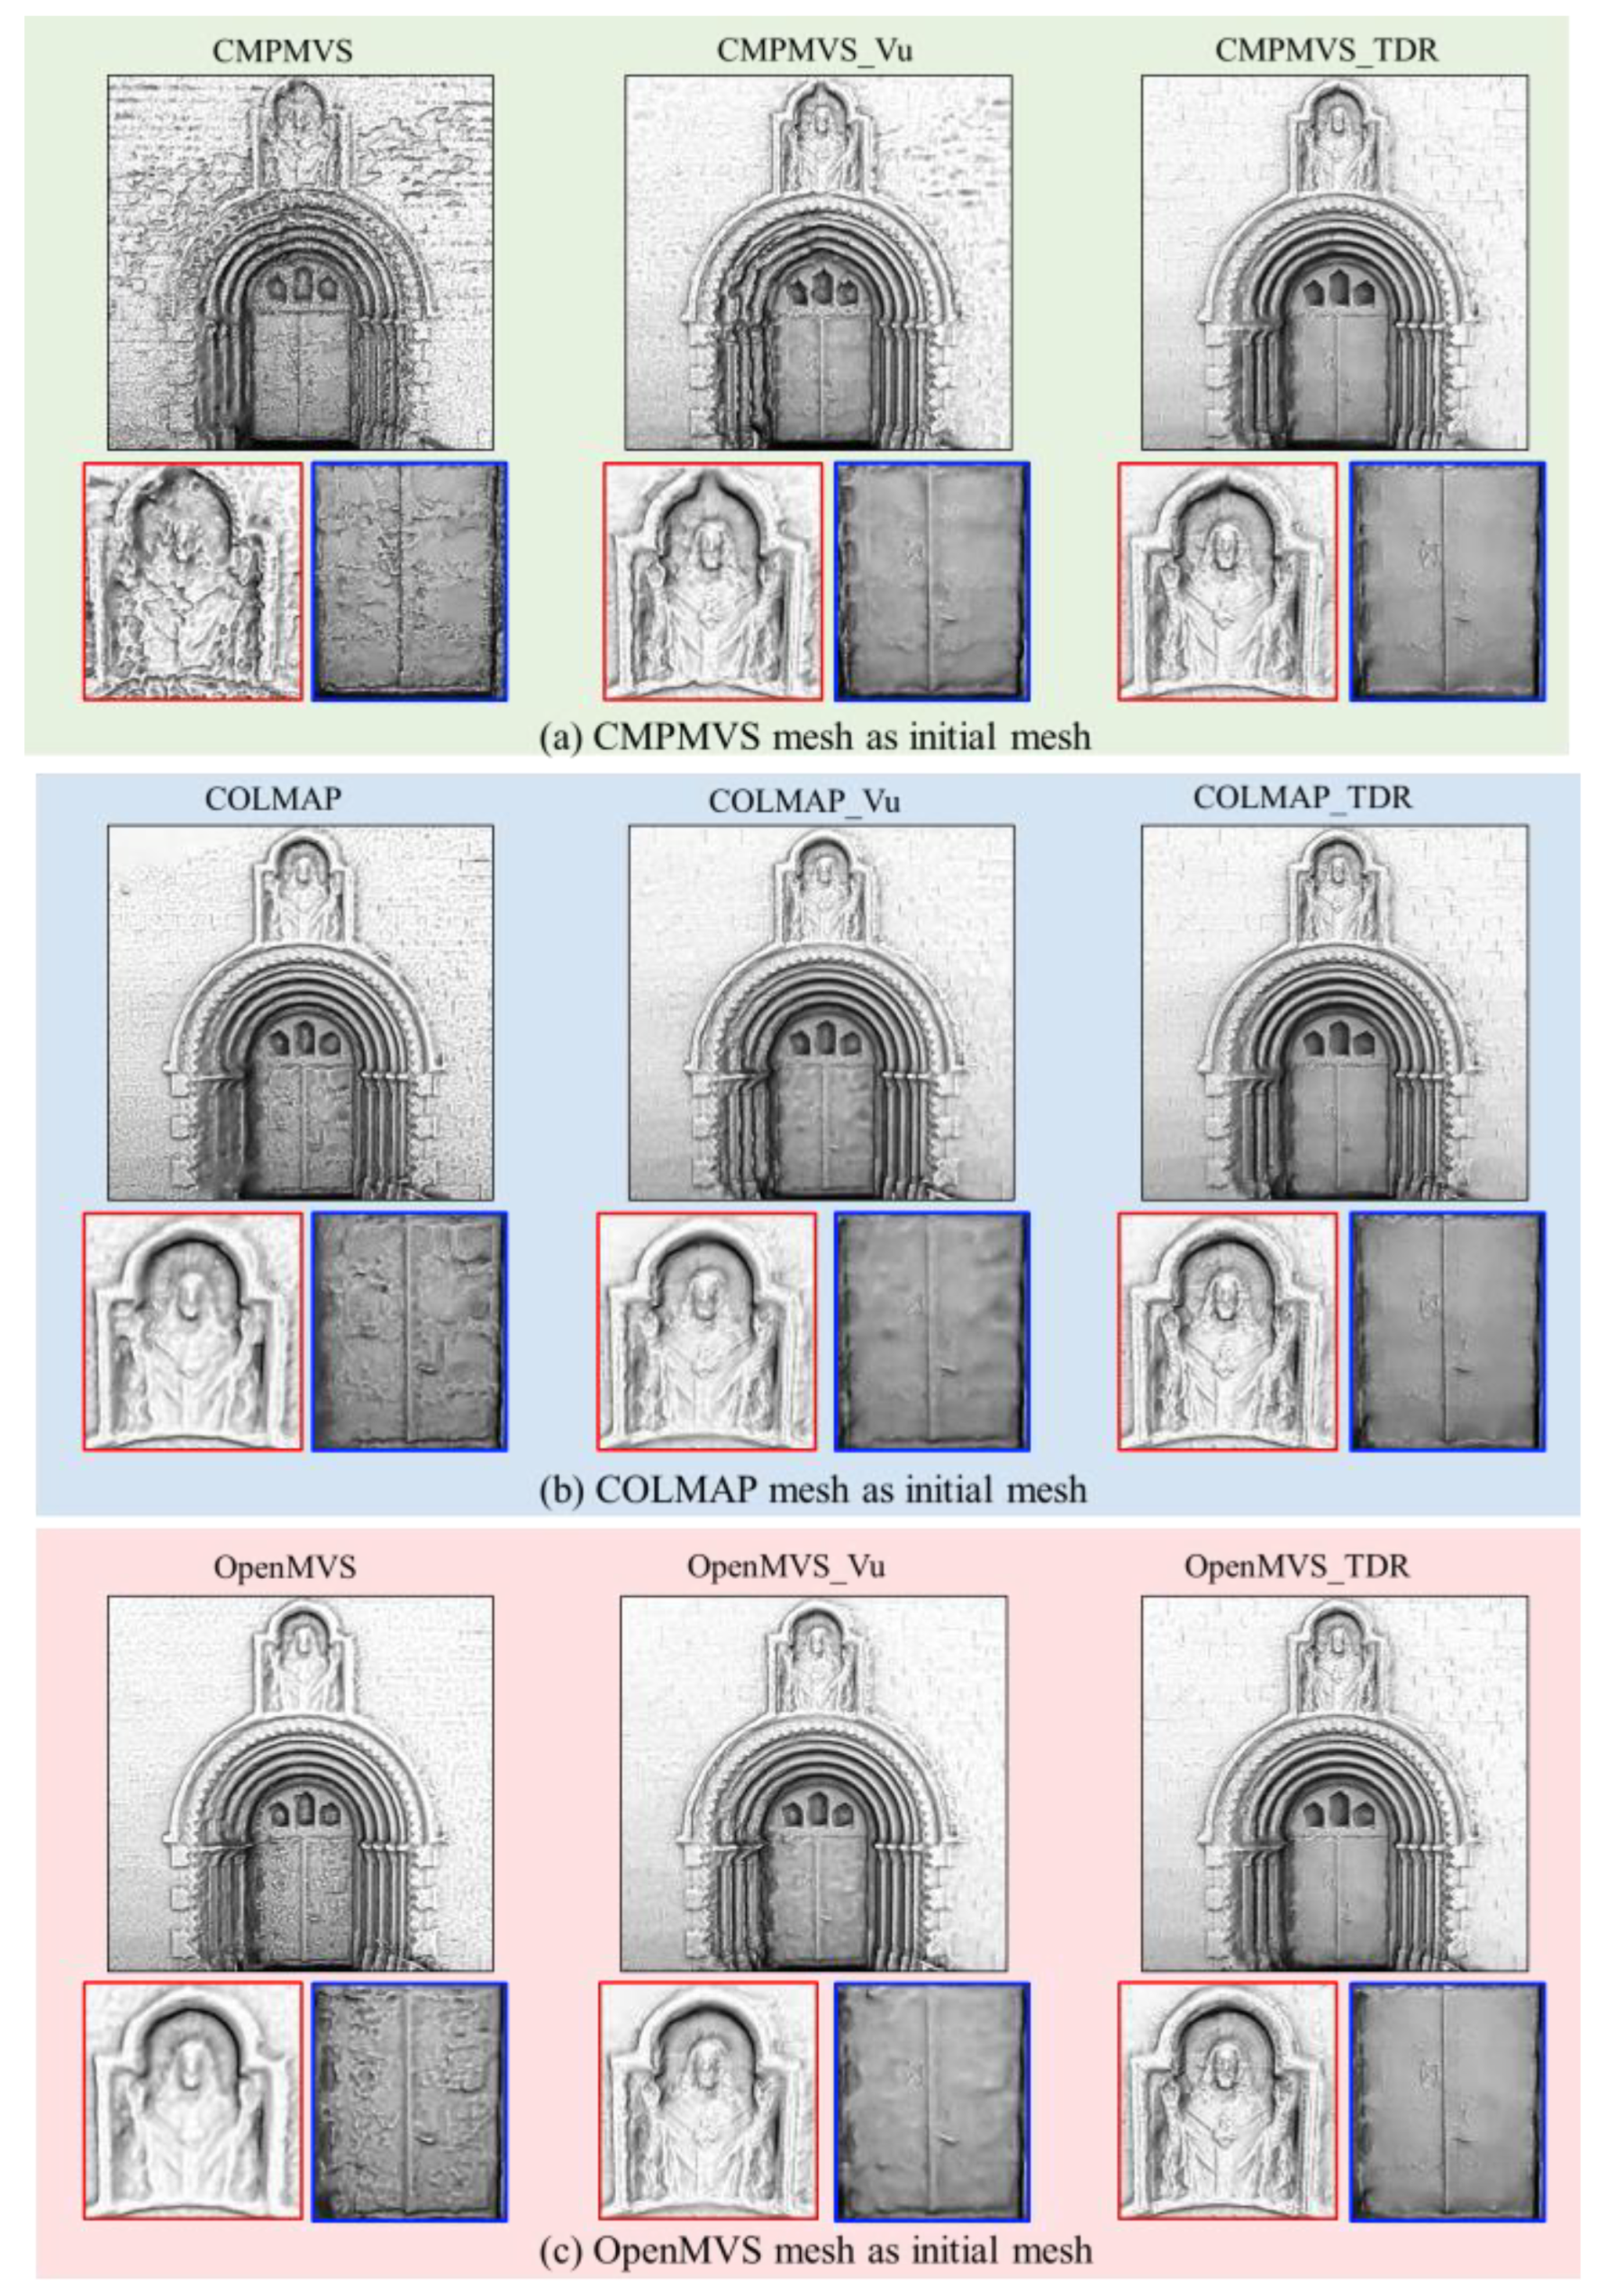
To discuss the impact of initial meshes on the TDR algorithm, the widely used CMPMVS mesh, OpenMVS mesh, and COLMAP mesh models were chosen as initial meshes for comparisons. We also added the baseline method [13] for comparison. The baseline algorithm generated the CMPMVS_Vu mesh, OpenMVS_Vu mesh, and CCOLMAP_Vu mesh. The TDR method generated the CMPMVS_TDR mesh, OpenMVS_TDR mesh, and COLMAP_TDR mesh.
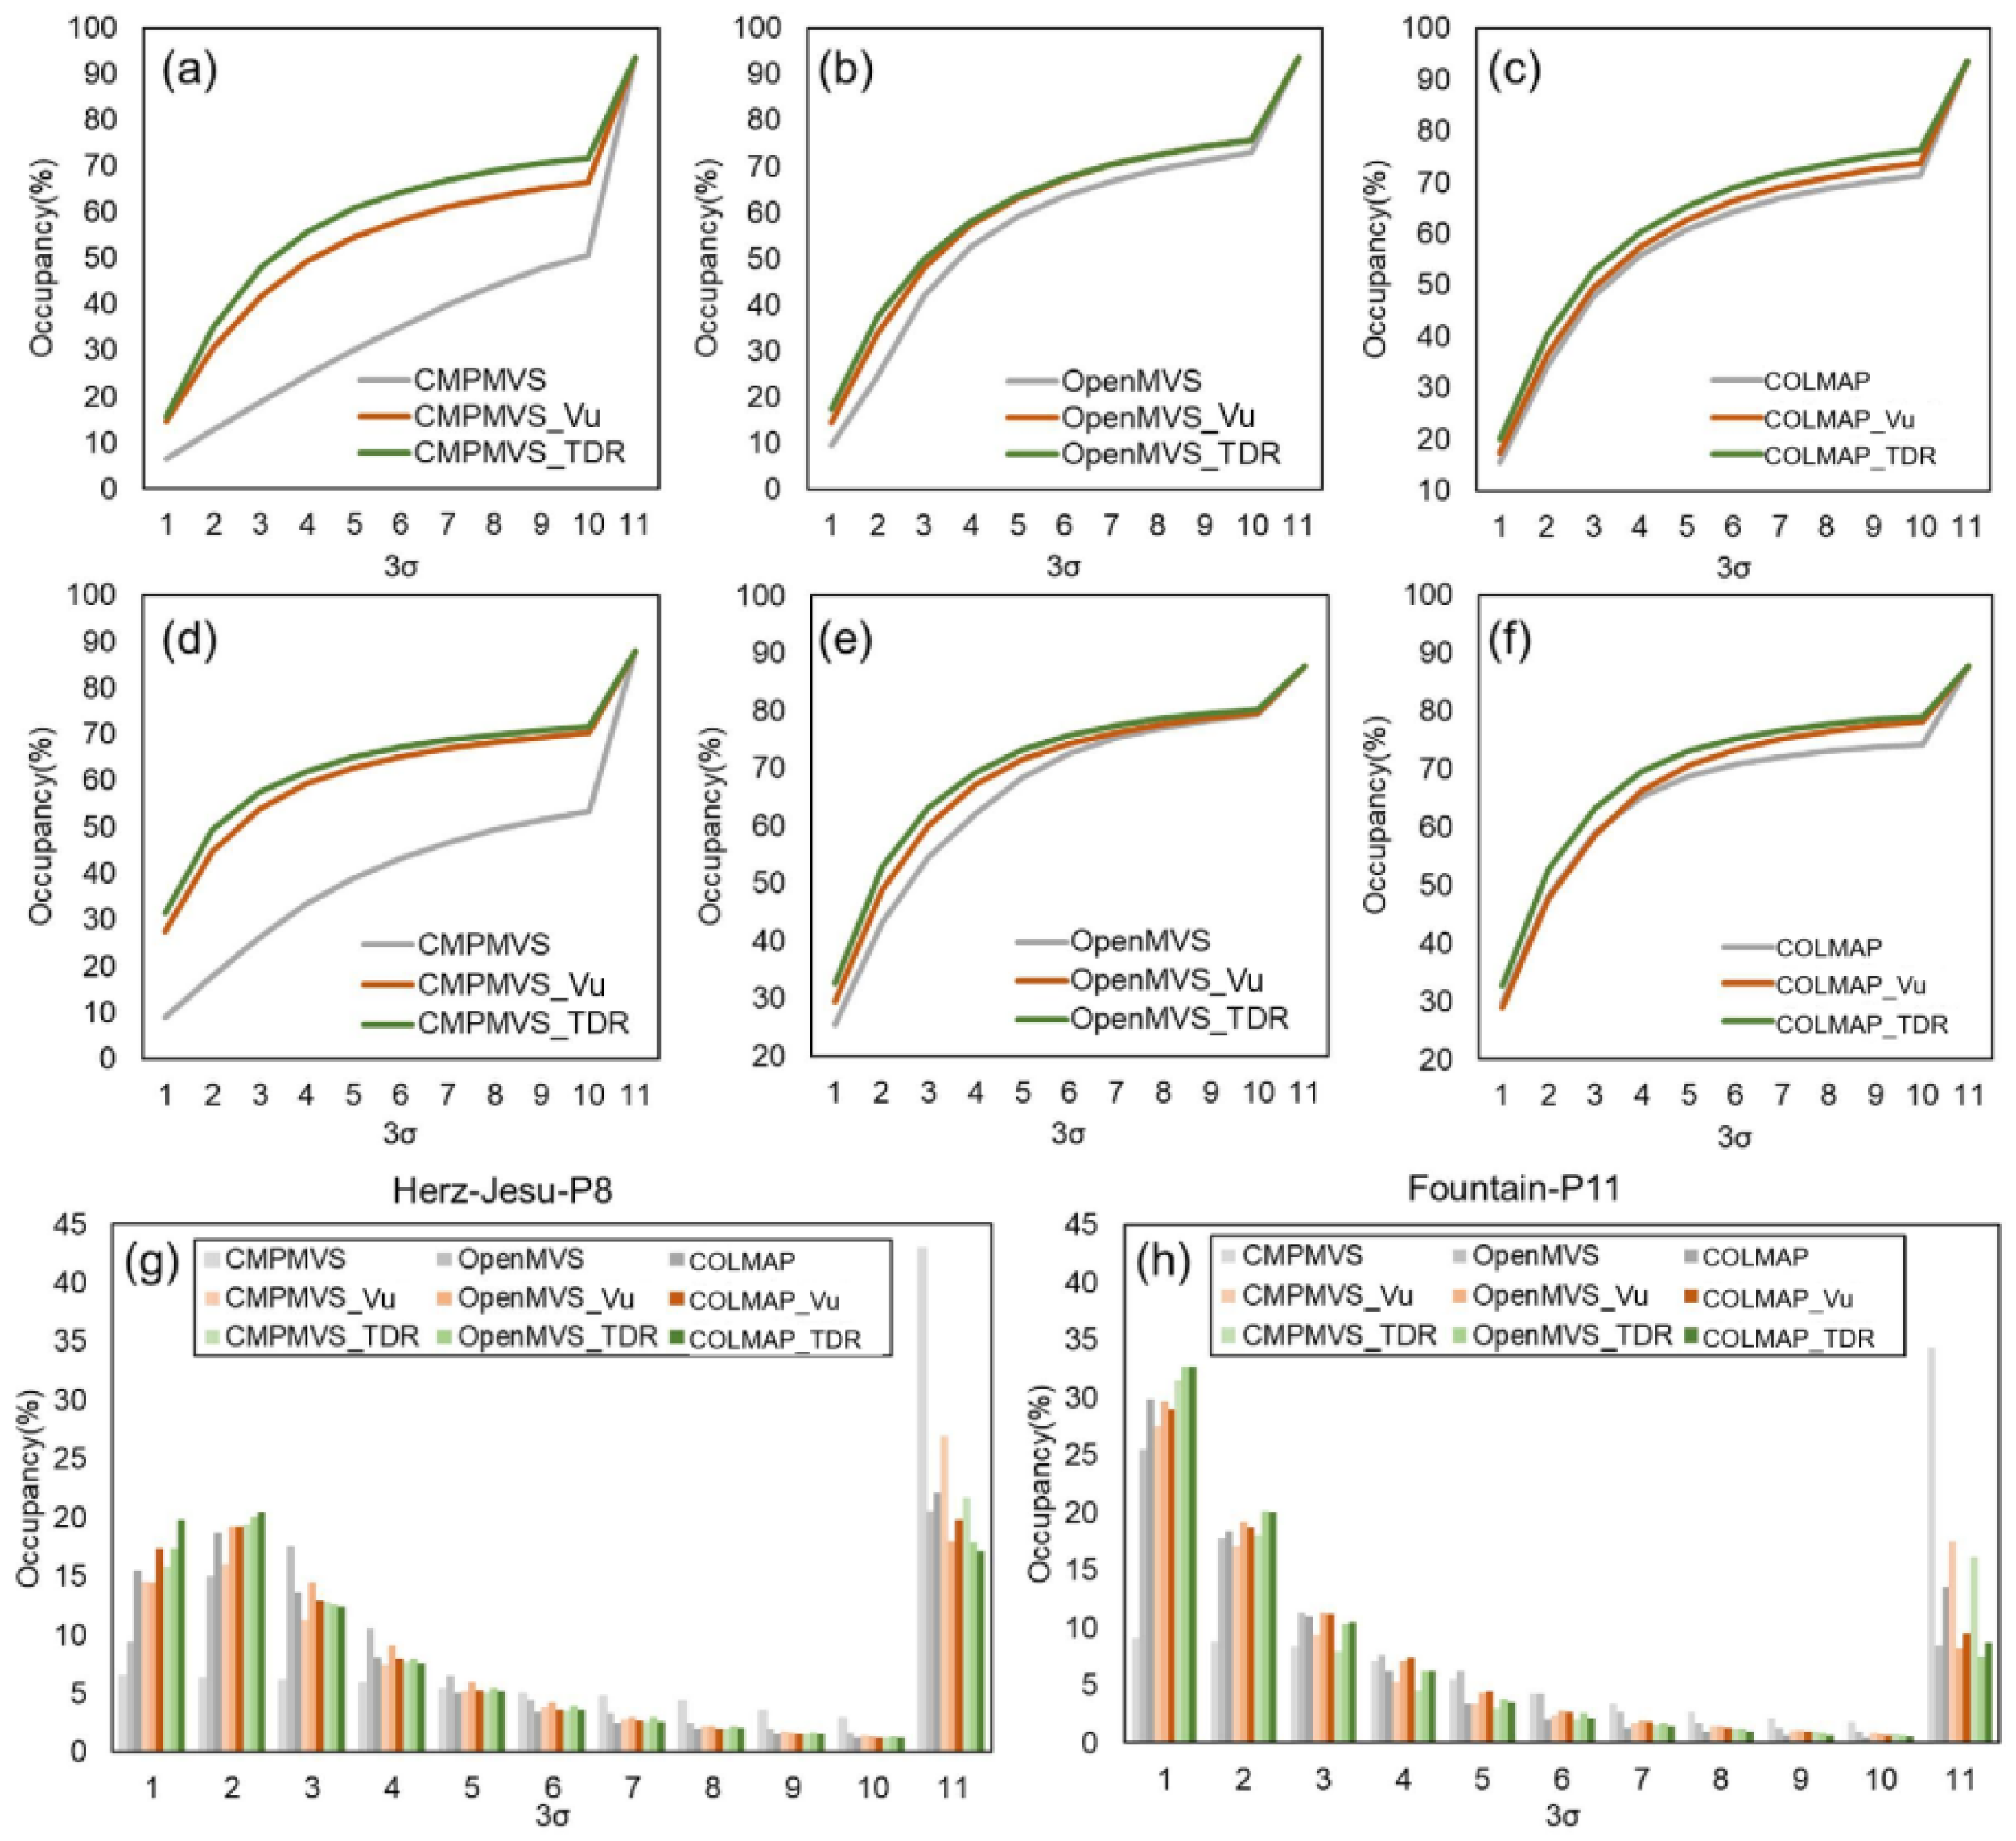
In this section, we use the EPFL dataset [27] for evaluation. This benchmark is designed for mesh evaluation. Therefore, we test our results using the evaluation metric proposed in this benchmark. First, the reference and the input mesh are projected into the same image, and the residual of the depth of each pixel is calculated. Then, the occupancy rates of the residuals from 3 σ ( σ = 1.1 mm) to 10-times 3 σ are counted. Finally, the occupancy rates of the residuals of all images are averaged to obtain the final occupancy distribution histogram and occupancy density map, as shown in Figure 12. In addition, the weighted average of the residual distribution histogram can be drawn to obtain the accuracy metric. The proportions of the part less than 30 σ are counted as the completeness metric [27], shown in Table 4.
Table 4 and Figure 13 show that, regardless of the initial mesh, the precision improvement brought by the TDR algorithm is much more significant than that of the baseline algorithm. For both TDR and baseline methods, the accuracy and completeness of the refined meshes are high if the initial meshes are accurate, and vice versa. The reason is that mesh refinement is a nonconvex problem and has a certain dependence on the initial value when using the gradient descent method to solve it.
Figure 13 shows the visual results for Herz-Jesu-P8. Even when handling a very poor initial mesh, TDR still reconstructs a good result (Figure 13a). All initial meshes have considerable noise at the door region (the blue boxes in Figure 13). The TDR method outperforms the baseline method in mesh denoising ability. What is more commendable is that the proposed algorithm with a strong regularization term well retains the details in the human sculpture (the red boxes in Figure 13). This is attributed to the self-adaptive weighted denoising strategy, which effectively combines the photo-consistency gradient and the mesh denoising gradient, with the denoising gradient mainly applied to the noise areas.
In other words, due to the stronger denoising ability, the TDR method can handle a worse initial mesh model.

3.3.3. Running Times Evaluation

In this section, we discuss the running time of our 3D reconstruction system and TDR algorithm on datasets EPFL and Tanks and Temples.
Our 3D reconstruction system comprises SFM, MVS, mesh reconstruction and mesh refinement steps. The SFM step uses COLMAP (CUDA version) with default parameters. The MVS and mesh reconstruction step uses OpenMVS with default parameters. The proposed TDR algorithm is used in the mesh refinement stage with no special performance optimization. Table 5 shows the processing times of the 3D reconstruction system. The SFM, MVS, mesh reconstruction, and mesh refinement time ratios are about 16%, 25%, 4%, and 55%, respectively. Although the mesh refinement step evolves the initial mesh to a high quality with fine details, it cost the most time in the 3D reconstruction system.
Table 6 shows the time consumption of critical steps in the TDR and the baseline method. The two improvements of our method correspond to the computation of M and g r e g u l a r i z a t i o n , respectively. On the one hand, the PDPG method can use the integral image [29] to accelerate calculations, while the TDPG method cannot. On the other hand, PDPG calculates the partial differential once per pixel, while TDPG calculates the 25 times partial differential for the 5 × 5 image patch. Therefore, the running time of M is 8~13 times that of PDPG in the experimental data. For the regularization item g r e g u l a r i z a t i o n , the baseline method takes less than 1 s on all experimental data. Our TDR method utilizes the bilateral normal filter method, thus increasing the time consumption, but the time ratio does not exceed 2% of the total time. Overall, the running time of our method is 1.5~2 times more than the baseline method due to a time increase for TDPG.

3.4. Comparison with Open Source and Commercial Software

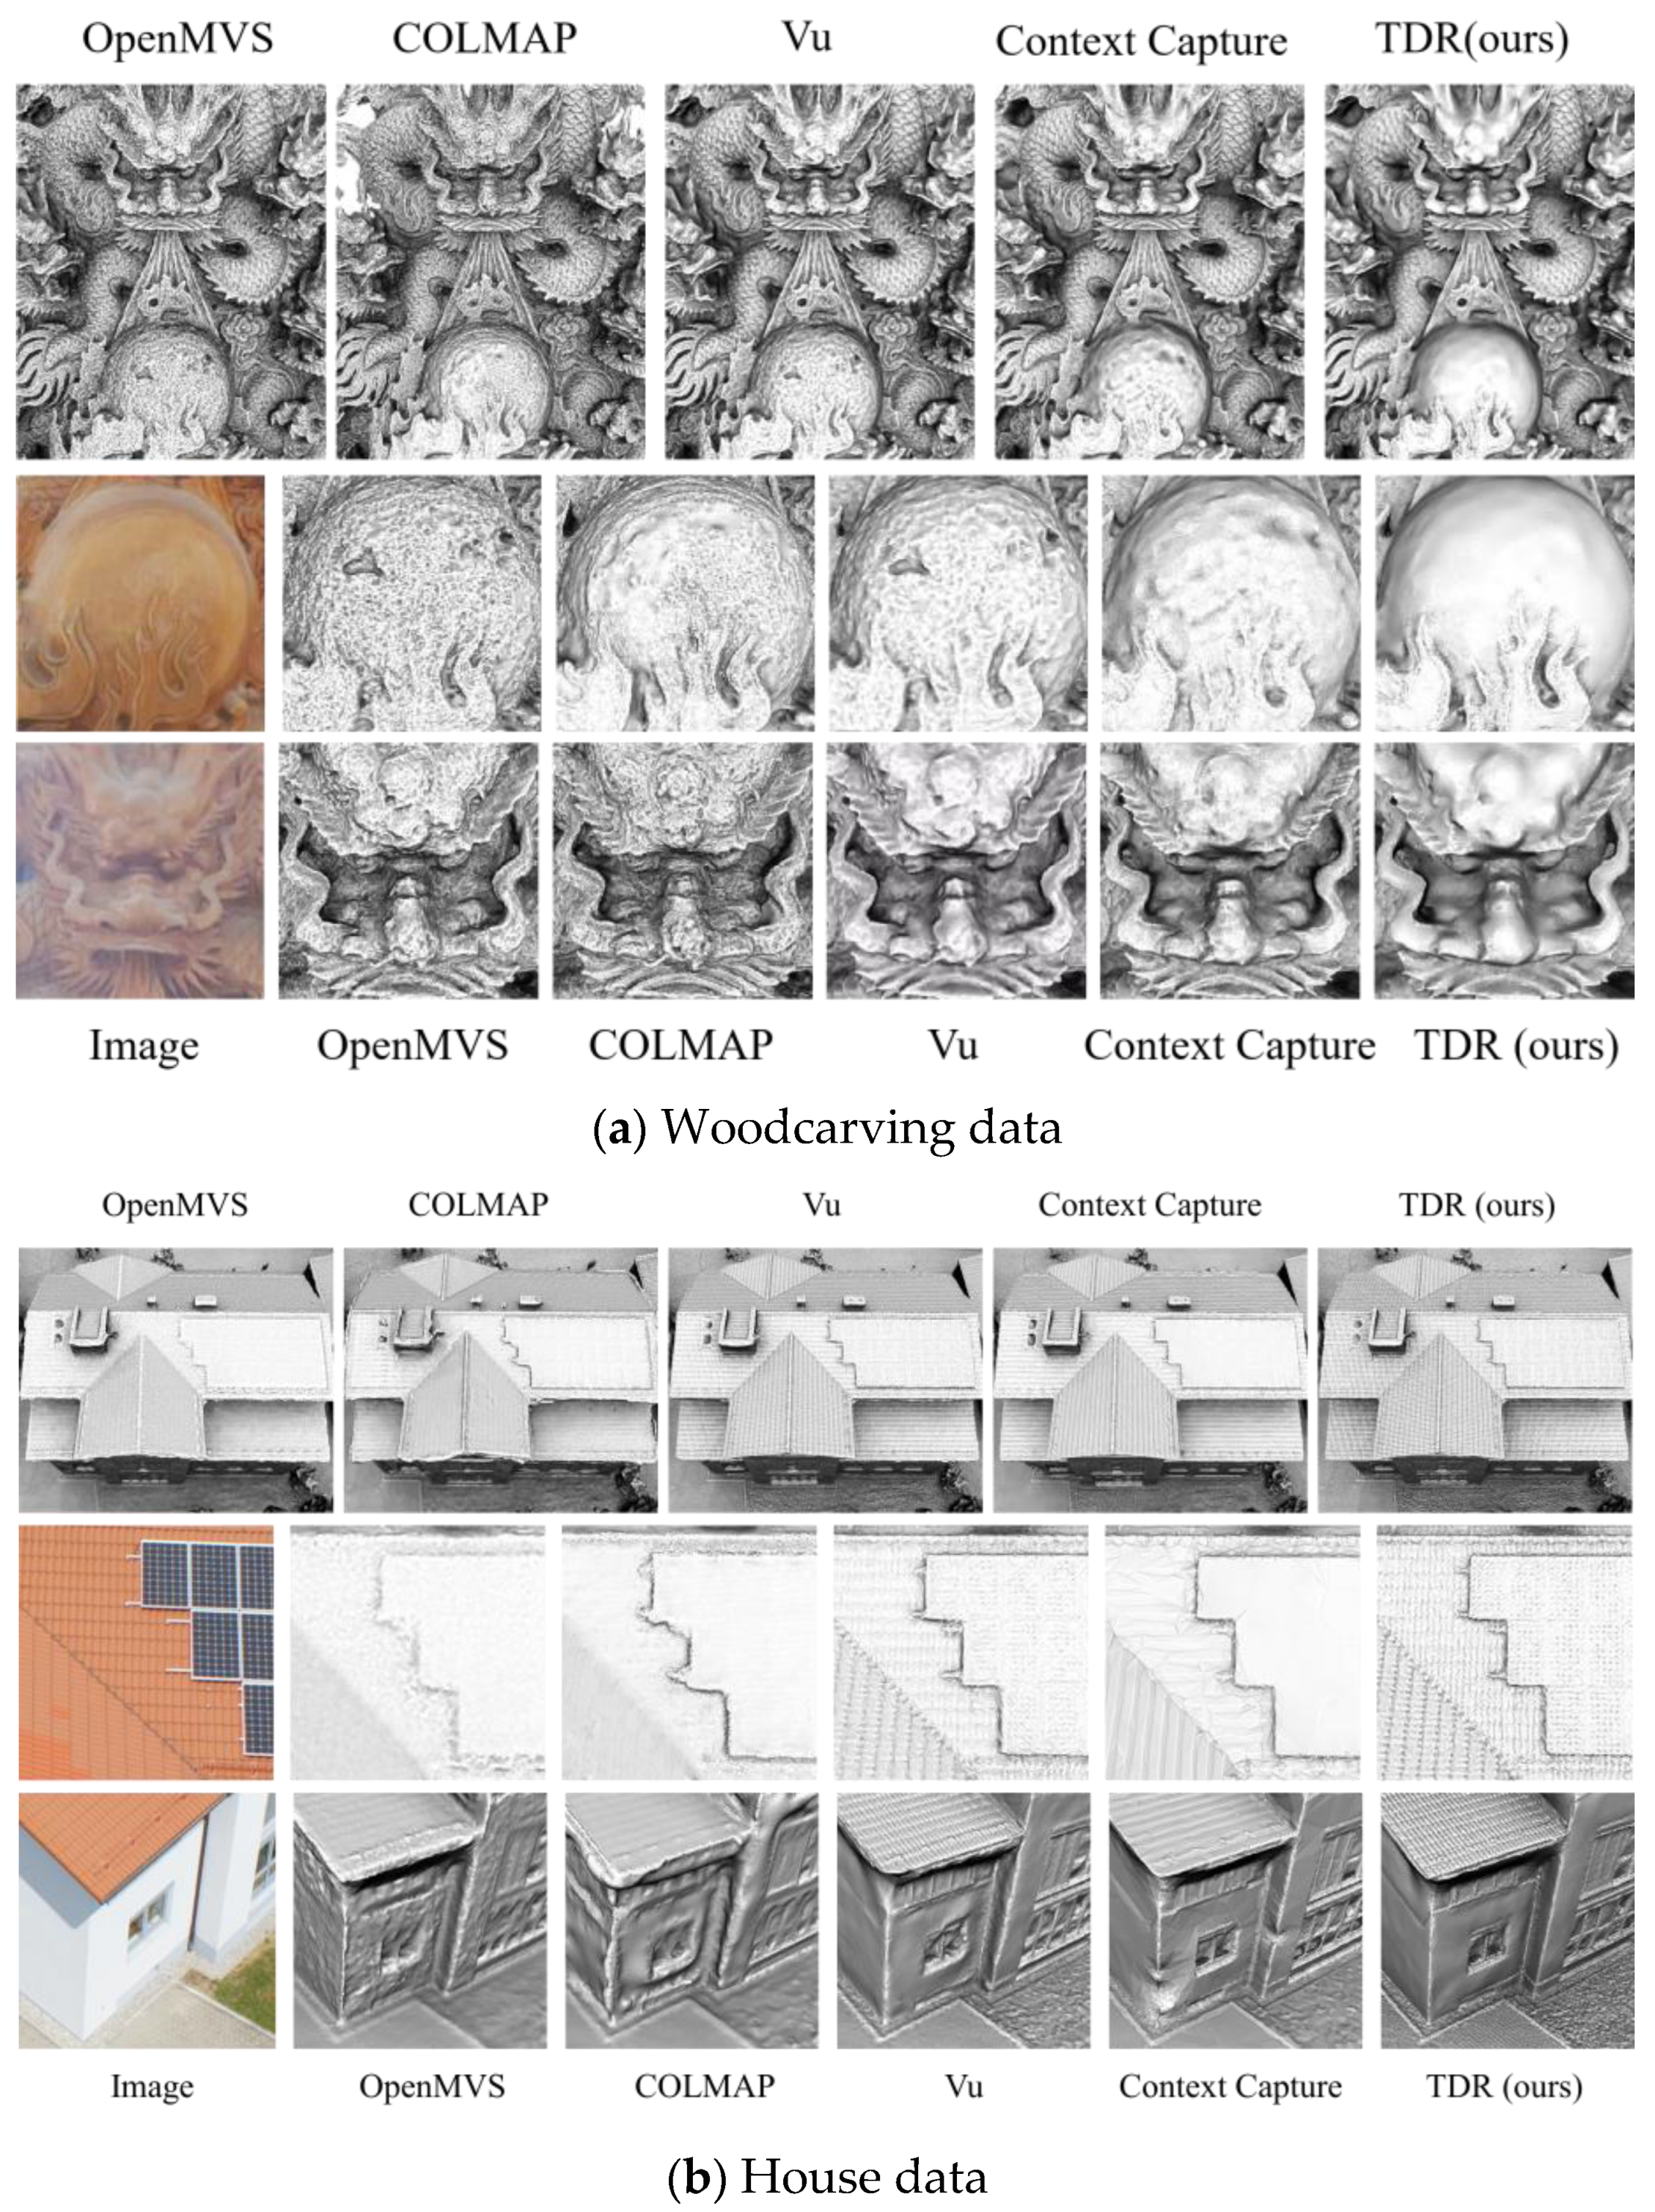
In this section, we compare our method with representative open source software (OpenMVS and COLMAP), commercial software (Context Capture [30]), and the baseline method [13]. Figure 14 visually compares the reconstructed 3D models on the Personal Collection Dataset. OpenMVS can reconstruct the overall shapes, although some fine details are lost (the roof in the House data), and noise is covered on the smooth surface (all enlarged parts in Figure 14). The COLMAP mesh is similar to the OpenMVS mesh, with slightly more details (the roof in the House data) but fails in texture-less regions (the white wall in the House data). The Context Capture mesh also fails in texture-less regions (the white wall in the House data), and it is too smooth, which causes details loss (roof in the House data). The method of [13] enhances the details of the initial mesh to a certain extent (the roof in the House data), but the mesh noise is still not eliminated, and the edges are not sharpened (the white wall in the House data). In contrast, due to the strong denoising ability brought by the bilateral normal filter, our mesh result on the Woodcarving data is the smoothest, and the house edges are the sharpest. At the same time, the TDPG recovers the most details.

4. Conclusions

This study proposed a new mesh refinement approach coupling total differential photometric mesh refinement and self-adapted mesh denoising. On the one hand, traditional PDPG in variational mesh refinement is replaced by TDPG. TDPG considers the neighboring pixels and increases the area affected by the gradient, which results in more effective convergence of the photo-consistency, thus increasing the details and accuracy of the mesh. On the other hand, the self-adaptive denoising strategy provides a framework for image-guided mesh denoising. The intensity of the denoising gradient can be adaptively adjusted according to the multiview ZNCC metric, which facilitates the removal of significant errors in the initial mesh and preserving mesh details. Experiments on different scenes and comparisons with open-source and commercial software were conducted. The refined meshes are evaluated in terms of both accuracy and completeness. Results showed that our method outperformed current variational mesh refinement methods and is comparable and even better than commercial software, and the mesh refined by our method is the most detailed, accurate, and regular. In the future, we plan to run our method on GPU and explore the fusion of subpixel sampling and photometric stereo technology with mesh refinement.

Author Contributions

Methodology, Y.Q.; writing—original draft preparation, Y.Q.; writing—review and editing, Q.Y., J.Y., T.X. and F.D. All authors have read and agreed to the published version of the manuscript.

Funding

This work was supported in part by the Ningbo Key Research and Development Project (No. 20201ZDYF020236) and Hubei Key Research and Development Project (NO. 2022BAA035).

Institutional Review Board Statement

Not applicable.

Data Availability Statement

The Tanks And Temples Dataset can be obtained from https://www.tanksandtemples.org/ (accessed on 20 December 2022). The ETH3D Dataset can be obtained from https://www.eth3d.net/ (accessed on 20 December 2022). The EPFL Dataset can be obtained from https://icwww.epfl.ch/multiview/denseMVS.html (accessed on 20 December 2022). The BlendedMVS dataset can be obtained from https://github.com/YoYo000/BlendedMVS (accessed on 20 December 2022). The CG Simulation and Personal Collection datasets are available from the corresponding author upon reasonable request.

Acknowledgments

The authors are grateful to the providers of the Temples and Tanks dataset, the Strecha dataset, and the three computer graph mesh models (Joyful, Armadillo, and Happy_vrip). We would also like to thank researchers who published open-source code or programs used to generate the CMPMVS meshes, OpenMVS meshes, and COLMAP meshes in our experiments.

Conflicts of Interest

The authors declare no conflict of interest.

References

  1. Ju, Y.; Shi, B.; Jian, M.; Qi, L.; Dong, J.; Lam, K.-M. NormAttention-PSN: A High-frequency Region Enhanced Photometric Stereo Network with Normalized Attention. Int. J. Comput. Vis. 2022, 130, 3014–3034. [Google Scholar] [CrossRef]
  2. Yang, J.; Ding, B.; He, Z.; Pan, G.; Cao, Y.; Cao, Y.; Zheng, Q. ReDDLE-Net: Reflectance Decomposition for Directional Light Estimation. Photonics 2022, 9, 656. [Google Scholar] [CrossRef]
  3. Ju, Y.; Jian, M.; Guo, S.; Wang, Y.; Zhou, H.; Dong, J. Incorporating lambertian priors into surface normals measurement. IEEE Trans. Instrum. Meas. 2021, 70, 1–13. [Google Scholar] [CrossRef]
  4. Ju, Y.; Peng, Y.; Jian, M.; Gao, F.; Dong, J. Learning conditional photometric stereo with high-resolution features. Comput. Vis. Media 2022, 8, 105–118. [Google Scholar] [CrossRef]
  5. Liu, Y.; Ju, Y.; Jian, M.; Gao, F.; Rao, Y.; Hu, Y.; Dong, J. A deep-shallow and global–local multi-feature fusion network for photometric stereo. Image Vis. Comput. 2022, 118, 104368. [Google Scholar] [CrossRef]
  6. Romanoni, A.; Matteucci, M. Facetwise Mesh Refinement for Multi-View Stereo. In Proceedings of the 2020 25th International Conference on Pattern Recognition (ICPR), Milan, Italy, 10–15 January 2021; pp. 6794–6801. [Google Scholar]
  7. Li, Z.; Wang, K.; Zuo, W.; Meng, D.; Zhang, L. Detail-Preserving and Content-Aware Variational Multi-View Stereo Reconstruction. Ieee Trans. Image Process. 2016, 25, 864–877. [Google Scholar] [CrossRef] [PubMed] [Green Version]
  8. Romanoni, A.; Matteucci, M. Mesh-based camera pairs selection and occlusion-aware masking for mesh refinement. Pattern Recognit. Lett. 2019, 125, 364–372. [Google Scholar] [CrossRef] [Green Version]
  9. Blaha, M.; Rothermel, M.; Oswald, M.R.; Sattler, T.; Richard, A.; Wegner, J.D.; Pollefeys, M.; Schindler, K. Semantically Informed Multiview Surface Refinement. In Proceedings of the 2017 IEEE International Conference on Computer Vision, Venice, Italy, 22–29 October 2017; pp. 3839–3847. [Google Scholar]
  10. Romanoni, A.; Ciccone, M.; Visin, F.; Matteucci, M. Multi-view Stereo with Single-View Semantic Mesh Refinement. In Proceedings of the 2017 IEEE International Conference on Computer Vision Workshops (ICCVW), Venice, Italy, 22–29 October 2017; pp. 706–715. [Google Scholar]
  11. Zheng, Y.; Fu, H.; Au, O.K.; Tai, C.L. Bilateral normal filtering for mesh denoising. IEEE Trans. Vis. Comput. Graph 2011, 17, 1521–1530. [Google Scholar] [CrossRef] [PubMed]
  12. Pons, J.-P.; Keriven, R.; Faugeras, O. Multi-view stereo reconstruction and scene flow estimation with a global image-based matching score. Int. J. Comput. Vis. 2007, 72, 179–193. [Google Scholar] [CrossRef]
  13. Vu, H.H.; Labatut, P.; Pons, J.P.; Keriven, R. High accuracy and visibility-consistent dense multiview stereo. IEEE Trans. Pattern Anal. Mach. Intell. 2012, 34, 889–901. [Google Scholar] [CrossRef] [PubMed]
  14. Li, S.; Siu, S.Y.; Fang, T.; Quan, L. Efficient multi-view surface refinement with adaptive resolution control. In Proceedings of the European Conference on Computer Vision, Amsterdam, The Netherlands, 11–14 October 2016; Springer: Cham, Switzerland, 2016; pp. 349–364. [Google Scholar]
  15. Kobbelt, L.; Campagna, S.; Vorsatz, J.; Seidel, H.-P. Interactive multi-resolution modeling on arbitrary meshes. In Proceedings of the 25th Annual Conference on Computer Graphics and Interactive Techniques, Orlando, FL, USA, 19–24 July 1998; pp. 105–114. [Google Scholar]
  16. Zhang, H.; Wu, C.; Zhang, J.; Deng, J. Variational mesh denoising using total variation and piecewise constant function space. IEEE Trans. Vis. Comput. Graph. 2015, 21, 873–886. [Google Scholar] [CrossRef] [PubMed]
  17. Byrd, R.H.; Lu, P.H.; Nocedal, J.; Zhu, C.Y. A Limited Memory Algorithm for Bound Constrained Optimization. Siam J. Sci. Comput. 1995, 16, 1190–1208. [Google Scholar] [CrossRef]
  18. Zhu, C.Y.; Byrd, R.H.; Lu, P.H.; Nocedal, J. Algorithm 778: L-BFGS-B: Fortran subroutines for large-scale bound-constrained optimization. Acm Trans. Math. Softw. 1997, 23, 550–560. [Google Scholar] [CrossRef]
  19. Cernea, D. OpenMVS: Open Multiple View Stereovision. Available online: https://github.com/cdcseacave/openMVS/ (accessed on 20 December 2022).
  20. Schonberger, J.L.; Frahm, J.-M. Structure-from-motion revisited. In Proceedings of the IEEE Conference on Computer Vision and Pattern Recognition, Las Vegas, NV, USA, 27–30 June 2016; pp. 4104–4113. [Google Scholar]
  21. Jancosek, M.; Pajdla, T. Multi-View Reconstruction Preserving Weakly-Supported Surfaces. In Proceedings of the 2011 IEEE Conference on Computer Vision and Pattern Recognition, Colorado Springs, CO, USA, 20–25 June 2011. [Google Scholar]
  22. Knapitsch, A.; Park, J.; Zhou, Q.-Y.; Koltun, V. Tanks and temples: Benchmarking large-scale scene reconstruction. ACM Trans. Graph. ToG 2017, 36, 1–13. [Google Scholar] [CrossRef]
  23. Schps, T.; Schnberger, J.L.; Galliani, S.; Sattler, T.; Schindler, K.; Pollefeys, M.; Geiger, A. A Multi-View Stereo Benchmark with High-Resolution Images and Multi-Camera Videos. In Proceedings of the Conference on Computer Vision and Pattern Recognition (CVPR), Honolulu, HI, USA, 21–26 July 2017. [Google Scholar]
  24. Yao, Y.; Luo, Z.; Li, S.; Zhang, J.; Ren, Y.; Zhou, L.; Fang, T.; Quan, L. Blendedmvs: A large-scale dataset for generalized multi-view stereo networks. In Proceedings of the IEEE/CVF Conference on Computer Vision and Pattern Recognition, Seattle, WA, USA, 13–19 June 2020; pp. 1790–1799. [Google Scholar]
  25. Kim, K.; Torii, A.; Okutomi, M. Multi-View Inverse Rendering under Arbitrary Illumination and Albedo. In European Conference on Computer Vision; Springer: Cham, Switzerland, 2016; pp. 750–767. [Google Scholar] [CrossRef]
  26. Blender. Version v2.93.4 (Software). Available online: https://www.blender.org/ (accessed on 20 December 2022).
  27. Strecha, C.; Von Hansen, W.; Van Gool, L.; Fua, P.; Thoennessen, U. On benchmarking camera calibration and multi-view stereo for high resolution imagery. In Proceedings of the 2008 IEEE Conference on Computer Vision and Pattern Recognition, Anchorage, AK, USA, 24–26 June 2008; pp. 1–8. [Google Scholar]
  28. Kazhdan, M.; Chuang, M.; Rusinkiewicz, S.; Hoppe, H. Poisson surface reconstruction with envelope constraints. In Computer Graphics Forum; Wiley Online Library: Hoboken, NJ, USA, 2020; Volume 39, pp. 173–182. [Google Scholar]
  29. Facciolo, G.; Limare, N.; Meinhardt-Llopis, E. Integral images for block matching. Image Process. Line 2014, 4, 344–369. [Google Scholar] [CrossRef]
  30. ContextCapture. Version v4.4.9.516 (Software). 2020. Available online: https://www.bentley.com/en/products/brands/contextcapture (accessed on 20 December 2022).
Figure 1. The flow diagram for the proposed TDR algorithm.
Photonics 10 00020 g001
Figure 2. Schematic diagram of the minimization of ZNCC error.
Photonics 10 00020 g002
Figure 3. The difference between PDPG and TDPG.
Photonics 10 00020 g003
Figure 4. An example of the convergence process of PDPG and TDPG for the entire image. (a) shows the reference (left) and predicted image (right), and (b) shows the photo-consistency convergence curve of the PDPG and TDPG. (c,d) show the changes in the predicted image at different iterations by PDPG and TDPG, respectively.
Photonics 10 00020 g004
Figure 5. The schematic diagram for the calculation of the ZNCC value of face f k . The red triangle represents f k . All the image pairs visible to f k are considered for the ZNCC calculation, indicated as images from Camera 1 to 4 in this figure.
Photonics 10 00020 g005
Figure 6. ZNCC maps of different meshes. (ad) are the initial meshes, and (eh) are the corresponding ZNCC maps.
Photonics 10 00020 g006
Figure 7. The meshes result (odd rows) and the error ( d i R ) distributions of the meshes (even rows) on the BlendedMVS dataset.
Photonics 10 00020 g007
Figure 8. Visual comparison of results on the ETH3D dataset.
Photonics 10 00020 g008
Figure 9. Visual comparison of results on the Tanks and Temples dataset.
Photonics 10 00020 g009
Figure 10. The simulated CG dataset. The three columns are the mesh, cameras, and rendered images from left to right.
Photonics 10 00020 g010
Figure 11. The visualization result and the accuracy metric of the Joyful data.
Photonics 10 00020 g011
Figure 12. The residual occupancy density maps (af) and occupancy distribution histograms (g,h) of all meshes.
Photonics 10 00020 g012
Figure 13. Visualization of the results of all methods on Herz-Jesu-P8.
Photonics 10 00020 g013
Figure 14. Visual comparison on the Personal Collection Dataset.
Photonics 10 00020 g014
Table 1. Introduction to the datasets used in this study.
DatasetNameImage
Size
Number of ImagesInitial MeshImage
Acquisition
Tanks And TemplesFamily1920 × 1080153OpenMVSHandheld
Francis1920 × 1080302OpenMVSHandheld
Horse1920 × 1080151OpenMVSHandheld
Panther1920 × 1080314OpenMVSHandheld
ETH3Ddelivery area6048 × 403244OpenMVSHandheld
facade6048 × 403276OpenMVSHandheld
relief6048 × 403231OpenMVSHandheld
relief 26048 × 403231OpenMVSHandheld
BlendedMVSUAV_
Scene1
2048 × 153677OpenMVSRendered
UAV_
Scene2
2048 × 1536125OpenMVSRendered
UAV_
Scene3
2048 × 153675OpenMVSRendered
EPFLHerz-
Jesu-P8
3072 × 20488OpenMVS
/COLMAP/
CMPMVS
Handheld
Fountain-P113072 × 204811OpenMVS/
COLMAP/
CMPMVS
Handheld
CG
Simulation Dataset
Joyful1920 × 108070OpenMVSRendered
Personal Collection DatasetHouse4592 × 305636OpenMVSUAV
Woodcarving2016 × 4032146OpenMVSHandheld
Table 2. Quantitative evaluation of the BlenderMVS dataset. Acc. means accuracy and Compl. represents completeness.
Initial MeshBaselineTDR
UAV_
Scene1
Acc. [%]28.1177.0081.67
Compl. [%]20.3061.3763.16
F1 [%]23.5768.3071.23
Mean-Acc. [X10-2]10.896.715.09
Mean-Compl. [X10-2]24.1315.0314.13
UAV_
Scene2
Acc. [%]31.9072.7977.71
Compl. [%]29.8090.2090.77
F1 [%]30.8180.5783.73
Mean-Acc. [X10-2]12.808.006.70
Mean-Compl. [X10-2]42.4028.3027.30
UAV_
Scene3
Acc. [%]29.5383.9885.79
Compl. [%]28.9066.8567.95
F1 [%]29.2174.4475.84
Mean-Acc. [X10-2]10.275.374.94
Mean-Compl. [X10-2]26.8017.5517.44
Table 3. Quantitative evaluation of results on the ETD3D dataset.
Initial MeshBaselineTDR
delivery_areaAcc. [%]53.1853.3356.98
Compl. [%]37.6541.8542.95
F1 [%]44.0946.8948.98
Mean-Acc. [X10-3]7.897.807.24
Mean-Compl. [X10-3]51.2450.9050.84
facadeAcc. [%]24.2534.3542.78
Compl. [%]27.0738.2245.15
F1 [%]25.5836.1843.93
Mean-Acc. [X10-3]34.8930.6726.76
Mean-Compl. [X10-3]15.3513.9113.22
reliefAcc. [%]95.4595.8795.97
Compl. [%]94.0995.6396.79
F1 [%]94.7795.7596.38
Mean-Acc. [X10-3]1.7916.2513.51
Mean-Compl. [X10-3]2.151.7613.17
relief_2Acc. [%]90.4890.3492.58
Compl. [%]86.7289.7490.72
F1 [%]88.5690.0491.64
Mean-Acc. [X10-3]1.942.161.93
Mean-Compl. [X10-3]2.662.192.13
Table 4. The accuracy and completeness of all meshes.
Herz-Jesu-P8Fountain-P11
#faces [M]Acc. [3σ]Compl. [%]#faces [M]Acc.
[3σ]
Compl. [%]
CMPMVS2.766.2550.572.475.0853.42
CMPMVS_Vu1.254.3066.551.552.9070.34
CMPMVS_TDR1.253.7771.831.552.6471.70
OpenMVS1.544.0472.961.892.4279.37
OpenMVS_Vu1.263.5975.621.522.1579.52
OpenMVS_TDR1.263.4975.721.531.9580.29
COLMAP1.143.8071.451.512.4274.33
COLMAP_Vu1.233.6073.771.392.2478.25
COLMAP_TDR1.223.3276.411.401.9979.12
Table 5. The processing times of the 3D reconstruction system.
Herz-Jesu-P8Fountain-P11FamilyFrancisHorsePanther
Time
(s)
Ratio
(%)
Time
(s)
Ratio
(%)
Time (s)Ratio (%)Time (s)Ratio (%)Time (s)Ratio (%)Time (s)Ratio (%)
SFM----472129251927612138822
MVS120351963810092513132757524154524
Mesh reconstruction60188617222613139143315
Mesh refinement1594723345233558245551142760314949
Table 6. The time consumption of critical steps in the TDR and the baseline method.
Herz-Jesu-P8Fountain-P11FamilyFrancisHorsePanther
VuTDRVuTDRVuTDRVuTDRVuTDRVuTDR
#Vertices (K)75475494494489589567267252752718971897
#Images pixels (M)50506969317317626626313313651651
Ray tracing (s)30324345561389624524416291850810
Compute M (s)78510129231139128512711847591981626
Compute g p h o t o (s)17162623371257277245211151339316
Compute g r e g u l a r i z a t i o n (s)0304070505010
Others (s)22243032435290504410331221433387
Total (s)7615910923315972335169024551142142718193149
Disclaimer/Publisher’s Note: The statements, opinions and data contained in all publications are solely those of the individual author(s) and contributor(s) and not of MDPI and/or the editor(s). MDPI and/or the editor(s) disclaim responsibility for any injury to people or property resulting from any ideas, methods, instructions or products referred to in the content.