1. Introduction
The ability to substitute conventional biopsy with non-invasive optical methods was a central aim when optical coherence tomography (OCT) was proposed [
1,
2]. Since then, the performance of OCT devices in terms of speed, sensitivity and resolution significantly enhanced the capability of acquiring diagnostically valuable information of tissue morphology in many clinical applications. The ever-increasing imaging speed, in particular mediated by swept source OCT (SS OCT), made it possible to acquire densely-sampled volumes with wide field of view (FOV) without the wrecking effects of motion artifacts [
3]. This development is of importance in monitoring retinal diseases at an early stage, since OCT is, to date, the only technique capable of assessing three-dimensional (3D) retinal morphology with µm resolution
in vivo. However, the diagnosis of retinal diseases, like diabetic retinopathy, age-related macular degeneration and glaucoma, requires additional information about physiological parameters, like the magnitude and direction of blood flow and vascularization. Part of this diagnostic gap can therefore be bridged by Doppler OCT (DOCT) and OCT angiography [
4,
5]. Recent developments in quantitative DOCT allow for a precise temporal and spatial description of the flow within individual vessels, as well as of the total retinal perfusion. On the other hand, OCT angiography has been rapidly developing during the last few years, profiting especially from technological advancements in high-speed OCT. OCT angiography images exhibit outstanding contrast even for the smallest capillaries and has the important advantage of resolving retinal
versus choroidal vasculature. The state-of-the-art technique for performing ocular vascular imaging is angiography using fluorescein (FA) or indocyanine green (ICGA) as contrast agents. The drawback of FA/ICGA is its time-consuming (up to 30 min) and invasive character, requiring the intravenous application of contrast agents. Eventual side effects include allergic shock, nausea, vomiting or multiple painful needle sticks. This prohibits repeated examinations of patients or the screening of large populations, which would be advantageous for the early detection of vascular-related diseases. Moreover, these techniques cannot provide depth information and are limited by the two-dimensional (2D) nature of the images. OCT angiography has the potential to provide vascular contrast in a depth-resolved manner, with high resolution and without the need for FA/ICGA administration. OCT angiography may be used to diagnose diseases related to ocular vascularization, like glaucoma, diabetic retinopathy and age-related macular degeneration (AMD), which are the leading causes of blindness in the industrialized world. The combination of both DOCT and OCT angiography therefore offers important biomarkers for disease diagnosis that are currently not available, mainly due to technological reasons.
In general, OCT angiography can be performed via inter B-scan speckle or phase fluctuation analysis. Moving red blood cells cause signal fluctuations that can be easily contrasted against the static signal of bulk tissue using variance techniques. Speckle variance is particularly easy to implement for swept source OCT, as it remains unaffected by trigger jitter [
6]. The applied contrast algorithm for OCT angiography is based on calculating the squared logarithmically-scaled intensity differences of
N successive tomograms taken at the same transverse location [
7]. With
I(
x, y, z) =
20 ∙
log[|
FFT(
I(
x, y, k))|] being the tomograms and (
x,
y,
z) being the respective fast scanning, slow scanning, and depth coordinate, the differences are written as
D(
x, yi, z) = [
I(
x, yi + 1, z)−
I(
x, yi, z)]
2, where the index
i runs over the tomograms taken at the same vertical slow scanning position. The intensity difference tomograms
D exhibiting high decorrelation are rejected by comparing their respective mean value to a threshold
T according to the procedure described in [
9]. The final motion contrast volume
P is obtained by averaging over the remaining intensity difference tomograms after thresholding for each vertical position. As the above described procedure indicates, the total measurement time for a full volume is increased by the redundancy factor
N in comparison to the standard OCT measurement protocol. Larger
N results in improved vascular contrast, but increases the
in vivo measurement duration [
10]. The latter increases the probability of motion distortion, especially in the case of patients with reduced visual acuity and fixation capability. This usually limits the diagnostic valuable FOV to approximately 8 deg in state-of-the-art OCT angiography modalities. For achieving larger FOV, stitching can be employed, which however increases the measurement session time and calls for retinal tracking systems. Alternatively, the speed of the OCT system can be increased. However, for enhancing the FOV to about 20 degrees (deg) and larger, as is standard for fluorescein angiography, an about 10-times faster swept source is needed. Using a laboratory prototype Fourier Domain Mode Locking (FDML) laser operating at 1.6 MHz, a 50° FOV has been demonstrated [
3]. Such a laser is however not easily available, which motivates the search for alternatives to increase the speed of OCT systems that employ commercially available swept sources appropriate for retinal imaging.
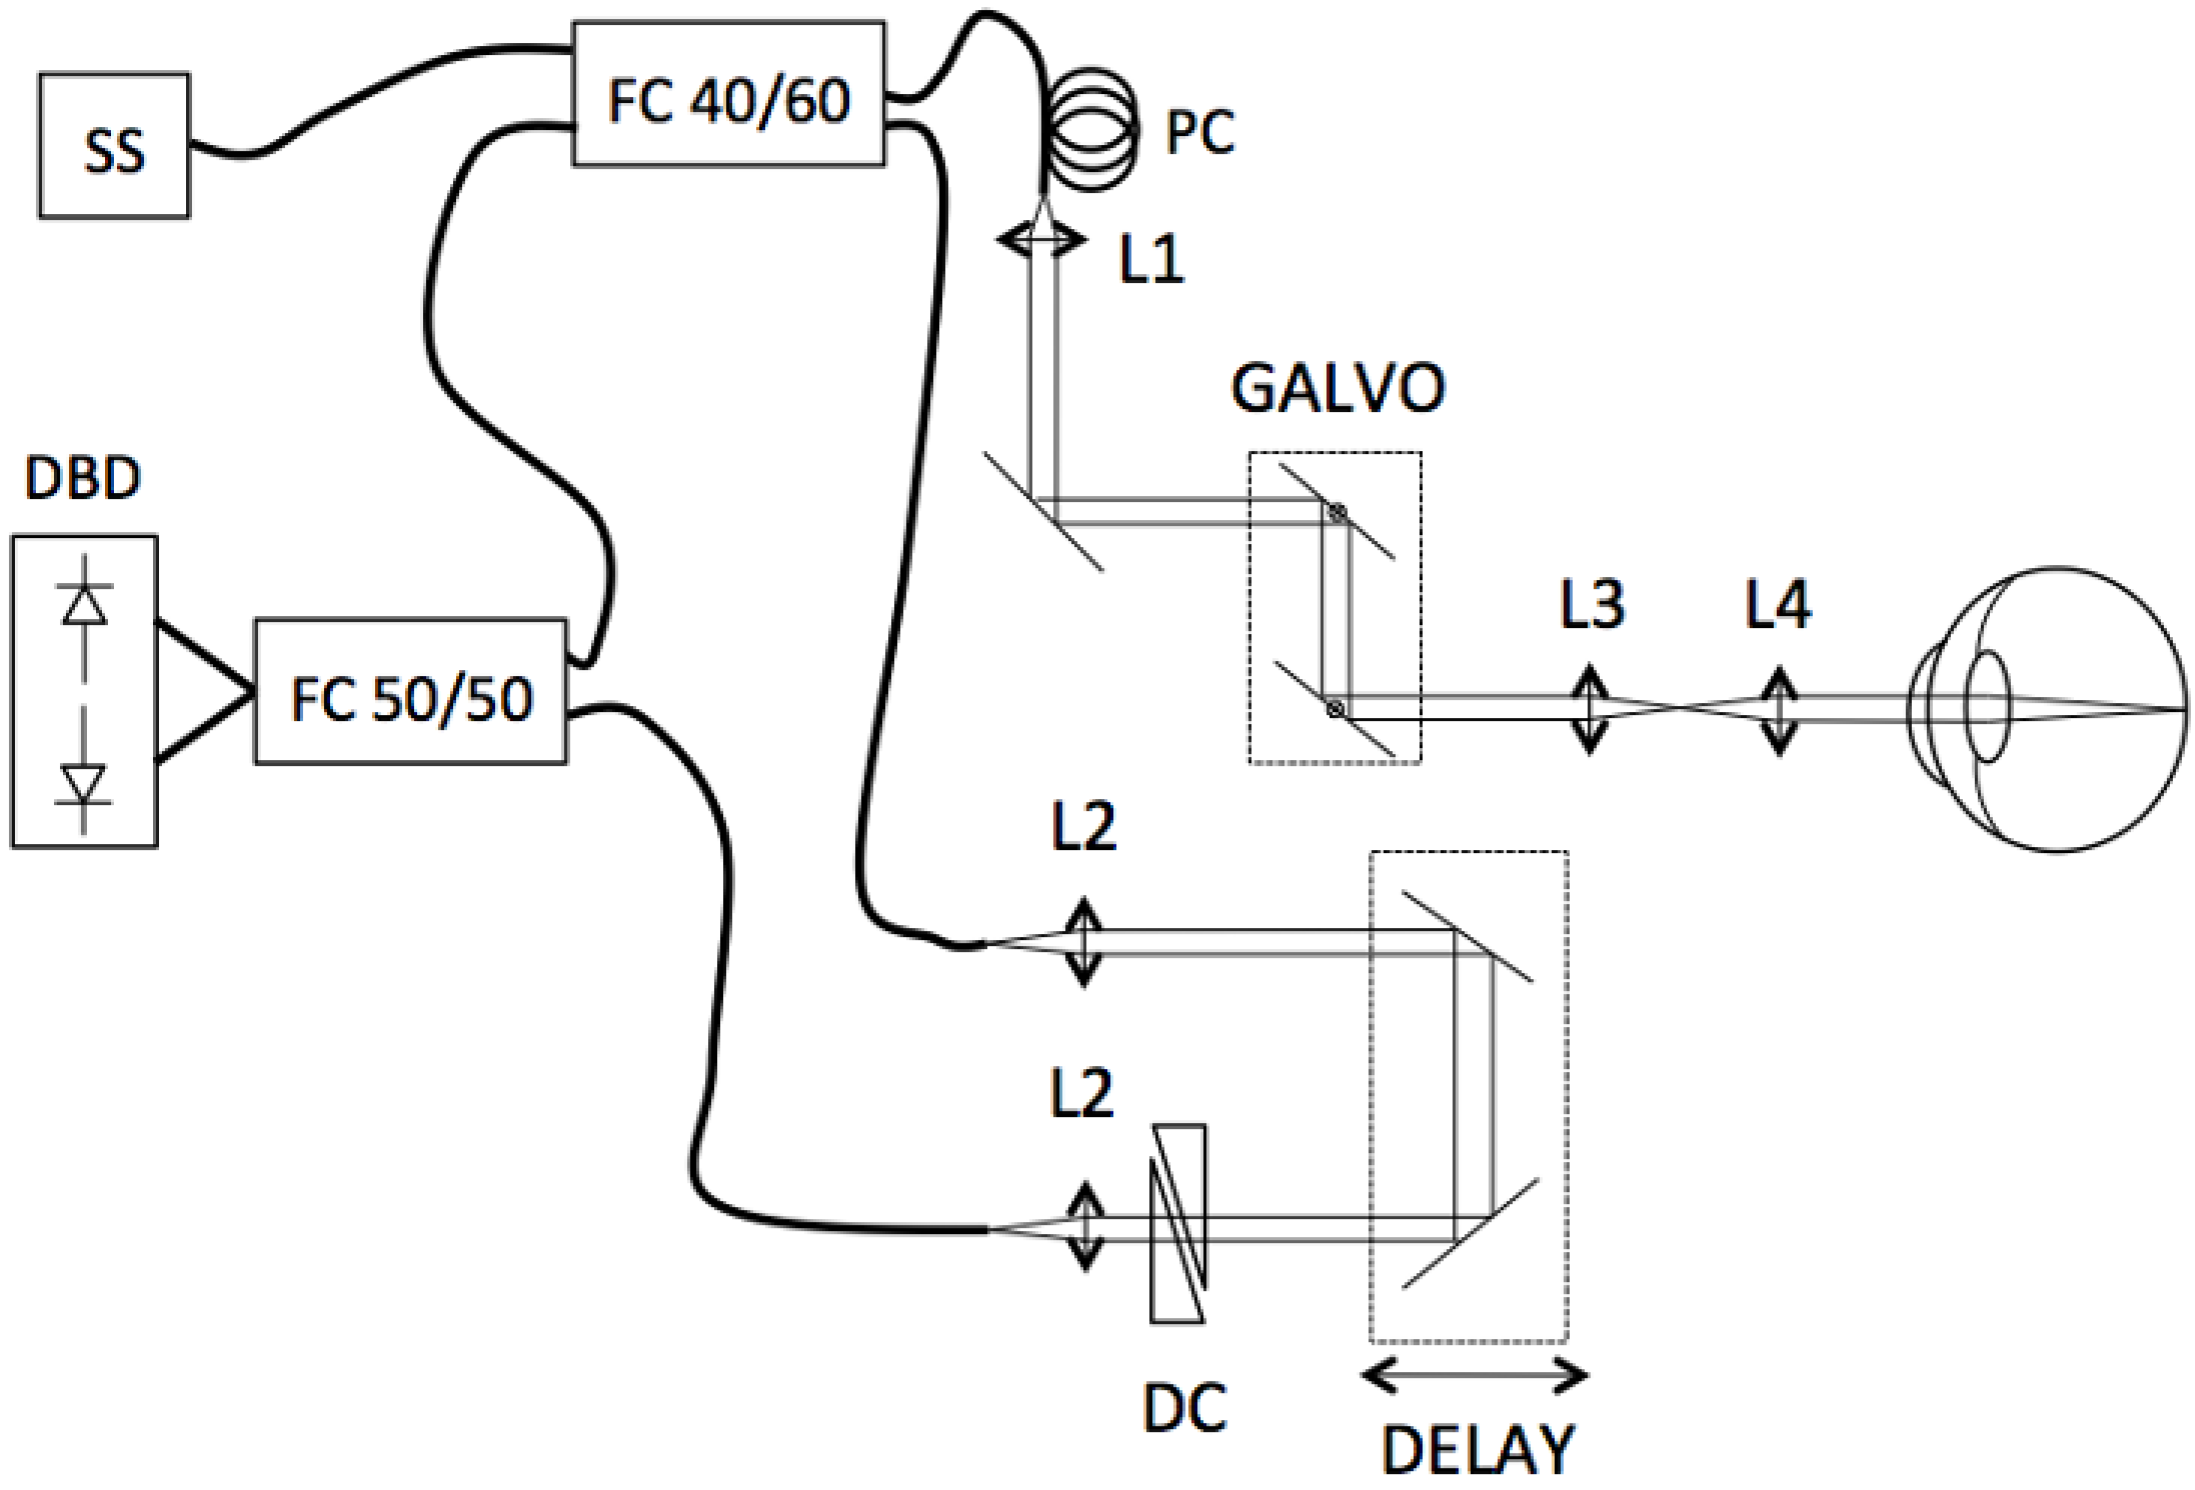
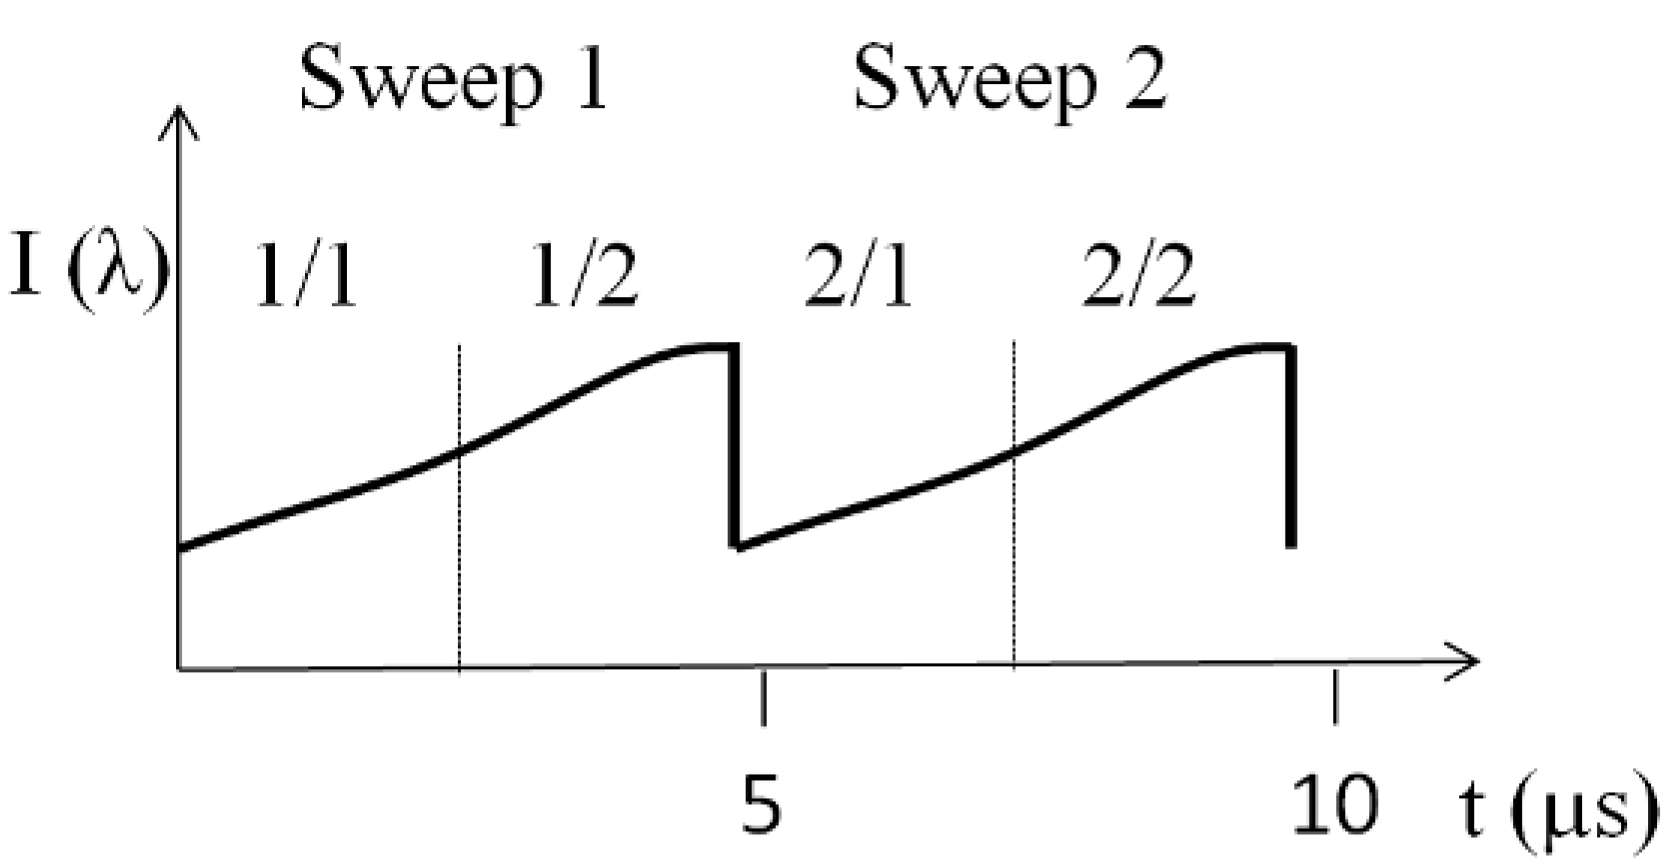
In the present work we demonstrate such a method for speed-enhanced OCT angiography based on commonly available swept source technology. The laser comprises two interleaved sources, each operating at 100 kHz and together achieving 200 kHz. To further increase the acquisition speed by a factor of two, we propose a method based on splitting the optical spectrum. The split-spectrum approach was proposed by Jia
et al. to improve the signal-to-noise ratio (SNR) of the OCT angiography images by relaxing the sensitivity to bulk motion noise in the axial direction [
10]. Our attempt allows doubling the FOV from 8° (100 kHz) to 16° (400 kHz) without the need of increasing the total measurement time and keeping vascular structural integrity. The performance is demonstrated
in vivo at different locations of the human retina and verified quantitatively.
3. Results and Discussion
To demonstrate the feasibility of the split spectrum method for increasing the sampling density, we compare 8° and 16° patches acquired at 400 kHz (multiplexed laser, spectral splitting) to patches acquired at 100 kHz (single sweep laser, full spectrum) at the fovea region and optic nerve head (ONH) of a healthy volunteer. The x-scanner (fast axis) scans linearly whereas the y-scanner (slow axis) scans in steps with a vertical sampling of 400 steps. For OCT angiography, we record
N = 4 tomograms at each sampling point in y-direction, resulting in a total of 1,600 tomograms per volume. The lateral number of sampling points is 200 for 100 kHz acquisition, 400 for 200 kHz and 800 for the split spectrum method at 400 kHz. The total acquisition time is 7.8 s for all cases.
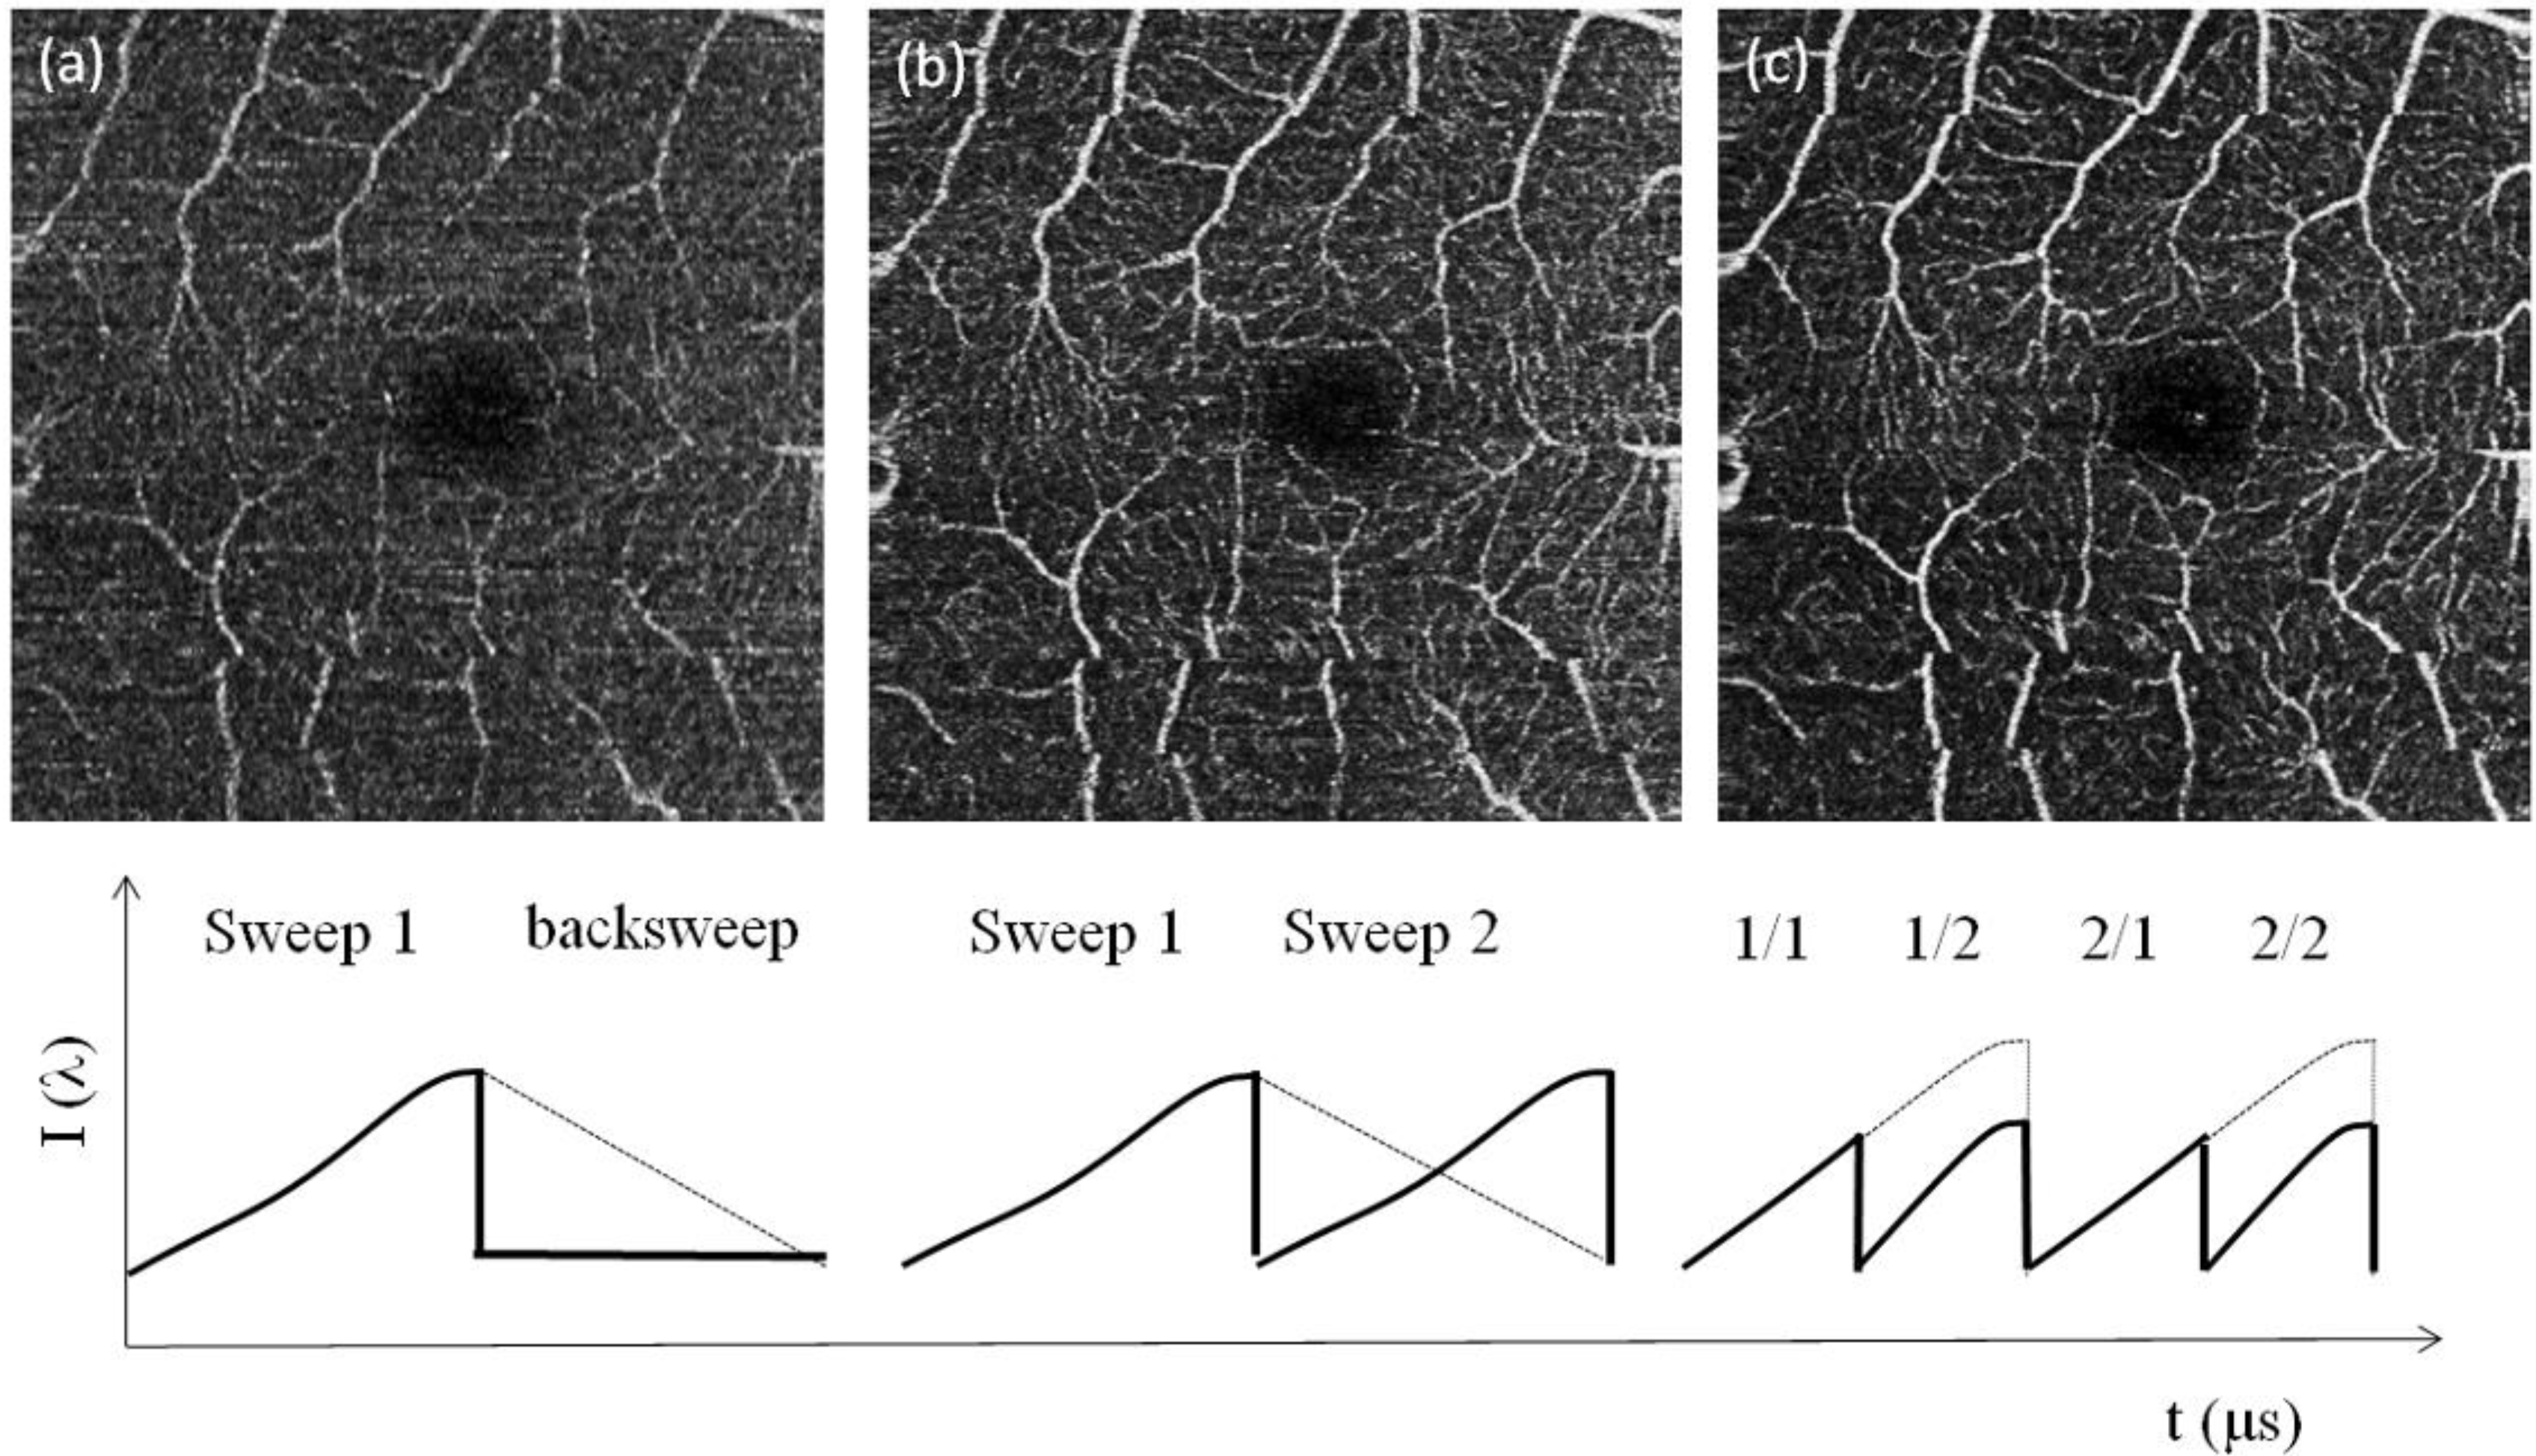
Figure 3a shows an example of OCT angiography with single sweep acquisition at 100 kHz and conventional processing obtained around the fovea centralis with a scanning angle of 8°, corresponding to a FOV of 3 × 3 mm. The 2D angiograms are calculated as maximum intensity projections across a selected depth range from the motion contrast volumes. In order to enable assessment of vascular structures at equal depth, we flattened the motion contrast tomograms with respect to the highly reflective inner-outer photoreceptor segment boundary. Furthermore, we registered the intensity tomograms axially prior to motion contrast analysis. The depth range for the angiographies presented in
Figure 3,
Figure 4 and
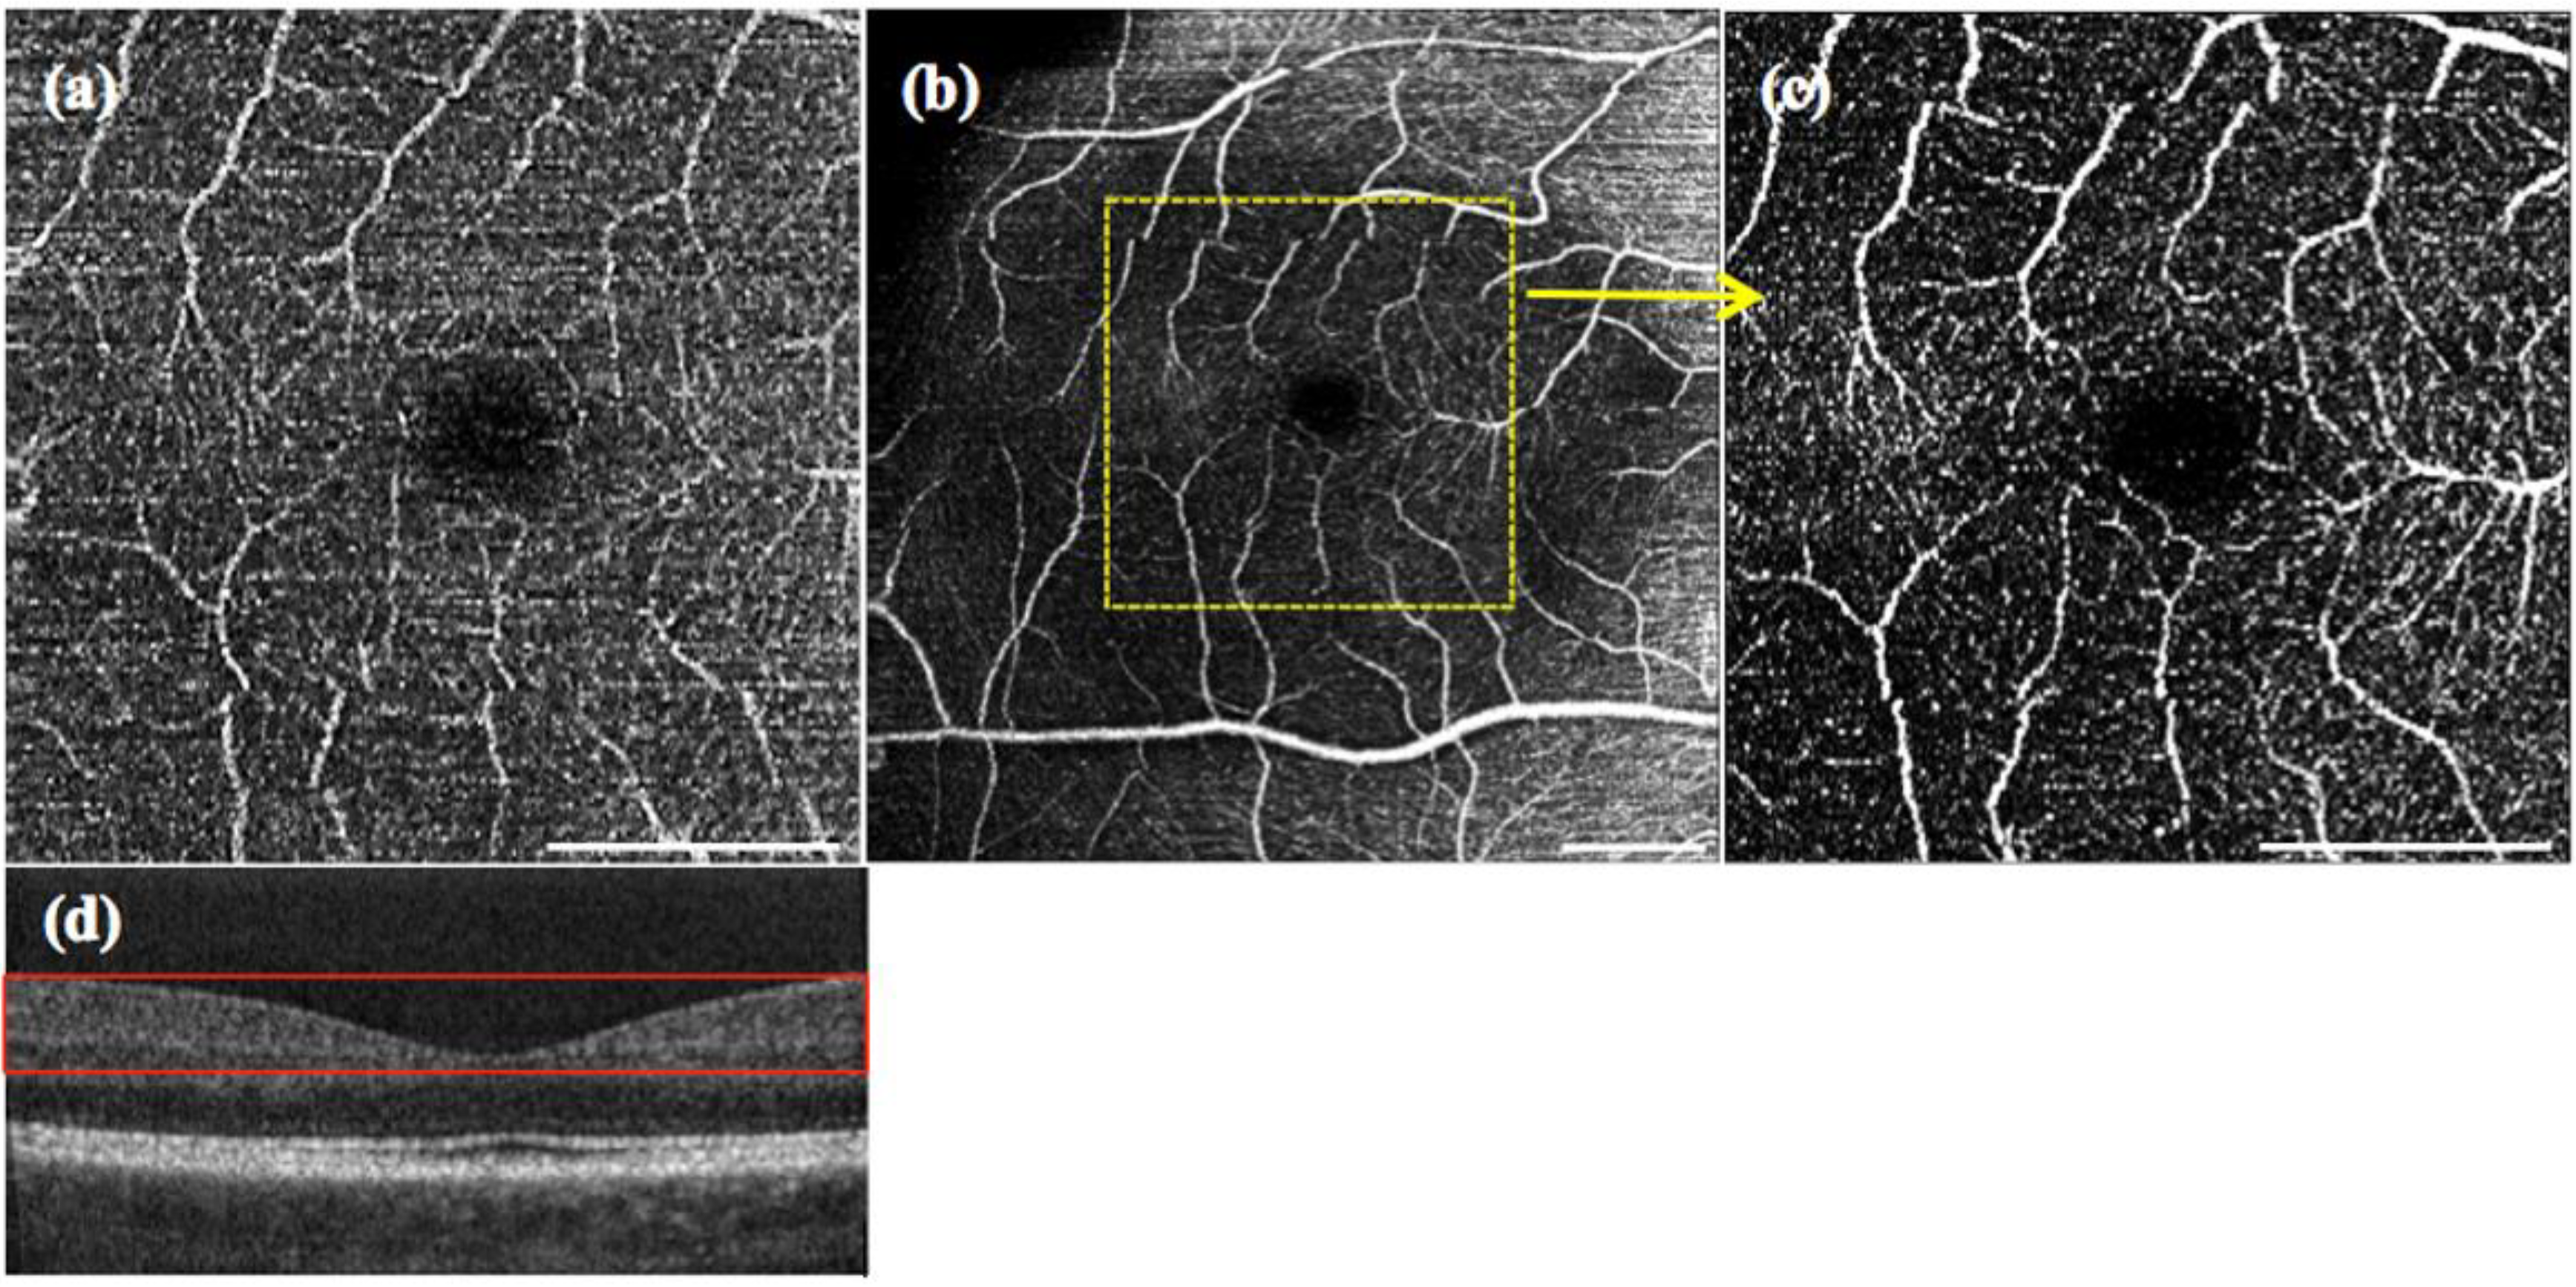
Figure 5 is indicated by the red box in
Figure 4d. The respective sweep structure is depicted underneath the angiography in
Figure 3. A comparison with the multiplexed sweep acquisition in
Figure 3b and with images obtained after applying the split spectrum approach demonstrates the improvement in the sampling rate and, thus, image quality. Whereas in
Figure 3a, the details of the microvasculature are revealed only fragmentarily, most of the small vessels are fully visible in
Figure 3b. The split spectrum approach further improves, then, the signal-to-noise level in the angiographies, which was already demonstrated in [
10] by introducing the decorrelation signal-to-noise value. This effect is attributed to the lower axial resolution after spectral splitting that helps to reduce the axial decorrelation sensitivity. In order to quantify the increase in SNR, we compare the images obtained with the multiplexed laser before and after spectral splitting. We calculate the SNR according to [
11]:
with
r being the reference image and
t the test image.
nx and
ny are image pixels in the fast scanning and slow scanning direction, respectively. For the 8° Fovea section, we calculated an improvement of 2.26 dB in SNR for
Figure 3c, as compared to
Figure 3b.
Figure 3.
OCT angiography from the maximum intensity projection over 10 en face slides, of the fovea for 8° FOV: (a) single sweep (100 kHz) without applying the split spectrum approach; (b) multiplex sweep (200 kHz) without applying the split spectrum approach. (c) The result with the multiplex sweep and split spectrum procedure. A schematic of the spectral sweep structure as a function of sweep time is shown underneath the respective OCT angiography. The white scale bar denotes 1 mm.
The increase of total sampling points by a factor of four allows increasing the FOV from 8° to 16° in both the x- and y-directions without sacrificing sampling density and measurement time.
Figure 4a shows an 8° patch at the fovea with 400 × 200 sampling points and conventional post processing. A 16° patch with a total of 800 × 400 sampling points after applying spectral splitting is depicted in
Figure 4b. In order to appreciate the improvement in sampling, we extract the 8° patch out of
Figure 4b and plot it in
Figure 4c. One can visually verify that the 8 ° selection of the 16° patch given in
Figure 4c with 400 × 200 sampling points exhibits the same structure and information as the one obtained with the conventional 100-kHz processing in
Figure 4a. There is moreover a noticeable improvement in contrast for the split spectrum method for the same reason as discussed for
Figure 3. In
Figure 4b, we observe a decrease of contrast and higher spurious bulk signal towards the nasal side at the superior and inferior edge of the angiography. This is an artifact that results from the higher signal backscattering from the retinal nerve fiber layer. Such artifacts need to be carefully considered when interpreting intensity-based OCT angiographies.
Figure 4.
Maximum intensity projection over 60 en face slides taken at 8° with conventional 100 kHz (a), 16° scan at fovea centralis with 400 kHz (b) and 8° subregion of (b) (c). The white scale bar denotes 1 mm. (d) Fovea tomogram indicating the depth range (red box) for the maximum intensity projections.
In order to demonstrate the advantage of the split spectrum approach for enhanced FOV, images at the fovea region over 16° FOV are compared.
Figure 5a shows the angiography obtained with the multiplexed laser without spectral splitting (200 kHz), whereas
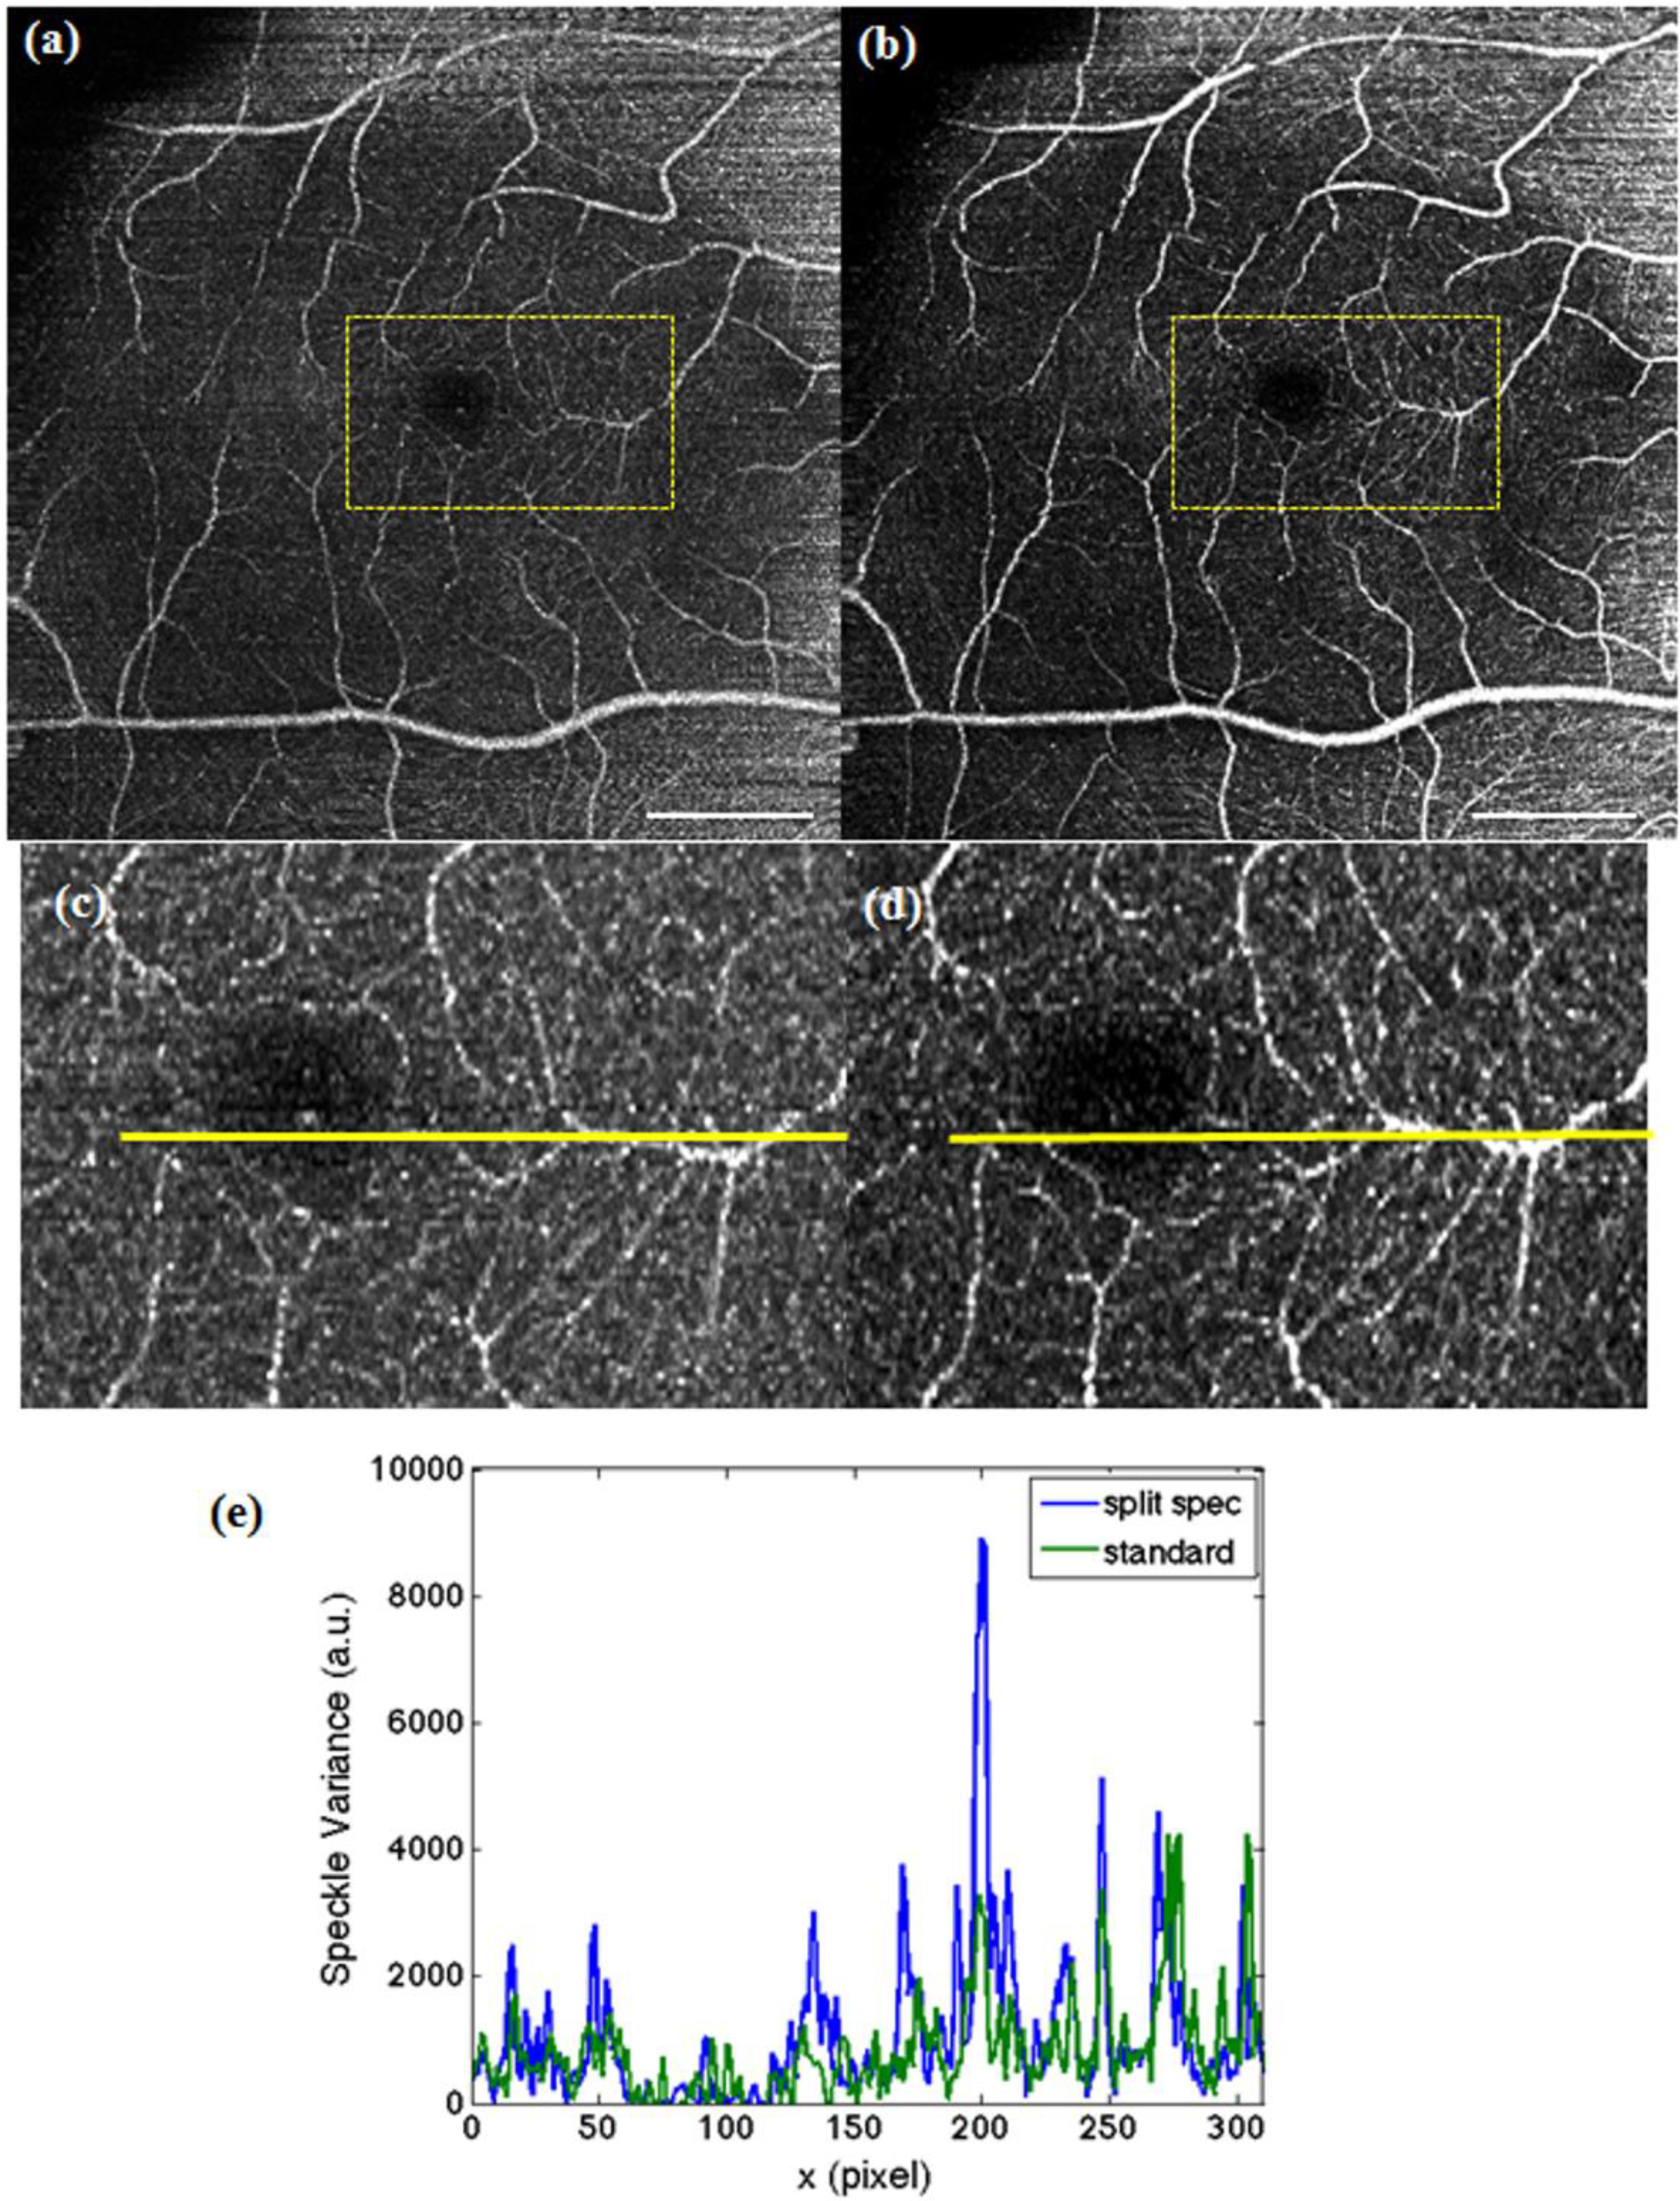
Figure 5b shows the result obtained after splitting the spectrum (400 kHz). Applying Equation (1), the split spectrum approach offers a global increase in SNR of 2.6 dB. To further quantify the potential of this procedure, a section of microvascular structure (marked yellow in
Figure 5a,b) was compared. The profile plot in (
Figure 5e) allows one to appreciate the increase in SNR of even 2.9 dB within the regions of interest in
Figure 5c,d.
Finally, in
Figure 6, we assess the optic nerve head (ONH) region with 16° FOV of a healthy human volunteer.
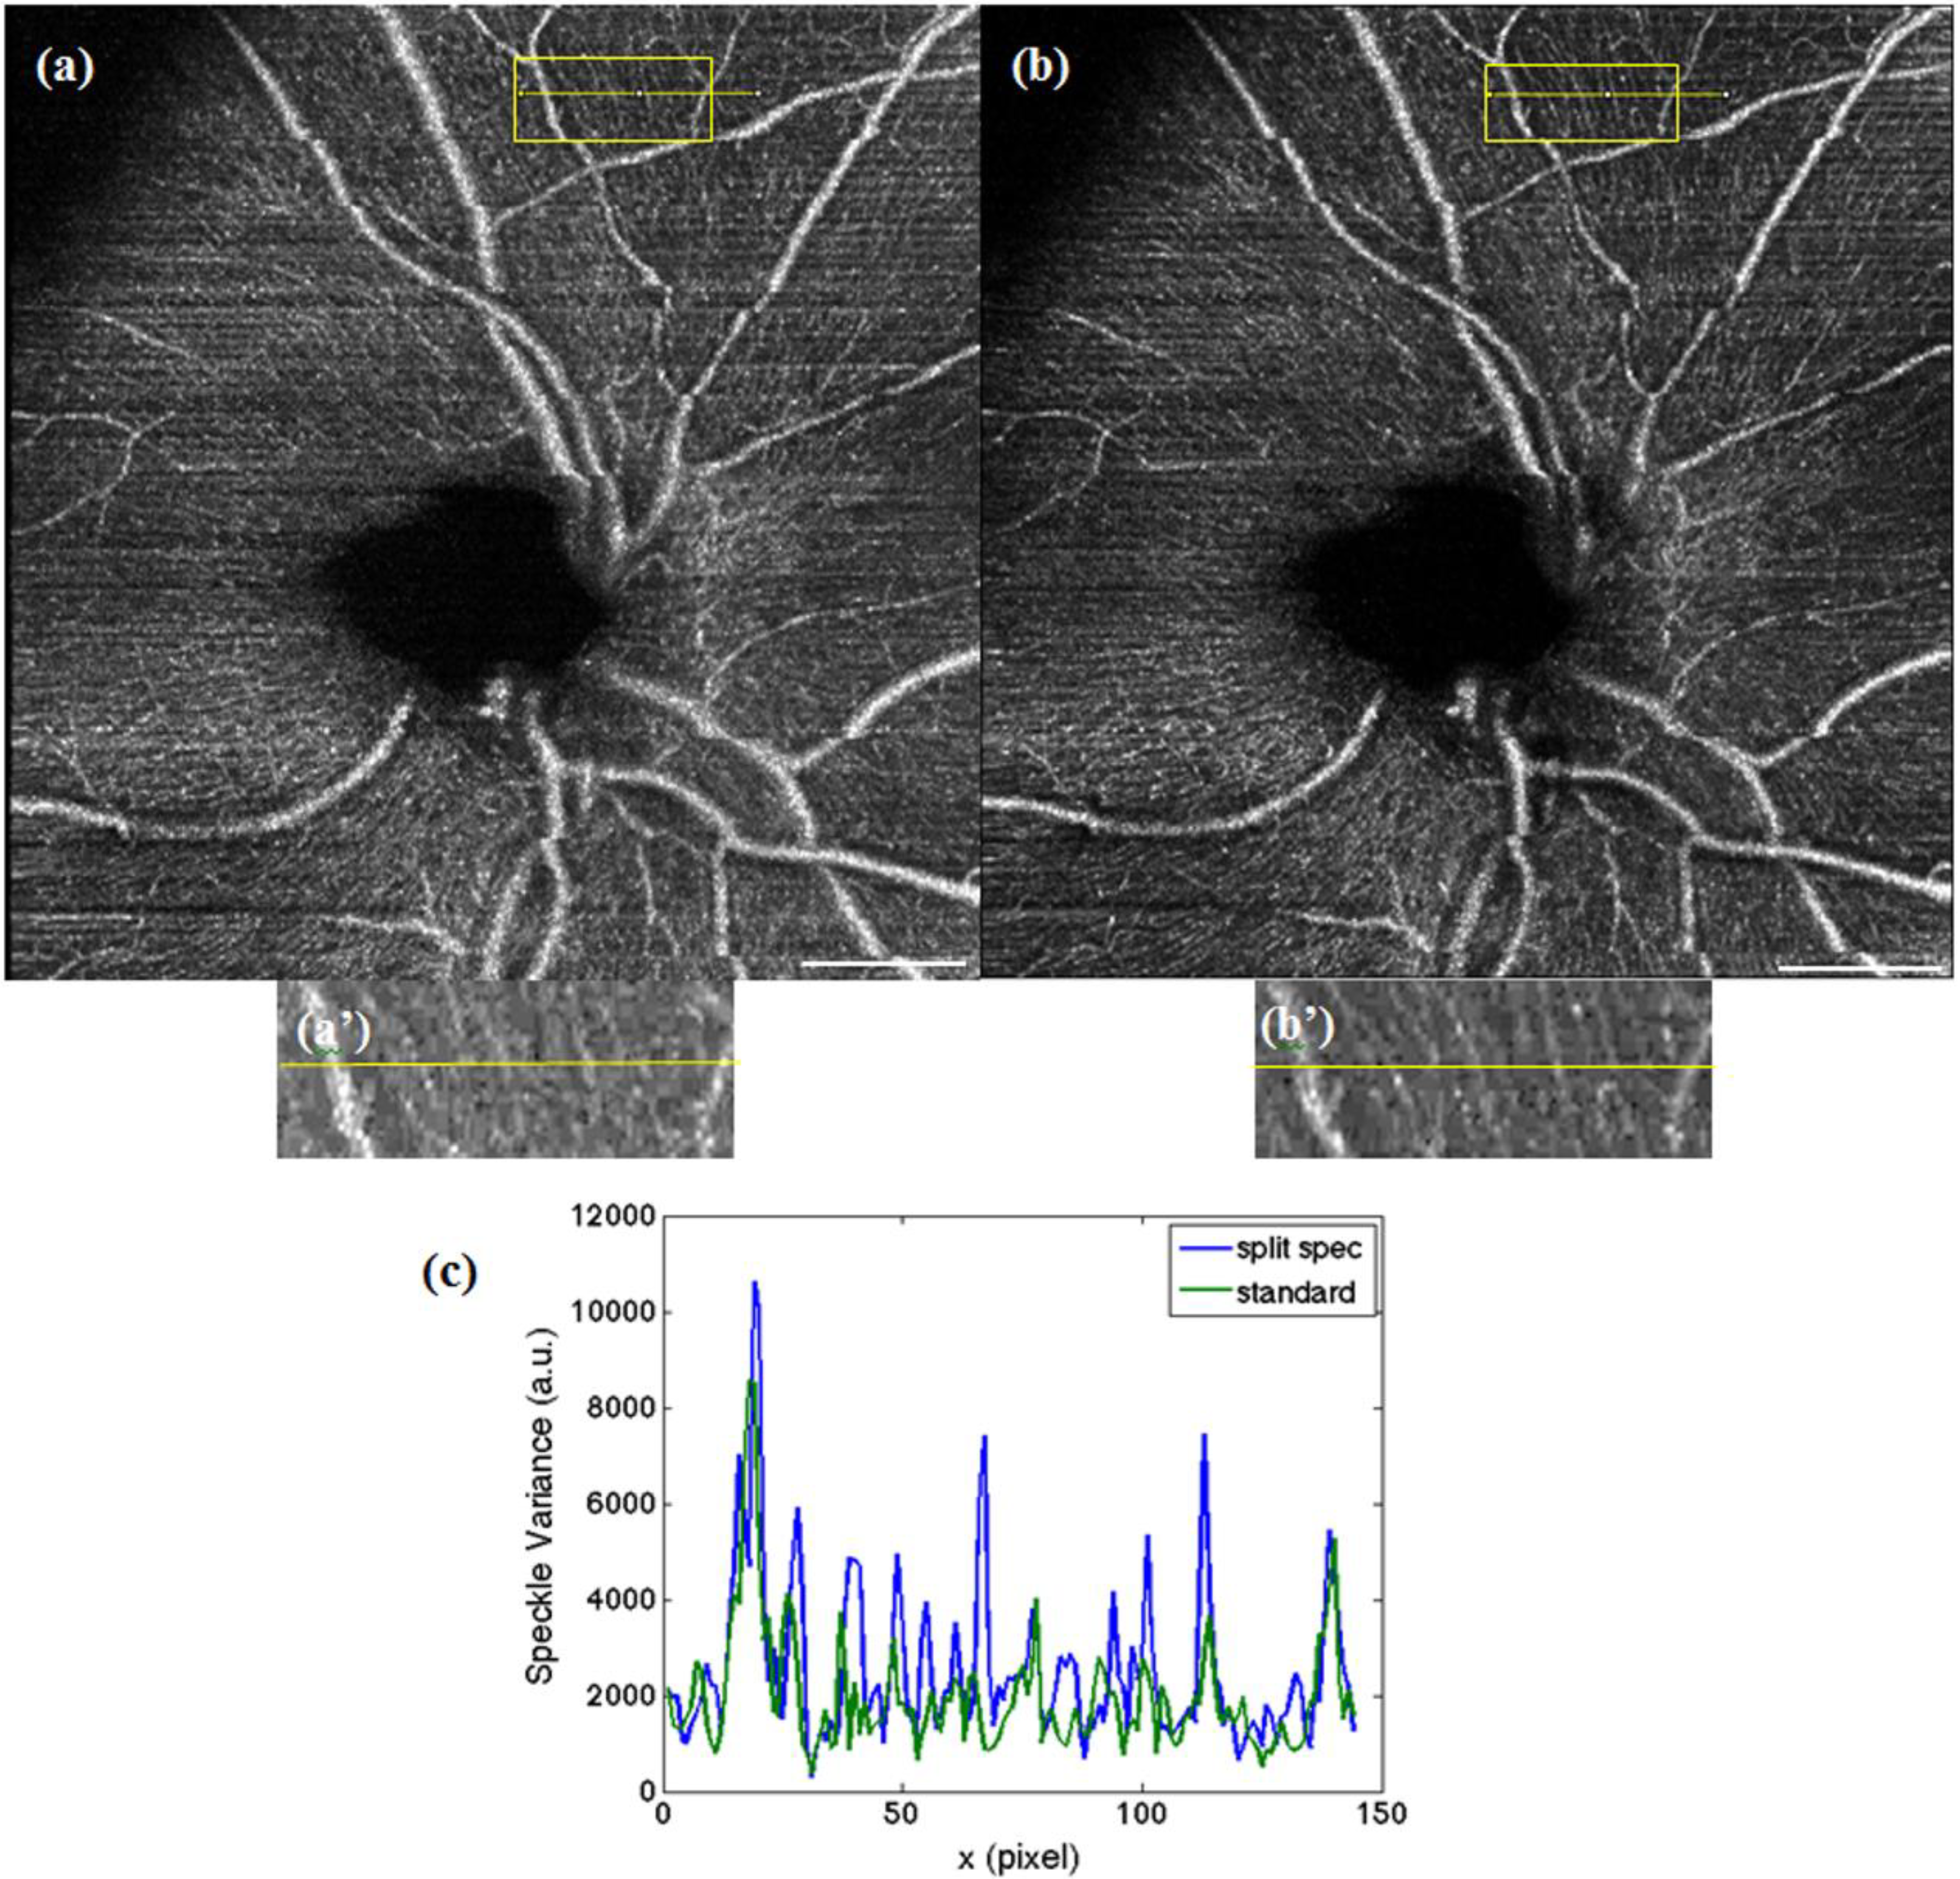
Figure 6a shows the result for the conventional processing with a 200-kHz sampling rate. In comparison, the higher sampling due to the split spectrum method in
Figure 4b yields finer vascular details. In particular, within the superior part in
Figure 6b, capillary vessels that run just below and in parallel to the nerve fiber bundles emanating from the optic nerve head are clearly visible. Assessment of the integrity of those capillaries might be of importance for glaucoma diagnostics. Obviously, the loss in axial resolution does not affect the capability to visualize those fine vascular details, as compared to the result in
Figure 6a using the full optical bandwidth.
Figure 6b shows an increase of 1.4 dB in SNR compared to
Figure 6a. The increase is lower, as for
Figure 5, because the maximum projection was done over a larger number of slices, as the vascular structure at the ONH has stronger depth diversity.
Figure 5.
Maximum intensity projection over 10 images were taken, at 16° with a multiplexed laser acquired at 200 kHz (a), with virtually 400 kHz after spectral splitting (b). The white scale bar denotes 1 mm. (c,d) The respective magnified regions of interest indicated in (a) and (b). (e) Profile plot along the yellow line in (c) and (d), where the increase of SNR in the case of the split spectrum method can be verified.
Figure 6.
Sixteen-degree OCT angiography from maximum intensity projections over 60 depth slices at the optic nerve head: (a) with 200 kHz and conventional processing; (b) with 400 kHz using the split spectrum method. (a’) and (b’) are the respective zoomed regions as indicated by the yellow boxes. (c) Profile plot to demonstrate SNR enhancement across the respective yellow lines in (a) and (b). The white scale bar denotes 1 mm.
In principle, more than two subspectra could be used in order to further increase the lateral sampling. The limitation is, however, the loss in sensitivity due to the loss in signal for the subspectra, as well as the loss in axial resolution. In our case, a factor of two helped to improve the imaging performance. Further splitting did not significantly improve the performance of OCT angiography as measured by Equation 1 and would eventually lead even to SNR degradation.
4. Conclusion
In this paper, we demonstrated that the lateral sampling rate of OCT angiography can be increased by splitting the acquired optical spectrum into temporally-equidistant subspectra. To evaluate the feasibility of our method for diagnostic applications in ophthalmology, we presented in vivo results of imaging healthy volunteers at the fovea and the ONH region. Those regions are of particular interest for the assessment of major retinal diseases. Employing in addition a multiplexed laser, consisting of two independent interleaved sources, each operating at 100 kHz, we were able to quadruple the scanning speed of OCT angiography to 400 kHz as compared to a single sweep laser. The lateral FOV could then be increased from 8° to 16° without the need of increasing the measurement time and without degradation in image quality and information content. Rather, it additionally helped to increase the SNR of the contrasted vascular structure, since splitting the spectrum reduced axial resolution and, thus, the sensitivity to the axial sample motion during acquisition.
Of course, this method is not limited to OCT angiography, but can in general help also standard swept source OCT imaging to improve the lateral sampling and, thus, the lateral field of view.
Diagnostic devices dedicated to usage in daily clinical routine should be kept as simple and economical as possible. The split spectrum method is purely performed in post-processing; hence, it does not require any additional expenses, improvements and changes in complexity regarding the optical setup. A possible trade-off in specific applications might be the degradation in axial resolution owed to the reduction in the available optical bandwidth after splitting the spectrum. This has however been demonstrated to be of no relevance for visualizing the retinal vascular structure.
