Simple Summary
Three ageing reservoirs in Ekiti State, Nigeria, originally constructed for water supply, now support established fish communities and native species that have become scarce in surrounding river systems. Across the three reservoirs, twelve fish species were recorded, with six species consistently present throughout the study period. Several native fishes of local conservation concern, including Heterotis niloticus, Parachanna obscura, Hepsetus odoe, and Hyperopisus bebe, were also documented. Aquatic environmental variables remained within suitable ranges for freshwater fishes, and trophic structure appeared intact, indicating functioning reservoir ecosystems. Fish catch levels varied among reservoirs, with higher concentrations observed in the urban lake compared to the rural systems, despite similar fishing practices. Overall, the results show that these reservoirs function as important freshwater habitats that sustain fish biodiversity and fisheries production within a modified landscape.
Abstract
Three ageing reservoirs in Ekiti State, Nigeria (Ureje constructed in 1958, Egbe in 1982, and Ero in 1989), were comparatively assessed to evaluate fish assemblages and their conservation relevance. Despite the absence of formal fisheries governance, all three reservoirs supported temporally stable fish communities with low overall diversity. A core assemblage of six species dominated across sites, while species richness increased from seven species in the small urban Ureje reservoir to nine species in the larger and more rural Ero reservoir. Four native species that have become locally scarce in surrounding river systems (Heterotis niloticus, Parachanna obscura, Hepsetus odoe, and Hyperopisus bebe) persisted at low but consistent abundance. Aquatic environmental variables remained within suitable limits for freshwater fishes, and trophic structure appeared intact across the reservoirs. Catch density was substantially higher in the urban reservoir compared to the rural systems, reflecting spatial differences in fishing intensity. Overall, the findings demonstrate that small tropical reservoirs can function as important freshwater habitats that sustain fish biodiversity and fisheries production in modified landscapes.
1. Introduction
Freshwater ecosystems harbour exceptional taxonomic diversity yet suffer the highest rates of habitat loss, pollution, and hydrological alteration on the planet [1,2]. Freshwater reservoirs now dominate inland water bodies across tropical Africa and play an increasingly important role in sustaining fish diversity amid widespread river degradation caused by damming, pollution, and flow alteration. Tropical Africa presents a particularly urgent and distinctive challenge. Decades of large-scale river damming, coupled with thousands of small and medium reservoirs created for municipal water supply and irrigation under highly seasonal rainfall regimes, have produced a landscape dominated by artificial lentic habitats. These systems differ profoundly from the large, deep, temperate reservoirs that underpin most global conservation models, making direct replication of established approaches difficult and often ineffective [3,4].
In Nigeria, inland fisheries now depend almost entirely on reservoirs, which simultaneously sustain millions of artisanal fishers and appear to serve as important local strongholds for several West African fish species that have become rare or absent in fragmented and polluted rivers [5]. Ekiti State in southwestern Nigeria contains three long established reservoirs that differ in age and morphometry: Ureje, impounded in 1958 and characterized by a small, deep basin within an urban catchment; Egbe, created in 1982 with a broad, shallow basin influenced by agricultural land use; and Ero, completed in 1989 and representing the largest system in both surface area and volume within a predominantly rural catchment [6]. This natural gradient provides an ideal comparative framework to examine how reservoir characteristics influence fish assemblages and conservation potential.
Despite their ecological and socioeconomic importance, no integrated assessment of fish taxonomic diversity, community structure, rarity patterns, or conservation status has ever been conducted across these three systems. Existing studies are limited to length–weight relationships, nutritional attributes of commercial species or isolated water quality and toxicology surveys [5,7,8,9,10,11]. As a result, managers lack the comprehensive baseline information needed for evidence-based decision making.
The objective of this study is to assess the role of Ureje, Egbe, and Ero reservoirs in fisheries conservation by comparing fish species composition, relative abundance, diversity patterns, and associated environmental conditions during the 2024 wet to dry season transition. By integrating fisheries data with environmental variables and local ecological knowledge, this study aims to establish a baseline for evaluating the conservation potential of tropical reservoirs and to inform context specific management strategies for sustaining freshwater fish biodiversity in modified landscapes.
2. Materials and Method
2.1. Study Site
This study was conducted on three artificial reservoirs (lakes) in Ekiti State in southwestern Nigeria (Figure 1), located between latitudes 7°15′ and 8°05′ North and longitudes 4°45′ and 5°45′ East [6]. The area lies within the rainforest ecological zone and experiences a tropical climate with distinct wet and dry seasons, although recent years have shown increasing variability in rainfall patterns [6]. The reservoirs were created by damming the Ureje, Egbe, and Ero Rivers in 1958, 1989, and 1985, respectively, to support water supply and community needs [6].
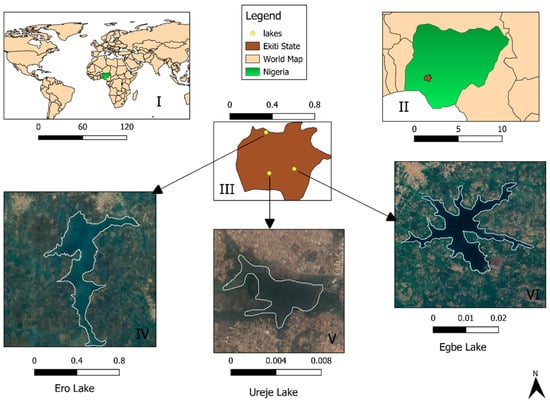
Figure 1.
Map of the Study Sites created with QGIS showing the following: Position of Nigeria on the world map (I), position of Ekiti State in Nigeria (II); Position of the three lakes within Ekiti State (III); Ero lake, Ureje lake and Egbe lake. All measurements are given in Map units.
The lakes differ markedly in morphometry with Ureje covers 236 hectares with a volume of 25 million cubic metres and a maximum depth of 13 m. Egbe Reservoir spans 590 hectares with a volume of 41 million cubic metres and a maximum depth of 18 m. Ero Reservoir is the largest at 1180 hectares with a volume of 112 million cubic metres and a maximum depth of 38 m. These differences shape habitat availability and ecological processes across the systems [6].
The reservoirs also sit within contrasting socio economic contexts. Ureje Reservoir is in Ado Ekiti, the most populated urban centre in the state, where daily domestic use and higher human activity likely influence ecological conditions and fishing pressure [8,9,12]). Egbe and Ero Reservoirs lie within rural agricultural communities where fishing remains an important livelihood activity and a key source of food [6,9,11]. Together, these morphometric and socio-economic differences create a useful gradient for interpreting ecological patterns and assessing the role of these reservoirs in sustaining fisheries and broader ecosystem functions.
2.2. Data Collection
Prior authorization for this study was obtained from the Ekiti State Water Corporation and the Ministry of Agriculture through the Department of Fisheries Services. Fish catch data were sourced from the Department’s routine monitoring records, covering a 25-week period between April and October 2024. These records provided weekly information on the number of fish harvested and their total biomass, offering a practical representation of reservoir use as a provisioning ecosystem service.
Fish catches were derived from artisanal fisheries operating small manually paddled canoes using passive gears, primarily gill nets and traditional traps set overnight and retrieved the following morning. Although fishing effort was not experimentally controlled, consistency in gear type and fishing practices across reservoirs allowed comparative analysis of catch composition and abundance. To complement the biological records, brief structured interviews were conducted with selected fishers (two respondents) at each landing site. These interviews focused on local perceptions of fishing pressure, changes in catch volume and species composition, and the commercial importance of harvested species. Incorporating local ecological knowledge provided additional context for interpreting catch trends and understanding how communities perceive the role of the reservoirs in sustaining fisheries.
In addition to biological data, surface water physio-chemical parameters for each reservoir were obtained from the Ekiti State Water Corporation. These measurements provided essential environmental context for interpreting fish assemblage patterns and assessing the ecological performance of the reservoirs as potential biodiversity conservation systems.
2.3. Estimation of Species Diversity
To measure fish biodiversity, species richness has been analyzed, and a range of indices were computed and subjected to statistical analysis. This encompassed the Shannon-Wiener diversity index (H) [13], Simpson’s Index (D) [14], the Equitability index (J) [15], and Margalef Index [16].
2.3.1. Shannon-Wiener Diversity Index (H′)
n = number of individuals of each identified species in the catch (the ith species);
N = total number of individuals in the catch;
ln = natural logarithm.
2.3.2. Simpson’s Index
n = number of individuals of each identified species in the catch (the ith species);
N = total number of individuals in the catch.
2.3.3. Species Equitability Index
The Species Equitability Index, also known as Pielou’s Evenness Index (J) [15], is used to assess how evenly individuals are distributed across the species in a community. It can be applied to fisheries to evaluate the distribution of different fish species and is evaluated with the formula:
where
J = Equitability or Evenness Index.
H’ = Shannon-Wiener Diversity Index (a measure of species diversity).
S = Total number of species.
ln(S) = Natural logarithm of the total number of species.
2.3.4. Margalef’s Diversity Index
The Margalef’s Diversity Index (Species richness) was calculated using the following formula:
where
D = Species richness index.
S = Total number of species observed.
N = Total number of individuals observed.
ln = Natural logarithm.
2.4. Catch Density
Catch density was estimated by dividing total fish abundance by lake surface area (fish per hectare). This metric was used as a comparative index of relative fishing pressure rather than an estimate of standing stock.
2.5. Statistical Analysis
All data collected during the study period were organized by reservoir in Microsoft Excel and analyzed in R Studio (version 2024.12.1+563). The “ggplot2,” “vegan,” and “dplyr” packages were used for data visualization, biodiversity computation, and data management. Given the broader aim of evaluating the reservoirs as ecological indicators and potential conservation assets, statistical procedures were selected to reveal both ecological patterns and management-relevant relationships.
To examine how environmental conditions shape fish assemblages, correlations were generated between fish catch and key physio-chemical variables including temperature, pH, dissolved oxygen, conductivity, total dissolved solids, and biochemical oxygen demand. These relationships provide insight into how reservoir function and water quality may influence the provisioning ecosystem service of fisheries.
Temporal changes in relative abundance were evaluated using the Kruskal–Wallis test at the five percent significance level to determine whether monthly shifts in catch composition reflected potential ecological responses or fishing pressure. Spatial variations in biodiversity across reservoirs were assessed using Multivariate Analysis of Variance (MANOVA). Where significant effects were detected, a two-way Analysis of Variance followed by Tukey’s post hoc test was used to identify which diversity indices differed among sites.
This analytical framework allowed the study to evaluate fish assemblages not only as measures of ecological condition but also as indicators of the reservoirs’ capacity to support fisheries conservation and contribute to sustainable ecosystem services.
3. Results
3.1. Water Quality Parameters
Across the three reservoirs, the environmental parameters (Table 1) showed distinct profiles relevant to fisheries productivity and reservoir functioning. Ureje Lake recorded the highest temperature values (22–29 °C; mean 25.96 °C) and the highest total dissolved solids (79–189 mg/L; mean 123.03 mg/L). Ero Lake presented the highest dissolved oxygen levels (6.8–9.1 mg/L; mean 7.74 mg/L) and the lowest total dissolved solids (39–108 mg/L; mean 68.29 mg/L). Egbe Lake exhibited the highest conductivity range (158–231 μS/cm; mean 196.09 μS/cm), while Ero Lake had the lowest biochemical oxygen demand (3.7–6.2 mg/L; mean 4.92 mg/L). pH values were comparable across the reservoirs, with Ureje showing a slightly higher range (7.2–7.9; mean 7.57).

Table 1.
Range of environmental parameters including dissolved oxygen (O2), Biochemical Oxygen Demand (BOD), Total Dissolved Solids (TDS), Conductivity, Temperature and pH across the three study sites during the study period.
3.2. Fish Catch and Relative Abundance
A total of 40,890 individual fish representing 12 species were recorded across the three reservoirs (Table 2). Of these, six species were found in all lakes, while the remaining species showed site specific occurrence. Nine of the recorded species are commercially important in Nigeria, including Oreochromis niloticus, Tilapia zilli, Coptodon guineensis, Sarotherodon galilaeus, Clarias gariepinus, Clarias anguillaris, Chrysichthys nigrodigitatus, Heterotis niloticus, and Parachanna obscura. The presence of these commercially valuable species across the systems underscores the role of the reservoirs in sustaining fisheries related ecosystem services such as food provision and livelihood support.
Table 2.
Fish Species Identified in Ureje, Egbe, and Ero Lakes with Their Taxonomic Classification and Feeding Habits.
During the study period, 16,157 individual fish were recorded from Ureje Lake, comprising seven species across four families: Cichlidae, Hepsetidae, Clariidae, and Channidae (Table 3). The species identified were Oreochromis niloticus (Linnaeus, 1758), Tilapia zilli (Gervais, 1848), Coptodon guineensis (Günther, 1862), Sarotherodon galilaeus (Linnaeus, 1758), Hepsetus odoe (Bloch, 1794), Clarias gariepinus (Burchell, 1822), and Parachanna obscura (Günther, 1862). Oreochromis niloticus had the highest relative abundance at 29.46%, while Parachanna obscura recorded the lowest at 4.69%. The predominance of commercially valuable cichlid and catfish species highlights the contribution of Ureje Lake to fisheries-based ecosystem services, particularly local food supply and income generation.
Table 3.
Fish fauna composition and relative abundances in Ureje Lake.
Monthly trends in terms of relative abundance are given in Figure 2. The Kruskal–Wallis test for monthly relative abundance of fish species in Ureje Lake showed no significant temporal variation. The chi squared value was 0.46043 with 6 degrees of freedom and the p value was 0.9983, indicating that the distribution of species abundance remained stable throughout the sampling months.
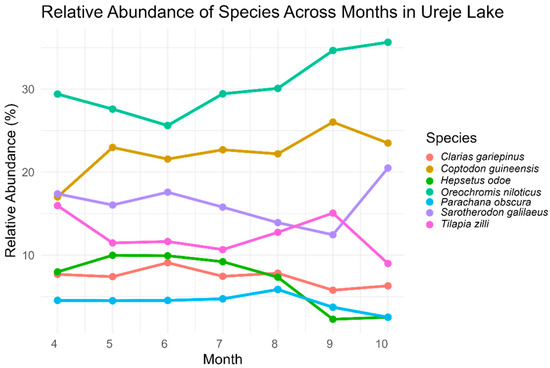
Figure 2.
Monthly relative abundance of species in Ureje lake.
A total of 11,157 fish were recorded from Egbe Lake, comprising eight species across six families, namely Cichlidae, Clariidae, Alestidae, Hepsetidae, Channidae, and Mormyridae (Table 4). The species identified were Oreochromis niloticus (Linnaeus, 1758), Tilapia zilli (Gervais, 1848), Coptodon guineensis (Günther, 1862), Hepsetus odoe (Bloch, 1794), Hydrocynus vittatus (Castelnau, 1861), Clarias gariepinus (Burchell, 1822), Parachanna obscura (Günther, 1862), and Hyperopisus bebe (Lacepède, 1803). O. niloticus had the highest relative abundance at 32.86%, while H. bebe had the lowest at 2.78%.
Table 4.
Fish fauna composition and relative abundances in Egbe Lake.
The Kruskal–Wallis test for monthly relative abundance (Figure 3) in Egbe Lake showed no statistically significant variation across months. The chi-squared value was 0.20301 with a p value of 0.9998, indicating that relative abundance remained consistent throughout the sampling period.
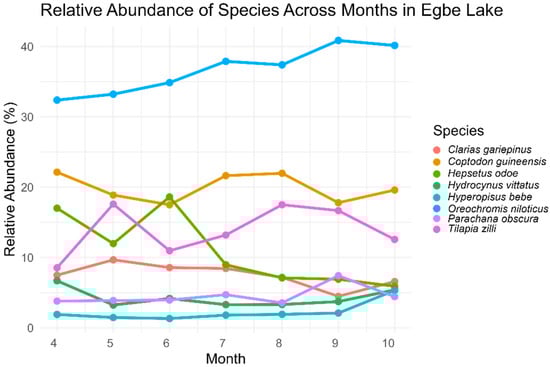
Figure 3.
Monthly relative abundances of fish species in Egbe lake.
During the study period, a total of 13,576 fish were recorded from Ero Lake, comprising nine species across six families: Cichlidae, Clariidae, Osteoglossidae, Bagridae, Hepsetidae, and Channidae (Table 5). The species identified included O. niloticus (Linnaeus, 1758), T. zilli (Gervais, 1848), C. guineensis (Günther, 1862), H. odoe (Bloch, 1794), C. nigrodigitatus (Lacepède, 1803), C. gariepinus (Burchell, 1822), C. anguillaris (Linnaeus, 1758), P. obscura (Günther, 1862), and H. niloticus (Cuvier, 1829). Among these, O. niloticus showed the highest relative abundance at 32.28%, while H. niloticus had the lowest at 2.78%.
Table 5.
Fish fauna composition and relative abundance in Ero Lake.
The Kruskal–Wallis test for monthly relative abundance in Ero Lake indicated no statistically significant variation across months (p > 0.05). This shows that the observed monthly differences (Figure 4) were not meaningful, and species abundance remained consistent throughout the study period.
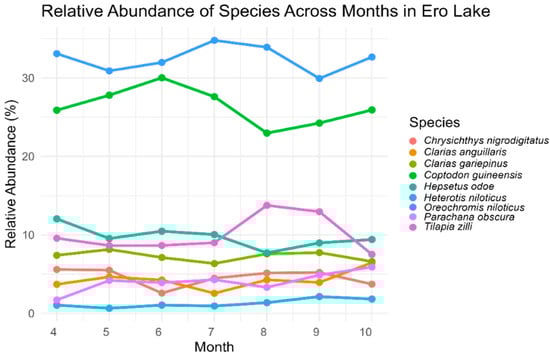
Figure 4.
Monthly relative abundance of fish species in Ero lake.
3.3. Relationship Between Abundance of Fish Fauna and Environmental Variables
The generalized linear model for Ureje Lake (Figure 5) showed that dissolved oxygen had the strongest positive coefficient for fish catch, while conductivity and total dissolved solids had moderate negative coefficients. Temperature showed a weak positive effect, and pH and biochemical oxygen demand had minimal influence. These results identify the key water quality variables associated with fish availability within this reservoir system.
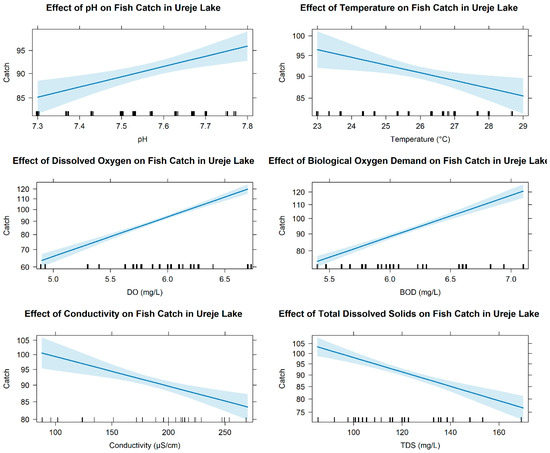
Figure 5.
General Linear model plot showing the influence of environmental variables on fish catch in Ureje Lake.
The generalized linear model for Egbe Lake (Figure 6) showed that dissolved oxygen and pH had positive coefficients for fish catch. Conductivity showed a moderate negative coefficient, while temperature and biochemical oxygen demand showed weak negative coefficients. Total dissolved solids had a slightly positive coefficient, indicating a differing pattern from the other chemical variables.
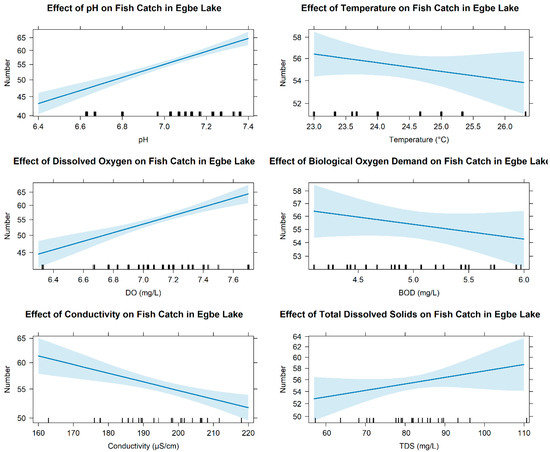
Figure 6.
General Linear model plot showing the influence of environmental variables on fish catch in Egbe Lake.
The generalized linear model for Ero Lake (Figure 7) showed negative coefficients for pH, temperature, and dissolved oxygen in relation to fish catch. Conductivity and biochemical oxygen demand showed minimal negative coefficients. Total dissolved solids had a positive coefficient, indicating higher catch at higher TDS levels.
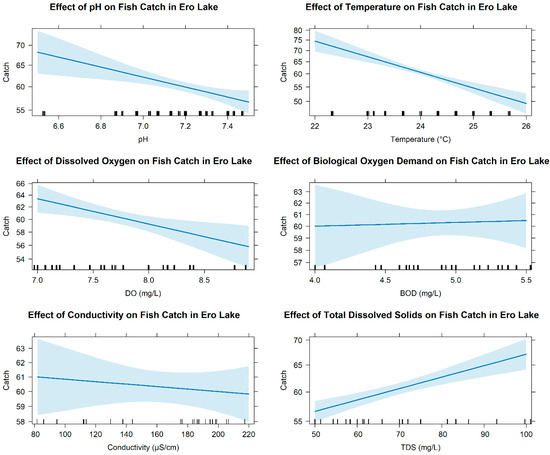
Figure 7.
General Linear model plot showing the influence of environmental variables on fish catch in Ero Lake.
3.4. Diversity Indices
Across the three lakes, a total of 12 fish species were recorded. Six species (Oreochromis niloticus, Tilapia zilli, Coptodon guineensis, Hepsetus odoe, Clarias gariepinus, and Parachanna obscura) occurred in all lakes, while others were site specific. Species richness remained stable, with Ureje, Egbe, and Ero Lakes recording 7, 8, and 9 species, respectively. Ero Lake showed the highest mean Shannon index and Margalef index, while Ureje recorded the lowest Margalef values and Egbe the lowest Shannon values (Table 6).
Table 6.
Diversity indices across the three lakes including Shannon index (H), Margalef’s index (MDI), Species Count (S), Simpson’s Index (SD) and the Equitability index (J). Ureje lake had the least Margalef’s index (MDI).
Across the study period, diversity indices in Ureje, Egbe, and Ero Lakes exhibited temporal variation (Figure 8) but no statistically significant monthly differences (p > 0.05), indicating steady community structure during the sampling window. In Ureje Lake, Shannon values ranged from 2.29 to 3.40, evenness from 1.18 to 1.75, and Margalef richness from 0.73 to 0.93. Egbe Lake recorded Shannon values between 2.39 and 3.36, evenness from 1.15 to 1.62, and Margalef values from 0.90 to 1.03. Ero Lake showed Shannon values from 2.47 to 3.40, evenness from 1.12 to 1.55, and Margalef values from 1.02 to 1.15, with Simpson values ranging from 0.04 to 0.11. These values reflect consistent species composition patterns across months, providing a stable foundation for evaluating the conservation potential of the three reservoirs.
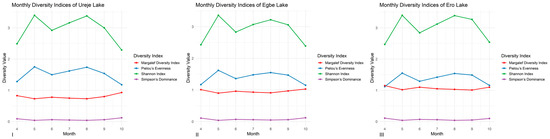
Figure 8.
Monthly Diversity Indices plot for Ureje (I), Egbe (II), and Ero (III) Lakes.
Overall, while monthly fluctuations were observed in the Shannon and Pielou’s indices, species counts remained relatively stable across all months, supporting consistent biodiversity levels throughout the study period. MANOVA results showed that site had a significant effect on the diversity indices (Supplementary Table S4), and MANOVA indicated that only the Margalef Diversity Index differed significantly among the three lakes (Supplementary Table S5). This result highlights spatial variation in species richness across the system (Supplementary Table S6), underscoring differences in ecological conditions that are relevant for conservation-focused assessments of habitat quality and species support capacity.
3.5. Catch DensityReport
Catch density varied among the three reservoirs. Ureje Lake recorded the highest catch density at 68.46 fish per hectare, followed by Egbe Lake with 18.91 fish per hectare, while Ero Lake had the lowest catch density at 11.51 fish per hectare.
3.6. Local Insights and Ecological Knowledge
Interviews with fishing household representatives in Egbe and Ero reservoirs and senior fishermen in Ureje reservoirs revealed similar patterns across reservoirs. Fish from the reservoirs support multiple ecosystem benefits: they are sold live on site for local food supply, used as laboratory specimens for education and research, and processed by women in fishing households to enhance value in the absence of storage facilities. Fishing occurs six days per week, underscoring the reservoirs’ continual role in sustaining livelihoods, with only Sundays reserved as a non-fishing rest day.
In Egbe and Ero, fishing is entirely privately managed with no formal oversight, and participation is limited to indigenous households, though the number of active fishers has declined due to rural urban migration and local insecurity. In Ureje reservoirs, activities are nominally supervised by the Department of Fisheries Services, but monitoring is limited mainly to gear and size restrictions, and routine catch reporting does not occur. Across all reservoirs, fishers emphasized that catch documentation is generally absent and is only carried out when specifically requested by authorities or researchers. In the absence of such requests, fishing activities proceed unreported, reflecting a broader lack of systematic data collection in all three reservoirs.
Respondents from all three lakes noted reductions in catch volume and species diversity, with several species now rare or absent. Ureje fishers recalled short lived and poorly implemented management actions such as restocking, while fishers in Egbe and Ero reported no experience of formal management or conservation measures.
4. Discussion
The three Ekiti State reservoirs (Ureje, Egbe, and Ero) sustain temporally stable, low-diversity fish assemblages decades after impoundment and continue to harbour four native predatory species (Heterotis niloticus, Parachanna obscura, Hepsetus odoe, and Hyperopisus bebe) that have become locally rare or absent in the surrounding degraded and fragmented river systems. These findings illustrate that small and medium tropical reservoir, despite their initial negative impacts on lotic biodiversity [17], can evolve into important surrogate habitats and local conservation assets where natural riverine refugia have been lost or severely compromise [18,19].
4.1. Environmental Suitability and Differential Drivers of Fish Persistence
All measured physicochemical parameters remained within ranges generally considered suitable for warm-water freshwater fishes throughout the study period [20] indicating that none of the reservoirs was environmentally limiting for fisheries production. Ero Reservoir consistently displayed the highest dissolved oxygen concentrations (mean 7.74 mg/L) and the lowest total dissolved solids (mean 68.29 mg/L), while Ureje exhibited the highest water temperature and total dissolved solids, and Egbe the highest conductivity (Table 1). Generalized linear models revealed reservoir-specific environmental drivers of fish catch: dissolved oxygen had the strongest positive relationship with catch in Ureje, pH and dissolved oxygen in Egbe, and total dissolved solids in Ero.
These contrasting patterns reflect catchment-specific land-use influences (urban runoff in Ureje; agricultural inputs in Egbe and Ero) and confirm that, despite anthropogenic pressures, current water-quality conditions remain adequate to support viable fish populations across all three systems. The superior oxygen regime and lower ionic load in Ero align with previous observations that this reservoir offers the most favourable conditions for fish growth and physiological performance [6].
Together, these results indicate that while overall environmental conditions support fish persistence across all three reservoirs, the relative importance of abiotic drivers varies among sites. This spatial heterogeneity underscores that reservoir fisheries function under different environmental constraints and capacities, reinforcing the need to interpret fishery parameters in relation to local physicochemical contexts rather than assuming uniform drivers across systems.
4.2. Fish Assemblages: Stability, Dominance, and Conservation Significance
A total of twelve species from six families were recorded, with a core assemblage of six species (Oreochromis niloticus, Tilapia zilli, Coptodon guineensis, Hepsetus odoe, Clarias gariepinus, Parachanna obscura) present in all three reservoirs and showing no significant monthly variation in relative abundance (Kruskal–Wallis p > 0.05). The absence of significant monthly variation in relative abundance indicates remarkable temporal stability and ecological resilience [21]. O. niloticus dominated catches in every reservoir (29–33% relative abundance), consistent with its widespread dominance in West African impoundments due to its high ecological plasticity and preference for lentic conditions [22,23].
Species richness increased with reservoir size and habitat complexity: Ureje (smallest, urban) hosted 7 species, Egbe 8 species, and the largest and deepest Ero 9 species. Ero also exhibited a significantly higher Margalef richness index (p < 0.05), underlining the positive influence of greater surface area, volume, depth, and better water quality on habitat heterogeneity [24].
The modest total of 12 species (7–9 per reservoir) is typical of tropical reservoirs and reflects both the well-documented loss of rheophilic specialists after impoundment [17,25] and the selectivity of the sampling gears used. Overnight multi-panel gillnets and traditional basket traps efficiently capture mid-water and benthic adults but consistently under-sample small-bodied, surface-dwelling, pelagic, and strongly rheophilic taxa [26,27].
From a local conservation perspective, the persistent occurrence of Heterotis niloticus, Parachanna obscura, Hepsetus odoe, and Hyperopisus bebe at low but consistent abundance is particularly significant. Although globally classified as Least Concern by IUCN, these species have become locally rare or absent in many degraded and fragmented river systems in southwestern and south-eastern Nigeria [28,29,30,31,32]. Their continued presence in these reservoirs, combined with documented positive allometric growth and higher condition factors in the less-exploited Ero Reservoir [6], highlights the potential of small and medium tropical reservoirs to function as important surrogate habitats and local strongholds for regionally vulnerable fish populations.
4.3. Anthropogenic Pressure, Governance Deficits, and Threats to Conservation Value
Catch density varied six-fold across the three reservoirs as seen in Table 7. The markedly higher yield in urban-adjacent Ureje reflects accessibility-driven fishing pressure commonly observed in Nigerian inland waters [33,34]. Fisher interviews confirmed that no routine monitoring or compulsory catch reporting exists in any of the reservoirs. In Egbe and Ero, fishing remains entirely unregulated and largely restricted to indigenous households, with participation declining due to rural–urban migration and insecurity. In Ureje, only nominal gear inspections occur.
Table 7.
Catch Density for the three lakes given in (ha−1).
This open-access regime, combined with the near-absence of landings records, perpetuates unreported exploitation and aligns with widespread institutional weaknesses in West African inland fisheries [35,36]. Earlier frame surveys already identified heavy, unregulated effort in Egbe that skews populations toward juveniles [11], a pattern corroborated here and by the lower condition factors observed in Ureje and Egbe [6]. Collectively, these governance deficits and localized overfishing currently constitute the principal threats to the ecological and emerging conservation value of all three reservoirs.
4.4. Functional Integrity and Trophic Structure
Despite the low taxonomic diversity and strong numerical dominance by cichlids, the three reservoirs maintain a functionally complete trophic structure (Table 2) that includes herbivores/omnivores (Oreochromis niloticus, Tilapia zilli, Coptodon guineensis), detritivores/invertivores (Clarias spp., Chrysichthys nigrodigitatus), and top piscivores (Hepsetus odoe, Parachanna obscura, Hydrocynus vittatus). Active predator–prey relationships persist, with H. odoe continuing to feed predominantly on T. zilli and smaller cichlids [37,38].
Carnivorous species show clear differences in body condition that align with observed fishing pressure gradients. According to a companion study conducted in the same three reservoirs, H. odoe and P. obscura exhibited strong positive allometric growth (b > 3.0) and high Fulton condition factors K > 1.0 in the less-exploited Ero and Egbe reservoirs, whereas both species displayed isometric or slightly negative allometry and substantially lower condition (K) as low as 0.48 in the heavily fished Ureje system [6]. his pattern is consistent with broader observations from large African impoundments, where top predators are typically the first guild to decline under size-selective artisanal fishing [4]. The agreement between the independently derived condition data and our catch-density results further reinforces exploitation intensity as the primary driver of ecological differences among the three reservoirs
The greater depth and volume of Ero provide spatial refugia and enhanced prey availability, resulting in better condition across all trophic levels and the exclusive occurrence of the large-bodied H. niloticus [6]. Overall, these reservoirs have not degenerated into simple tilapia-production systems; they retain intact trophic linkages and notable functional resilience, particularly in the larger and less-exploited systems. Protecting the carnivore guild therefore emerges as a clear management priority for sustaining ecological integrity in small and medium tropical reservoirs.
5. Practical Management Recommendations Derived from the Study
The results highlight both the ecological value and the current vulnerabilities of Ureje, Egbe, and Ero reservoirs. Despite minimal formal governance, these systems sustain stable fish assemblages and harbour several native species that have become locally scarce in surrounding rivers. At the same time, intense and largely unrecorded fishing pressure (especially in urban-adjacent Ureje) and the complete absence of routine monitoring represent the clearest threats to their long-term productivity and ecological function. Drawing directly from the evidence presented, we propose the following seven low-cost, locally feasible actions that have already proven effective in comparable African inland fisheries:
- Introduce compulsory catch and effort reporting systems.
Replace the current ad hoc recording with permanent paper logbooks or free mobile-phone apps supervised by Ekiti State Fisheries staff. This single measure rapidly improves data availability and compliance in similar Nigerian and East African systems [39]. Introducing them in the three reservoirs would create the first continuous catch-and-effort dataset, enable early detection of stock decline and strengthen compliance through a low-cost approach that fishers readily adopt.
- 2.
- Adopt reservoir specific fishing regulations that reflect ecological and exploitation patterns.
Apply stricter daily effort limits and permanent no-take zones in heavily fished Ureje, and minimum mesh-size regulations plus short seasonal closures in Egbe and Ero. Site-tailored rules have repeatedly restored stocks in small African water bodies [40].
- 3.
- Establish formal co-management committees to address governance gaps.
Establish small committees that include fishers, women fish processors, community leaders, and state fisheries officers. Successful examples from East Africa and the Niger Inland Delta show quick gains in rule compliance and reduced illegal gear use [41,42].
- 4.
- Integrate fishers’ ecological knowledge into monitoring and adaptive decision making.
Fishers provided detailed observations on declining catches and disappearing species. Regular structured interviews can supply low-cost, high-resolution monitoring data, as successfully practised in the Inner Niger Delta and Zambezi floodplains [42,43].
- 5.
- Incorporate environmental DNA metabarcoding into biodiversity monitoring.
Quarterly environmental DNA sampling would provide year-round biodiversity information, detect rare, cryptic and juvenile stages that gillnets routinely miss and overcome the limitations of single season sampling. This approach would also capture finer temporal and spatial variation and strengthen early detection of sensitive species at lower long-term cost. Environmental DNA surveys in Lake Tanganyika, Lake Rukwa and Nigerian lakes [44,45,46] have reliably detected rare, cryptic and juvenile species that gillnets consistently miss.
- 6.
- Integrate catchment protection and water quality management into reservoir governance frameworks.
The generalized linear models revealed reservoir specific responses of fish abundance to dissolved oxygen, total dissolved solids, pH and related variables. Urban runoff (Ureje) and agricultural inputs (Egbe, Ero) are the main water-quality concerns identified by the generalized linear models. Simple buffer-zone planting and regular basic water testing can maintain the favourable conditions that currently support fish assemblages.
- 7.
- Officially recognize the reservoirs in state fisheries and biodiversity plans
Formal recognition as “priority inland fishery and biodiversity sites” would ensure that future water-management decisions consider fish conservation co-benefits, in line with continental recommendations for small impoundments [36]. Official status would secure technical support and funding interventions towards sustainable management.
These seven actions are inexpensive, build on existing local practices, and can be phased in progressively. Together, they offer a realistic pathway to secure both livelihoods and ecological function in three typical small tropical reservoirs, providing a transferable model for hundreds of similar systems across West Africa.
6. Conclusions
Ureje, Egbe, and Ero reservoirs sustain stable, low-diversity fish assemblages decades after impoundment and continue to support several native species that have become locally rare in the surrounding degraded river systems. Despite minimal formal management and favourable water quality, these small tropical impoundments currently provide both essential fisheries production and unexpected ecological value.
Their long-term viability, however, remains fragile in the absence of basic governance. Seven straightforward, low-cost measures (compulsory catch-and-effort recording, reservoir-specific fishing rules, co-management committees, systematic use of fishers’ knowledge, routine eDNA monitoring, catchment protection, and official recognition in state plans) have already succeeded in comparable African water bodies and are fully feasible here.
Implementing these actions would secure sustainable livelihoods for fishing communities while preserving the ecological function of three typical West African reservoirs, offering a practical and replicable model for hundreds of similar ageing impoundments across the region.
Supplementary Materials
The following supporting information can be downloaded at: https://www.mdpi.com/article/10.3390/limnolrev26010002/s1, Table S1: Monthly diversity indices of Ureje Lake, Table S2: Monthly diversity indices of Egbe Lake; Table S3: Monthly diversity indices of Ero Lake; Table S4: MANOVA results for Diversity Indices across the three sites; Table S5: Summary of MANOVA results with each Index across the three sites; Table S6: Tukey test to separate means for Margalef Diversity Index amongst the three study sites.
Author Contributions
Conceptualization, M.P. and O.T.J.; methodology, M.P. and O.T.J.; software, O.T.J.; validation, M.P.; formal analysis, O.T.J.; investigation, M.P., O.T.J., J.B.O. and O.O.J.; resources, M.P., J.B.O. and O.O.J.; data curation, O.T.J.; writing—original draft preparation, O.T.J. and M.P.; writing—review and editing, O.T.J., F.Z., R.M., F.M., A.C., F.S., M.R., J.B.O., V.S., O.O.J., M.S., A.B. and M.P.; and supervision, M.P. All authors have read and agreed to the published version of the manuscript.
Funding
This research received no external funding.
Informed Consent Statement
Informed consent (Oral) was obtained from all subjects involved in the study. However, no personal details were collected throughout the study.
Data Availability Statement
Data used are reported in this study.
Acknowledgments
The authors thank the Ekiti State Ministry of Agriculture of Nigeria as well as the Ekiti State Water Corporation of Nigeria for their support and for sharing data.
Conflicts of Interest
The authors declare no conflicts of interest.
References
- Brondízio, E.S.; Settele, J.; Díaz, S.; Ngo, H.T. The Global Assessment Report of the Intergovernmental Science-Policy Platform on Biodiversity and Ecosystem Services; Intergovernmental Science-Policy Platform on Biodiversity and Ecosystem Services (IPBES): Bonn, Germany, 2019. [Google Scholar]
- WWF. Living Planet Report 2024—A System in Peril; WWF: Gland, Switzerland, 2024. [Google Scholar]
- FAO. The State of World Fisheries and Aquaculture 2024; FAO: Rome, Italy, 2024. [Google Scholar]
- Kolding, J.; van Zwieten, P.A.M. Relative Lake Level Fluctuations and Their Influence on Productivity and Resilience in Tropical Lakes and Reservoirs. Fish. Res. 2012, 115–116, 99–109. [Google Scholar] [CrossRef]
- Olagbemide, P.T.; Owolabi, O.D. Length-Weight Relationship and Condition Factor of Oreochromis Niloticus (Linnaeus, 1758) in Selected Tropical Reservoirs of Ekiti State, Southwest Nigeria. J. Exp. Biol. Agric. Sci. 2023, 11, 707–719. [Google Scholar] [CrossRef]
- Julius, O.T.; Zangaro, F.; Massaro, R.; Marcucci, F.; Cazzetta, A.; Sangiorgio, F.; Olasunkanmi, J.B.; Specchia, V.; Julius, O.O.; Rosati, I.; et al. Assessing Fish Populations Through Length–Weight Relationships and Condition Factors in Three Lakes of Nigeria. Biology 2025, 14, 612. [Google Scholar] [CrossRef]
- Adebola, T.O.; Bello Olusoji, O.A.; Fagbenro, A.O.; Sabejeje, T.A. Length Weight Relationship and Condition Factor of Four Commercially Important Fish Species at ERO Reservoir, Ekiti State, Nigeria. Int. J. Inov. Res. Dev. 2016, 5, 101432. [Google Scholar]
- Olagbemide, P.T.; Owolabi, O.D. Metal Accumulation in Ekiti State’s Three Major Dams’ Water and Sediments, the Ecological Hazards Assessment and Consequences on Human Health. J. Exp. Biol. Agric. Sci. 2023, 11, 81–96. [Google Scholar] [CrossRef]
- Awogbami, O.S.; Ogundiran, M.A.; Ayandiran, T.A.; Fawole, O.O.; Adedokun, M.A.; Durodola, F.A.; Balogun, H.A.; Ishola, O.A.; Adebayo, P.; Olanipekun, A.S.; et al. Quality Assessment of Water, Nutritional Fitness and Parasitic Status of Three Selected Fish Species in Ero Dam, Nigeria. J. Surv. Fish. Sci 2024, 11, 91–120. [Google Scholar]
- Adubiaro, H.O.; Animashaun, S.A. Levels of Some Heavy Metals in Fish Organs from Egbe Dam, Ekiti State, Nigeria. Riv. Ital. Delle Sostanze Grasse 2021, 98, 105–113. [Google Scholar]
- Haruna, K.; Adamu, I. Frame and Catch Assessment Surveys of the Fisheries of Egbe Reservoir, Ekiti State, Nigeria. Bull. Environ. Sci. Sustain. Manag. 2023, 7, 12–14. [Google Scholar] [CrossRef]
- Edward, J.B.; Agunbiade, R.O.; Falade, J. Influence of Land-Use Pattern on Ureje Reservoir, Ado-Ekiti, Southwestern Nigeria. Am. J. Life Sci. Spec. Issue: Environ. Toxicol. 2017, 5, 81–89. [Google Scholar] [CrossRef]
- Shannon, C.E.; Weaver, W. The Theory of Mathematical Communication. Bell Syst. Tech. J. 1949, 27, 379–429. [Google Scholar] [CrossRef]
- Simpson, E.H. Measurement of Diversity. Nature 1949, 163, 688. [Google Scholar] [CrossRef]
- Pielou, E.C. The Measurement of Diversity in Different Types of Biological Collections. J. Theor. Biol. 1966, 13, 131–144. [Google Scholar] [CrossRef]
- Chao, A. Estimating the Population Size for Capture-Recapture Data with Unequal Catchability. Biometrics 1987, 43, 783. [Google Scholar] [CrossRef]
- Agostinho, A.A.; Pelicice, F.M.; Gomes, L.C. Dams and the Fish Fauna of the Neotropical Region: Impacts and Management Related to Diversity and Fisheries. Braz. J. Biol. 2008, 68, 1119–1132. [Google Scholar] [CrossRef]
- Baumgartner, M.T.; Piana, P.A.; Baumgartner, G.; Gomes, L.C. Storage or Run-of-River Reservoirs: Exploring the Ecological Effects of Dam Operation on Stability and Species Interactions of Fish Assemblages. Environ. Manag. 2020, 65, 220–231. [Google Scholar] [CrossRef]
- Muniz, C.M.; Frota, A.; Ganassin, M.J.M.; Agostinho, A.A.; Gomes, L.C. Do River Basins Influence the Composition of Functional Traits of Fish Assemblages in Neotropical Reservoirs? Braz. J. Biol. 2021, 81, 765–775. [Google Scholar] [CrossRef] [PubMed]
- FAO; WHO. Safety and Quality of Water Used in the Production and Processing of Fish and Fishery Products; FAO: Rome, Italy, 2023. [Google Scholar]
- dos Santos, N.C.L.; de Santana, H.S.; Ortega, J.C.G.; Dias, R.M.; Stegmann, L.F.; da Silva Araújo, I.M.; Severi, W.; Bini, L.M.; Gomes, L.C.; Agostinho, A.A. Environmental Filters Predict the Trait Composition of Fish Communities in Reservoir Cascades. Hydrobiologia 2017, 802, 245–253. [Google Scholar] [CrossRef]
- Ajagbe, S.O.; Ajagbe, R.O.; Ariwoola, O.S.; Abdulazeez, F.I.; Oyewole, O.O.; Ojubolamo, M.T.; Olomola, A.O.; Oyekan, O.O.; Oke, O.S. Diversity and Abundance of Cichlids in Ikere Gorge Reservoir, Iseyin, Oyo State, Nigeria. Zoologist 2021, 18, 52–56. [Google Scholar] [CrossRef]
- Komolafe, O.O.; Arawomo, G.A.O. Reproductive Strategy of Oreochromis Niloticus (Pisces: Cichlidae) in Opa Reservoir, Ile-Ife, Nigeria. Rev. Biol. Trop. 2007, 55, 595–602. [Google Scholar] [CrossRef]
- Liu, Z.; Zhang, Y.; Pan, Y.; Ma, Z.; Han, X.; Zhou, Z.; Tian, S.; Sun, B.; Liu, Z.; Zhang, Y.; et al. Spatial Heterogeneity and Methodological Insights in Fish Community Assessment: A Case Study in Hulun Lake. Biology 2025, 14, 1678. [Google Scholar] [CrossRef]
- Poff, N.L.; Zimmerman, J.K.H. Ecological Responses to Altered Flow Regimes: A Literature Review to Inform the Science and Management of Environmental Flows. Freshw. Biol. 2010, 55, 194–205. [Google Scholar] [CrossRef]
- Olin, M.; Malinen, T.; Ruuhijärvi, J. Gillnet Catch in Estimating the Density and Structure of Fish Community—Comparison of Gillnet and Trawl Samples in a Eutrophic Lake. Fish. Res. 2009, 96, 88–94. [Google Scholar] [CrossRef]
- Klein, Z.; McCormick, J. Evaluation of the Influence of Correcting for Gillnet Selectivity on the Estimation of Population Parameters. PLoS ONE 2023, 18, e0287434. [Google Scholar] [CrossRef]
- Dagoudo, M.; Benhaïm, D.; Montchowui, E. Current Status and Prospects for Efficient Aquaculture of the African Bonytongue, Heterotis Niloticus (Cuvier, 1829): Review. J. World Aquac. Soc. 2025, 56, e70009. [Google Scholar] [CrossRef]
- Amoutchi, A.I.; Kamelan, T.M.; Kargbo, A.; Gneho, D.A.D.; Kouamelan, E.P.; Mehner, T. Local Fishers’ Knowledge on the Ecology, Economic Importance, and Threats Faced by Populations of African Snakehead Fish, Parachanna Obscura, within Côte d’Ivoire Freshwater Ecosystems. Aquac. Fish Fish. 2023, 3, 287–301. [Google Scholar] [CrossRef]
- Ogueri, C.; Anyanwu, C.N.; Adaka, G.S.; O Ajima, M.N.; Utah, C.; Nwaka, D.; Ezeafulukwe, C.F.; Oguleru, P.O.; Alabi, B.; Adebayo, E.T. Stock Status of Hepsetus Odoe (Bloch 1974) in River Imo, Nigeria, for Conservation and Management Strategies for Sustainability. Manglar 2025, 22, 305–310. [Google Scholar] [CrossRef]
- Souley, S.M.N.; Harouna, M.; Ado, M.I.; Youssoufa, I. Length-Weight Relationships and Condition Factors of Mormyridae Species in the Niger River: Implications for Conservation and Management. Limnol. Freshw. Biol. 2025, 2025, 215–221. [Google Scholar] [CrossRef]
- Adamu, A.; Afaru, J.; Abubakar, K.A. Evaluating Fish Diversity and Distribution Patterns Across Seasons in The Lower River Benue, Nigeria. Ethiop. J. Environ. Stud. Manag. 2025, 18, 67–86. [Google Scholar]
- Adaka, G.S.; Nlewadim, A.A.; Udoh, J.P. Diversity and Distribution of Freshwater Fishes in Oguta Lake, Southeast Nigeria. Adv. Life Sci. Technol. 2016, 46, 25–32. [Google Scholar]
- Kareem, O.K.; Olanrewaju, A.N.; Orisasona, O.; Olofintila, O.O. Fish Diversity and Abundance in Ikere Gorge Reservoir, South-Western Nigeria. In Proceedings of the 40th Annual Conference of Forestry Association of Nigeria (FAN), Lagos, Nigeria, 12–16 March 2018; 2020, pp. 753–758. [Google Scholar]
- Olopade, O.A.; Dienye, H.E. Management of Overfishing in the Inland Capture Fisheries in Nigeria. J. Limnol. Freshw. Fish. Res. 2017, 3, 189–194. [Google Scholar] [CrossRef][Green Version]
- Kathy, H.; Bernerd, F.; Richard, L. Africa’s Forgotten Fishes; World Wide Fund for Nature (Formerly World Wildlife Fund): Gland, Switzerland, 2025. [Google Scholar]
- Ayoade, A.A.; Adeyemi, S.A.; Ayedun, A.S. Food and Feeding Habits of Hepsetus Odoe and Polypterus Senegalus in Eleyele Lake, Southwestern Nigeria. Trop. Freshw. Biol. 2018, 27, 43–53. [Google Scholar] [CrossRef]
- Winemiller, K.O.; Kelso-Winemiller, L.C. Comparative Ecology of the African Pike, Hepsetus Odoe, and Tigerfish, Hydrocynus Forskahlii, in the Zambezi River Floodplain. J. Fish. Biol. 1994, 45, 211–225. [Google Scholar] [CrossRef]
- Jeffers, V.F.; Humber, F.; Nohasiarivelo, T.; Botosoamananto, R.; Anderson, L.G. Trialling the Use of Smartphones as a Tool to Address Gaps in Small-Scale Fisheries Catch Data in Southwest Madagascar. Mar. Policy 2019, 99, 267–274. [Google Scholar] [CrossRef]
- Lawrence, T.J.; Achieng, A.O.; Chavula, G.; Haninga Haambiya, L.; Iteba, J.; Kayanda, R.; Kaunda, E.; Ajode, M.Z.; Muvundja, F.A.; Nakiyende, H.; et al. Future Success and Ways Forward for Scientific Approaches on the African Great Lakes. J. Great Lakes Res. 2023, 49, 102242. [Google Scholar] [CrossRef]
- Otundo Richard, M. Strategic Innovative Community-Based Fisheries Management Practices for The Success of The Blue Economy Program in Kenya. SSRN Electron. J. 2024. [Google Scholar] [CrossRef]
- Morand, P.; Kodio, A.; Andrew, N.; Sinaba, F.; Lemoalle, J.; Béné, C.; Morand, P.; Kodio, A.; Sinaba, F.; Andrew, N.; et al. Vulnerability and Adaptation of African Rural Populations to Hydro-Climate Change: Experience from Fishing Communities in the Inner Niger Delta (Mali). Clim. Change 2012, 115, 463–483. [Google Scholar] [CrossRef]
- Kupika, O.L.; Gandiwa, E.; Nhamo, G.; Kativu, S. Local Ecological Knowledge on Climate Change and Ecosystem-Based Adaptation Strategies Promote Resilience in the Middle Zambezi Biosphere Reserve, Zimbabwe. Scientifica 2019, 2019, 3069254. [Google Scholar] [CrossRef]
- Shechonge, A.H.; Collins, R.A.; Ward, S.; Saxon, A.D.; Smith, A.M.; Matiku, P.; Turner, G.F.; Kishe, M.A.; Ngatunga, B.P.; Genner, M.J. Environmental DNA Metabarcoding Details the Spatial Structure of a Diverse Tropical Fish Assemblage in a Major East African River System. Environ. DNA 2024, 6, e70008. [Google Scholar] [CrossRef]
- Keleman, P.J.; Durand, J.D.; Simier, M.; Camará, A.; Sá, R.M.; Panfili, J. EDNA-Based Seasonal Monitoring Reveals Fish Diversity Patterns in Mangrove Habitats of Guinea-Bissau, West Africa. Reg. Stud. Mar. Sci. 2025, 82, 104013. [Google Scholar] [CrossRef]
- Nneji, L.M.; Oladipo, S.O.; Nneji, I.C.; Atofarati, O.T.; Asiamah, M.K.; Adelakun, K.M. Evaluating EDNA Metabarcoding for Fish Biodiversity Assessment in Nigerian Aquatic Ecosystems: Potential, Limitations, and Comparisons with Traditional Methods. J. Freshw. Ecol. 2025, 40, 2541689. [Google Scholar] [CrossRef]


Disclaimer/Publisher’s Note: The statements, opinions and data contained in all publications are solely those of the individual author(s) and contributor(s) and not of MDPI and/or the editor(s). MDPI and/or the editor(s) disclaim responsibility for any injury to people or property resulting from any ideas, methods, instructions or products referred to in the content. |
© 2026 by the authors. Licensee MDPI, Basel, Switzerland. This article is an open access article distributed under the terms and conditions of the Creative Commons Attribution (CC BY) license.