Article

Phytoplankton Sampling: When the Method Shapes the Message

Instituto Nacional de Limnología (INALI, CONICET-UNL), Ciudad Universitaria, Paraje El Pozo S/N, Santa Fe C.P. 3000, Argentina
Limnol. Rev. 2025, 25(3), 45; https://doi.org/10.3390/limnolrev25030045
Submission received: 25 June 2025 / Revised: 5 September 2025 / Accepted: 10 September 2025 / Published: 18 September 2025

Abstract

Different sampling techniques were evaluated to assess potential differences in species richness and the abundances of phytoplankton across several lowland aquatic environments. Five sampling methods were used, including a bucket, narrow- and wide-mouth bottles, a 10 µm plankton net, and a vertical Van Dorn bottle. These sampling methods were applied in subtropical streams, shallow lakes, and rivers. The results were compared using a two-way ANOVA to evaluate differences in total density by considering the morphological group and major phytoplankton phyla. Similarity analyses (SIMPER) and a permutational multivariate analysis of variance (PERMANOVA) were performed to compare the relative abundances of the species. The results showed, in general (except with Cyanophyta, Chrysophyta, and colonies—coenobia), significant differences in the effect of the sampling method but without interaction with the kind of environment. Particularly, the plankton net always reported lower density estimations, with the bucket having the highest values and the wide–narrow bottle methods having similar values. SIMPER and PERMANOVA indicated differences, especially with the plankton net and the other methods, particularly the bucket. These findings suggest that the sampling method can influence species counts and registration in subtropical water ecosystems, highlighting the need for standardized procedures across countries to obtain comparable and reliable results.

Graphical Abstract

1. Introduction

Phytoplankton is represented by an assemblage of protist organisms that live suspended in the water column and have the capacity to photosynthesize [1]. Its importance in the trophic web of aquatic ecosystems is critical, providing ecosystem services linked to carbon fixation and nutrient biogeochemical cycles, and it constitutes the basis of relevant trophic interactions, such as predation, competition for resources, and mutualism that shape aquatic environment functions [2,3]. Moreover, phytoplankton is used as an indicator of water quality, responding to environmental issues like eutrophication, organic matter contamination, or hydraulic changes in natural and artificial water ecosystems [4,5,6,7,8,9,10]. Among them, Cyanophyta represents a relevant group, since they can form blooms, which affect the normal functions of an ecosystem and could be hazardous for human activities like tap water production or recreation [11,12,13,14].
Phytoplankton sampling in inland waters is conducted using various techniques, chosen based on environmental characteristics, study objectives, and logistical constraints. However, this diversity of methodologies can introduce potential bias in estimating phytoplankton species composition and abundance [15]. One of the simplest and most common techniques involves collecting surface water with buckets or bottles (narrow-mouth or wide-mouth), typically from the shore or a boat. These methods provide integrated samples of the surface layer and are widely used for monitoring or exploratory surveys. Nevertheless, it may underrepresent organisms inhabiting deeper layers or those exhibiting heterogeneous vertical distribution [16]. To obtain samples at specific depths, specialized bottles are employed, since they can be submerged at the desired depth (e.g., the Van Dorn bottle). These bottles allow for the characterization of vertical phytoplankton stratification, which is crucial in water bodies with pronounced thermoclines or chemical gradients like deep lakes or deep reservoirs [17,18]. However, the collected volume can be limited, and the method requires specific equipment and expertise for manipulation. Other widely used methods are plankton nets (around 10 or 30 µm of pore size) that allow for the concentration of phytoplankton through horizontal or vertical hauls. They are effective for detecting rare or large organisms (such as filamentous cyanobacteria or dinoflagellates) but tend to underestimate or exclude small organisms (pico and nanoplankton) and may overrepresent taxa with resistant structures like frustules or loricas [19,20]. Furthermore, the sampling effort is not always quantitative [21]. In lakes or reservoirs, tubes or vertical integration systems are used to obtain a composite sample from the surface to a predetermined depth (e.g., the photic zone). These methods aims to provide a more realistic representation of the phytoplankton community throughout a water column, although it may dilute localized concentrations [22]. More recently, some studies have incorporated automated techniques such as continuous flow samplers or integrated systems with sensors like fluorometers [23]. These allow for the assessment of phytoplankton biomass with high temporal and spatial resolution. However, their availability is limited, and they are used in long-term studies or intensive monitoring programs.
Given this methodological variety, several organizations have recommended adopting standardized protocols for phytoplankton monitoring. For instance, the U.S. Environmental Protection Agency (EPA) [23] and the International Commission for the Protection of the Danube River [19] have promoted technical guidelines aimed at enhancing comparability across regions. More recently, research networks like the Global Lake Ecological Observatory Network (GLEON) have also championed these efforts. Despite these initiatives, a high degree of heterogeneity in applying these protocols persists, particularly in countries with limited resources or in studies with exploratory objectives. In this study, I attempted to (1) determine if different sampling method techniques yielded differences in species richness and phytoplankton abundance observed by taxonomic and morphological groups and (2) explore if these differences are influenced by the kind of environment (shallow lakes, streams, or rivers). All of this is to make some recommendations about phytoplankton sampling methods, especially for researchers or technicians working in countries where phytoplankton studies and water quality monitoring programs are still an emerging field.

2. Material and Methods

2.1. Study Area

For this study, a set of shallow lakes, streams, and rivers included in the Middle Paraná River Basin were selected. The Middle Paraná is a stretch of the Paraná River located between its confluence with the Paraguay River (near Corrientes province, Argentina) and the city of Diamante in the province of Entre Ríos. It is characterized by its large width, constant flow, and the development of a complex river system with multiple tributaries, shallow lakes, and streams. Specifically, three shallow lakes (Tiradero, Miní, and Uba), three streams (Yacaré, Cataratas, and Boquerón), and three rivers (Coronda, Colastiné, and Colastinecito) were chosen for this study. All sites were sampled between 30 October and 7 November in the year 2022 (Figure 1).

2.2. Sampling and Counting Methods

Phytoplankton samples were collected at the surface layer using five different sampling methods as follows: (1) A 10-µm mesh net submerged just below the surface to filter 4 L of water, using a 1-L capacity collector, with sample subsequently transferred to a plastic bottle; (2) a 1 L vertical Van Dorn bottle submerged sub-superficially to ~ 45 cm under water, from which a 120 mL subsample was transferred to a plastic bottle after homogenization; (3) a 120 mL wide-mouth bottle and (4) a 120 mL narrow-mouth bottle, both manually introduced just below the surface; and (5) a 10 L bucket of 25 cm length also submerged just below the surface, with subsequent homogenization of water collected and transference to a 120 mL plastic bottle. Each method was applied equally across all sampling environments (three replicas per method for each kind of environment, n = 45). All samples obtained were immediately fixed with acidified Lugol’s solution (1% final concentration).
Phytoplankton density was estimated using the Utermöhl method [24] in all cases by sedimentation between 2.97 mL and 10 mL, depending on the sampling method used to secure a correct balance between sediment and organism counting. Organisms were counted under 400-fold magnification as they occurred in nature, with single cells, coenobia, colonies, or filaments. Counts were performed over 100 to 110 random fields per sample to secure a counting error of up to 20% [25]. Density was expressed as individuals per milliliter (ind mL−1). For net concentrated samples, estimated densities were corrected by accounting for the filtered water volume in the field (4 L in all cases) and the final concentrated volume in the sampling bottle. Taxonomic identification was performed to the species level using specific identification keys and the relevant literature for each algae group [26,27,28,29,30,31,32].

2.3. Statistical Analyses

For the statistical analysis, a two-way ANOVA was performed using the density of major phytoplankton groups (phyla) and morphological groups (colonies—coenobia, single cells, flagellates, filaments, and silica forms) as response variables. The type of environment (shallow lakes, streams, and rivers) and the sampling method (plankton net, narrow-mouth bottle, wide-mouth bottle, vertical Van Dorn bottle, and the bucket) were considered as independent factors. Tukey tests were used for post hoc paired comparison analysis. To assess differences in relative species abundance among sampling methods, similarity percentage (SIMPER) analysis was performed, accompanied by a permutational multivariate analysis of variance (PERMANOVA). All the statistical analyses were performed with the software PAST 3.18 [33].

3. Results

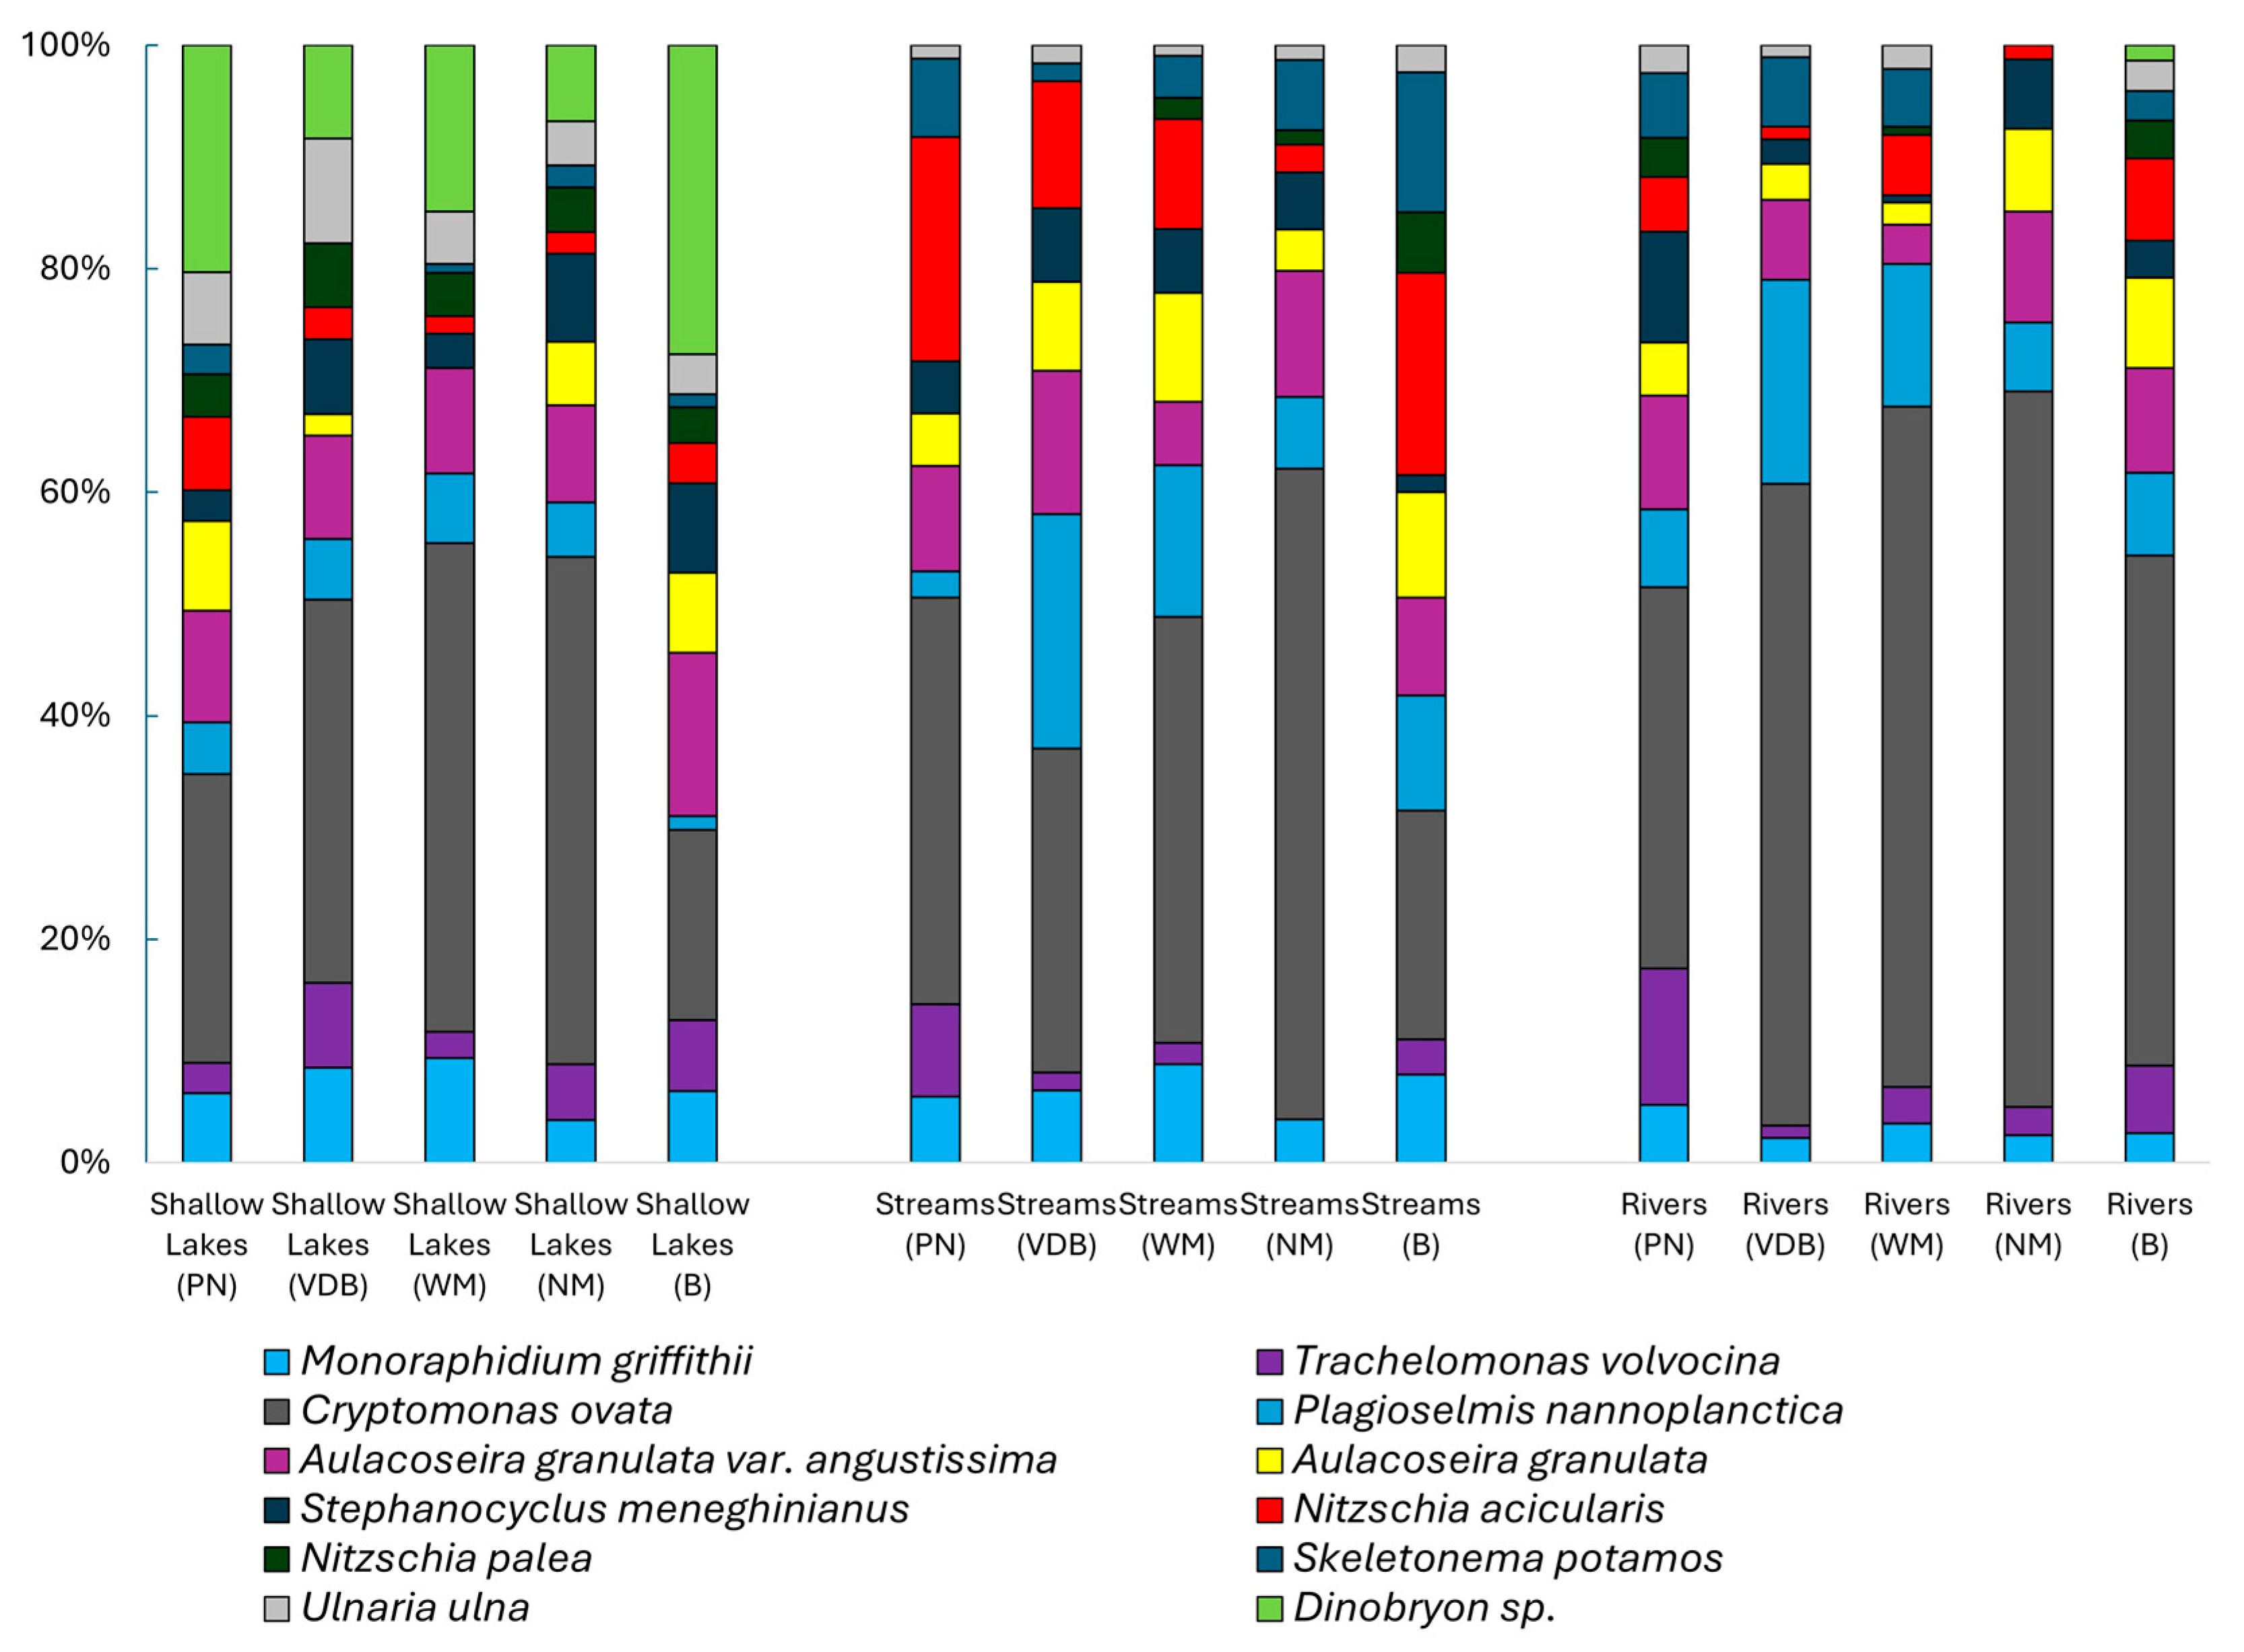
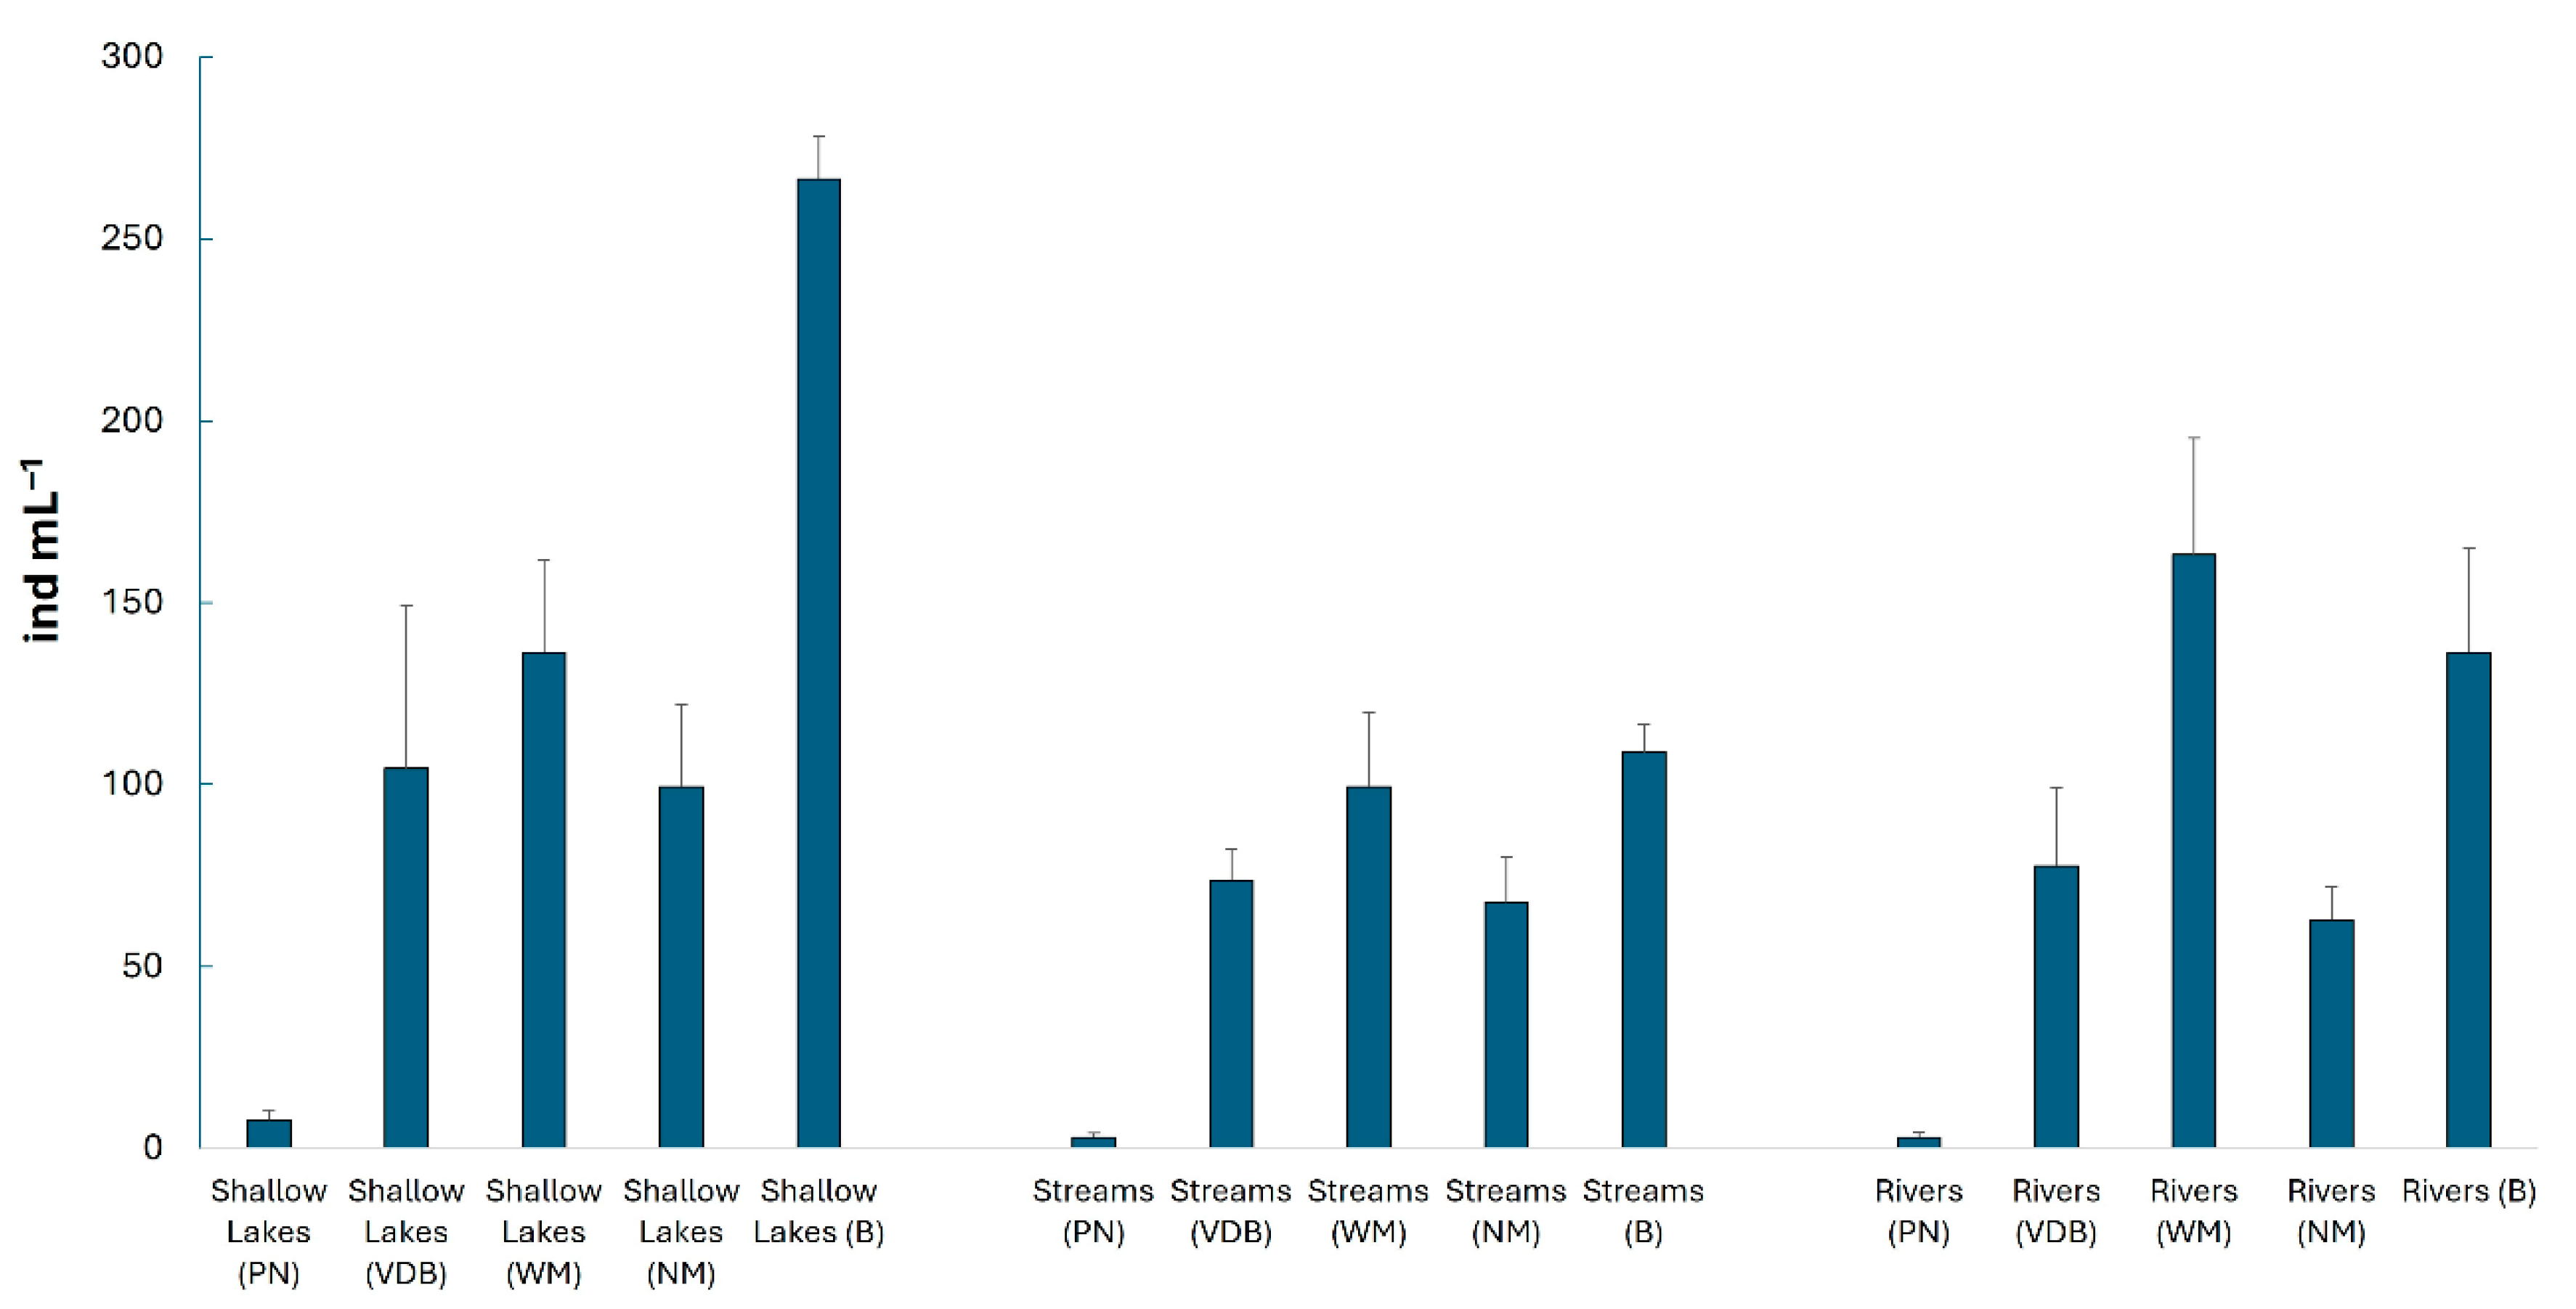
A total of 98 species were recorded across the environments sampled. Taxa registered were grouped into six phytoplankton phyla corresponding to Chlorophyta (41 species), Bacillariophyta (31 species), Euglenophyta (10 species), Cyanophyta (9 species), Chrysophyta (4 species), and Cryptophyta (3 species). Among the species registered, 12 of them appeared as dominant in the phytoplankton assemblage (>2% of total density). In this regard, Cryptomonas ovata Ehrenberg appeared as the dominant species among sampling stations followed by Plagioselmis nannoplanctica (Skuja) G.Novarino, I.A.N.Lucas & Morrall, and Monoraphidium griffithii (Berkeley) Komárková-Legnerová. Other species were more occasional and appeared at a high density, mostly on shallow lakes, like Dinobryon sp. and Aulacoseira granulata var. angustissima (O.Müller) Simonsen (Figure 2). Phytoplankton total mean density estimations ranged between 3 ind mL−1 and 267 ind mL−1. The lower values were obtained when samples were taken using a net. On the contrary, the highest density estimated values were obtained when the bucket was used, except in rivers where it was the wide-mouth bottle (Figure 3).
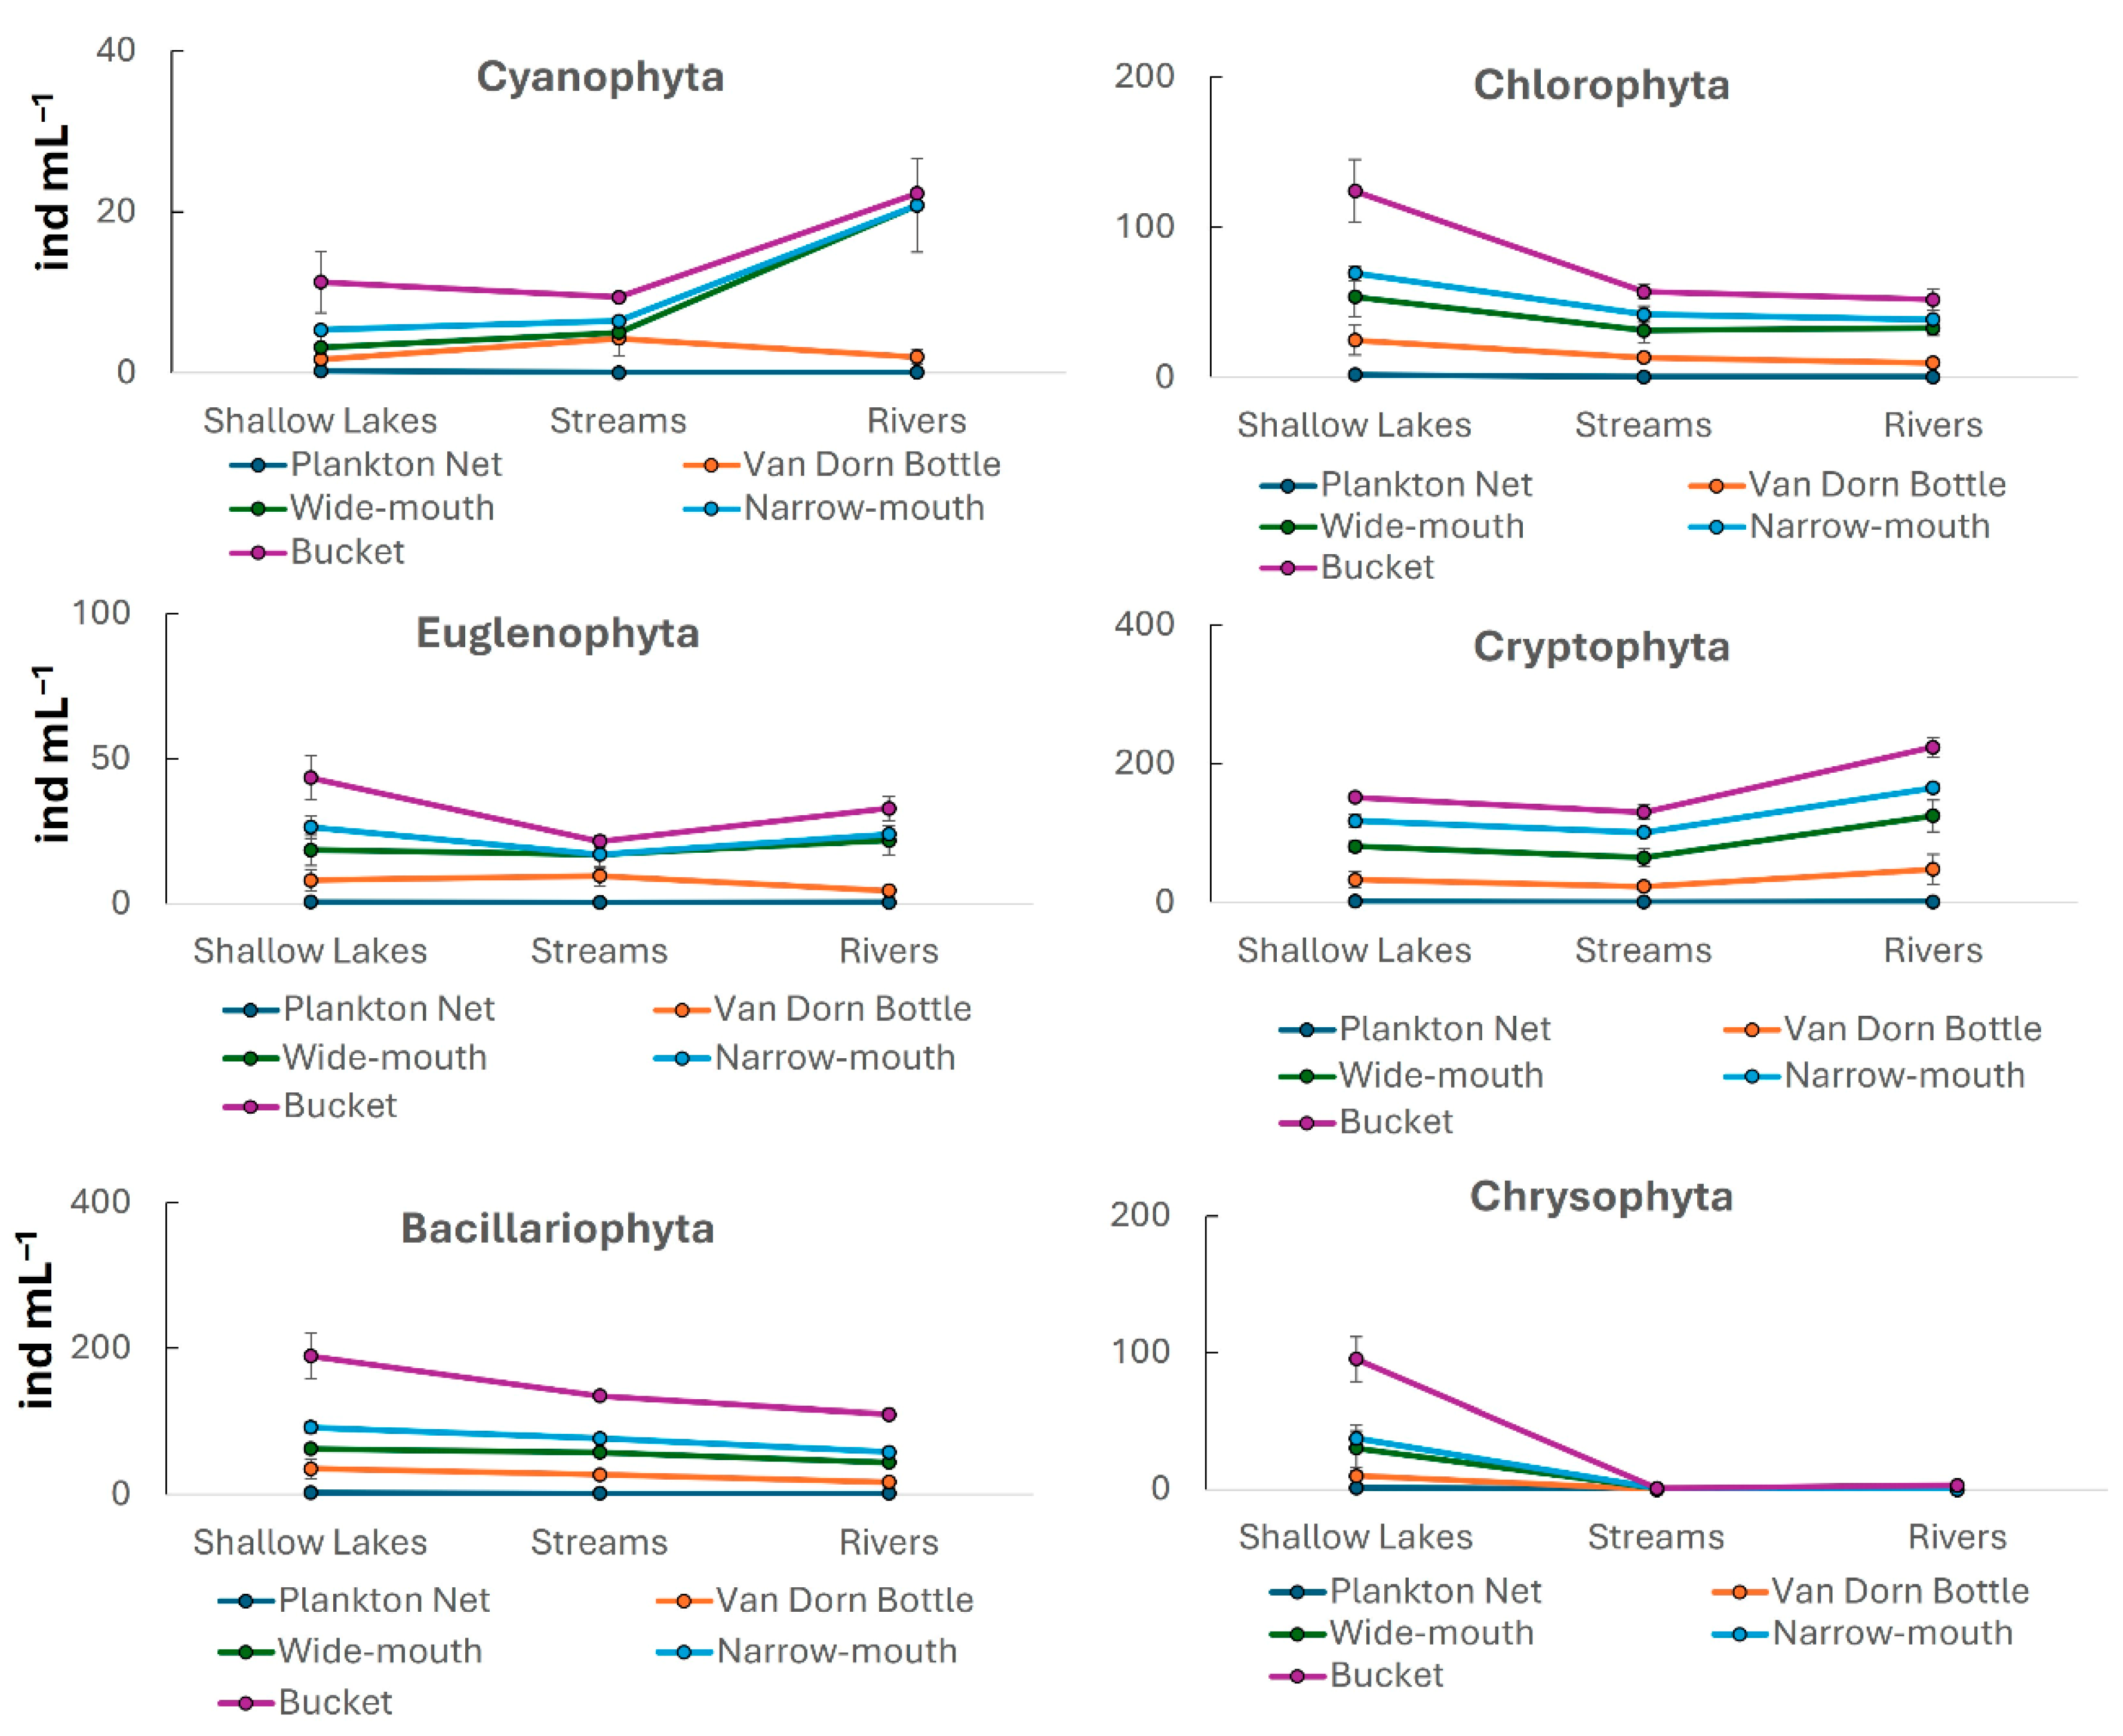
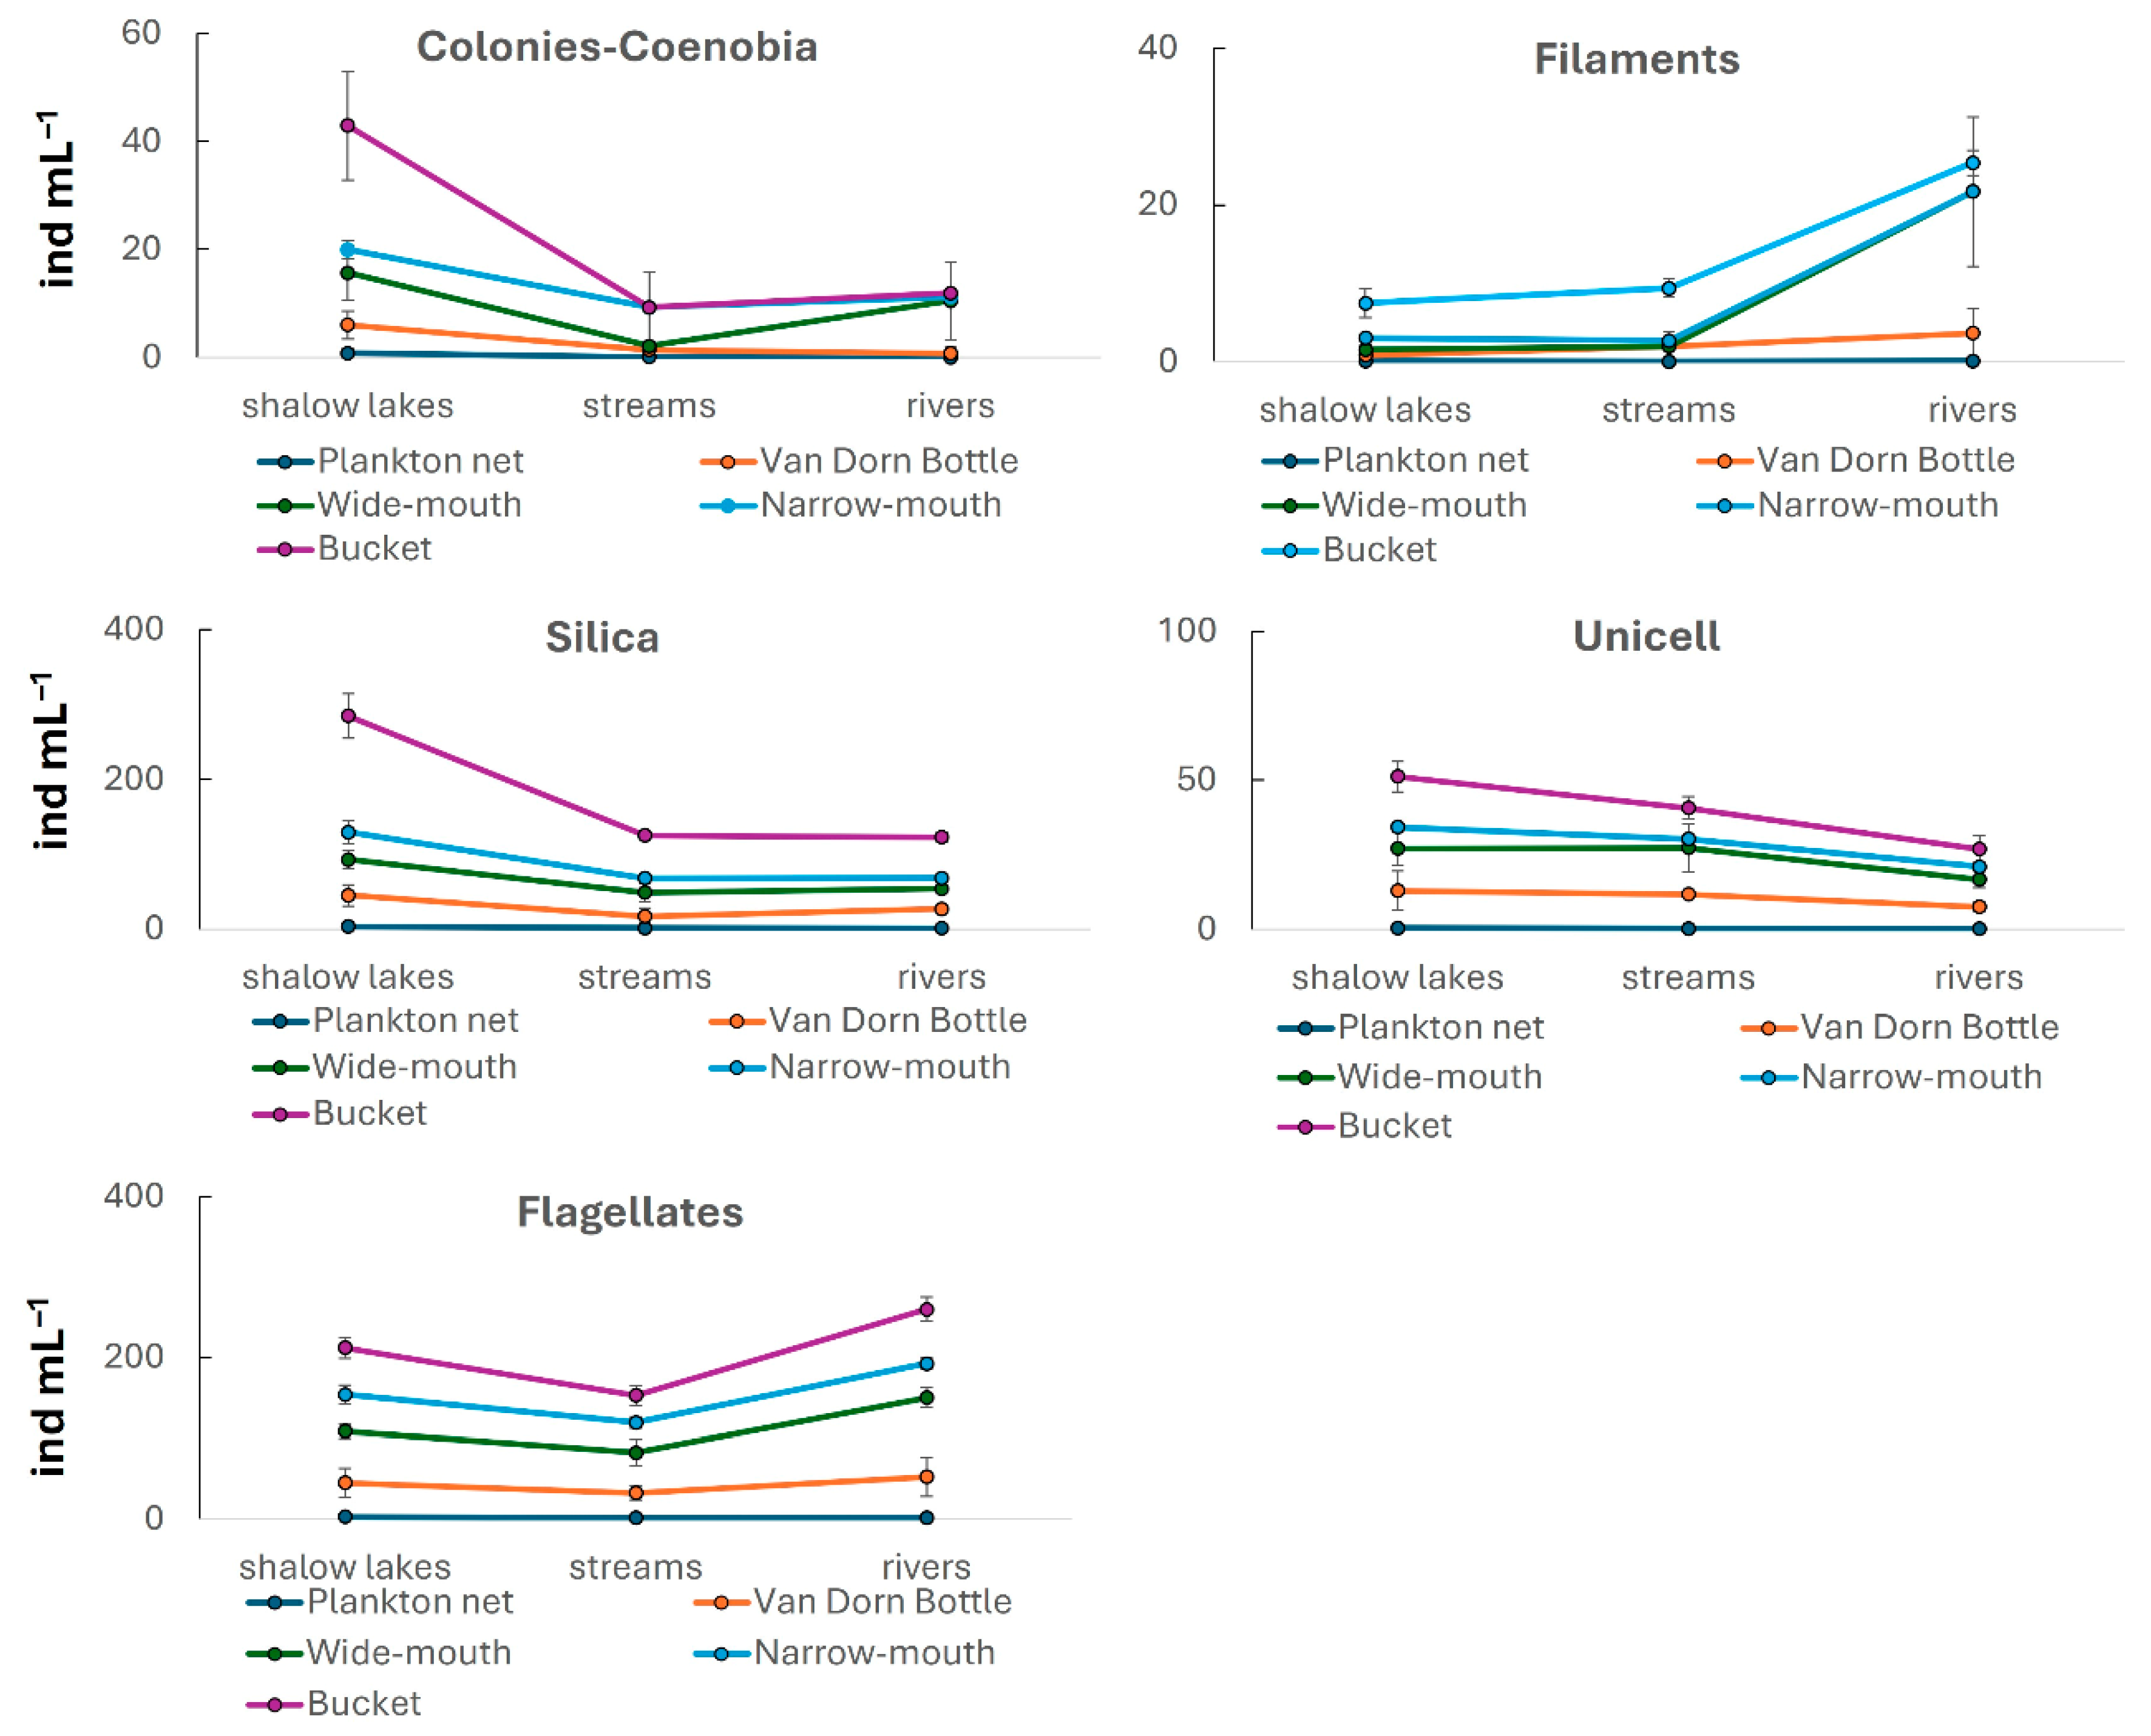
For phytoplankton phyla, Cyanophyta and Cryptophyta tend to be more abundant in rivers, while the other groups were in shallow lakes and streams (Figure 4). All the phytoplankton phyla reported the highest values with the bucket method and the lowest with the plankton net method. Wide- and narrow-mouth bottles showed similar results, with slightly higher density values estimated with the narrow-mouth bottle. The Van Dorn bottle showed, in general, lower density estimations than the wide- and narrow-mouth bottles (Figure 4). For the classification by morphological groups, higher densities for the colonies—coenobia and silica groups were reported in shallow lakes, while for filaments and flagellates, it was in rivers. The unicellular group showed similar values in streams and rivers but was slightly higher in the shallow lakes. In all cases, the same patterns regarding the net, bucket, and Van Dorn methods for phytoplankton phyla were obtained (Figure 5).
When densities were statistically compared using the two-way ANOVA, significant differences emerged for the total phytoplankton estimate and for most phyla (p < 0.05), except for Cyanophyta and Chrysophyta, which were poorly represented in the assemblage. Among morphological groups, nearly all showed significant differences (p < 0.05), except colonies—coenobia. No interaction between sampling methods and the environment was detected (p > 0.05 for all comparisons) (Table 1). Differences among environments were observed for Chlorophyta and Chrysophyta (p < 0.05) and for colonies and silica within the morphological groups (p < 0.05) (Table 1). The Tukey post hoc test revealed that total phytoplankton, Chlorophyta, Euglenophyta, Bacillariophyta, and Cryptophyta had consistently lower densities when samples were taken with the plankton net compared with all other methods (p < 0.05). In Bacillariophyta, the bucket also yielded significantly higher densities than the other methods (p < 0.05). For morphological groups, filaments were more abundant with the bucket than with the plankton net (p = 0.014). The silica group showed lower values with the plankton net relative to all other methods (p < 0.05), whereas the bucket produced higher values than the rest (p < 0.05), except when compared with the wide-mouth bottle (p = 0.05). For unicells and flagellates, significant differences appeared only between the plankton net and the other methods (p < 0.05), again with the net producing lower densities.
The comparison of relative species abundance obtained with each method (SIMPER analysis) demonstrated a total density difference among sampling methods of 75.22% (PERMANOVA F = 6.10 p = 0.001). Differences were obtained among the plankton net method with the rest (p < 0.05 for all of them) and between the bucket with the Van Dorn method and the narrow-mouth method (p = 0.019 and p = 0.0012, respectively). Among species which most contributed to differences detected among sampling methods (69.2% of cumulative percentage relative abundance difference), five were single cells (C. ovata, P. nannoplanctica, M. griffithii, Trachelomonas volvocina (Ehrenberg) Ehrenberg, and Euglena oblonga F. Schmitz), five we from the silica group (Aulacoseira granulata var. angustissima (O.Müller) Simonsen, Aulacoseira granulata (Ehrenberg) Simonsen, Nitzschia acicularis (Kützing) W.Smith, Stephanocyclus meneghinianus (Kützing) Kulikovskiy, Genkal & Kociolek, and Skeletonema potamos (C.I.Weber) Hasle), and one was from a colony (Dinobryon sp.) (Table 2). In addition, an examination of the relative abundance of these dominant species among sampling methods showed that the highest densities were obtained with the bucket in comparison with the other methods. In addition, some tendencies were obtained between wide- and narrow-mouth bottles, with the wide one having a generally higher relative abundance of dominant species registered. The two exceptions were A. granulata and A. granulata var. angustissima (Table 2).

4. Discussion

In this manuscript, I demonstrate that differences among sampling methods of phytoplankton exist in subtropical lowland water ecosystems, and this may affect the estimation of both phytoplankton density estimations and community composition, with implications for biodiversity assessments, ecological interpretations, and monitoring program design. Indeed, most protocols for phytoplankton sampling come from temperate ecosystems and are frequently associated with deep lakes and reservoirs. In this manuscript, I focused on subtropical lowland ecosystems like streams, rivers, and shallow lakes to test the differences among sampling methods. Among the methods evaluated, the bucket consistently yielded higher densities across taxonomic and morphological groups, while the plankton net method resulted in the lowest estimates. These discrepancies highlight methodological biases that should be considered when phytoplankton studies are designed, particularly in regions where phytoplankton research is still developing.
Differences in total phytoplankton density among sampling methods were statistically significant, as were differences in most taxonomic (except Cyanophyta and Chrysophyta) and morphological groups (except colonies—coenobia). These patterns suggest that not all phytoplankton groups are equally susceptible to sampling artifacts. This pattern could indicate a uniform distribution of these groups in a water column, with structural robustness allowing them to be captured similarly across techniques or just having low representation during the study period. Moreover, the analysis revealed that the Chlorophyta, Chrysophyta, colonies—coenobia, and silica groups were more abundant in shallow lakes. These ecological patterns align with their known habitat preferences [16], yet for any group (taxonomic or morphological), they were found to have interaction effects between the sampling method and environment. This means that differences in density estimation among different kinds of environments could be attributed to their ecological preferences rather than to an environment-dependent bias in sampling method efficiency.
Notably, sampling with the plankton net was especially different for total phytoplankton and almost all phytoplankton phyla and morphological groups. In general, this method is used to obtain concentrated phytoplankton samples and serves as a support for species identification, especially those of rare species. However, occasionally, it is used for sampling abundance estimation, especially in oligotrophic environments [34,35]. Nonetheless, several problems could arise when large volumes are filtered or decanted for concentration purposes. These include the adhesion of cells to the surfaces of the collector or partial retention on the filter, particularly when filters are highly porous or samples contain a high load of detritus or inorganic particles blocking the plankton net. This is a pattern that frequently occurs in environments linked to the Paraná River System, where high loads of suspended materials are found [36]. Additionally, organisms smaller than the mesh size of the plankton net (10 µm) may not be retained and therefore could be lost during sampling. Consequently, although the Utermöhl method allows for the identification and counting of species greater than 2 µm (nano- and micro-phytoplankton) using unfiltered samples, algae smaller than 10 µm may not be quantified in this method because they pass through.
In contrast, when working with low volume, unconcentrated samples, such as directly sedimenting a 100 mL aliquot, no intermediate concentration steps are introduced. This approach avoids errors associated with organism loss during handling, although it may result in greater variability if organisms are sparsely distributed in the environment, for example, during algae blooms. Interestingly, if significant losses occur during the concentration process, density estimates from unconcentrated samples may appear higher. Furthermore, some taxa are particularly prone to underestimation due to their fragile or motile nature. Delicate flagellates and filamentous cyanobacteria, for instance, may be disrupted during filtration [37].
Another important source of error with nets arises from incorrect volume calculations. It is essential to ensure that the original filtered volume is accurately recorded and that it corresponds to the actual volume successfully concentrated, as some portion may be lost during filtration. Likewise, the final volume of the concentrate (post-transfer) should be confirmed, as it may be lower than expected. When using the Utermöhl method, calculated densities must be correctly related to the total volume of the sedimentation chamber (e.g., 10 mL) rather than just the volume observed under the microscope.
Contrasting results were obtained when a 10 L bucket was used. With this method, other problems may arise if the sample is not correctly taken. For example, many phytoplankton species can actively move in response to light or other stimuli if the sample in the bucket remains undisturbed for some time. In this scenario, algae might aggregate at the surface or along the sides like, for example, what occurs with Cyanophyta or Dinoflagellate blooms. Moreover, large diatoms or phytoplankton colonies tend to settle at the bottom of the bucket if the sample is not kept well mixed [16,38,39]. In addition, if the subsample is too small, it might not adequately capture the diversity and density of the organisms present, especially if there are rare or large species. In this manuscript, most of these processes were prevented by homogenization of the samples in the bucket before taking a subsample in a plastic bottle. However, a bucket still represents a discrete volume. If phytoplankton are highly heterogeneously distributed in the environment (e.g., in patches), a single bucket sample might capture a high-density or low-density patch and not be representative of the broader area. In this study, phytoplankton, particularly Bacillariophyta, showed statistically significant higher densities with this method in comparison with the others, so a concentration effect probably occurred with this method.
Differences were also observed when samples were taken with the Van Dorn bottle. The first hypothesis to explain this pattern is that with the vertical Van Dorn bottle, phytoplankton could be underestimated, since the sampler takes water out of the photic zone where phytoplankton tend to be distributed. Indeed, here I worked with shallow, turbid ecosystems, and this method could be more useful for environments where there is a stratification of the water column like deep lakes or reservoirs, where the photic zone could include several meters [15,40]. Other possible explanations that could contribute to the underestimation of phytoplankton density when using a vertical Van Dorn bottle include adherence to sampler walls since phytoplankton cells, particularly colonial or filamentous species and those with sticky surfaces like Bacillariophyta, may adhere to the inner walls of the Van Dorn bottle during sampling and retrieval [41,42]. This is more likely with larger bottles or those with rough internal surfaces. If a significant number of these cells remain in the bottle and are not transferred to the sampling bottle, the final density will be underestimated.
Differential sedimentation or buoyancy within the Van Dorn bottle could be another possible explanation. While the Van Dorn bottle is designed to close at a specific depth, samples may remain inside it for some time before transfer. During this period and depending on turbulence or holding time, denser phytoplankton species might begin to settle to the bottom of the bottle, while lighter ones or those with buoyancy mechanisms (like some cyanobacteria) could ascend. Moreover, if the sub-sample bottle is drawn from a specific drain port or in a manner that does not ensure homogeneous mixing prior to transfer, this could lead to an incomplete representation. In this study, despite transfer of the sample was made immediately, incorrect homogenization because of difficult handling of the bottle could lead to high variability and the possibility of a specific subsample being less representative. Moreover, some phytoplankton species are very fragile. The impact of the Van Dorn bottle closing or the turbulence during the transfer process can cause cell lysis or damage, resulting in unquantifiable cells and, consequently, an underestimation of the true density. Finally, although the nominal volume of the Van Dorn bottle is known, there might be slight variations in the exact volume of water collected in each sampling due to factors like retrieval speed or the presence of air bubbles. While considered precise, small, accumulated inaccuracies could influence the results [43,44].
Finally, when comparing the two 120 mL bottles, one with a wide mouth and the other with a narrow mouth, the results showed a trend toward slightly higher density estimates for phytoplankton phyla and morphological groups in the narrow-mouth bottle, although the differences were not statistically significant. Narrow-mouth bottles are often preferred for sample storage and transport, as they minimize evaporation, reduce the risk of contamination or spillage, and limit light and oxygen exposure, which can inhibit post-sampling growth. In contrast, wide-mouth bottles are more convenient for laboratory processing, as they facilitate homogenization and subsampling. Some other considerations regarding both methods need to be addressed, since additional artifacts could affect density estimation in different kinds of environments. This included adherence effects, since in a narrow-mouth bottle, its neck (the narrowest part) presents a smaller surface area for cell adherence per unit of water passing through it during filling and emptying. Indeed, colonial, filamentous, or sticky species can adhere to bottle walls [45]. In addition, water flowing through a more constricted opening (narrow mouth) can create higher shear forces and turbulence at the point of entry. While excessive turbulence can damage delicate cells, a moderate increase in this might reduce the tendency for cells to settle or adhere to the bottle’s internal surfaces (especially the neck) as the sample is collected and subsequently poured out for subsampling.
Conversely, a wider opening might facilitate more laminar flow, potentially leading to increased settling or adherence of cells to the wider opening’s rim or initial internal surfaces [45,46]. If cells adhere to the wide mouth and are not rinsed into the sample, the final density would be underestimated. In a narrow-mouth bottle, the interaction zone between the water sample and the air interface during transfer (pouring) is smaller. This could potentially reduce the loss of very buoyant or very fragile cells that might get trapped in surface tension films or break apart at a wider air–water interface during the transfer process [37]. Other external factors may affect density estimation. For example, a narrow opening inherently provides a smaller portal for external contamination (e.g., particulate sediments) to enter the sample. While this does not directly explain higher density, a “cleaner” sample might allow for more accurate enumeration without confounding particles. Conversely, a wider mouth might allow for more spillage or loss of sample during collection, particularly in choppy conditions or during handling, which would inevitably lead to an underestimation. In this study, no statistically significant differences were obtained when total density, major phyla, and morphological groups were compared. So the selection of containers may reflect a balance between methodological intentions and logistical constraints in both field and laboratory settings. However, depending on environmental conditions and the dominance of specific phytoplankton taxa (e.g., filamentous algae or scum-forming blooming species), differences between both bottle types may become significant. Therefore, it is advisable to conduct preliminary comparisons between both methods in routine samplings to ensure more reliable density estimations.
Finally, species diversity analyses confirmed that method-related differences in species composition were substantial. Above 75% of the observed dissimilarity in relative abundance could be attributed to differences among sampling techniques, particularly between the plankton net and the other methods. Differences appeared significant also between the bucket and the Van Dorn bottle and with the narrow-mouth bottles. This is an interesting result since, in general, we use plankton nets to obtain qualitative information of phytoplankton assemblages. In this study, results indicate that using a bucket could be more useful to represent species presence more than a net, which tends to rapidly collapse in this kind of environment because of sediments.

5. Conclusions

In regions where phytoplankton monitoring is emerging and standardized protocols are still being established, careful consideration of sampling techniques is essential. In this respect, transparency in reporting methodological details in phytoplankton studies is critical for the comparability of datasets across time and space. According to these results, particularly for shallow lakes, streams, and rivers from large lowland river basins, direct sampling with wide- or narrow-mouth bottles are the recommended methods to achieve more reliable and comparable results, but it is recommended to check differences in both methods depending on specific environmental conditions, such as blooming species presence, to secure reliable density estimation. Regarding species richness achievement, in environments with high inorganic turbidity, the use of a bucket could be more dependable to capture a higher number of individuals of each species than a net. Finally, to ensure valid comparisons across study sites, it is crucial to apply the same sampling and processing method consistently throughout the study, even if the absolute precision is not perfect.

Funding

This study was supported by Agencia Santafesina de Ciencia, Tecnología e Innovación (grant IO-2019-206) awarded by D. Frau.

Institutional Review Board Statement

Not applicable.

Data Availability Statement

Data is available upon reasonable request.

Acknowledgments

Thanks are given to E. Creus and N. Gnero for their help during sampling. I also thank the anonymous reviewers who improved this manuscript with their suggestions.

Conflicts of Interest

The author declares no conflict of interests.

References

  1. Salmaso, N.; Tolotti, M. Phytoplankton and anthropogenic changes in pelagic environments. Hydrobiologia 2021, 848, 251–284. [Google Scholar] [CrossRef]
  2. Edwards, K.F.; Litchman, E.; Klausmeier, C.A. Functional traits explain phytoplankton responses to environmental gradients across lakes of the United States. Ecology 2013, 94, 1626–1635. [Google Scholar] [CrossRef] [PubMed]
  3. Naselli Flores, L.; Padisák, J. Analysis of morphological traits as a tool to identify the realized niche of phytoplankton populations: What do the shape of planktic microalgae, Anna Karenina and Vincent van Gogh have in common? Hydrobiologia 2024, 851, 733–749. [Google Scholar] [CrossRef]
  4. Borics, G.; Várbíró, G.; Grigorszky, I.; Krasznai, E.; Szabó, S.; Kiss, K. A new evaluation technique of potamoplankton for the assessment of the ecological status of rivers. Arch. Hydrobiol. 2007, 161, 465–486. [Google Scholar]
  5. Reavie, E.; Jicha, T.; Angradi, T.; Bolgrien, D.; Hill, B. Algal assemblages for large river monitoring: Comparison among biovolume, absolute and relative abundance metrics. Ecol. Indic. 2010, 10, 167–177. [Google Scholar] [CrossRef]
  6. Abonyi, A.; Leitão, M.; Lançon, A.M.; Padisák, J. Phytoplankton functional groups as indicators of human impacts along the River Loire (France). Hydrobiologia 2012, 698, 233–249. [Google Scholar] [CrossRef]
  7. Xie, C.; Hu, C.; Yang, W.; Wu, N.; Liu, Q.; Wei, J.; Wang, C. Phytoplankton species composition as bioindicator in the largest fragmented channel of the Pearl River. China. Environ. Monit. Assess. 2024, 196, 389. [Google Scholar] [CrossRef]
  8. Frau, D.; Gutierrez, M.F.; Regaldo, L.; Saigo, M.; Licursi, M. Plankton community responses in Pampean lowland streams linked to intensive agricultural pollution. Ecol. Indic. 2021, 120, 106934. [Google Scholar] [CrossRef]
  9. Frau, D.; Medrano, J.; Calvi, C.; Giorgi, A. Water quality assessment of a neotropical Pampean lowland stream using a phytoplankton functional trait approach. Environ. Monit. Assess. 2019, 191, 681–695. [Google Scholar] [CrossRef]
  10. Frau, D.; Pineda, A. Phytoplankton Species and Traits Response to a Gradient of Urbanization in Subtropical Lowland Streams. Ecohydrology 2024, 17, e2675. [Google Scholar] [CrossRef]
  11. Huisman, J.M.; Matthijs, H.C.P.; Visser, P.M. Harmful Cyanobacteria; (Aquatic Ecology Series); Springer: Dordrecht, The Netherlands, 2005. [Google Scholar]
  12. Merel, S.; Walker, D.; Chicana, R.; Snyder, S.; Baurès, E.; Thomas, O. State of knowledge and concerns on cyanobacterial blooms and cyanotoxins. Environ. Int. 2013, 59, 303–327. [Google Scholar] [CrossRef]
  13. Drobac, D.; Tokodi, N.; Simeunović, J.; Baltić, V.; Stanić, D.; Svirčev, Z. Human exposure to cyanotoxins and their effects on health. Arch. Industr. Hyg. Toxicol. 2013, 64, 305–316. [Google Scholar] [CrossRef]
  14. Carmichael, W.W.; Boyer, G.L. Health impacts from Cyanobacteria harmful algae blooms: Implications for the North American Great Lakes. Harmful Algae 2016, 54, 194–212. [Google Scholar] [CrossRef]
  15. Wetzel, R.G. Limnology: Lake and River Ecosystems, 3rd ed.; Academic Press: New York, NY, USA, 2001. [Google Scholar]
  16. Reynolds, C.S. The Ecology of Phytoplankton; Cambridge University Press: Cambridge, UK, 2006. [Google Scholar]
  17. CENMA (Centro Nacional de Monitoreo Ambiental). Protocolo Para el Muestreo de Fitoplancton en Cuerpos de Agua Continentales; Ministerio de Ambiente y Desarrollo Sustentable: San Martín, Argentina, 2013. [Google Scholar]
  18. Lorenzen, C.J. Determination of chlorophyll and pheo-pigments: Spectrophotometric equations. Limnol. Oceanogr. 1967, 12, 343–346. [Google Scholar] [CrossRef]
  19. Olenina, I.; Hajdu, S.; Edler, L.; Andersson, A.; Wasmund, N.; Busch, S.; Göbel, J.; Gromisz, S.; Huseby, S.; Huttunen, M.; et al. Biovolumes and size-classes of phytoplankton in the Baltic Sea, HELCOM Baltic Sea Environment Proceedings No. 106; Helsinki Commission: Helsinki, Finland, 2006. [Google Scholar]
  20. Hall, J.A.; Vincent, W.F.; Gibson, J.A.E. Phytoplankton ecology in Antarctic lakes. In Life Under Extreme Conditions; Laybourn-Parry, J., Laybourn, J.D.G., Eds.; Springer: Berlin/Heidelberg, Germany, 1999; pp. 25–42. [Google Scholar]
  21. Padisák, J.; Crossetti, L.O.; Naselli-Flores, L. Use and misuse in the application of the phytoplankton functional classification: A critical review with updates. Hydrobiologia 2009, 621, 1–19. [Google Scholar] [CrossRef]
  22. Hunter-Cevera, K.R.; Neubert, M.G.; Olson, R.J.; Solow, A.R.; Shalapyonok, A. Population ecology of a marine picoplankter: Seasonality and regulation at the edge of chaos. Limnol. Oceanogr. 2016, 61, 753–763. [Google Scholar]
  23. U.S. Environmental Protection Agency (EPA). EPA Method 445.0: In Vitro Determination of Chlorophyll a and Pheophytin a in Marine and Freshwater Algae by Fluorescence; U.S. Environmental Protection Agency: Washington, DC, USA, 2007.
  24. Utermöhl, H. Zur Vervollkommnung der quantitativen Phytoplankton Methodik. Mitt. Int. Ver. Theor. Angew. Limnol. 1958, 9, 1–38. [Google Scholar] [CrossRef]
  25. Venrick, E.L. How many cells to count? In Phytoplankton Manual; Sournia, A., Ed.; UNESCO: Paris, France, 1978. [Google Scholar]
  26. Komárek, J.; Fott, B. Chlorophyceae: Chlorococcales. In Das Phytoplankton des Süsswassers; (Die Binnengewässer 16(5)); Huber-Pestalozzi, G., Ed.; Schweizerbart’sche Verlagsbuchhandlung: Stuttgart, Germany, 1983. [Google Scholar]
  27. Tell, G.; Conforti, V. Euglenophyta Pigmentadas de Argentina; (Bibliotheca Phycologica 75); Gebrüder Borntraeger Verlagsbuchhandlung: Stuttgart, Germany, 1986; pp. 1–301. [Google Scholar]
  28. Krammer, K.; Lange-Bertalot, H. Bacillariophyceae. 3. Teil: Centrales, Fragilariaceae, Eunotiaceae. In Süsswasserflora von Mitteleuropa; Ettl, H., Gerloff, J., Heynig, H., Mollenhauer, D., Eds.; Gustav Fischer Verlag: Stuttgart, Germany, 1991. [Google Scholar]
  29. Zalocar de Domitrovic, Y.; Maidana, N.I. Taxonomic and ecological studies of the Paraná River diatom flora (Argentina). In Bibliotheca Diatomologica; Kociolek, P., Lange-Bertalot, F., Eds.; J. Cramer: Berlin, Germany, 1997. [Google Scholar]
  30. Komárek, J.; Anagnostidis, K. Cyanoprokaryota. Teil 1: Chroococcales. In Süsswasserflora von Mitteleuropa 19/1; Ettl, H., Gärtner, G., Heynig, H., Mollenhauer, D., Eds.; Gustav Fischer Verlag: Jena, Germany, 1998. [Google Scholar]
  31. Komárek, J.; Anagnostidis, K. Cyanoprokaryota. Teil 2: Oscillatoriales. In Süsswasserflora von Mitteleuropa 19/2; Büdel, B., Gärtner, G., Krienitz, L., Schagerl, M., Eds.; Elsevier: Berlin, Germany, 2005. [Google Scholar]
  32. Komárek, J. Cyanoprokaryota. Teil 3: Heterocytous genera. In Süßwasserflora von Mitteleuropa (Freshwater Flora of Central Europe); Gärtner, G., Krienitz, L., Schagerl, M., Eds.; Springer Spektrum: Berlin, Germany, 2013. [Google Scholar]
  33. Hammer, Ø.; Harper, D.A.; Ryan, P.D. PAST Palaeontological Statistics, version 3.18; University of Oslo: Oslo, Norway, 2018.
  34. Upreti, U.; Ram, R.N. Qualitative and Quantitative Estimation of Phytoplankton and their Monsoon-Post Monsoon Fluctuations in Different Water Bodies. Int. J. Curr. Microbiol. App. Sci. 2020, 9, 2662–2669. [Google Scholar] [CrossRef]
  35. Soondur, S.A.; Appadoo, C.; Bhoyroo, V.R.; Joomun, N.; Bhagooli, R. Diversity, density and photo-physiology of micro-phytoplankton from degraded and non-degraded reefs around Rodrigues Island, Western Indian Ocean. Indo Pac. J. Ocean Life 2023, 7, 108–121. [Google Scholar] [CrossRef]
  36. Drago, E.C.E.; Amsler, M.L. Suspended sediment at a cross section of the Middle Paraná River: Concentration, granulometry and influence of the main tributaries. In: Sediment budgets. IAHS Publ. 1988, 174, 381–396. [Google Scholar]
  37. Graham, L.E.; Graham, J.M.; Wilcox, L.W. Algae, 2nd ed.; Benjamin Cummings: Boston, MA, USA, 2009. [Google Scholar]
  38. Bienfang, P.K. Sinking rates of phytoplankton assemblages in Hawaiian waters. J. Exp. Mar. Biol. Ecol. 1981, 54, 69–76. [Google Scholar]
  39. APHA (American Public Health Association). Standard Methods for the Examination of Water and Wastewater, 23rd ed.; American Public Health Association: Washington, DC, USA, 2017. [Google Scholar]
  40. Moss, B. Ecology of Freshwaters: Man and Medium, 3rd ed.; Blackwell Science: New York, NY, USA, 1998. [Google Scholar]
  41. Wetherbee, R.; Perica, D. Mechanisms of motility in algae: Insights from diatom gliding. Protist 1998, 149, 383–393. [Google Scholar]
  42. Flemming, H.C.; Wingender, J. The biofilm matrix. Nat. Rev. Microbiol. 2010, 8, 623–633. [Google Scholar] [CrossRef] [PubMed]
  43. Morsy, F.M. A simple approach to water and plankton sampling for water microbiological and physicochemical characterizations at various depths in aquatic ecosystems. Ann. Limnol. Int. J. Limnol. 2011, 47, 65–71. [Google Scholar] [CrossRef][Green Version]
  44. Raun, M. Improving Estimation of Phytoplankton Abundance and Distribution in Ballast Water Discharges. Doctoral Dissertation, Fachbibliothek TIB Hannover, Gottfried Wilhelm Leibniz Universität Hannover, Hannover, Germany, 2022. [Google Scholar][Green Version]
  45. White, F.M. Fluid Mechanics, 8th ed.; McGraw-Hill Education: New York, NY, USA, 2017. [Google Scholar][Green Version]
  46. Vogel, S. Life in Moving Fluids: The Physical Biology of Flow; Princeton University Press: Princeton, NJ, USA, 1994. [Google Scholar][Green Version]
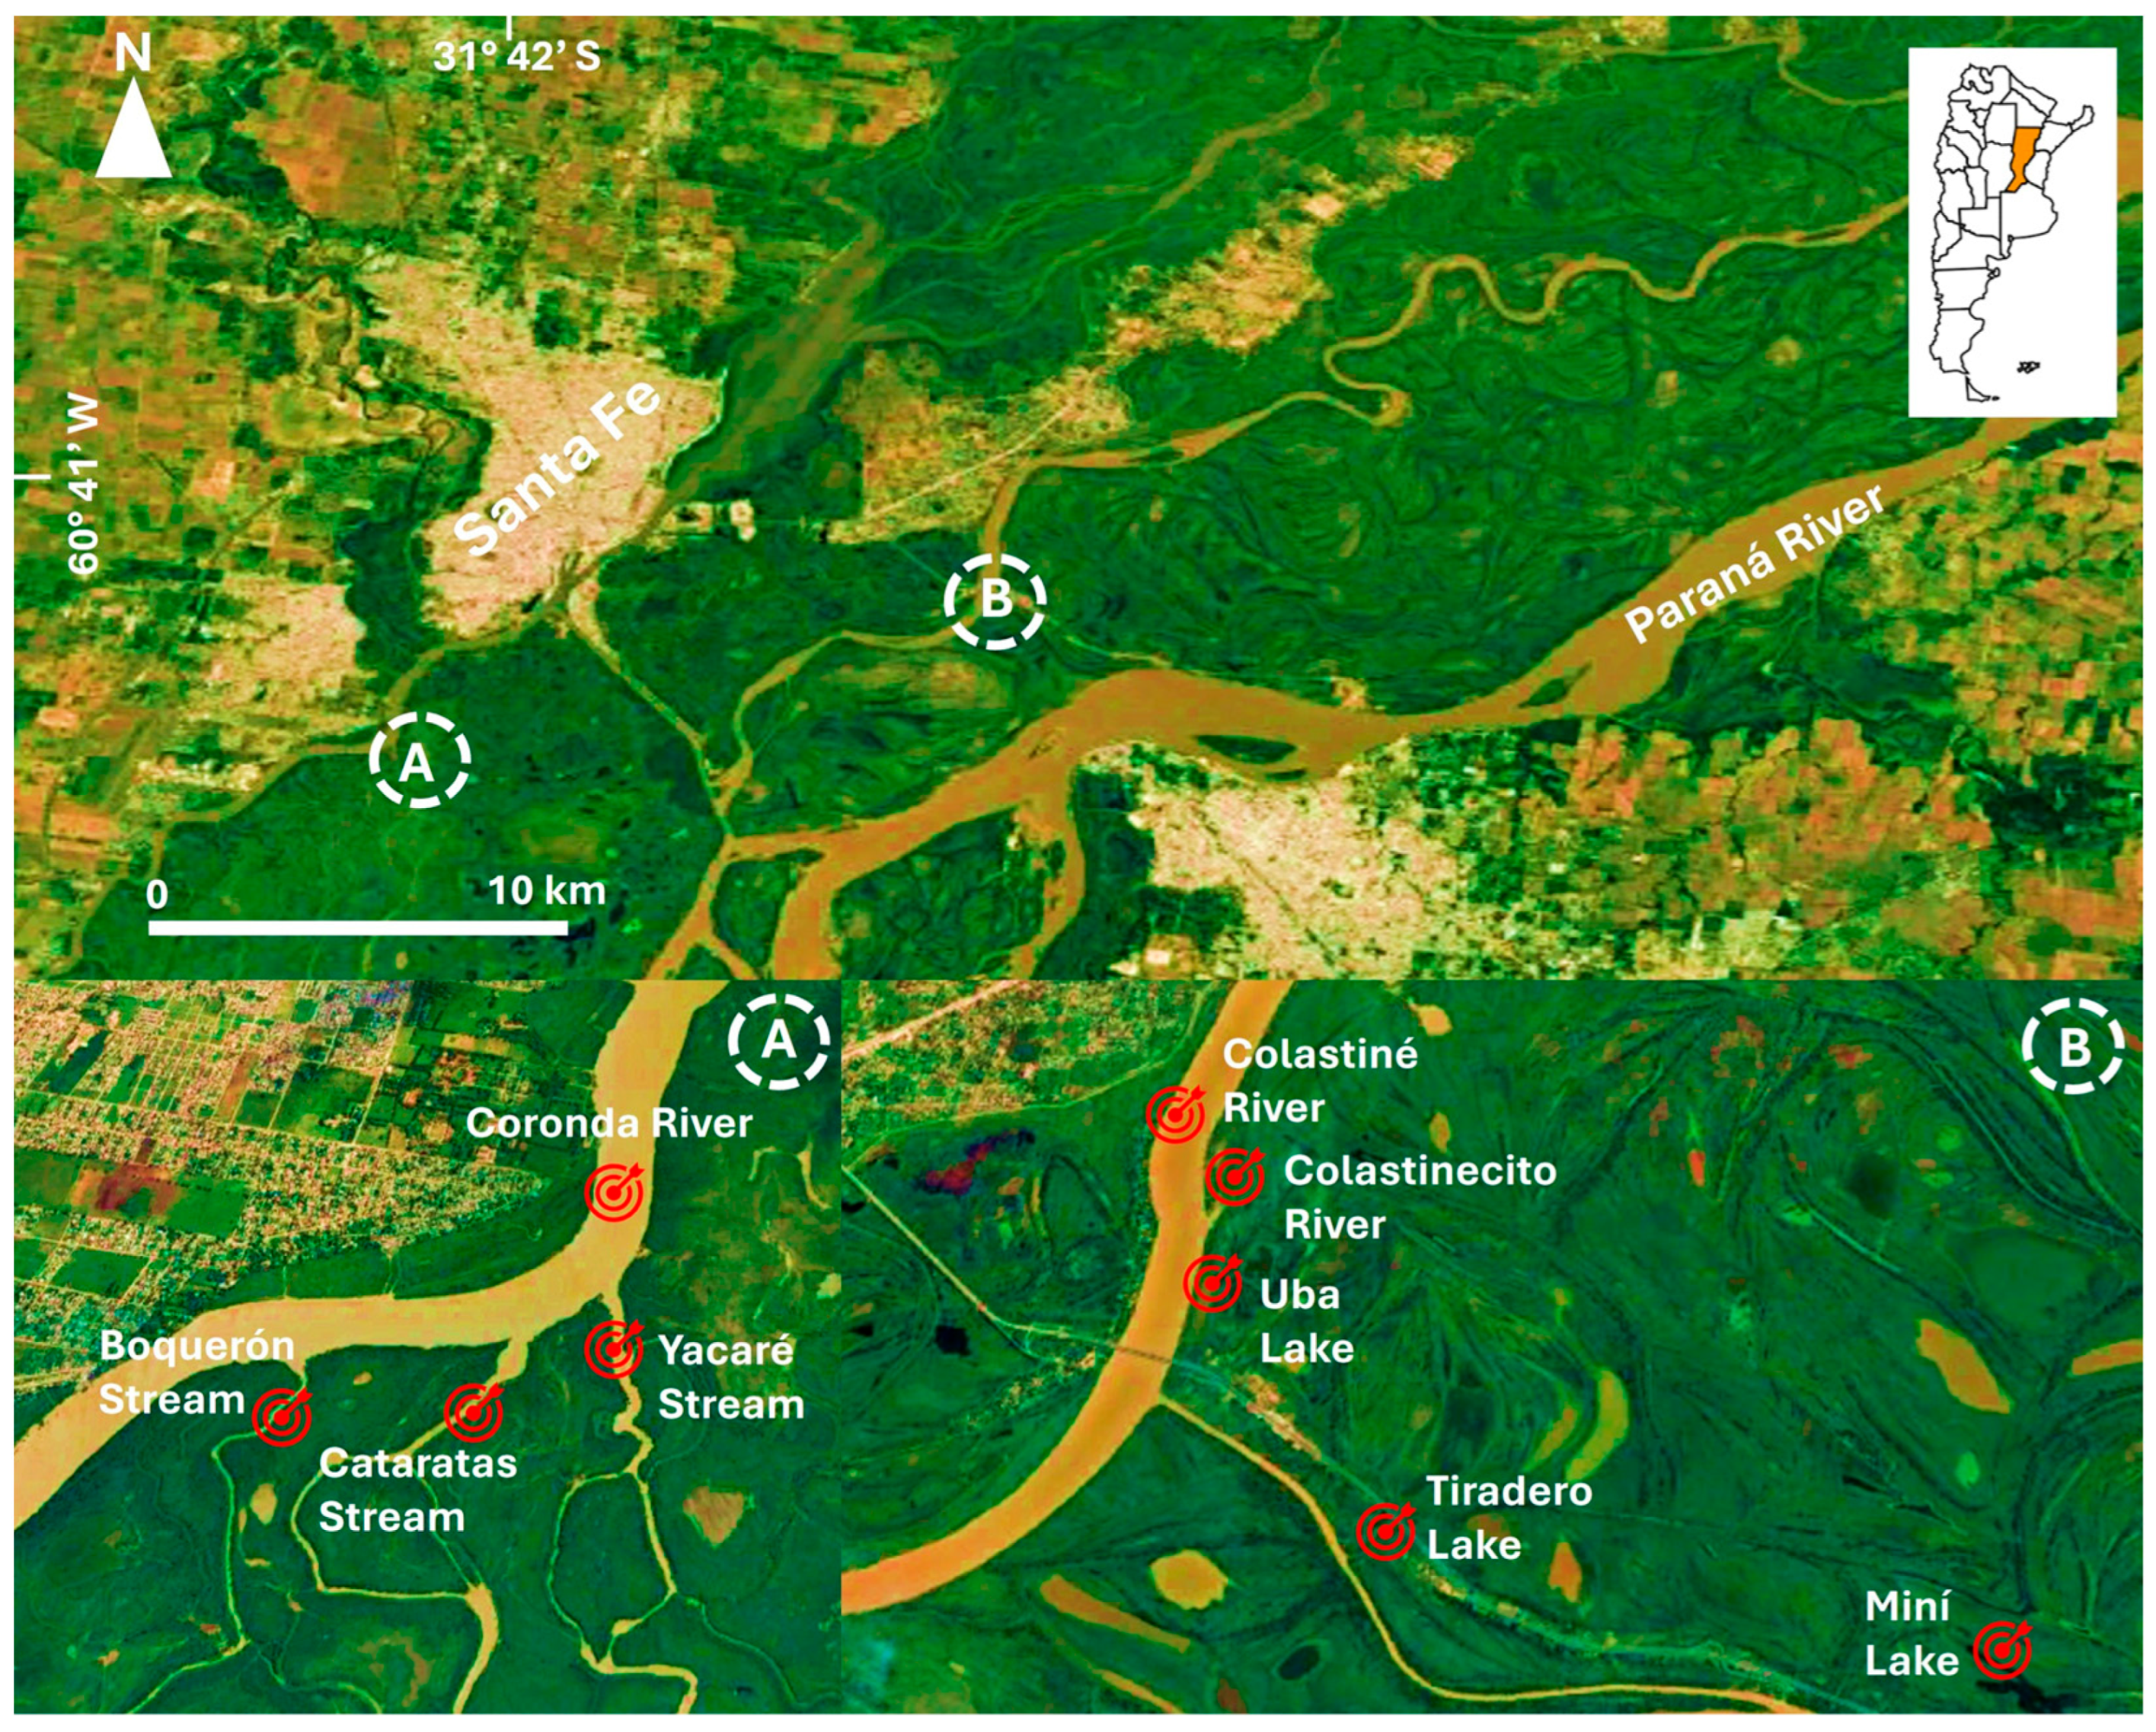
Figure 1. Study area showing the sampling sites. The main image displays the general region where surveys of streams, lagoons, and rivers were conducted. In sets showing enlarged views of specific sampling sites within the study area are indicated in (A,B) parts of the figure. Sampling locations are dictated with red symbols and labeled with their site names.
Limnolrev 25 00045 g001
Figure 2. Relative mean percentage abundance of the dominant species of phytoplankton (>2% of total density) represented among the three types of environments (shallow lakes, streams, and rivers) and the five sampling methods tested (plankton net (PN), Van Dorn bottle (VDB), wide-mouth bottle (WM), narrow-mouth bottle (NM), and the bucket (B)).
Limnolrev 25 00045 g002
Figure 3. Mean total phytoplankton density plus standard deviations registered on each kind of environment (shallow lakes, streams, and rivers) and the five sampling methods tested (plankton net (PN), Van Dorn bottle (VDB), wide-mouth bottle (WM), narrow-mouth bottle (NM), and a bucket (B)).
Limnolrev 25 00045 g003
Figure 4. Mean density values of phytoplankton phyla density registered on each kind of environment (shallow lakes, streams, and rivers) by considering the five sampling methods tested in this study.
Limnolrev 25 00045 g004
Figure 5. Mean density values of phytoplankton group registered on each kind of environment (shallow lakes, streams, and rivers) by considering the five sampling methods tested in this study.
Limnolrev 25 00045 g005
Table 1. Two-way ANOVA results for each phytoplankton phyla and morphological groups. In bold are indicated the statistically significant results (p < 0.05).
Method (M)Environment (E) Interaction (M × E)
CyanophytaF = 1.89 p = 0.13F = 0.01 p = 0.98F = 0.89 p = 0.53
ChlorophytaF = 15.3 p < 0.01F = 3.82 p = 0.03F = 0.52 p = 0.82
EuglenophytaF = 6.48 p < 0.01F = 1.93 p = 0.16F = 0.86 p = 0.55
CryptophytaF = 40.17 p < 0.01F = 1.82 p = 0.17F = 0.21 p = 0.98
BacillariophytaF = 30.33 p < 0.01F = 1.96 p = 0.15F = 0.36 p = 0.93
ChrysophytaF = 1.34 p = 0.27F = 6.16 p < 0.01F = 1.01 p = 0.45
Colonies—coenobiaF = 0.60 p = 0.67F = 6.11 p = 0.02F = 0.27 p = 0.97
FilamentsF = 3.43 p = 0.01F = 0.46 p = 0.63F = 1.16 p = 0.35
SilicaF = 37.84 p < 0.01F = 4.83 p = 0.01F = 0.44 p = 0.88
UnicellF = 14.32 p < 0.01F = 1.83 p = 0.17F = 0.83 p = 0.58
FlagellatesF = 40.8 p < 0.01F = 2.28 p = 0.11F = 0.34 p = 0.94
Total phytoplanktonF = 56.31 p < 0.01F = 2.38 p = 0.10F = 0.49 p = 0.85
Table 2. Similarity distance (SIMPER) results by considering total dissimilitude among sampling methods and the species which contributed to 69.2% of the total accumulative dissimilitude among the sampling methods.
TaxaAv. DissimContrib. %Cumulative %Plankton NetVan DornWide-MouthNarrow-MouthBucket
Cryptomonas ovata19.1125.4125.41125.144.834.433.7
Aulacoseira granulata var. angustissima5.0416.70232.110.3265.785.166.1615.2
Plagioselmis nannoplanctica4.8866.49638.610.1568.269.923.576.72
Aulacoseira granulata3.6884.90343.510.212.343.183.5110.3
Nitzschia acicularis3.4774.62348.140.3022.644.861.1710.6
Dinobryon sp.3.0384.03952.180.3372.184.741.6617.5
Stephanodiscus meneghinianus2.9713.94956.130.1693.192.694.096.66
Monoraphidium griffithii2.9013.85759.980.1933.646.432.157.4
Skeletonema potamos2.5253.35763.340.1491.523.011.675.66
Euglena oblonga2.3823.16766.510.1263.275.731.431.48
Trachelomonas volvocina2.0252.69269.20.2142.452.381.77.16
Disclaimer/Publisher’s Note: The statements, opinions and data contained in all publications are solely those of the individual author(s) and contributor(s) and not of MDPI and/or the editor(s). MDPI and/or the editor(s) disclaim responsibility for any injury to people or property resulting from any ideas, methods, instructions or products referred to in the content.