Article

Stable Isotope Analysis of Planktonic Lower Food Webs of Lakes Erie, Huron, Michigan and Superior

Department of Ecology and Evolutionary Biology, University of Michigan, Ann Arbor, MI 48109, USA
*
Author to whom correspondence should be addressed.
Current address: Geographic Information Science Graduate Certificate, Oregon State University, 1500 SW Jefferson Way, Corvallis, OR 97331, USA.
Limnol. Rev. 2024, 24(4), 506-519; https://doi.org/10.3390/limnolrev24040029
Submission received: 19 September 2024 / Revised: 26 October 2024 / Accepted: 31 October 2024 / Published: 6 November 2024

Abstract

Historical plankton samples from the St. Lawrence Great Lakes were subjected to taxon-specific 15N analysis to test the hypothesis that the changes recorded in zooplankton communities during the 21st Century are related to changes in the trophic positions of large-bodied carnivorous copepods. Daphnia mendotae was used as the reference herbivore for trophic-level comparisons. The results were that Limnocalanus macrurus, Diaptomus (Leptodiaptomus) sicilis as well as the cladoceran Bythotrephes cederstroemi show evidence of elevated carnivory compared to data from the 20th Century. The large diaptomid Diaptomus (Leptodiaptomus) sicilis has a stable isotope signature that is significantly more carnivorous in Lake Superior than in Lakes Michigan and Huron by approximately one-half trophic level. Differences were found in 10 cases out of 15 for Limnocalanus (Huron, Michigan Superior), 6 cases out of 15 for Diaptomus (Huron, Michigan) and in 1 out of 1 for Senecella (Superior). We did not find evidence to support the theory that large-bodied calanoid copepods may have improved their representation in the food webs of the upper Great Lakes by shifting their trophic position downward. Instead, large-bodied Calanoida have increased their trophic positions in parallel with their increased relative abundance. More research is thus needed to explain the driving forces for changing food web dynamics in the Great Lakes.

1. Introduction

The St. Lawrence Great Lakes have a storied history of food web alterations and species invasions, some purposeful and others accidental. These have resulted in demonstrations of both top-down, or predation-driven, changes as well as bottom-up, or nutrient-driven, changes to food web dynamics. In the 1970s a landmark environmental lawsuit pitted the State of Illinois against the City of Milwaukee, Wisconsin in the shadow of nascent U.S. Environmental Protection Agency policy about water quality [1]. Competing theories about the causality of the lake trophic condition were debated in a U.S. District Court and were ultimately adjudicated by the U.S. Supreme Court based on a legal technicality without resolving the actual causality.
More recent species invasions by invertebrate planktivores as well as zebra and quagga mussels in Lakes Huron and Michigan have added further layers of complexity to interpretations of ecosystem dynamics, including the proposition that the upper lakes (Huron, Michigan and Superior) are now converging on similar lower food webs among all three [2]. Adding to the historical debates about biota-driven alterations is the recognition that climate change can exert powerful effects on these ecosystems [3], thus compounding the challenges for the forensic scientific investigation of food web dynamics.
The crustacean zooplankton communities of the Great Lakes have been changing in the 21st Century [4,5,6,7,8,9,10,11]. In Lakes Huron and Michigan, the non-predatory cladoceran as well as the cyclopoid copepod biomass have decreased [10]. The mechanisms underlying these changes are hypothesized to be a decline in phytoplankton abundance associated with the oligotrophication of Lakes Huron and Michigan and increased invertebrate planktivory [6,8,9]. The changes have been accompanied by an increased representation of Limnocalanus macrurus and reported declines in total zooplankton biomass. Moreover, the reported biomass of L. macrurus was likely underestimated by a factor of two [12,13].
Not only are lower food webs converging toward one another in the upper lakes, but some studies suggest that the trophic positions of some species have been shifting based on stable isotope analysis [14]. Jackson et al. [15] reported that both L. macrurus and large-bodied diaptomid species in Lake Huron appeared to have reduced their trophic position from the 1990s to 2009 based on reduced δ 15N enrichment compared to primary herbivores by more than 1‰. The data from 2009, however, were based on a single opportunistic sample obtained from the North Channel, whereas the data from the 1990s came from stations in the main basin.
A variation in δ15N with the trophic level is diagnostic of the relative trophic position among organisms that depend on the same primary source of organic matter [16]. Carnivores are isotopically heavier than herbivores, which in turn are isotopically heavier than primary producers. Omnivores are isotopically intermediate between herbivores and carnivores. The differences result from the kinetic fractionation of nitrogen isotopes. Ammonotelic organisms preferentially metabolize and excrete 14N faster than 15N, which leads to the differential retention of 15N with respect to an organism’s food source. An increase in δ15N values of about 3.4‰ indicates a separation between trophic levels based on laboratory studies [17]. Trophic fractionation (Δδ15N across trophic levels) can vary by taxon, habitat, and diet. By using a recognized herbivore such as Daphnia as a reference baseline, the error variance in the trophic position can be reduced to ±0.20‰ [18].
This study was undertaken specifically to test the theory that zooplankton trophic positions are shifting within the Great Lakes, using multiple recent (collected after 2009) samples from the main basin of Lake Huron. Additionally, we performed similar analyses to test for possible changes in the trophic position of representative zooplankton taxa in Lakes Michigan and Superior, using a decades-long archive of zooplankton collected from the 1980s to the 2000s. Lastly, we assessed historical zooplankton data from Lake Erie for comparison with the upper lakes.

2. Materials and Methods

2.1. Comparison of Live and Preserved Zooplankton

To evaluate the suitability of formalin-preserved animals for stable isotope analyses, live zooplankton were collected from Baseline Lake, MI, USA (43.425 N, 83.895 W) by vertical net tows on 20 and 28 June 2017. The lake was one of the first sites for the application of egg ratio analysis to calculate birth and death rates in the study of population dynamics of Daphnia and Leptodora [19]. The samples were transported to the laboratory within 2 h of collection. On 20 June, the live sample was immediately concentrated on Nitex netting, and individuals of D. pulicaria and L. kindti were picked by watchmaker forceps and placed in tared tin capsules, with five replicates of 40 Daphnia or 10 Leptodora per capsule. The samples were dried for 72 h at 55 °C, reweighed, and prepared for stable C and N isotope analysis. Additionally, residual Leptodora from the live sample were resuspended in lake water and then preserved with 5% sucrose formalin. After 72 h, those preserved animals were rinsed in reverse osmosis water and treated for stable isotope analysis in identical fashion to the live samples.
On 28 June, the live sample was split into two equal subsamples. One subsample was preserved with 5% sucrose-formalin and was set aside. The other (live) subsample was concentrated on Nitex netting from which five replicates of 20 D. pulicaria and five replicates of 10 L. kindti were picked by watchmaker forceps, followed by being treated as on 20 June. After 72 h, the formalin-preserved animals were rinsed in reverse osmosis water. Five replicates of 20 D. pulicaria and five replicates of 10 L. kindti were picked by watchmaker forceps and then treated the same as the live samples.
The samples were submitted to the Laboratory for Biotechnology and Bioanalysis at Washington State University, Pullman, WA, USA for C and N isotope analysis. As our results will demonstrate, 15N data proved suitable but 13C data did not. Further results were confined to nitrogen isotopes alone.

2.2. Analysis of Plankton Samples from the Great Lakes

All Great Lakes zooplankton samples were collected by 1 m diameter Puget Sound closing nets of 130 µm net apertures while the vessel lay at anchor. The samples were processed and analyzed identically with the methods used by [
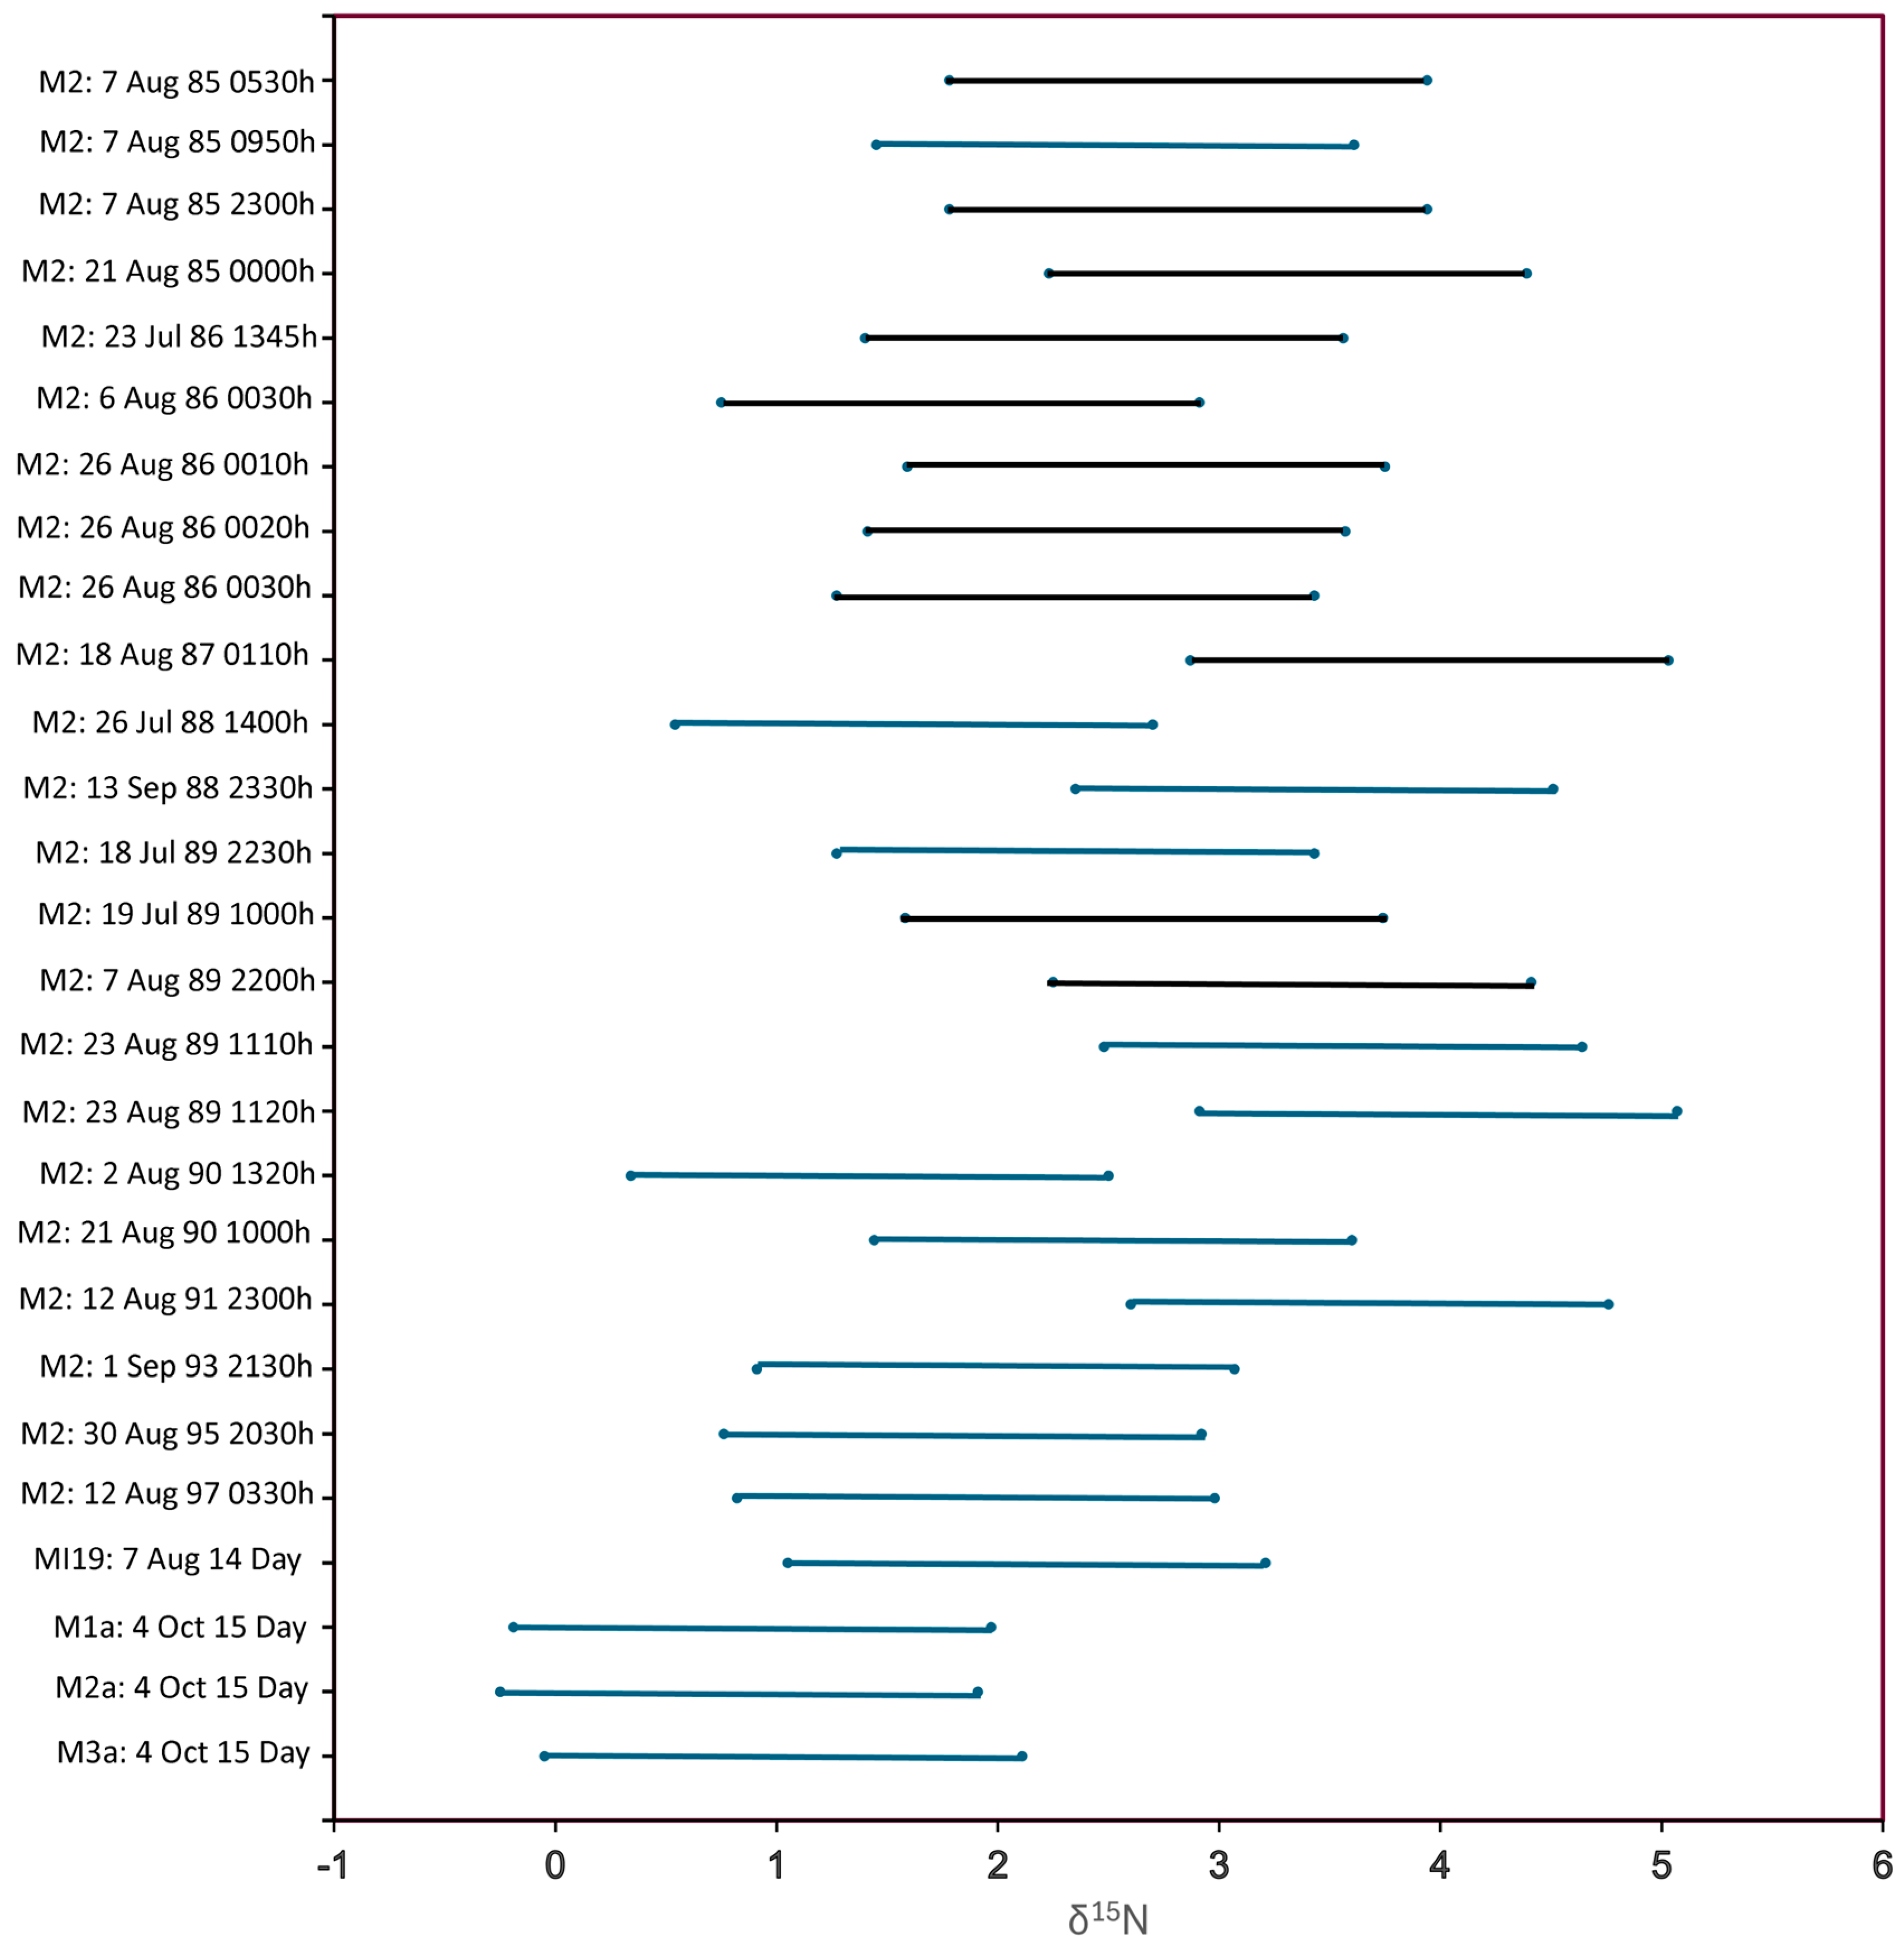
16]. We assembled a multi-year (1985 to 1997) time series of analyses for D. mendotae from a single reference station in southern Lake Michigan (Station M2: 43.000 N, 86.667 W, 100 m station depth) and examined the sample means for evidence of variation with time of day or long-term temporal trends. We supplemented this reference time series with additional samples of opportunity collected in 2009, 2013, 2014 and 2015 at other sites in Lakes Huron, Michigan and Superior.
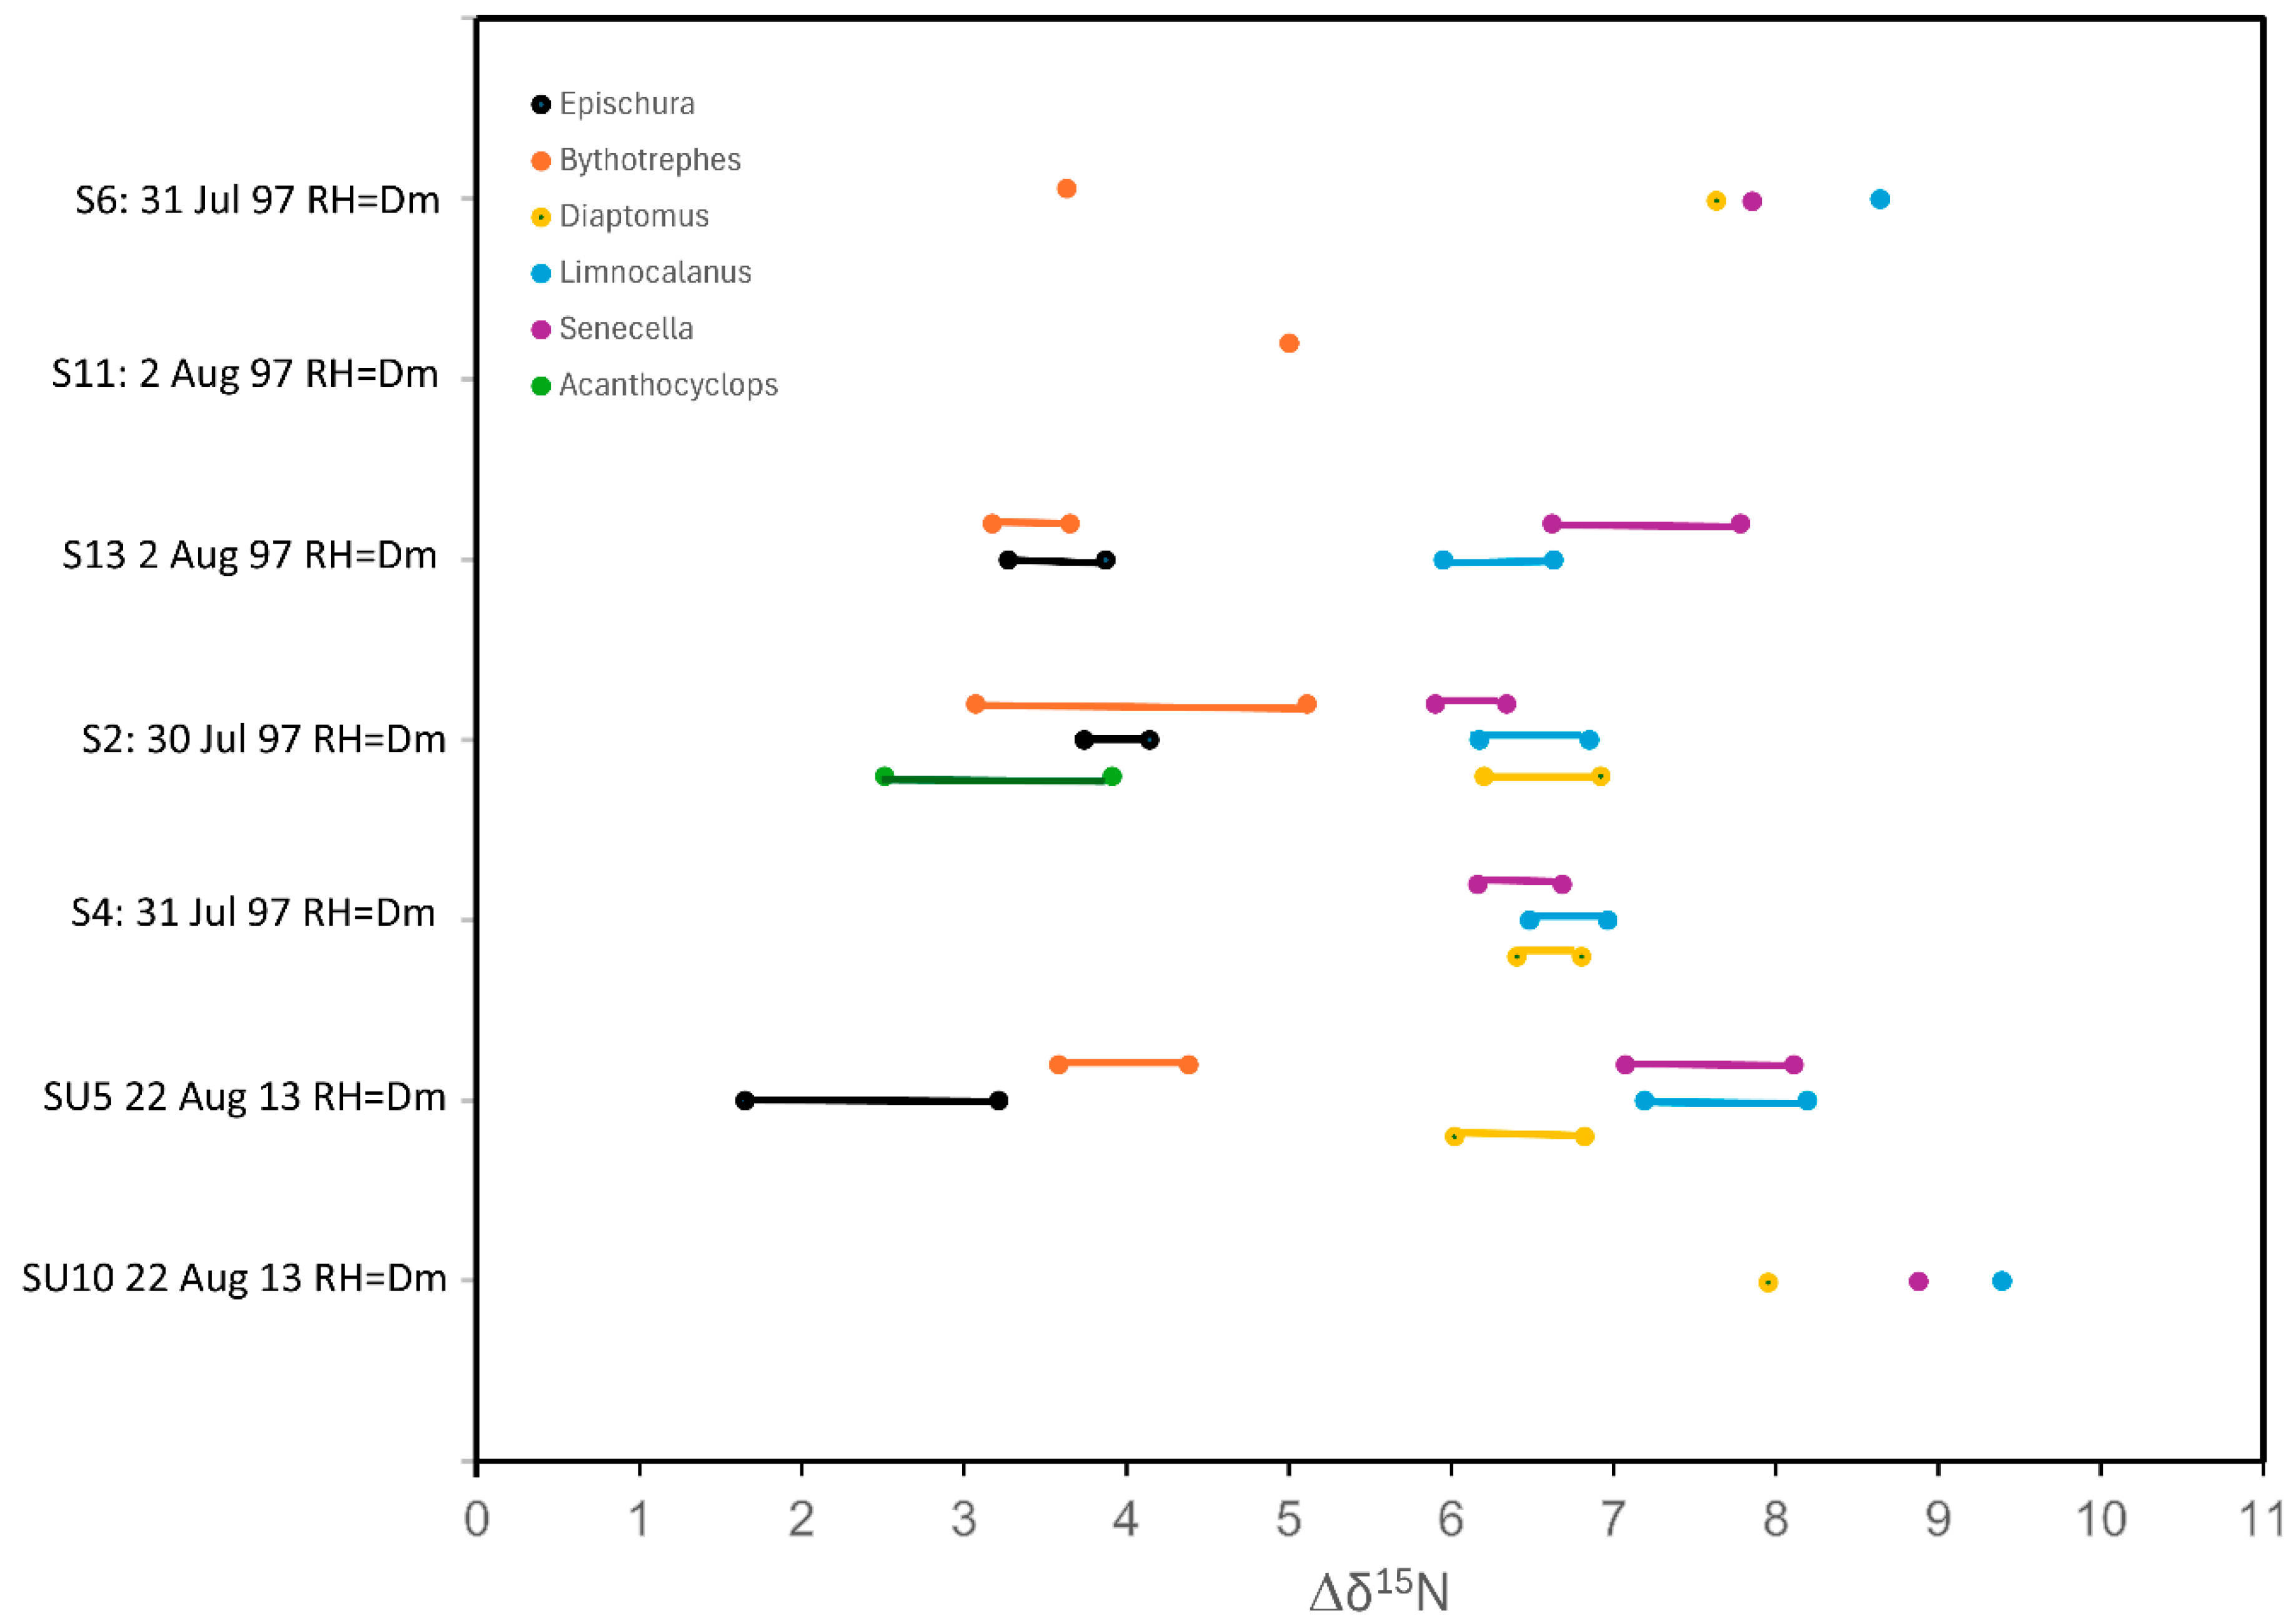
Our preferred reference herbivore was Daphnia mendotae, but we also measured D. pulicaria, D. retrocurva and the non-daphnids Bosmina longirostris, Holopedium gibberum and veliger larvae. For trophic-level comparisons, we used mainly Epischura lacustris, Diaptomus (syn. Leptodiaptomus) sicilis, Bythotrephes cederstroemi and Limnocalanus macrurus plus occasional occurrences of Senecella calanoides, Acanthocyclops vernalis, Mesocyclops edax, Polyphemus pediculus, Cercopagis pengoi, Leptodora kindti and Mysis relicta.
In addition to stable isotopes, we quantified the mean dry mass and %N of our samples. We quantified the variability typical of the data to help judge the likely ecological significance of any statistical tests. When large numbers of comparisons are based on relatively small numbers of replicates, there is always a possibility of spurious conclusions. Standard deviations (SDs) or coefficients of variation (CVs: SD/mean) among replicate determinations were ln-transformed, and single factor analysis of variance (AOV) was applied to determine whether there were statistically significant differences among SDs or CVs based on two, three or four replicates. We next tested for an a priori expected negative correlation between CVs or SDs and the number of animals that were pooled to produce each replicate analysis across the observed range of pool sizes from 2 to 500.
We quantified the diurnal variability observed on 7 August 85 at three separate sampling times and compared it with the temporal variability observed across the full time series exclusive of 7 August 85. The mean values observed at each date and sampling time were ln-transformed prior to statistical comparisons. We also examined whether differences might exist among daphnid taxa drawn from different vertical strata on the same date and time. We used samples collected by the Puget Sound closing net (Research Nets, Inc., Bellevue, WA, USA) from 15–0 m, 40–15 m and 90–40 m shortly after midnight on 26 August 1986.
We continued the practice adopted by [16] of using D. mendotae as the preferred reference herbivore for imputing trophic-level comparisons whenever possible.
We next performed a statistical power analysis to define our criteria for ascribing ecological significance to statistically significant analytical differences between replicated samples. We established a balance between Type I and Type II errors by setting α = 0.1 and β = 0.75. The object was to hold Type I errors reasonably low, while seeking a credible level of power to detect environmental differences if they indeed exist.
We estimated generic thresholds for ecologically significant differences between sample means (ΔX) as
ΔX = σ(Zα − Zβ)/ √n
where Zα and Zβ are values of the standard normal cumulative distribution under the specified power assumptions (1.28 and −0.67, respectively), σ is the standard deviation of the distribution of the variable being investigated and n is the sample size. For σ, we used the 90th percentile values for the SD of δ15N (Table 1) to ensure that the variance would be well constrained and conservatively overestimated in most cases. For comparisons made between samples with three replicates each (85% of the cases), the mean differences between samples for δ15N would have to exceed 0.54‰ to be regarded as statistically significant according to our power criteria. We reasoned that, otherwise, statistical vagaries stemming from small sample sizes and large numbers of comparisons could produce spurious instances of presumed statistical significance.
For calculating lower and upper 95% confidence limits of SDs, we used conventional Excel™ functions:
Lower limit = SD × SQRT((n − 1)/CHIINV((0.05/2), n − 1))
Upper limit = SD × SQRT((n − 1)/CHIINV(1 − (0.05/2), n − 1))
For comparisons of trophic position among taxa across years and lakes, we subtracted the mean δ15N of the putative herbivore, usually D. mendotae, from the δ15N of each replicate alternative taxon, e.g., L. macrurus, to produce a Δδ15N statistic following the method of [15]. The Δδ15N values were compared by one-way AOV followed by post hoc Tukey’s Honestly Significant Difference (HSD) test.
Geographic coordinates and station depths as well as all the original Great Lakes data used in this paper are included in a Supplemental Data File. Station locations are illustrated in Figure 1. Additional data have been deposited in an open access dataset as part of the University of Michigan Deep Blue data archive project [20].

3. Results

3.1. Comparison of Live and Preserved Zooplankton

We found differences in C and N isotope responses when comparing live and preserved zooplankton samples collected on 20 and 28 June 2017 from Baseline Lake, MI. The results of two-sample t-tests revealed that C isotope data from formalin-preserved samples were not representative of the live samples. The live versus preserved Leptodora from 20 June differed in %C (p = 0.0007), C:N ratio (p = 0.0002) and δ13C (p = 0.0004). The live versus preserved samples from 28 June differed in %C for Daphnia (p = 0.015) but not for Leptodora (p = 0.60). However, the C:N ratios differed for both Daphnia (p = 0.014) and Leptodora (p = 0.0002), and the δ13C differed for both Daphnia (p = 0.0095) and Leptodora (p = 0.0002) as well.
In contrast, δ15N did not differ between live and preserved samples. The live versus preserved Leptodora collected on 20 June were not significantly different (p = 0.13) in δ15N. Likewise, the Daphnia and Leptodora collected on 28 June did not differ between live and preserved samples (p = 0.28 and p = 0.08, respectively). The %N content did not differ significantly for Leptodora on 20 June (p = 0.07) or 28 June (p = 0.27) or for Daphnia on 28 June (p = 0.49).
The standard errors of the mean (SE = SD/√n) compared to the mean differences revealed that the difference in δ15N between Leptodora and Daphnia was 3.808‰ (SE = 0.053) on 20 June but only 1.952‰ (SE = 0.174) for live samples and 2.258 ‰ (SE = 0.069) for preserved samples on 28 Jun, which were not significantly different from each other (p > 0.1).
Based on these experiments we rejected the idea of using any carbon data from our archival Great Lakes formalin-preserved samples and restricted our analysis to N isotope data.

3.2. Analysis of Plankton Samples from the Great Lakes

After finding no differences (p > 0.1) among %N CVs calculated for two, three, or four replicates, grand means and associated statistics were calculated for the CVs (Table 1). For isotope data (δ15N), ln-transformed SDs were compared directly, and similarly, there were no statistically significant differences detected based on the number of replicates (p > 0.1), so grand means and associated statistics were calculated for the full dataset (Table 1).
For %N, the Pearson product-moment correlation coefficients (R) of CV against the number of animals pooled for each analytical sample were not significantly different from zero (R = −0.01). For δ15N, there was a small but statistically significant negative correlation between SD among the replicates and the number of animals pooled to produce each replicate (R = −0.23, p < 0.001, one-tailed test), which accounted for less than 5% of the variability. We ascribe the bulk of the measured variation among the replicate samples to random errors associated with sample preparation and instrument analysis.

3.2.1. Variations with Time of Day and Date

None of the variables reported in Table 2 displayed any pattern or trend with time of day or date (linear regressions, p > 0.1). Specifically, tests for a pattern with time of day for µgDW/ind produced r2 = 0.025, and for δ15N, they produced r2 = 0.0002. Tests for a pattern with date (1985–1997) for µgDW/ind produced r2 = 0.036, and for δ15N, they produced r2 = 0.11. There was, nonetheless, strong heterogeneity in the data overall based on one-way AOV for 15N (p < 0.0001).
Although the numerical SD values for the full time series are greater than the SD values observed on 7 August 85 (n = 3), the 95% CI values for SD overlap so broadly that we cannot conclude that the variability observed over the years for D. mendotae is necessarily any greater than might be observed in a single day at a single site (Figure 2).

3.2.2. Variations Among Sympatric Herbivores

The next question was whether there were significant differences among sympatric putative herbivores. Table 3 reports isotope data for three Daphnia species in Lake Michigan. In samples from 7 August 1985, when Daphnia species were abundant enough to obtain isotope signatures from all three, D. pulicaria measured nearly 1‰ δ15N less positive than D. mendotae, more than the threshold (0.54‰) we identified with our statistical power analysis; for D. retrocurva, δ15N was about 0.2‰ less than that of D. mendotae, which was less than the identified threshold. D. pulicaria did not appear in samples from later years, but in 1991, D. mendotae and D. retrocurva were indistinguishable with respect to 15N at one nearshore station (M1), but D. retrocurva had 0.81‰ (SE = 0.09‰) elevated 15N content compared to D. mendotae at nearshore station M4. The same was true of specimens collected in Lake Erie on 20 June 1995: D. retrocurva had δ15N = 0.87‰ (SE = 0.13) elevated above D. mendotae.
If sympatric daphnid species differed significantly from D. mendotae in 15N content, the general pattern was that D. pulicaria was more negative, meaning less 15N content, and D. retrocurva tended to deviate in the positive direction, meaning slightly elevated 15N content.
Near contemporaneous samples revealed significantly higher 15N content in D. mendotae from nearshore sites than offshore sites (Table 4), suggesting that the differences may trace to the seston they were consuming [14].
In comparisons between D. mendotae and other sympatric non-daphnid putative herbivores (Table 5), the results were not as consistent as were comparisons among Daphnia species. Holopedium tended to be more enriched in 15N than D. mendotae (six of seven cases) in Lakes Superior and Huron. In a sample from Lake Michigan on 7 August 2014 in which D. mendotae co-occurred with Bosmina longirostris and dreissenid veligers, the three taxa were indistinguishable from each other based on our power analysis criteria.

3.2.3. Differences Between Herbivores and Other Zooplankton Taxa

We next examined the differences in the isotope composition of herbivores, using D. mendotae whenever possible, and other members of the zooplankton community. The results for Lakes Erie (Table 6), Huron (Figure 3 and Supplemental Data Table S3), Michigan (Figure 4 and Supplemental Table S4) and Superior (Figure 5 and Supplemental Data Table S5) all revealed highly significant differences (Δδ15N) between putative herbivores and other taxa with Δδ15N values approaching 10‰, or three trophic levels, in some cases.
Zooplankton collections from the North Channel (NC3) and Georgian Bay (GB3) of Lake Huron in 2009 did not contain enough D. mendotae to obtain stable isotope samples, so Holopedium was used instead. However, comparing the δ15N of Holopedium with the δ15N of D. mendotae from the main body of Lake Huron that same year (Table 7), the Holopedium were significantly enriched with 15N (t-test p = 0.003) by 1.57‰ on average. Consequently, those two stations were removed from the further analysis of trophic positions among sympatric taxa.

3.2.4. Comparisons with Lake Erie

We were able to compare the trophic positions of three taxa, Bythotrephes, Epischura and Limnocalanus, from Lake Erie in 1995 with the same taxa in Lakes Huron, Michigan and Superior during the 1990s. Bythotrephes was not significantly different from any of the upper lakes except Michigan in 1995 (p = 0.001), but only by 0.57‰, barely more than our threshold value of 0.54‰. Similarly, Epischura from Lake Erie were no different from the three upper lakes in any year except Michigan in 1997 (p = 0.015), when the Lake Erie animals were 1.51‰ richer in 15N than those of Lake Michigan. The trophic position of Limnocalanus from Lake Erie differed only from that of Lake Michigan in 1993 (p = 0.02) and 1995 (p = 0.001), with animals from Lake Michigan being richer in 15N by 2.00‰ and 2.88‰, respectively.

3.2.5. Comparisons Between 20th and 21st Centuries

We applied one-way AOV to Δδ15N values of individual taxa in Lakes Huron, Michigan and Superior (Figure 3, Figure 4 and Figure 5) during two time periods: the 1990s, including 1989, and the 2000s. For Epischura, there were no significant differences among the lakes in the 1990s (p = 0.26) or the 2000s (p = 0.33), nor were there any significant differences among lakes for Bythotrephes, Limnocalanus and Senecella (p > 0.3 in all cases). Diaptomus sicilis proved to be an exception. There were strong differences among the lakes both in the 1990s (p = 0.0003) and in the 2000s (p = 0.0007). Tukey HSD comparisons revealed that Michigan and Huron were indistinguishable in the 1990s, but both were significantly different from Lake Superior (p < 0.01). In the 2000s, there were significant differences among all three lakes (p < 0.05 in all pairwise comparisons).
Finally, we tested the hypothesis that omnivores and predators in the upper Great Lakes have shifted in trophic positions from the late 20th Century to the early 21st Century (Table 8). The trophic position of Bythotrephes remained consistent in Lakes Michigan and Superior, as well as in four of six comparisons for Lake Huron. In the two cases where significant differences emerged, the δ15N of Bythotrephes increased by slightly more than 1‰. Epischura reduced its trophic position with respect to D. mendotae in Lake Superior and in three cases out of eight in Lake Michigan but increased in two cases out of six in Lake Huron. In contrast, when changes were statistically significant, Diaptomus sicilis, Limnocalanus and Senecella all showed consistent increases in the trophic position with respect to D. mendotae in the upper lakes, with one exception (1995 vs. 2014 for Limnocalanus in Lake Michigan).

4. Discussion

Our results (Table 8) are inconsistent with the theory that large calanoid copepods may have improved their representation in the food webs of the upper Great Lakes by shifting their trophic position downward. In contrast, they show evidence of elevated carnivory. In light of the evidence displayed in Table 7, our original hypothesis [15] resulted from using Holopedium rather than Daphnia mendotae as the reference putative herbivore for zooplankton collections in the North Channel of Lake Huron in 2009.
We examined the isotope composition of sympatric Daphnia species as well as those of sympatric non-daphnids (Table 3 and Table 5), recognizing that species-specific differences might exist based on the ingestion of non-algal protists from a common seston pool. Our results demonstrate that such differences can indeed occur, particularly for the cases of Daphnia and Holopedium. For this reason, we elected to use D. mendotae as our reference putative herbivore whenever its abundance made that possible. Previous work had demonstrated that using a single, consistent reference herbivore improves the precision of inferences about trophic position [18]. Other than our few analyses of Mysis, all the taxa we examined are holoplanktonic and therefore ultimately dependent on the local suspended seston pool. The seston composition can vary spatially, and those differences can be reflected in the isotope composition of the reference putative herbivore, as Table 4 demonstrates. We recognize that predators likely feed on multiple herbivores and omnivores. That diet breadth combined with the evidence of Table 3 and Table 5 may introduce additional uncertainty in the trophic positions deduced from isotope fractionations. In the absence of certainty about quantitative diet composition, we chose to keep our reference herbivore species as consistent as possible in order to provide a baseline for future investigations.
The study most immediately relevant to ours was based on eight sampling dates between June and October 2011 and six sampling dates between May and November 2012 at an offshore site in Lake Michigan near Milwaukee, WI [14]. They reported that the mean δ15N of D. mendotae was 3.4‰ enriched with respect to epilimnetic seston, and like us, they used D. mendotae as a representative herbivore to identify trophic positions. They did not measure other daphnids nor Holopedium, but they found no significant differences between D. mendotae and B. longirostris. Like us (Figure 3), they found Epischura to occupy the trophic position of the omnivore, but unlike us, they placed Bythotrephes as an omnivore as well. All our samples from Lake Michigan except for those for 19 July 89 registered Bythotrephes as a carnivore, which is consistent with its well-known feeding behavior. They likewise reported that the nitrogen isotope content placed Leptodiaptomus at the same trophic position as other known carnivores and that Limnocalanus was a full trophic level above it.
There was consistent evidence, with only one exception, that both Bythotrephes and Limnocalanus increased their trophic position by increased carnivory from the 1990s to the 2000s. Diaptomus sicilis likewise increased its trophic level, but the most striking finding about the species was that it was far more carnivorous, by almost one-half trophic level, in Lake Superior compared with Lakes Huron and Michigan in both time periods. Most if not all Diaptomidae are herbivorous in their juvenile stages, but omnivory can appear in the copepodid stages [14], and D. sicilis is known to prey on veligers [21]. All of the copepods we analyzed in this study were C6 adults, so evidence of carnivory is unsurprising.
Small but consistent differences in trophic level signatures existed among the daphnids D. pulicaria, D. mendotae and D. retrocurva, with D. pulicaria being slightly less enriched and D. retrocurva being slightly more enriched in 15N than D. mendotae. Holopedium gibberum in sympatry with D. mendotae was consistently more enriched in 15N by sometimes more than 1‰, confirming that Holopedium is not a strict herbivore [22], possibly by including ciliates in its diet.
Particularly notable in this study were the elevated trophic positions recorded for D. sicilis, Limnocalanus and Senecella from the 20th to 21st Centuries. These changes parallel the increased relative abundance of large-bodied zooplankton in the Upper Lakes [4,5,6,7,8,9,10,11]. The reason why an elevated trophic level position is correlated with an increased relative abundance of large-bodied Calanoida in the food webs of the upper Great Lakes, however, remains unresolved by this study but continues to be worthy of investigation.

Supplementary Materials

The following supporting information can be downloaded at: https://www.mdpi.com/article/10.3390/limnolrev24040029/s1, Supplemental_Data.xlsx.

Author Contributions

Conceptualization, formal analysis, data curation, writing—original draft preparation, project administration, funding acquisition, resources, J.T.L.; methodology, investigation, writing—review and editing, S.B. All authors have read and agreed to the published version of the manuscript.

Funding

This research was supported by a series of grants to J.T. Lehman from the U.S. National Science Foundation Biological Oceanography Program and by a Michigan Sea Grant during the 1980s and 1990s. The samples from the 2000s were obtained from sampling vessels of opportunity provided by the U.S. EPA and USGS Fish and Wildlife. The retrospective analyses performed in this publication were funded by the University of Michigan Office of the Provost.

Data Availability Statement

The data are contained within this article and in Supplementary Materials.

Acknowledgments

Elliot Jackson collected plankton samples in 2013 and 2014. Nicholas Gezon collected plankton samples in 2015.

Conflicts of Interest

The authors declare no conflicts of interest. The funders had no role in the design of the study, in the collection, analyses or interpretation of data, in the writing of the manuscript or in the decision to publish the results.

References

  1. Mortimer, C.H. The Lake Michigan Pollution Case; University of Wisconsin Sea Grant Institute and Center for Great Lakes Studies: Madison, WI, USA, 1981; WIS-SG-81-237. [Google Scholar]
  2. Barbiero, R.P.; Lesht, B.M.; Warren, G.J. Convergence of trophic state and the lower food web in Lakes Huron, Michigan, and Superior. J. Great Lakes Res. 2012, 38, 368–380. [Google Scholar] [CrossRef]
  3. Lehman, J.T. Mixing patterns and plankton biomass of the St. Lawrence Great Lakes under climate change scenarios. J. Great Lakes Res. 2002, 28, 583–596. [Google Scholar] [CrossRef]
  4. Barbiero, R.P.; Rudstam, L.G.; Watkins, J.M.; Lesht, B.M. A cross-lake comparison of crustacean zooplankton communities in the Laurentian Great Lakes, 1997–2016. J. Great Lakes Res. 2019, 45, 672–690. [Google Scholar] [CrossRef]
  5. Bunnell, D.B.; Barbiero, R.P.; Ludsin, S.A.; Madenjian, C.P.; Warren, G.J.; Dolan, D.M.; Brenden, T.O.; Briland, R.; Gorman, O.T.; He, J.X.; et al. Changing ecosystem dynamics in the Laurentian Great Lakes: Bottom-Up and Top-Down regulation. Bioscience 2014, 64, 26–39. [Google Scholar] [CrossRef]
  6. Pothoven, S.A.; Vanderploeg, H.A. Variable changes in zooplankton phenology associated with the disappearance of the spring phytoplankton bloom in Lake Michigan. Freshw. Biol. 2021, 67, 365–377. [Google Scholar] [CrossRef]
  7. Pothoven, S.A.; Fahnenstiel, G.L. Spatial and temporal trends in zooplankton assemblages along a nearshore to offshore transect in southeastern Lake Michigan from 2007 to 2012. J. Great Lakes Res. 2014, 41, 95–103. [Google Scholar] [CrossRef]
  8. Bunnell, D.B.; Keeler, K.M.; Puchala, E.A.; Davis, B.M.; Pothoven, S.A. Comparing seasonal dynamics of the Lake Huron zooplankton community between 1983–1984 and 2007 and revisiting the impact of Bythotrephes planktivory. J. Great Lakes Res. 2012, 38, 451–462. [Google Scholar] [CrossRef]
  9. Barbiero, R.P.; Bunnell, D.B.; Rockwell, D.C.; Tuchman, M.L. Recent increases in the large glacial-relict calanoid Limnocalanus macrurus in Lake Michigan. J. Great Lakes Res. 2009, 35, 285–292. [Google Scholar] [CrossRef]
  10. Barbiero, R.P.; Balcer, M.; Rockwell, D.C.; Tuchman, M.L. Recent shifts in the crustacean zooplankton community of Lake Huron. Can. J. Fish. Aquat. Sci. 2009, 66, 816–828. [Google Scholar] [CrossRef]
  11. Bunnell, D.B.; Davis, B.M.; Warner, D.M.; Chriscinske, M.A.; Roseman, E.F. Planktivory in the changing Lake Huron zooplankton community: Bythotrephes consumption exceeds that of Mysis and fish. Freshw. Biol. 2011, 56, 1281–1296. [Google Scholar] [CrossRef]
  12. Doubek, J.P.; Lehman, J.T. Historical biomass of Limnocalanus in Lake Michigan. J. Great Lakes Res. 2011, 37, 159–164. [Google Scholar] [CrossRef]
  13. Burgess, S.; Jackson, E.W.; Schwarzman, L.; Gezon, N.; Lehman, J.T. Improved estimates of calanoid copepod biomass in the St. Lawrence Great Lakes. J. Great Lakes Res. 2015, 41, 484–491. [Google Scholar] [CrossRef]
  14. Driscoll, Z.G.; Bootsma, H.A.; Christiansen, E. Zooplankton trophic structure in Lake Michigan as revealed by stable carbon and nitrogen Isotopes. J. Great Lakes Res. 2015, 41, 104–114. [Google Scholar] [CrossRef]
  15. Jackson, E.W.; Doubek, J.P.; Schaeffer, J.S.; Lehman, J.T. Historical and recent biomass and food web relations of Limnocalanus in Lake Huron. J. Great Lakes Res. 2013, 39, 404–408. [Google Scholar] [CrossRef]
  16. Lajtha, K.; Michener, R.H. (Eds.) Stable Isotopes in Ecology and Environmental Science; Blackwell: Oxford, UK, 1994. [Google Scholar]
  17. Minawaga, M.; Wada, E. Stepwise enrichment of 15N along food chains: Further evidence and the relation between δ15 N and animal age. Geochim. Cosmochim. Acta 1984, 48, 1135–1140. [Google Scholar] [CrossRef]
  18. Vander Zanden, M.J.; Rasmussen, J.B. Variation in δ15N and δ13C trophic fractionation: Implications for aquatic food web studies. Limnol. Oceanogr. 2001, 46, 2061–2066. [Google Scholar] [CrossRef]
  19. Hall, D.J. An experimental approach to the dynamics of a natural population of Daphnia galeata mendotae. Ecology 1964, 45, 94–112. [Google Scholar] [CrossRef]
  20. Lehman, J.T. St. Lawrence Great Lakes Dataset [Data Set]; University of Michigan—Deep Blue Data: Ann Arbor, MI, USA, 2024. [Google Scholar] [CrossRef]
  21. Liebig, J.R.; Vanderploeg, H.A. Vulnerability of Dreissena polymorpha larvae to predation by Great Lakes calanoid copepods: The importance of the bivalve shell. J. Great Lakes Res. 1995, 21, 353–358. [Google Scholar] [CrossRef]
  22. Balcer, B.D.; Korda, N.L.; Dodson, S.I. Zooplankton of the Great Lakes; The University of Wisconsin Press: Madison, WI, USA, 1984; pp. 57–58. [Google Scholar]
Figure 1. Locations of sampling stations referenced in this report.
Limnolrev 24 00029 g001
Figure 2. Isotope composition of Daphnia mendotae collected by vertical net tows from offshore southern Lake Michigan (M2, 100 m depth) from 1985 to 1997, from USEPA sampling station MI19 (92 m depth) in 2014 and from stations M1a, M2a and M3a (66 m depth) in 2015. Shown are the mean ±0.54‰.
Limnolrev 24 00029 g002
Figure 3. Lake Huron: Differences in 15N content (Δδ15N) of the specified taxa from that of the reference herbivore (RH) from the corresponding station and date. Dm = Daphnia mendotae, Hg = Holopedium gibberum. Shown are means ±2SE.
Limnolrev 24 00029 g003
Figure 4. Lake Michigan: As in Figure 2; Bl = Bosmina longirostris.
Limnolrev 24 00029 g004
Figure 5. Lake Superior: As in Figure 2.
Limnolrev 24 00029 g005
Table 1. Characteristic variability among replicates for elemental and isotope analyses.
MeasurementMetricMean (SE)nRange90th Percentile
%NCV0.048 (0.004)2180.001–0.4980.106
δ15NSD0.213 (0.013)2190.000–1.1140.481
Table 2. Standard deviations (SD) of ln-transformed mean δ15N observed diurnally on 7 August 85 compared to the full multi-year time series in Table 1, excluding 7 August 85.
Time PeriodAnalyteSD95% CI of SD
7 August 85δ15N0.0710.037–2.796
1985 to 2015δ15N0.3310.245–0.793
Table 3. Isotope composition of sympatric Daphnia species collected by vertical net tows from a Lake Michigan reference station (M2, 100 m depth), from two nearshore stations (M1 and M4, 20 m depth) and from western Lake Erie (E3, 20 m depth). Values of Δδ15N that exceeded our threshold criterion of ± 0.54‰ are printed in bold.
Date Staz (m)TaxonnμgDW/ind (SE)δ15N (SE)Δδ15N (SE)
7 August 85 (0530 h)M210–0D. mendotae312.6 (0.3)2.86 (0.03)
D. pulicaria317.9 (0.4)1.92 (0.01)−0.95 (0.04)
D. retrocurva14.82.73−0.14
7 August 85 (2300 h)M210–0D. mendotae316.5 (0.5)2.86 (0.03)
D. pulicaria357.7 (1.5)2.04 (0.01)−0.82 (0.03)
D. retrocurva34.3 (0.6)2.63 (0.07)−0.23 (0.08)
26 August 86M215–0D. mendotae39.5 (0.2)2.67 (0.03)
D. pulicaria333.7 (1.7)2.82 (0.06)0.15 (0.07)
D. retrocurva33.3 (0.04)3.57 (0.10)0.90 (0.10)
26 August 86M240–15D. mendotae311.4 (0.5)2.49 (0.09)
D. pulicaria237.0 (4.1)2.17 (0.21)−0.32 (0.23)
26 August 86M290–40D. mendotae27.5 (1.2)2.35 (0.05)
D. pulicaria320.1 (5.3)2.05 (0.16)−0.30 (0.18)
D. retrocurva17.62.12−0.23
12 August 91M115–0D. mendotae310.4 (1.1)6.09 (0.12)
D. retrocurva34.1 (0.3)6.29 (0.03)0.20 (0.13)
13 August 91M415–0D. mendotae35.1 (1.4)5.80 (0.07)
D. retrocurva32.0 (0.1)6.61 (0.06)0.81 (0.09)
20 June 95E315–0D. mendotae312.0 (0.1)4.62 (0.10)
D. retrocurva39.2 (0.3)5.49 (0.07)0.87 (0.13)
Table 4. Isotope composition of Daphnia mendotae collected by vertical net tows through the entire water column from two offshore Lake Michigan stations and two nearshore stations.
DateStaLat (N)Long (W)z (m)nμgDW/ind (SE)δ15N (SE)
12 August 91M243.00086.667100310.2 (0.9)3.68 (0.14)
13 August 91M343.66787.000165312.3 (0.2)3.20 (0.03)
12 August 91M143.00086.27220310.4 (1.1)6.09 (0.12)
13 August 91M443.66786.5552035.1 (1.4)5.80 (0.07)
Table 5. Isotope composition of Daphnia mendotae and sympatric non-daphnid presumptive herbivores in Lakes Superior, Huron and Michigan.
DateStaLat (N)Long (W)TaxonnμgDW/ind (SE)δ15N (SE)Δδ15N (SE)
2 August 97S1146.91587.843Daphnia17.3−3.44
Holopedium19.2−2.371.07
2 August 97S1347.19087.843Daphnia39.5 (2.4)−2.07 (0.12)
Holopedium213.3 (1.8)−1.41 (0.15)0.66 (0.19)
30 July 97S246.66784.867Daphnia36.4 (0.7)−2.01 (0.10)
Holopedium35.6 (0.3)−1.55 (0.08)0.46 (0.13)
31 July 97S445.93885.003Daphnia35.9 (0.2)−1.78 (0.07)
Holopedium34.6 (0.6)−1.26 (0.07)0.52 (0.10)
22 August 13SU546.77586.556Daphnia215.8 (2.2)−1.76 (0.20)
Holopedium327.9 (2.3)−2.34 (0.08)−0.58 (0.21)
22 August 13SU1047.51487.546Daphnia16.9−2.59
Holopedium221.5 (1.5)−0.75 (0.08)1.83
9 October 09MW245.74584.180Daphnia313.3 (2.9)2.17 (0.16)
Holopedium324.7 (8.4)3.74 (0.19)1.57 (0.25)
7 August 14MI1942.73386.583Daphnia38.8 (2.8)2.13 (0.06)
Bosmina32.6 (0.2)2.37 (0.02)0.24 (0.06)
veligers30.83 (0.03)2.20 (0.06)0.07 (0.08)
Table 6. Isotope composition of presumptive primary herbivores and sympatric taxa in Lake Erie (E3, 20 m depth) collected by vertical net tows (15–0 m) in 1995.
DateStaTaxonnμgDW/ind (SE)δ15N (SE)Δδ15N (SE)
20 June 95E3D. mendotae312.0 (0.1)4.62 (0.10)
Epischura39.8 (0.8)8.72 (0.13)4.10 (0.16)
Bythotrephes469.8 (19.0)8.12 (0.06)3.50 (0.12)
Limnocalanus325.0 (1.5)11.09 (0.04)6.46 (0.11)
Mesocyclops35.7 (0.2)10.68 (0.09)6.05 (0.14)
Table 7. Isotope composition of Daphnia mendotae and Holopedium gibberum from a station in Lake Huron (MW2: 45.745 N, 84.180 W, 42 m depth) collected by a vertical net tow on 9 October 2009.
TaxonnµgDW/ind δ15N
Daphnia8011.42.07
Daphnia8018.92.49
Daphnia809.61.96
Holopedium6036.13.46
Holopedium6029.84.10
Holopedium608.33.65
Table 8. Tukey’s HSD pairwise comparisons of δ15N in taxa measured in the 20th Century versus the 21st Century. ns = no significant difference. The magnitudes and directions of statistically significant changes in the 15N content are reported as Δδ15N (‰).
LakeYearsBythotrephesEpischuraDiaptomusLimnocalanusSenecella
pΔδ15NpΔδ15NpΔδ15NpΔδ15NpΔδ15N
Huron1993 vs. 2009ns ns ns ns
1995 vs. 2009ns 0.0011.51ns 0.0071.97
1997 vs. 20090.0011.14ns ns ns
1993 vs. 2013ns ns 0.0011.180.0391.28
1995 vs. 20130.0011.090.0010.990.0010.930.0011.92
1997 vs. 2013ns ns ns ns
Michigan1989 vs. 2014ns ns 0.0011.850.0011.42
1993 vs. 2014ns ns ns ns
1995 vs. 2014ns 0.001−1.96ns 0.002−1.03
1997 vs. 2014ns ns ns 0.0011.72
1989 vs. 2015ns ns 0.0012.620.0013.05
1993 vs. 2015ns 0.02−0.710.020.610.0011.48
1995 vs. 2015ns 0.001−1.94ns ns
1997 vs. 2015ns ns 0.0011.190.0013.35
Superior1997 vs. 2013ns 0.001−1.33ns 0.0061.670.0021.37
Disclaimer/Publisher’s Note: The statements, opinions and data contained in all publications are solely those of the individual author(s) and contributor(s) and not of MDPI and/or the editor(s). MDPI and/or the editor(s) disclaim responsibility for any injury to people or property resulting from any ideas, methods, instructions or products referred to in the content.

