
Diagnosis of the Condition of Aquatic Ecosystems Using a Partial Assessment of Ecological and Trophic States: An Example of Small Lakes in Northern Poland


Abstract
1. Introduction
2. Methods
- (a)
- Class 1—adverse transformation or development of the shoreline zone, involving permanent soil sealing, restricting water infiltration (recreational centers, dense holiday and residential construction, industrial facilities, urbanized areas, asphalt road running along the shoreline);
- (b)
- Class 2—transformation or development of the shores allowing for the preservation of a relatively natural hydrological regime, characterized by permanent but not eliminating changes in the morphological structure of the shores (farmlands, beaches, scattered holiday and residential construction, hardened road along the shoreline, forests, and green areas, including fallow lands separated from the lake by a hardened surface road);
- (c)
- Class 3—sections resembling natural ones with artificially disrupted continuity of macrophytes (meadows and fallow lands, as well as forests with a macrophyte zone, where continuity is interrupted by paths and fishing piers);
- (d)
- Natural shoreline (Class 4–5)—meadows and fallow lands, as well as forests, with both imperceptible and visibly preserved continuity of the macrophyte zone.
- N—number of all individuals in the sample,
- ni, nj—number of individuals of the i-th and j-th taxa.
- M—number of taxa in one sample
- k = 1 for nM; k = 2 for nM−1; …; k = M − 1 for n1
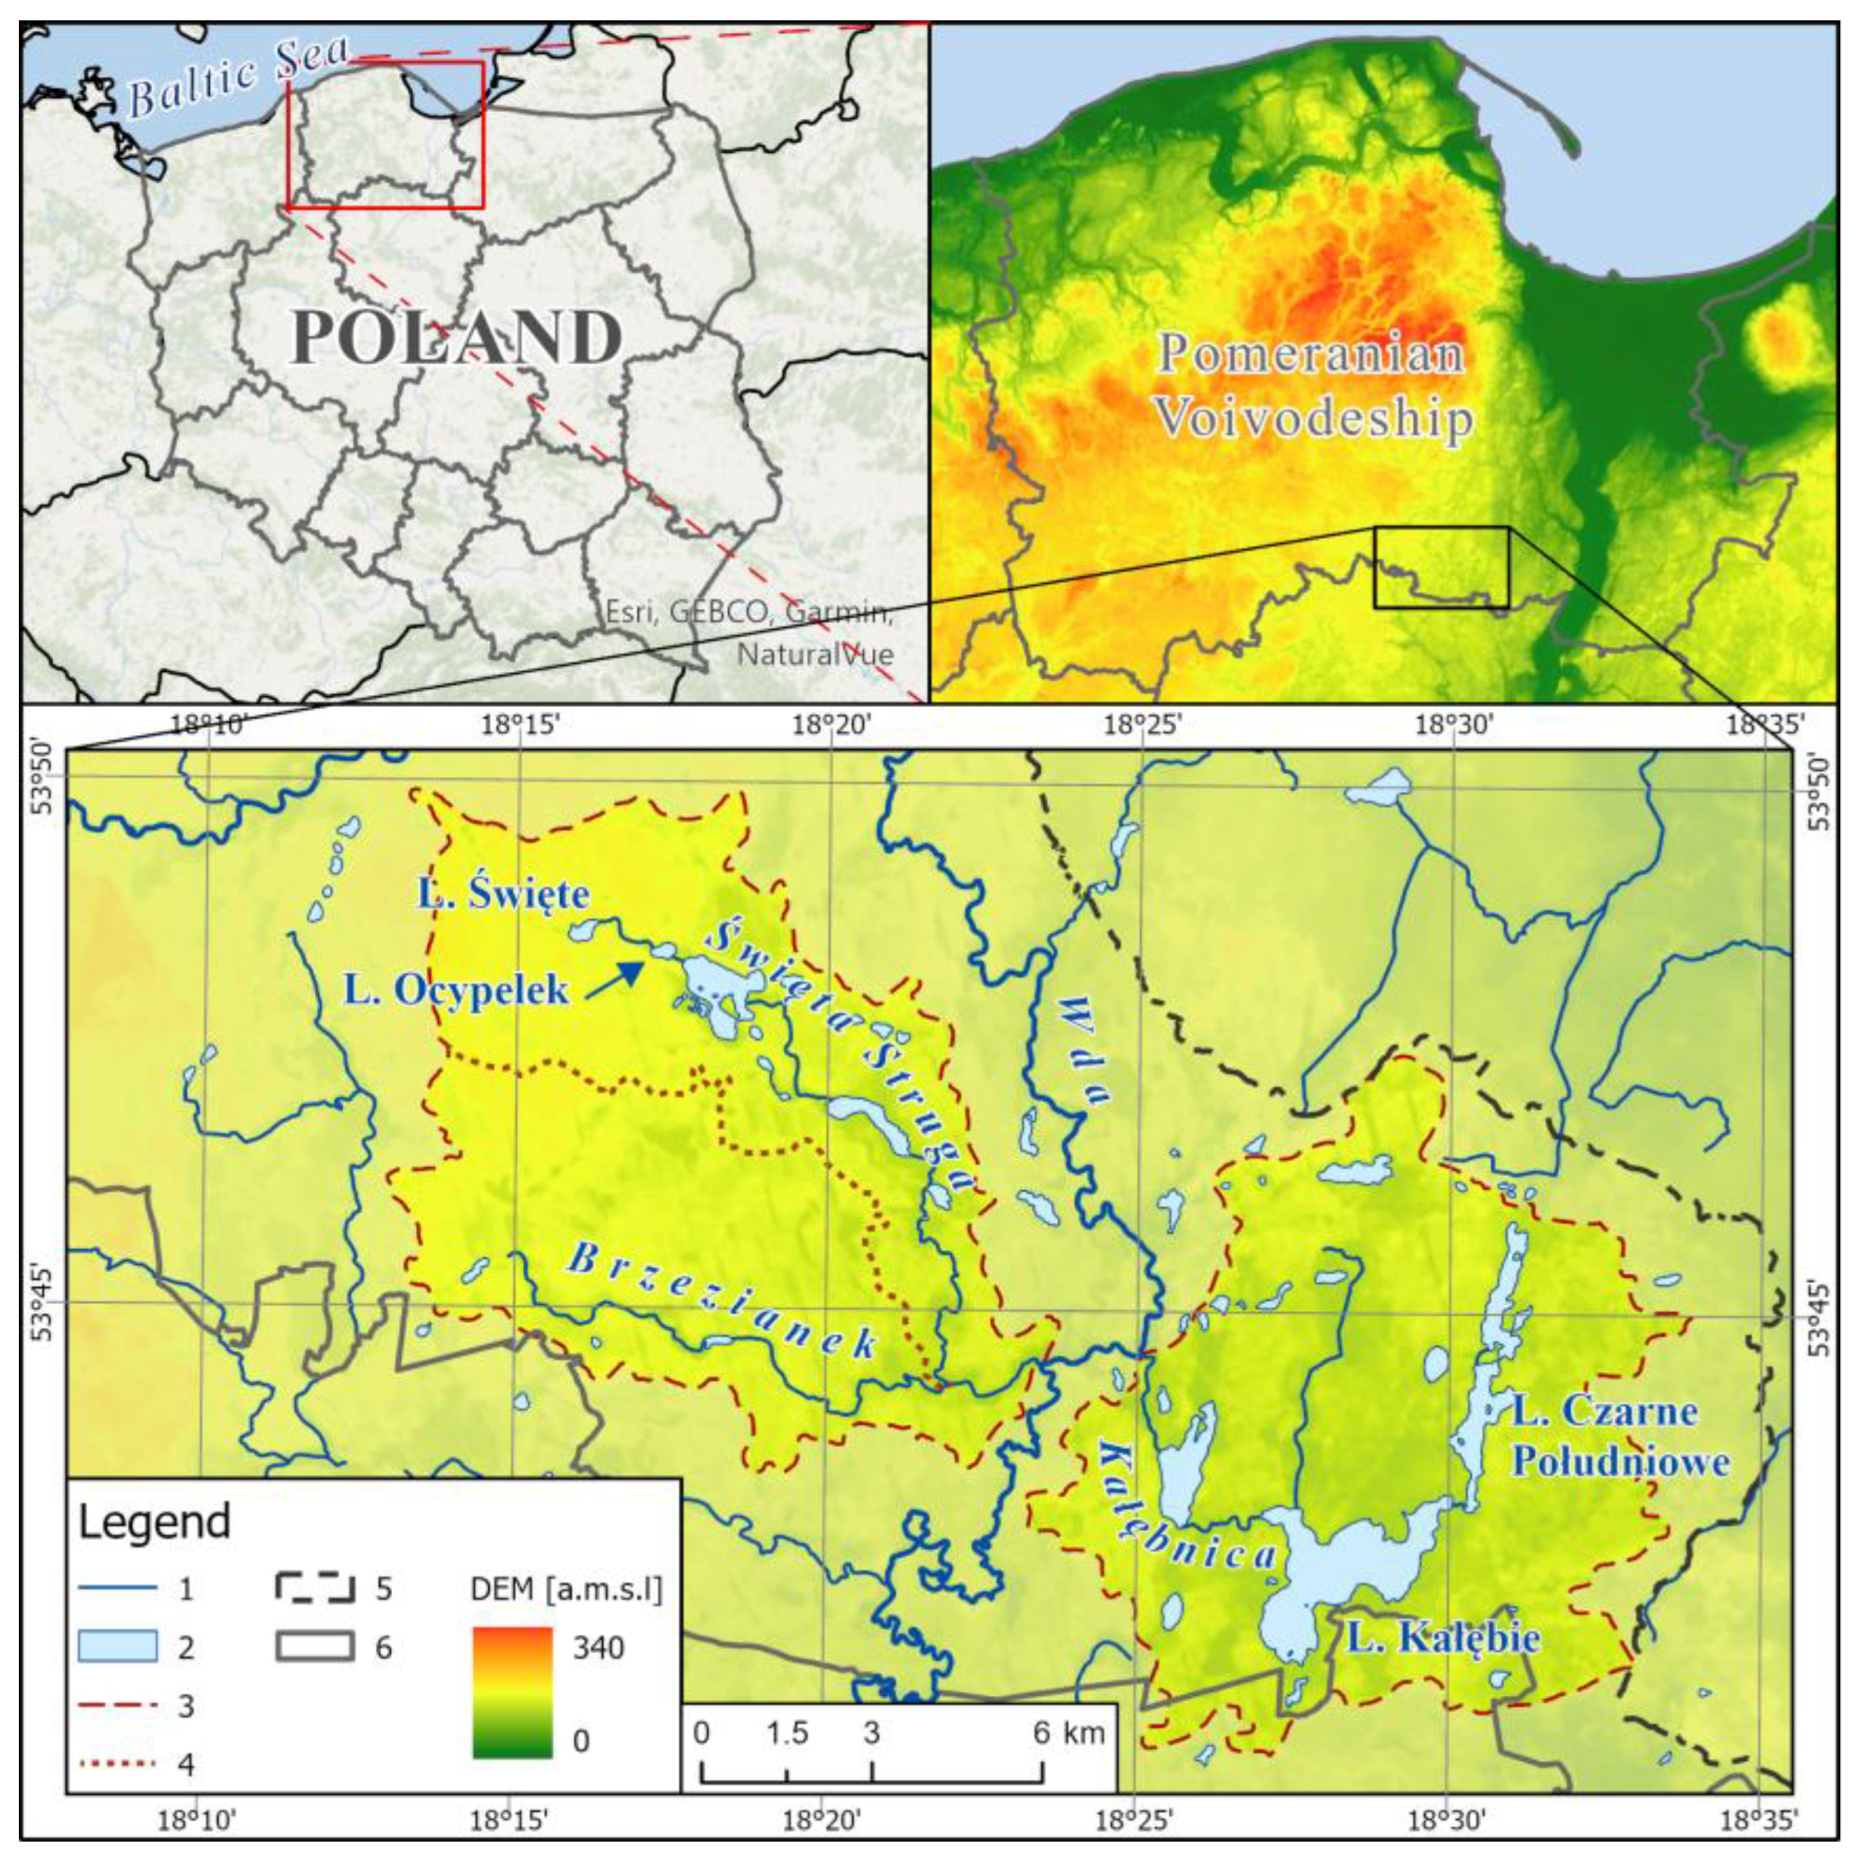
3. Study Area
4. Results and Discussion
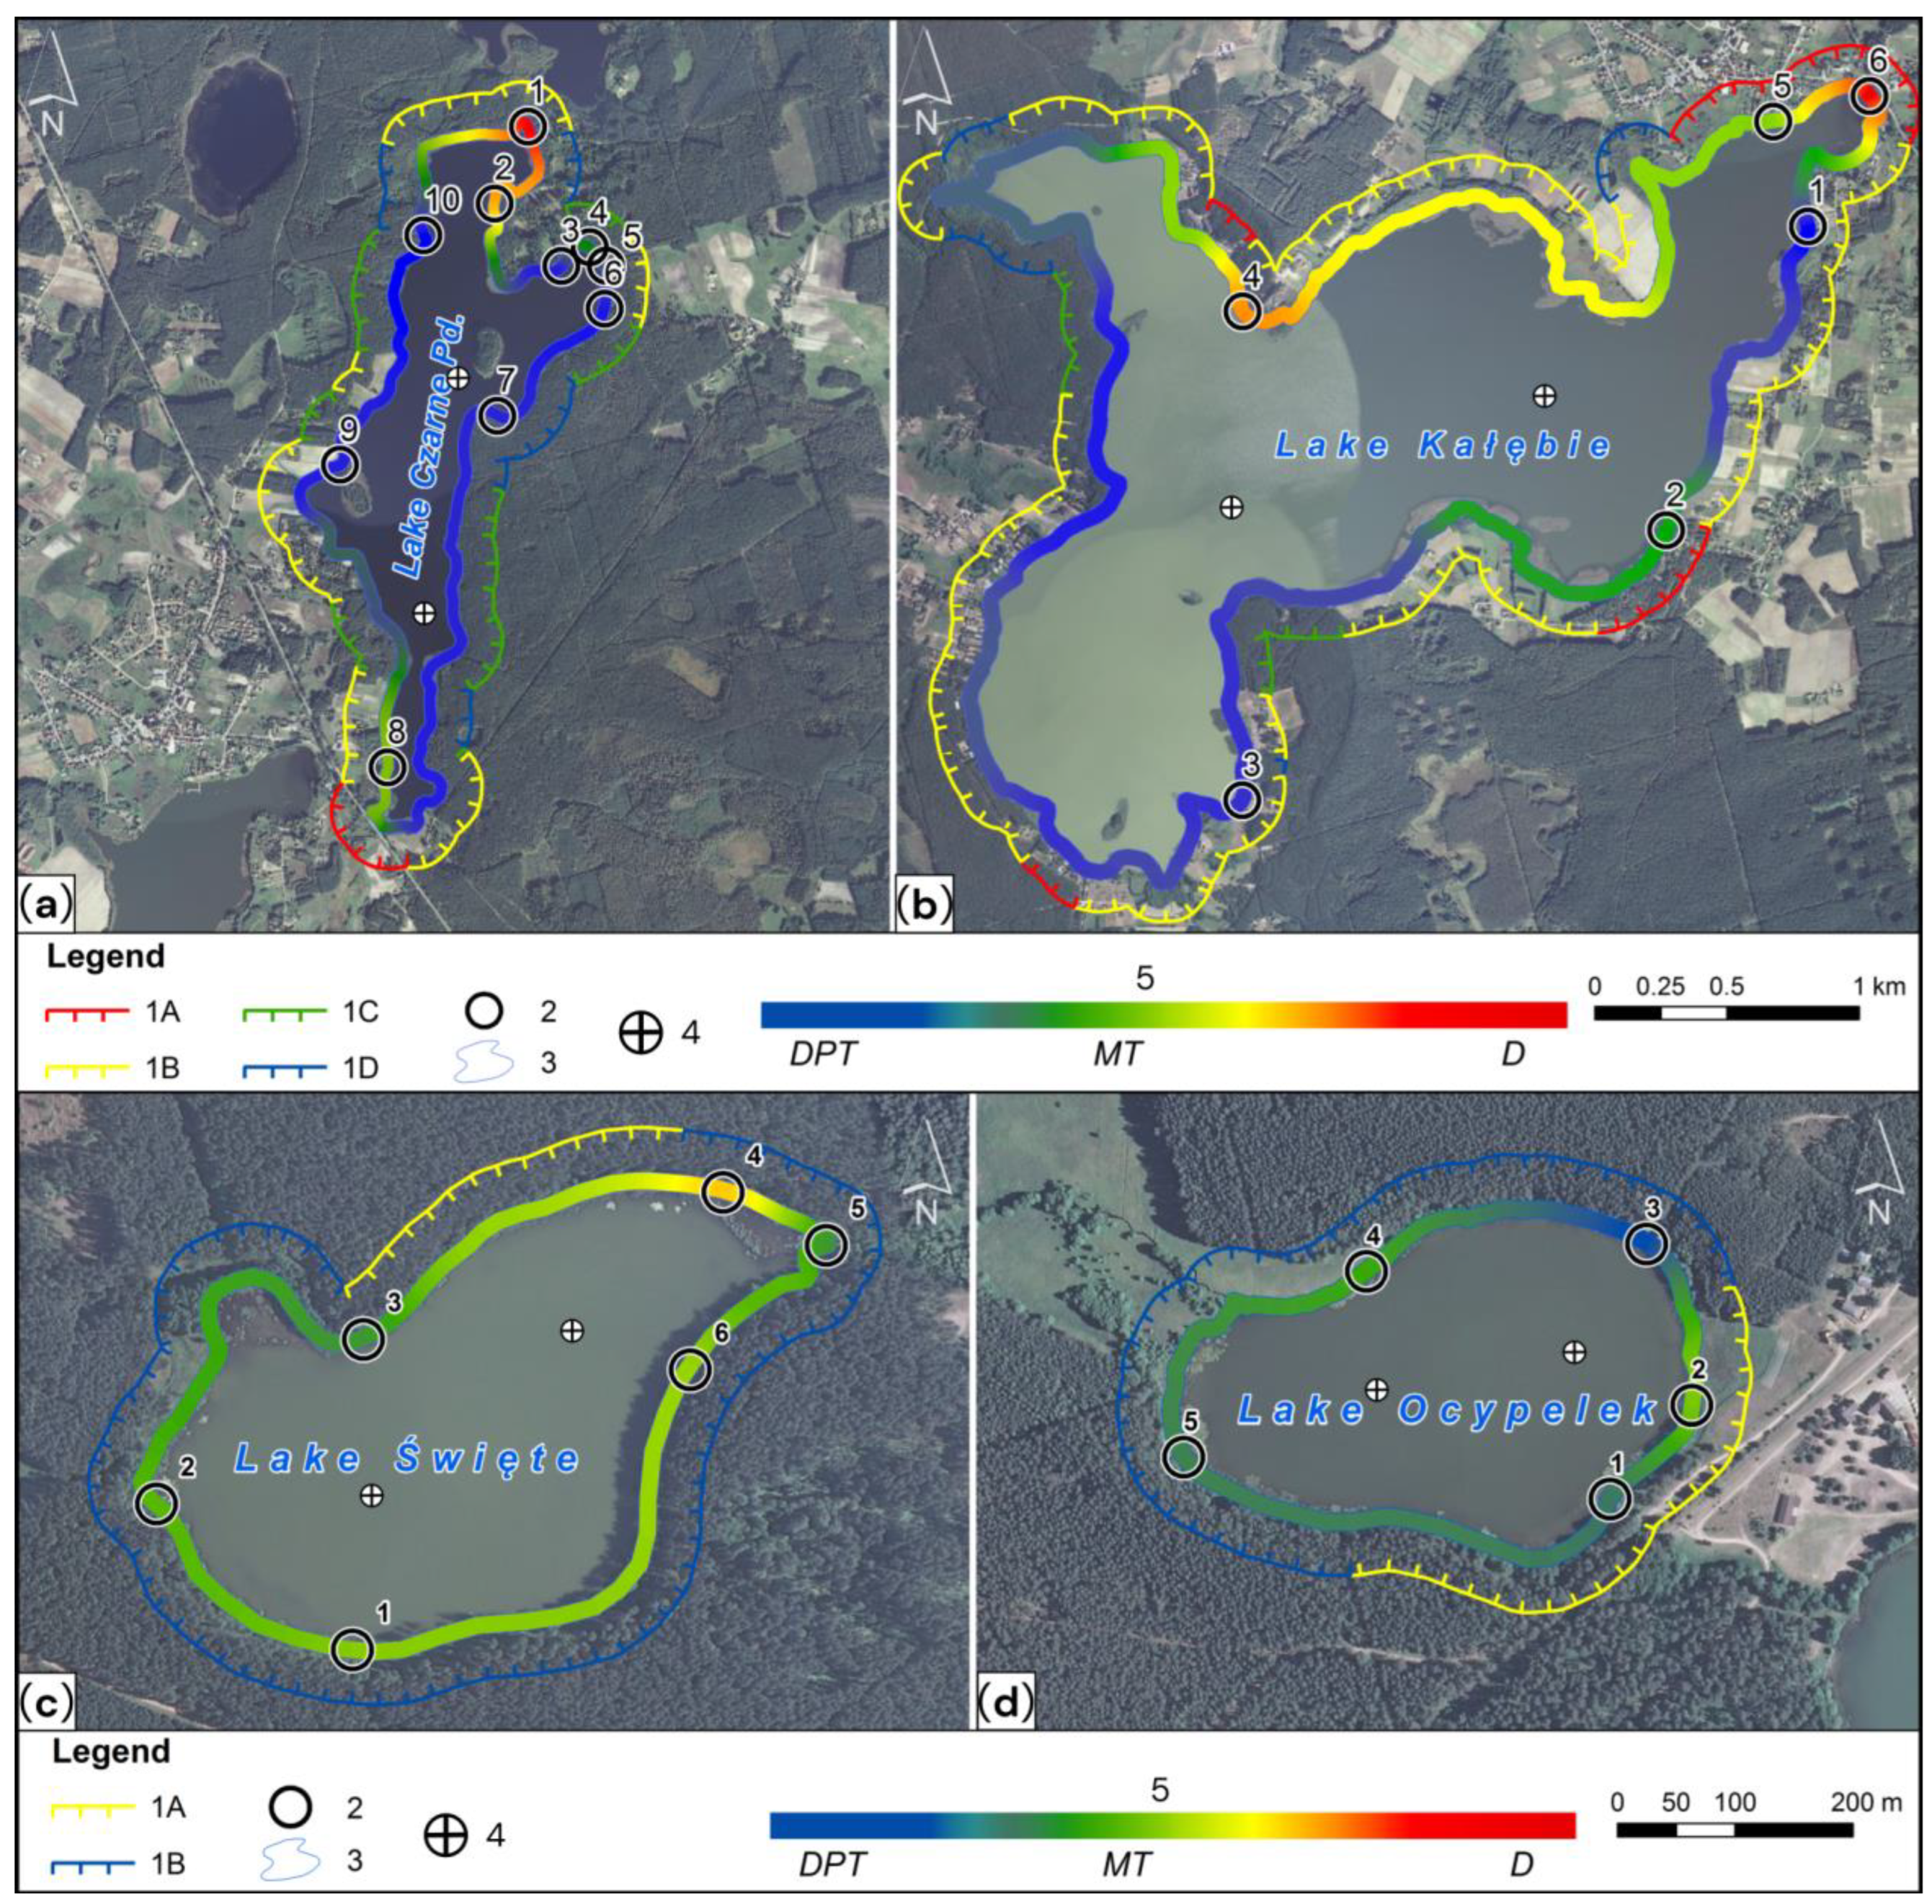
4.1. The Transformation Index of the Littoral Zone (Ba)
4.2. Physicochemical Parameters—Selected Aspects
4.3. Biogenic Substances
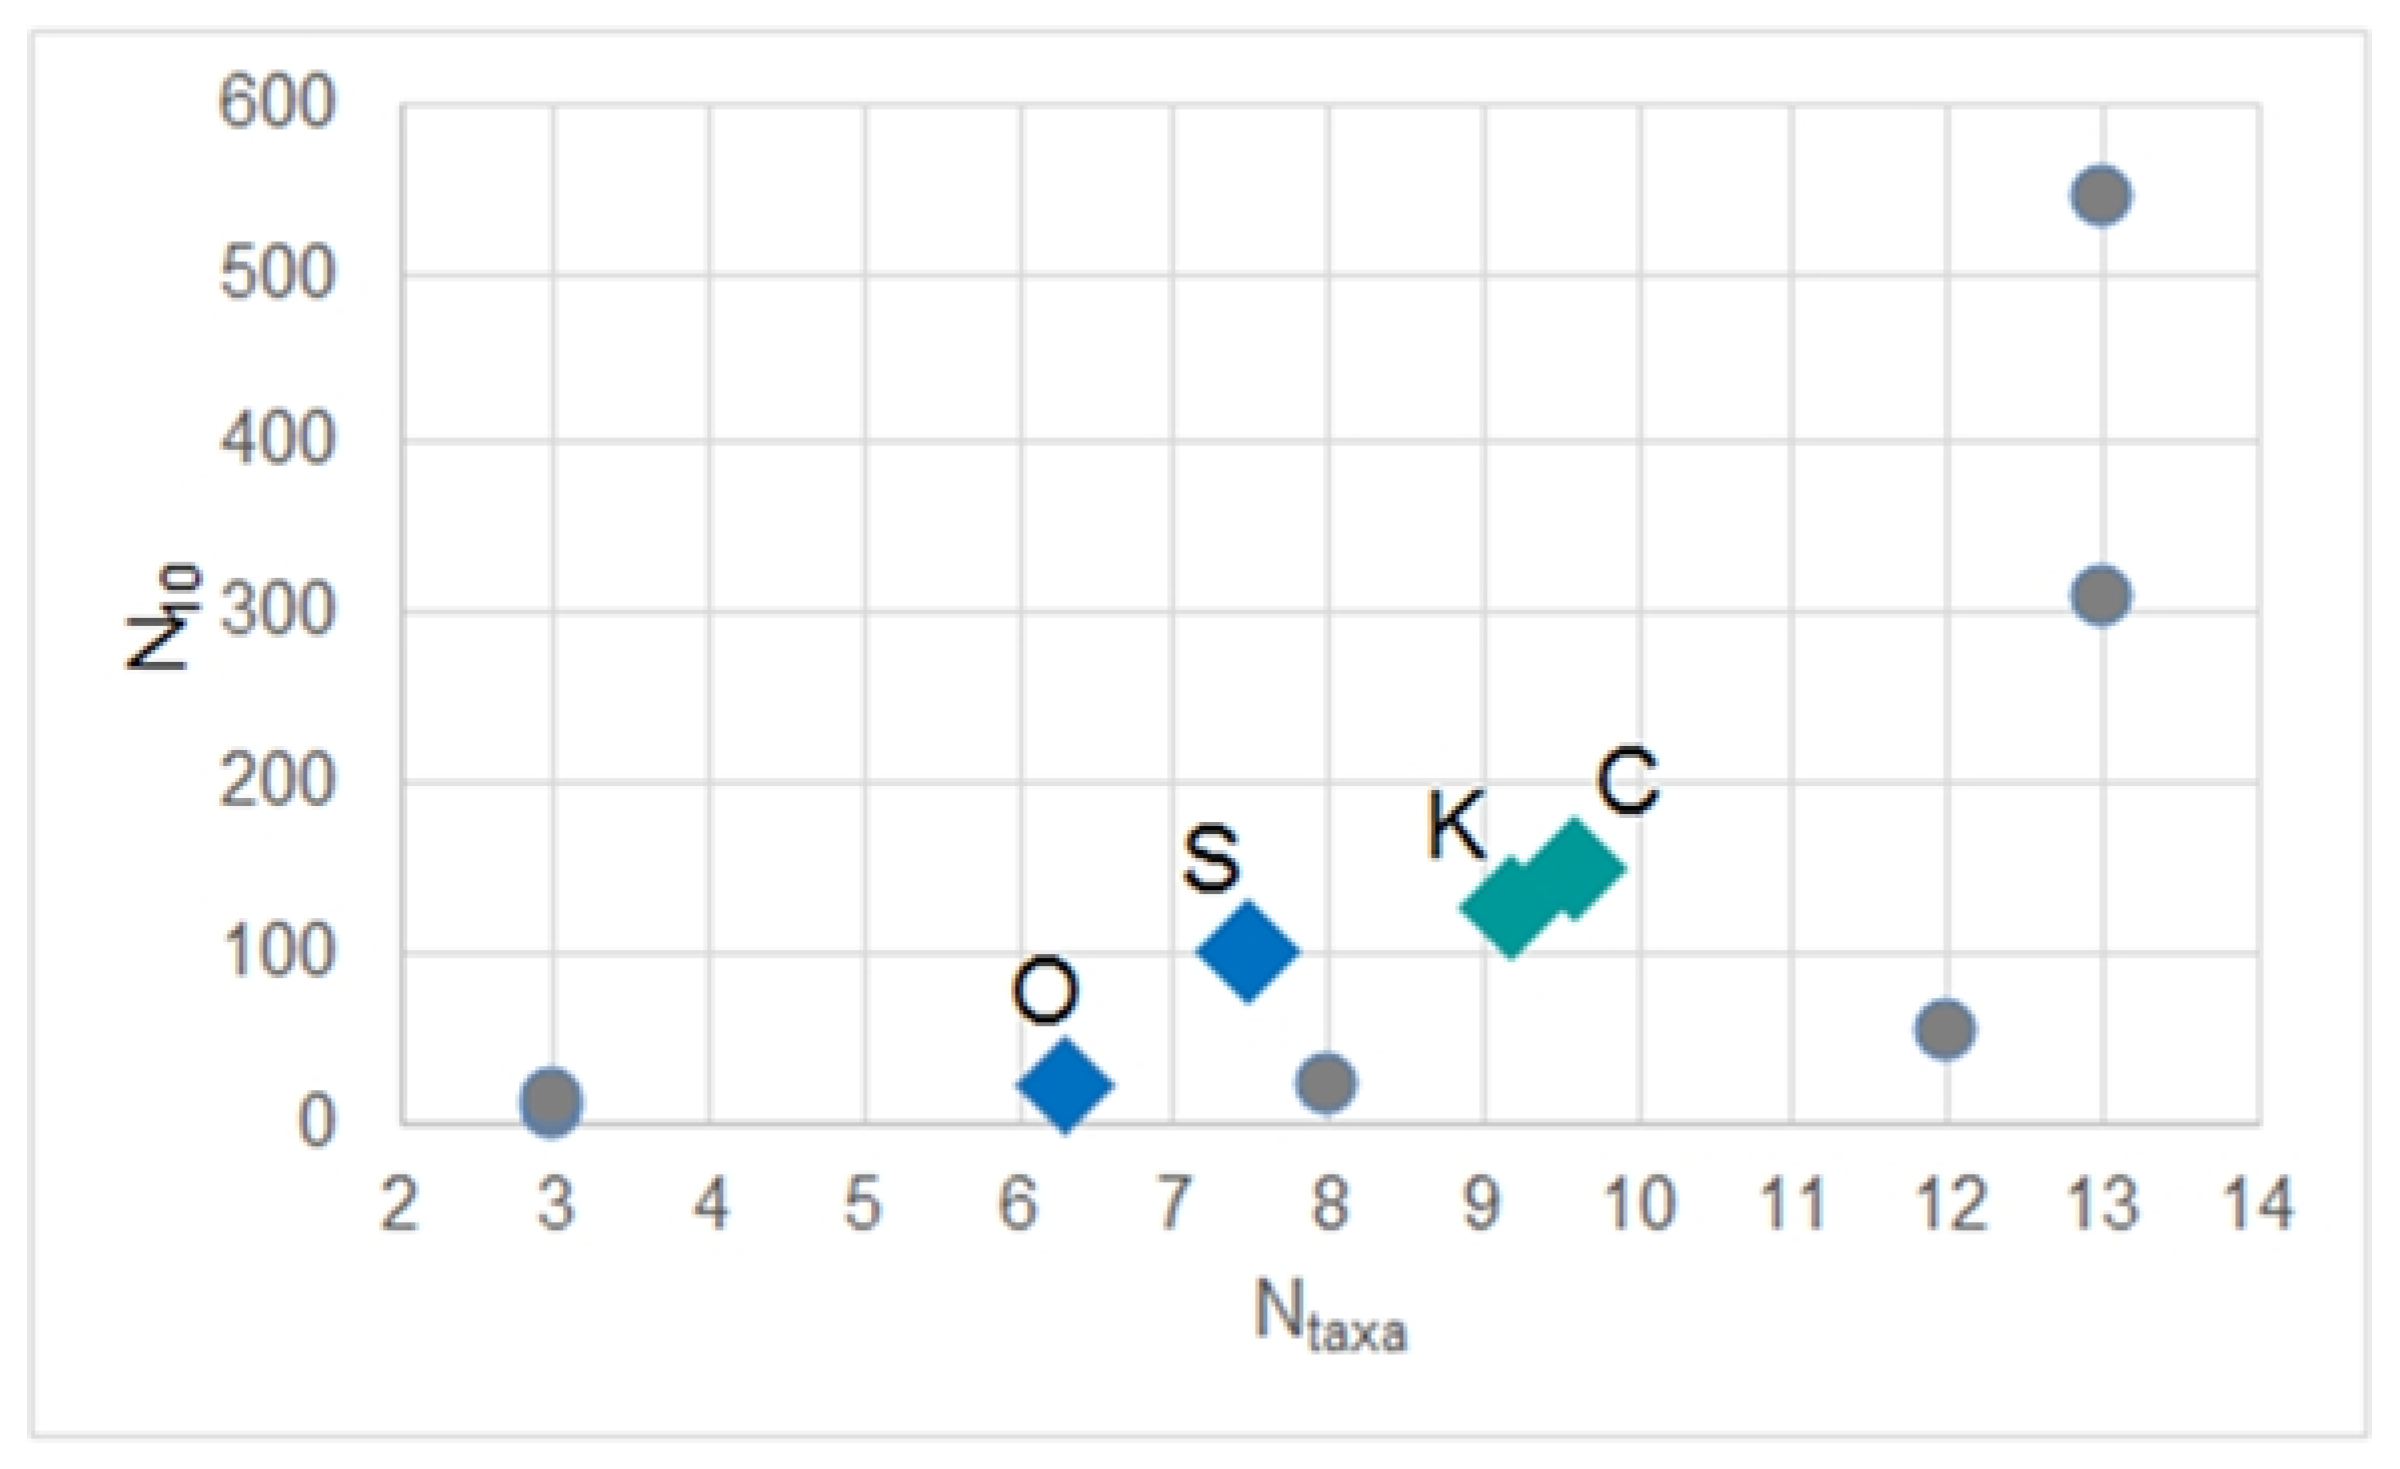
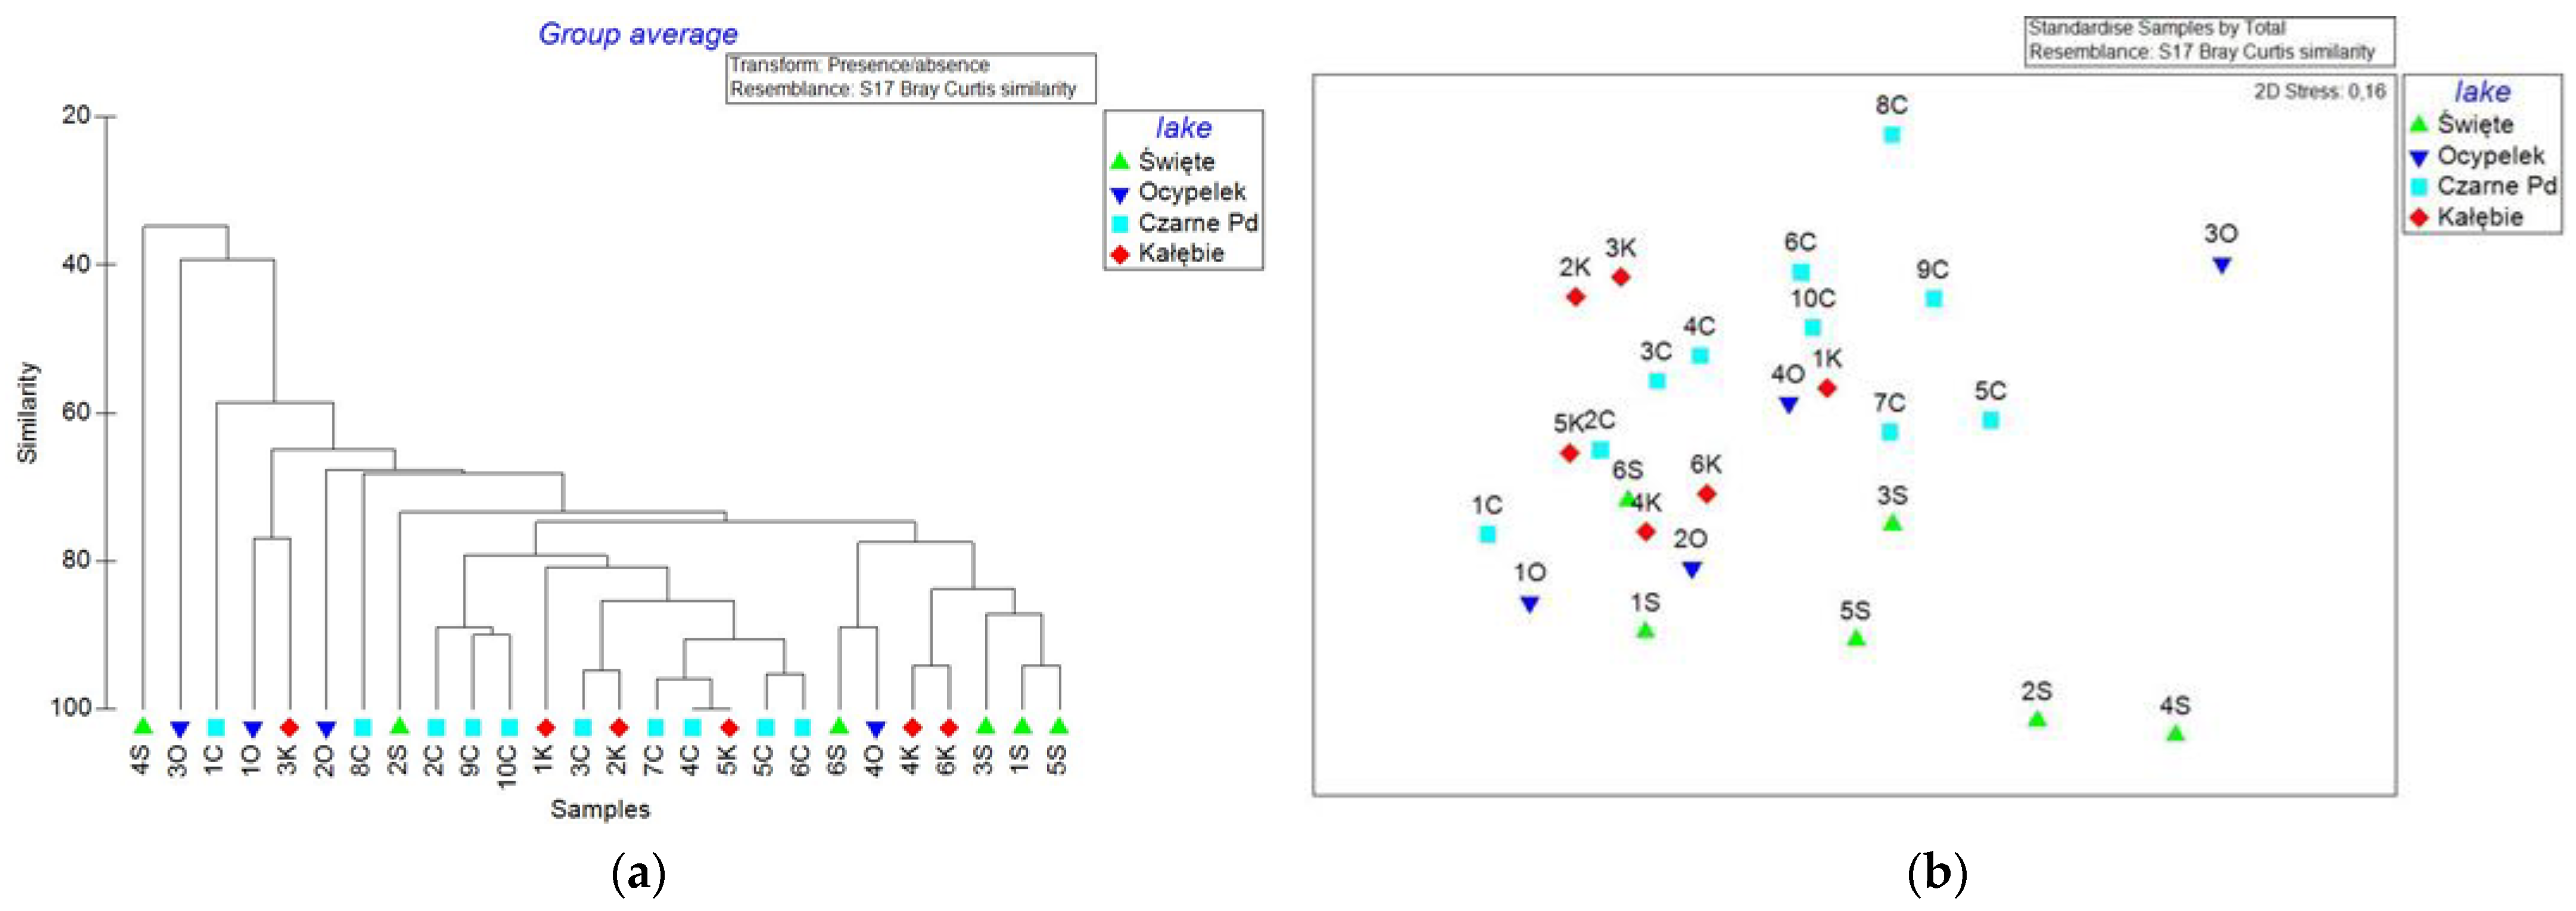
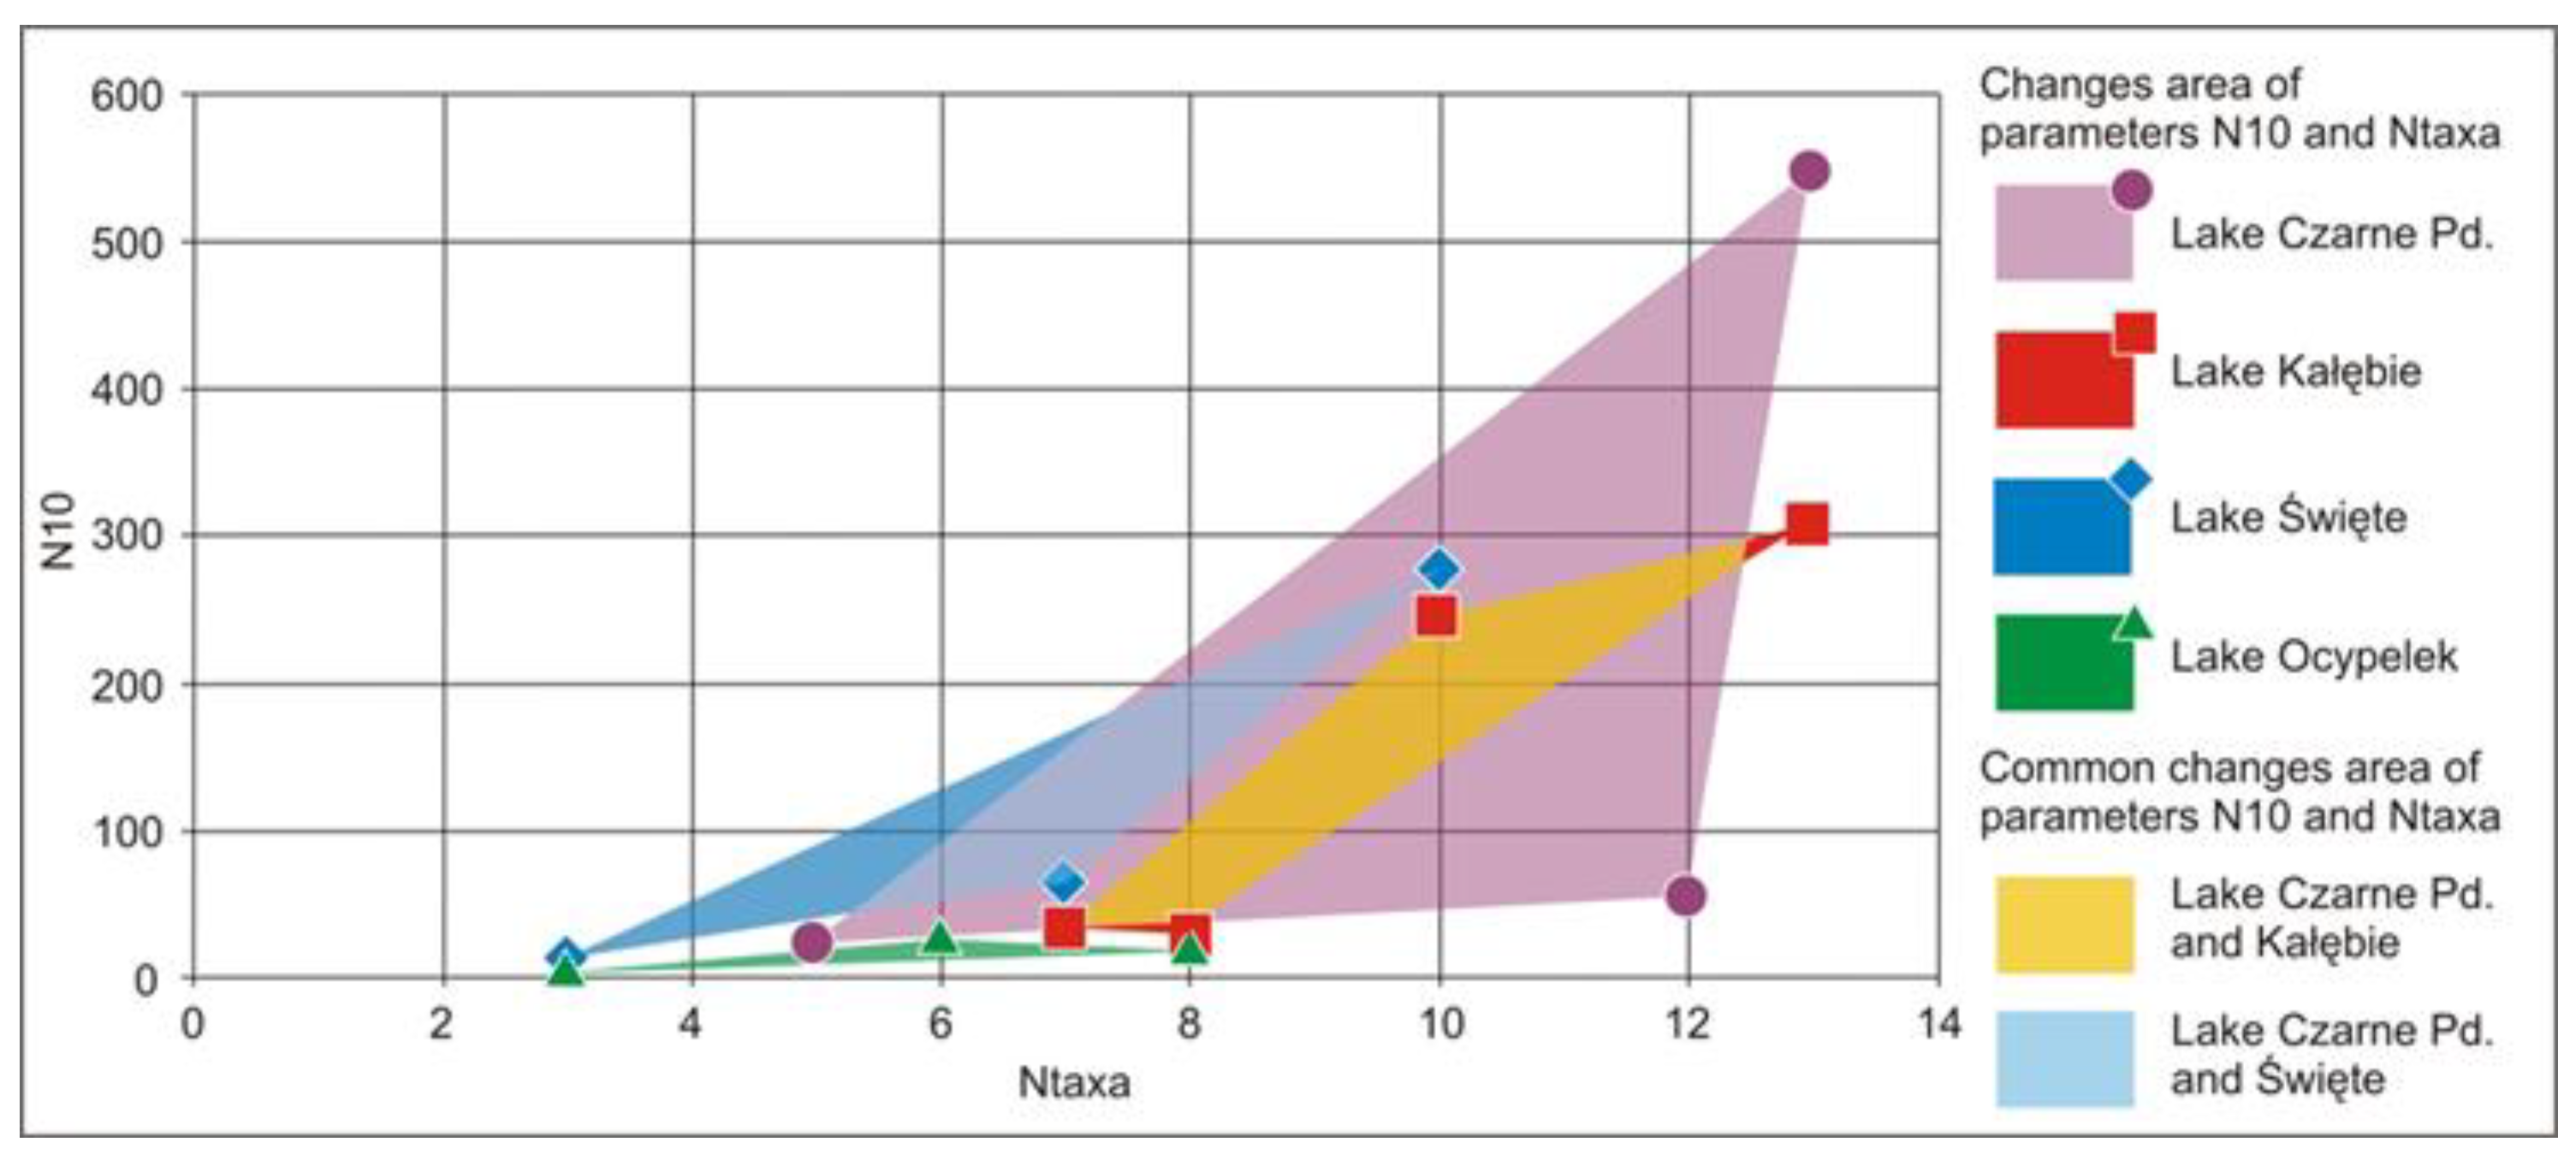
4.4. Meiobenthos Assemblages
4.5. Ttrophic State and Partial Assessment for Ecological State (WFD)
5. Conclusions
Supplementary Materials
Author Contributions
Funding
Data Availability Statement
Conflicts of Interest
References
- Lampert, W.; Sommer, U. Limnoecology: The Ecology of Lakes and Streams; Oxford Univ. Press: New York, NY, USA, 1997; p. 382. [Google Scholar]
- Kowalewski, Z. Weryfikacja Możliwości Zastosowania Integralnego Kryterium do Oceny Stanu Troficznego Wód Płynących (Verification of the Integral Criterion Applicability for the Assessment of Trophic State of Waters). Doctoral Dissertation, AGH, Krakow, Poland, 2012; p. 125. [Google Scholar]
- Pukacz, A.; Pełechaty, M.; Pełechata, A. Próba Oceny Stanu Ekologicznego Jezior o Różnej Morfometrii i Typie Miksji (An attempt to the Ecological State Estimation in Lakes of Different Morphometry and Mixing. Ekologia i Technika 2004, 12, 9–108. [Google Scholar]
- Murphy, G.P.; Shivalingaiah, B.; Leelaja, B.C.; Bosmani, S. Trophic state index in conservation of lake ecosystems. In Proceedings of the 12th World Lake Conference, Proceedings of Taal, Jaipur, Rajasthan, India, 28 October–2 November 2007. [Google Scholar]
- Jodłowski, A.; Gutkowska, E. Ocena stanu troficznego wód Zbiornika Sulejowskiego na podstawie indeksu Carlsona (Sulejow Reservoir Trophic State Assessment on the Basis of Carlson Index). Inżynieria Ochr. Sr. 2012, 15, 341–351. [Google Scholar]
- Wojtasik, B.; Sosiński, J.; Pacyga, P. MeioEco.com Application for Ecological State Analysis. 2016. Available online: http://meioeco.pl/meioeco/meiobenthos%E2%80%93different-definitions-and-criteria-applied (accessed on 19 December 2023).
- Wojtasik, B. Zgrupowanie Meiobentosu do Zastosowania w Ujednoliconym Systemie Oceny Stanu Ekologicznego Zbiorników Wodnych i Rzek, w Szczególności Osadów Dennych oraz do Zastosowania w Tworzeniu Map Stanu Ekologicznego (Clumping of Meiobenthos Organisms for Application in the Unified Assessment System of the Ecological State of Water Reservoirs and Rivers, in Particular Bottom Sediments and for Making Maps of Ecological State). Patent No. 236723, 27 October 2020. [Google Scholar]
- Wojtasik, B. Ecological condition of rivers described by meiobenthic assemblages analysis. Water Probl. Sci. Technol. 2020, 1, 99–116. [Google Scholar]
- Pfannkuche, O.; Thiel, H. Sample processing. In Introduction to the Study of Meiofauna; Higgins, R.P., Thiel, H., Eds.; Smithsonian Institution Press: Washington, DC, USA, 1988; pp. 134–145. [Google Scholar]
- Warwick, R.M.; Platt, H.M.; Clarke, K.R.; Agard, J.; Gobin, J. Analysis of macrobenthic and meiobenthic community structure in relation to pollution and disturbance in Hamilton Harbour, Bermuda. J. Exp. Mar. Biol. Ecol. 1990, 138, 119–142. [Google Scholar] [CrossRef]
- Austen, M.C.; Warwick, R.M.; Rosado, M. C Meiobenthic and macrobenthic community structure along a putative pollution gradient in southern Portugal. Mar. Pollut. Bull. 1989, 20, 398–405. [Google Scholar] [CrossRef]
- Giere, O. Meiobenthology: The Microscopic Fauna in Aquatic Sediments; Springer: Berlin/Heidelberg, Germany, 2008; p. 527. [Google Scholar]
- Giere, O. Meiobenthology: The Microscopic Motile Fauna of Aquatic Sediments, 2nd ed.; Springer: Berlin/Heidelberg, Germany, 1993; p. 328. [Google Scholar]
- Soszka, H.; Skocki, K. Metodyka prowadzenia badań elementów hydromorfologicznych jednolitych części wód jeziornych uwzględniająca wody sztuczne i silnie zmienione (Methodology for studying hydromorphological elements of uniform parts of lake waters, taking into account artificial and heavily modified waters). In Opracowanie Metodyk Monitoringu i Klasyfikacji Hydromorfologicznych Elementów Jakości Jednolitych Części Wód Rzecznych i Jeziornych, Zgodnie z Wymogami Ramowej Dyrektywy Wodnej (Development of Methodologies for Monitoring and Classification of Hydromorphological Elements in Uniforms Parts of River and Lake Waters, in Accordance with the Requirements of the Water Framework Directive); Ilnicki, P., Gołdyn, R., Murat-Błażejewska, S., Soszka, H., Górecki, K., Grzybowski, M., Krzemińska, A., Lewandowski, P., Skocki, K., Sojka, M., Eds.; GEPOL Sp. z o.o.: Poznan, Poland, 2006. [Google Scholar]
- Bajkiewicz-Grabowska, E.; Borowiak, D.; Tórz, A.; Nędzarek, A.; Markowski, M.; Grabowska, B.; Trusewicz, Z.; Fabich, A. Weryfikacja Wyznaczania Silnie Zmiennych Części Wód Jeziornych wraz ze Szczegółowym Uzasadnieniem (Verification of Identifying Highly Variable Components in Lake Waters with Detailed Justification); RZGW: Szczecin, Poland, 2012; pp. 49–55. [Google Scholar]
- Lange, W. (Ed.) Metody Badań Fizycznolimnologicznych (Physicolimnological Methods of Study); Wyd. UG: Gdańsk, Poland, 1993; p. 175. [Google Scholar]
- Choiński, A. (Ed.) Zarys Limnologii Fizycznej Polski (Outline of the Physical Limnology of Poland); Wyd. UAM: Poznań, Poland, 1995; p. 298. [Google Scholar]
- Vollenweider, R.A. Scientific Fundamentals of the Eutrophication of Lakes and Flowing Waters, with Particular Reference to Nitrogen and Phosphorus as Factors in Eutrophication; DAS/CSIO/68.27; OECD: Paris, France, 1968; p. 192. [Google Scholar]
- Nürnberg, G.K. Trophic state of clear and colored, soft- and hard-water lakes with special consideration of nutrients, anoxia, phytoplankton and fish. Lake Reserv. Manag. 1996, 12, 432–447. [Google Scholar] [CrossRef]
- Carlson, R.E. A trophic state index for lakes. Limnol. Oceanogr. 1997, 22, 361–369. [Google Scholar] [CrossRef]
- European Parliament. Directive 2000/60/EC of the European Parliament and of The Council of 23 October 2000 Establishing a Framework for Community Action in the Field of Water Policy (Water Framework Directive); European Parliament: Brussels, Belgium, 2000. [Google Scholar]
- Hutorowicz, A.; Pasztaleniec, A. Procedura Oceny Stanu Ekologicznego Jezior w Oparciu o Multimetriks Fitoplanktonowy Phytoplankton Metric for Polish Lakes—PMPL (Procedure of Ecological State Assessment according to Phytoplankton Multimetric Phytoplankton Metrics for Polish Lakes—PMPL); GIOŚ: Warszawa, Poland; Olsztyn, Poland, 2011. [Google Scholar]
- Bedryj, M.; Błachuta, J.; Brodzińska, B.; Grześkowiak, A.; Nowak, B.; Żak, J. Opracowanie Metodyki Weryfikacji Wyznaczenia Silnie Zmienionych i Sztucznych Części Wód Jeziornych (Development of a Methodology for Verifying the Identification of Highly Altered and Artificial Components in Lake Waters); IMGW: Poznań, Poland, 2011. [Google Scholar]
- Richling, A.; Solon, J.; Macias, A.; Balon, J.; Borzyszkowski, J.; Kistowski, M. (Eds.) Regionalna Geografia Fizyczna Polski (Regional Physical Geography of Poland); Bogucki Wyd. Naukowe: Poznań, Poland, 2021. [Google Scholar]
- Bogosławskij, B.B. Ozierowiedienie; Mosk. Univr.: Moskwa, Russia, 1960. [Google Scholar]
- Kostrzewski, A. (Ed.) Koncepcja Programu: Monitoring Obiegu Materii, Kompleksowy Monitoring Środowiska Przyrodniczego w Podstawowych Typach Geoekosystemów Polski (The Concept of the Program: Monitoring of the Matter Circulation, a Comprehensive Monitoring of the Environment in the Basic Types of Geoecosystems in Poland); Komitet Naukowy przy Prezydium PAN “Człowiek i Środowisko”: Poznan, Poland, 1991. [Google Scholar]
- Kostrzewski, A. Geoekosystem obszarów nizinnych. Koncepcja metodologiczna (The geoecosystem of lowlands areas a methodological conception). In Geoekosystem Obszarów Nizinnych; Polska Akademia Nauk, Kom. Nauk. Prez. PAN “Człowiek i Środowisko”: Wroclaw, Poland, 1993; pp. 11–17. [Google Scholar]
- Bajkiewicz-Grabowska, E. Lake geoecosystem as an indicator of the rate of natural eutrophication of water reservoirs. Limnol. Rev. 2008, 8, 9–12. [Google Scholar]
- Bajkiewicz-Grabowska, E. Zróżnicowanie geoekosystemów jeziornych ze względu na tempo naturalnej eutrofizacji (Diversity of lake geoecosystems in terms of natural eutrophicaton rate). In Jeziora Kaszubskiego Parku Krajobrazowego; Borowiak, D., Ed.; Katedra Limnologii UG, Badania Limnologiczne: Gdansk, Poland, 2007; Volume 5, pp. 279–291. [Google Scholar]
- Nowiński, K.; Maślanka, W.; Lange, W. Właściwości chemiczne wód jeziornych (Chemical Properties of Lake Waters). In Jeziora Górnej Raduni i Jej Zlewnia w Badaniach z Udziałem Stacji Limnologicznej w Borucinie; Lange, W., Ed.; Katedra Limnologii UG, Badania Limnologiczne: Gdansk, Poland, 2005; Volume 3, pp. 279–294. [Google Scholar]
- Nowiński, K. Rola Jezior w Transformacji Jakości Wód Systemu Raduni (The Role of Lakes in the Transformation of Water Quality in the Radunia System). Ph.D. Dissertation, Uniwersytet Gdanski, Gdansk, Poland, 2009. [Google Scholar]
- Bhateria, R.; Jan, D. Water quality assessment of lake water: A review. Sustain. Water Resour. Manag. 2016, 2, 161–173. [Google Scholar] [CrossRef]
- Hull, R.N.; Kleywegt, S.; Schroeder, J. Risk-based screening of selected contaminants in the Great Lakes Basin. J. Great Lakes Res. 2015, 41, 238–245. [Google Scholar] [CrossRef]
- Wojtasik, B. Evaluation of the stage of development of the littoral of Czorsztyński and Sromowiecki reservoirs (Pieniny Mountains, Poland) on the basis of analyses of meiobenthos assemblages. Ecohydrol. Hydrobiol. 2009, 9, 149–157. [Google Scholar] [CrossRef]
- Czarnecka, H. Ocena Stanu Czystości Wód Jeziora Kałębie na Podstawie Badań Wykonanych w 2005 Roku (The Assessment of Water Quality in Lake Kałębie Based on Studies Conducted in 2005); Pomorski Wojewódzki Inspektor Ochrony Środowiska: Gdansk, Poland, 2006. [Google Scholar]
- Główny Inspektorat Ochrony Środowiska. Available online: https://wody.gios.gov.pl/pjwp/publication/LAKES/87 (accessed on 18 December 2023).
- Czarnecka, H. Ocena Stanu Czystości Wód Jeziora Czernego Południowego na Podstawie Badań Wykonanych w 2005 Roku (The Assessment of Water Quality in Lake Czarne Południowe Based on Studies Conducted in 2005); Pomorski Wojewódzki Inspektor Ochrony Środowiska: Gdansk, Poland, 2006. [Google Scholar]
- Särkkä, J. Lacustrine profundal meiobenthos as an environmental indicator. Hydrobiologia 1992, 243/244, 333–340. [Google Scholar] [CrossRef]
- Wojtasik, B.; Nowiński, K.; Staniszewska, W.; Kheireddine, A. Seasonal variability of meiobenthic assemblages inhabiting the Nottinghambukta tidal flat, SW Spitsbergen. Limnol. Rev. 2019, 4, 175–189. [Google Scholar] [CrossRef]
- Buytaert, W.; Zulkafli, Z.; Grainger, S.; Acosta, L.; Alemie, T.C.; Bastiaensen, J.; De Bievre, B.; Bhusal, J.; Clark, J.; Dewulf, A.; et al. Citizen science in hydrology and water resources: Opportunities for knowledge generation, ecosystem service management, and sustainable development. Front. Earth Sci. 2014, 2, 26. [Google Scholar] [CrossRef]
- Daw, T.; Brown, K.; Rosendo, S.; Pomeroy, R. Applying the ecosystem services concept to poverty alleviation: The need to disaggregate human well-being. Environ. Conserv. 2011, 38, 370–379. [Google Scholar] [CrossRef]


| Lake | Catchment | Land Use Structure w/o Lake | ||||||
|---|---|---|---|---|---|---|---|---|
| Total | Direct | Agriculture | Forsests | Green Areas | Built-Up Areas | Water Bodies | ||
| with Lake | w/o Lake | |||||||
| (km2) | (km2) | (km2) | (%) | (%) | (%) | (%) | (%) | |
| Święte | 11.69 | 11.69 | 11.56 | 0.4 | 99 | 0.8 | 0 | 0 |
| Ocypelek | 17.49 | 3.36 | 3.27 | 0.7 | 99.3 | 0 | 0 | 0 |
| Czarne Południowe | 21.69 | 5.65 | 4.66 | 16.0 | 58 | 14.3 | 6.8 | 4.5 |
| Kałębie | 47.90 | 26.28 | 21.62 | 18.5 | 51 | 26.8 | 3.4 | 0.8 |
| Lake | River–Lake System | Elevation | Depth | Volume | Surface Area | |
|---|---|---|---|---|---|---|
| Max | Average | |||||
| (m a.m.s.l.) | (m) | (m) | (103 m3) | (ha) | ||
| Święte | Święta Struga | 103.6 | 10.5 | 4.2 | 552.64 | 13.1 |
| Ocypelek | Święta Struga | 100.3 | 13.0 | 4.2 | 397.89 | 9.4 |
| Czarne Południowe | Kałębnica | 87.8 | 7.6 | 2.8 | 2799.50 | 98.4 |
| Kałębie | Kałębnica | 87.6 | 6.4 | 2.4 | 11,056.40 | 466.3 |
| Lake | River–Lake System | Shoreline Length L | Class 1 L1 | Class 2 L2 | Class 3 L3 | Class 4–5 L4–5 | Ba |
|---|---|---|---|---|---|---|---|
| (km) | (km) | (km) | (km) | (km) | (km) | ||
| Święte | Święta Struga | 1.644 | 0 | 0.443 | 0 | 1.201 | 13.5 |
| Ocypelek | Święta Struga | 1.210 | 0 | 0 | 0.330 | 1.210 | 5.5 |
| Czarne Południowe | Kałębnica | 7.643 | 0.300 | 2.530 | 2.843 | 1.970 | 27.9 |
| Kałębie | Kałębnica | 15.200 | 1.960 | 10.458 | 1.633 | 1.149 | 49.4 |
| Lake | Nitrogen | Total Phosphorus | |||
|---|---|---|---|---|---|
| Name | Sampling Location | Total | NO2 | NH4 | |
| (mg L−1) | (mg L−1) | (mg L−1) | (mg L−1) | ||
| Święte | surface | 0.420 | 0.009 | 0.057 | 0.031 |
| bottom | 0.720 | 0.011 | 0.043 | 0.046 | |
| Ocypelek | surface | 0.590 | 0.010 | 0.045 | 0.045 |
| bottom | 4.320 | 0.010 | 4.080 | 0.488 | |
| Czarne Południowe | surface | 1.500 | 0.015 | 0.018 | 0.034 |
| bottom | 1.450 | 0.015 | 0.024 | 0.060 | |
| Kałębie | surface | 1.550 | 0.023 | 0.044 | 0.048 |
| bottom | 1.550 | 0.023 | 0.048 | 0.046 | |
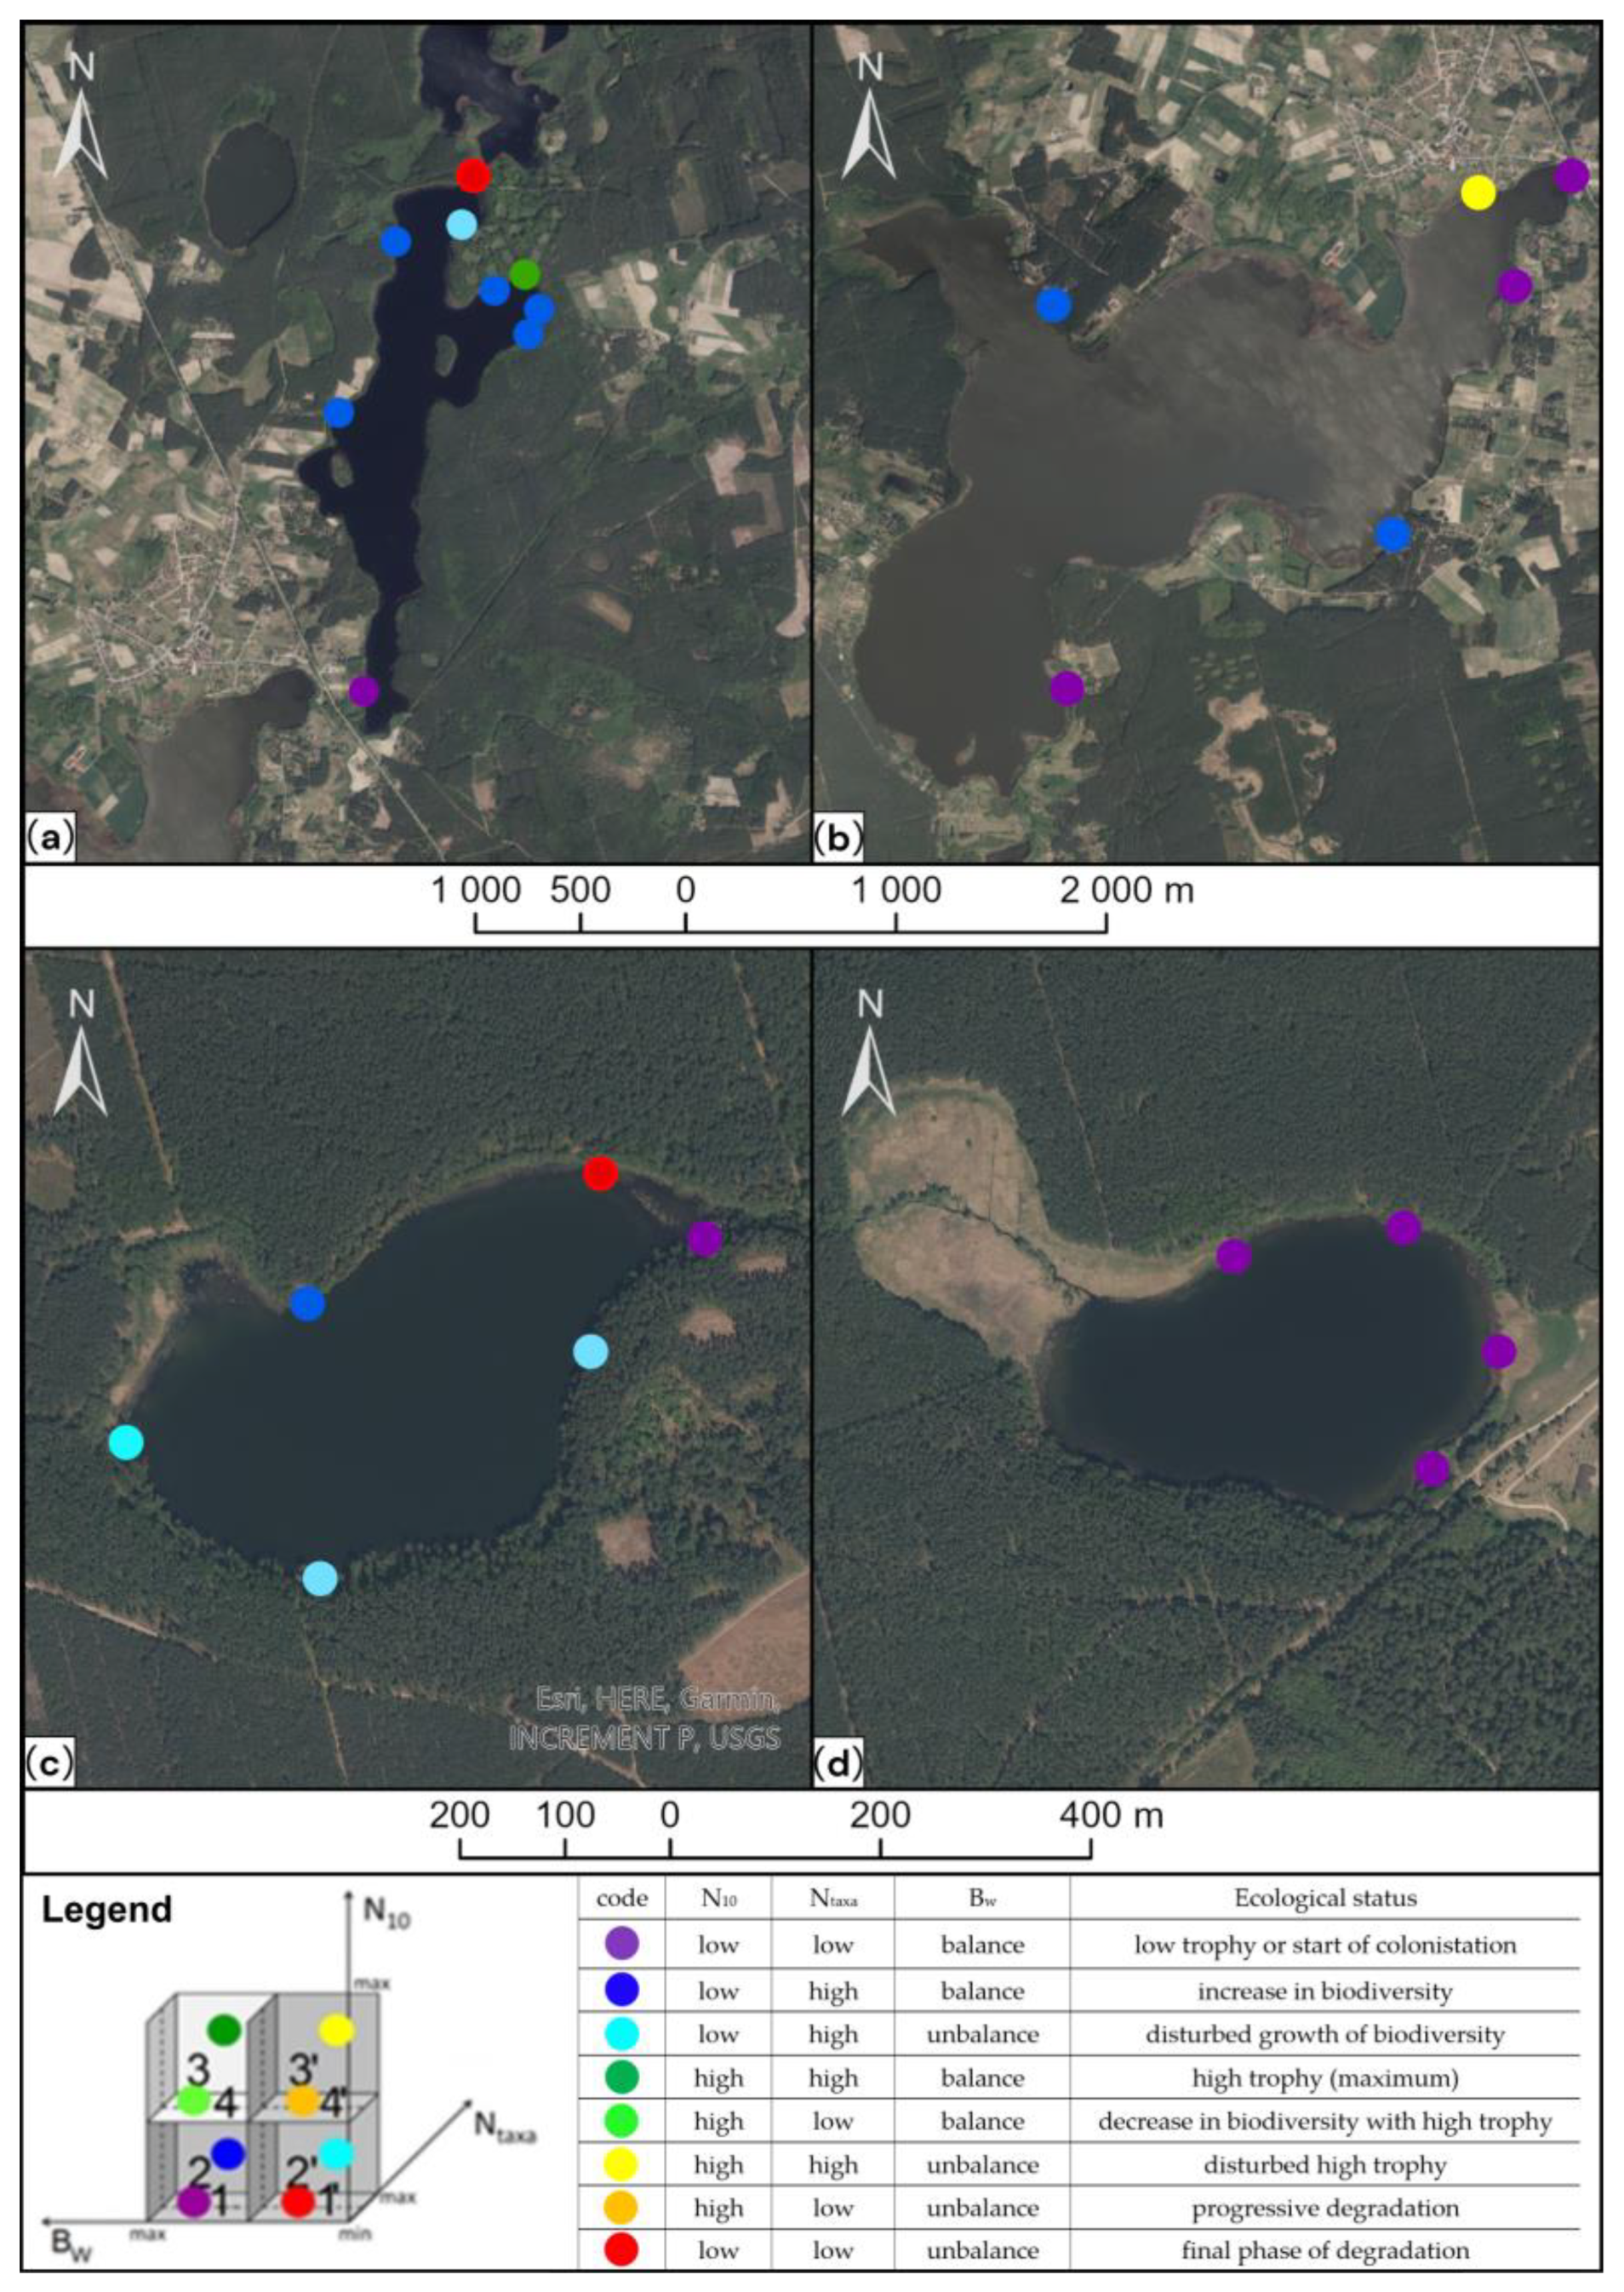
| Lake | Station Number | N10 | Ntaxa | Bw |
|---|---|---|---|---|
| Święte | S1 | 156.98 | 9 | 0.489 |
| S2 | 45.87 | 8 | 0.507 | |
| S3 | 43.83 | 11 | 0.904 | |
| S4 | 14.27 | 3 | 0.536 | |
| S5 | 64.22 | 8 | 0.821 | |
| S6 | 278.29 | 10 | 0.514 | |
| Ocypelek | O1 | 29.56 | 6 | 0.687 |
| O2 | 28.54 | 8 | 0.665 | |
| O3 | 8.15 | 3 | 0.750 | |
| O4 | 22.43 | 8 | 0.839 | |
| Czarne Południowe | C1 | 23.45 | 5 | 0.348 |
| C2 | 85.63 | 8 | 0.575 | |
| C3 | 98.88 | 10 | 0.834 | |
| C4 | 554.54 | 13 | 0.880 | |
| C5 | 237.51 | 11 | 0.790 | |
| C6 | 153.92 | 10 | 0.859 | |
| C7 | 53.01 | 12 | 0.842 | |
| C8 | 74.41 | 7 | 0.632 | |
| C9 | 65.24 | 10 | 0.652 | |
| C10 | 165.14 | 10 | 0.857 | |
| Kałębie | K1 | 63.20 | 8 | 0.858 |
| K2 | 242.61 | 10 | 0.895 | |
| K3 | 31.60 | 7 | 0.892 | |
| K4 | 71.36 | 9 | 0.730 | |
| K5 | 307.85 | 13 | 0.615 | |
| K6 | 35.68 | 8 | 0.790 |
| Lake | River–Lake System | Trophic State | Shoreline State (Transformation) | Ecological State | ||
|---|---|---|---|---|---|---|
| Vollenweider | Carlson | WFD (Partial Assessment) | Meiobenthos | |||
| Święte | Świeta Struga | eutrophy | mesotrophy | natural shoreline | moderate | developing trophy with disturbed balance |
| Ocypelek | Święta Struga | eutrophy | eutrophy | natural shoreline | moderate | initial phase of developing trophy |
| Czarne Południowe | Kałębinica | - | mesotrophy | transformation of the natural shoreline is significant | moderate | developed trophy with area of high trophy and degradation |
| Kałębie | Kałębinica | - | eutrophy | heavily transformed shoreline | moderate | developed trophy |
Disclaimer/Publisher’s Note: The statements, opinions and data contained in all publications are solely those of the individual author(s) and contributor(s) and not of MDPI and/or the editor(s). MDPI and/or the editor(s) disclaim responsibility for any injury to people or property resulting from any ideas, methods, instructions or products referred to in the content. |
© 2024 by the authors. Licensee MDPI, Basel, Switzerland. This article is an open access article distributed under the terms and conditions of the Creative Commons Attribution (CC BY) license (https://creativecommons.org/licenses/by/4.0/).
Share and Cite
Markowski, M.; Wojtasik, B. Diagnosis of the Condition of Aquatic Ecosystems Using a Partial Assessment of Ecological and Trophic States: An Example of Small Lakes in Northern Poland. Limnol. Rev. 2024, 24, 105-125. https://doi.org/10.3390/limnolrev24010006
Markowski M, Wojtasik B. Diagnosis of the Condition of Aquatic Ecosystems Using a Partial Assessment of Ecological and Trophic States: An Example of Small Lakes in Northern Poland. Limnological Review. 2024; 24(1):105-125. https://doi.org/10.3390/limnolrev24010006
Chicago/Turabian StyleMarkowski, Maciej, and Barbara Wojtasik. 2024. "Diagnosis of the Condition of Aquatic Ecosystems Using a Partial Assessment of Ecological and Trophic States: An Example of Small Lakes in Northern Poland" Limnological Review 24, no. 1: 105-125. https://doi.org/10.3390/limnolrev24010006
APA StyleMarkowski, M., & Wojtasik, B. (2024). Diagnosis of the Condition of Aquatic Ecosystems Using a Partial Assessment of Ecological and Trophic States: An Example of Small Lakes in Northern Poland. Limnological Review, 24(1), 105-125. https://doi.org/10.3390/limnolrev24010006