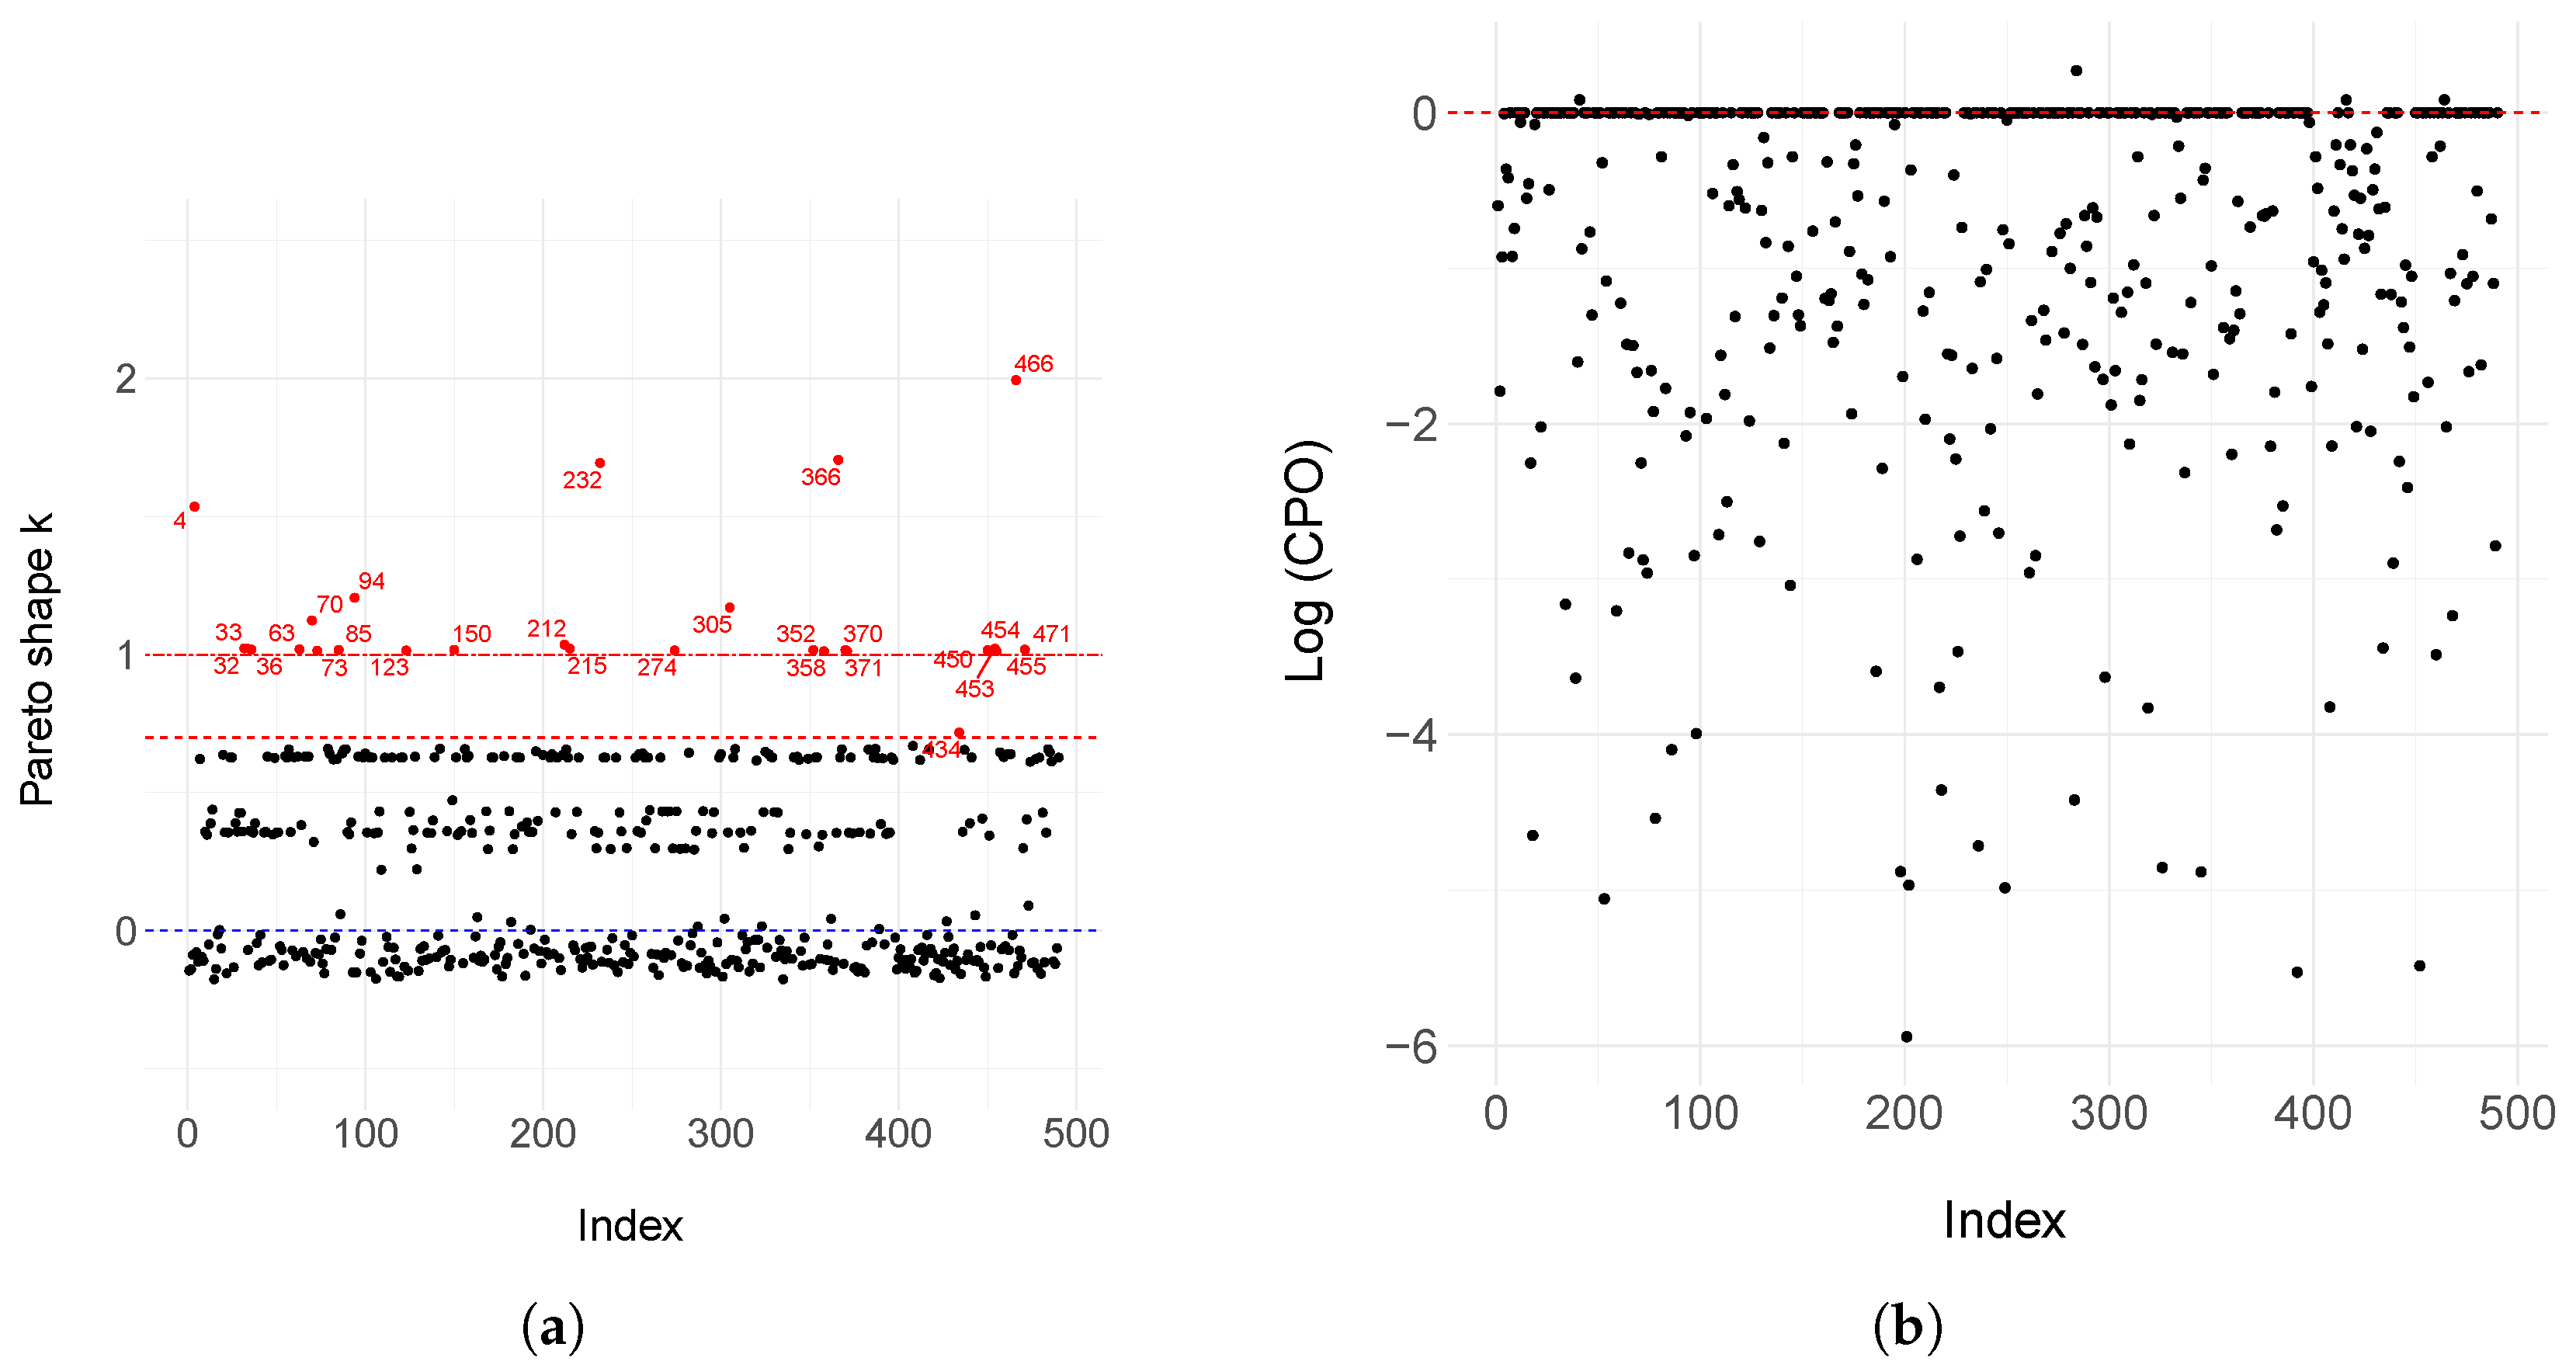
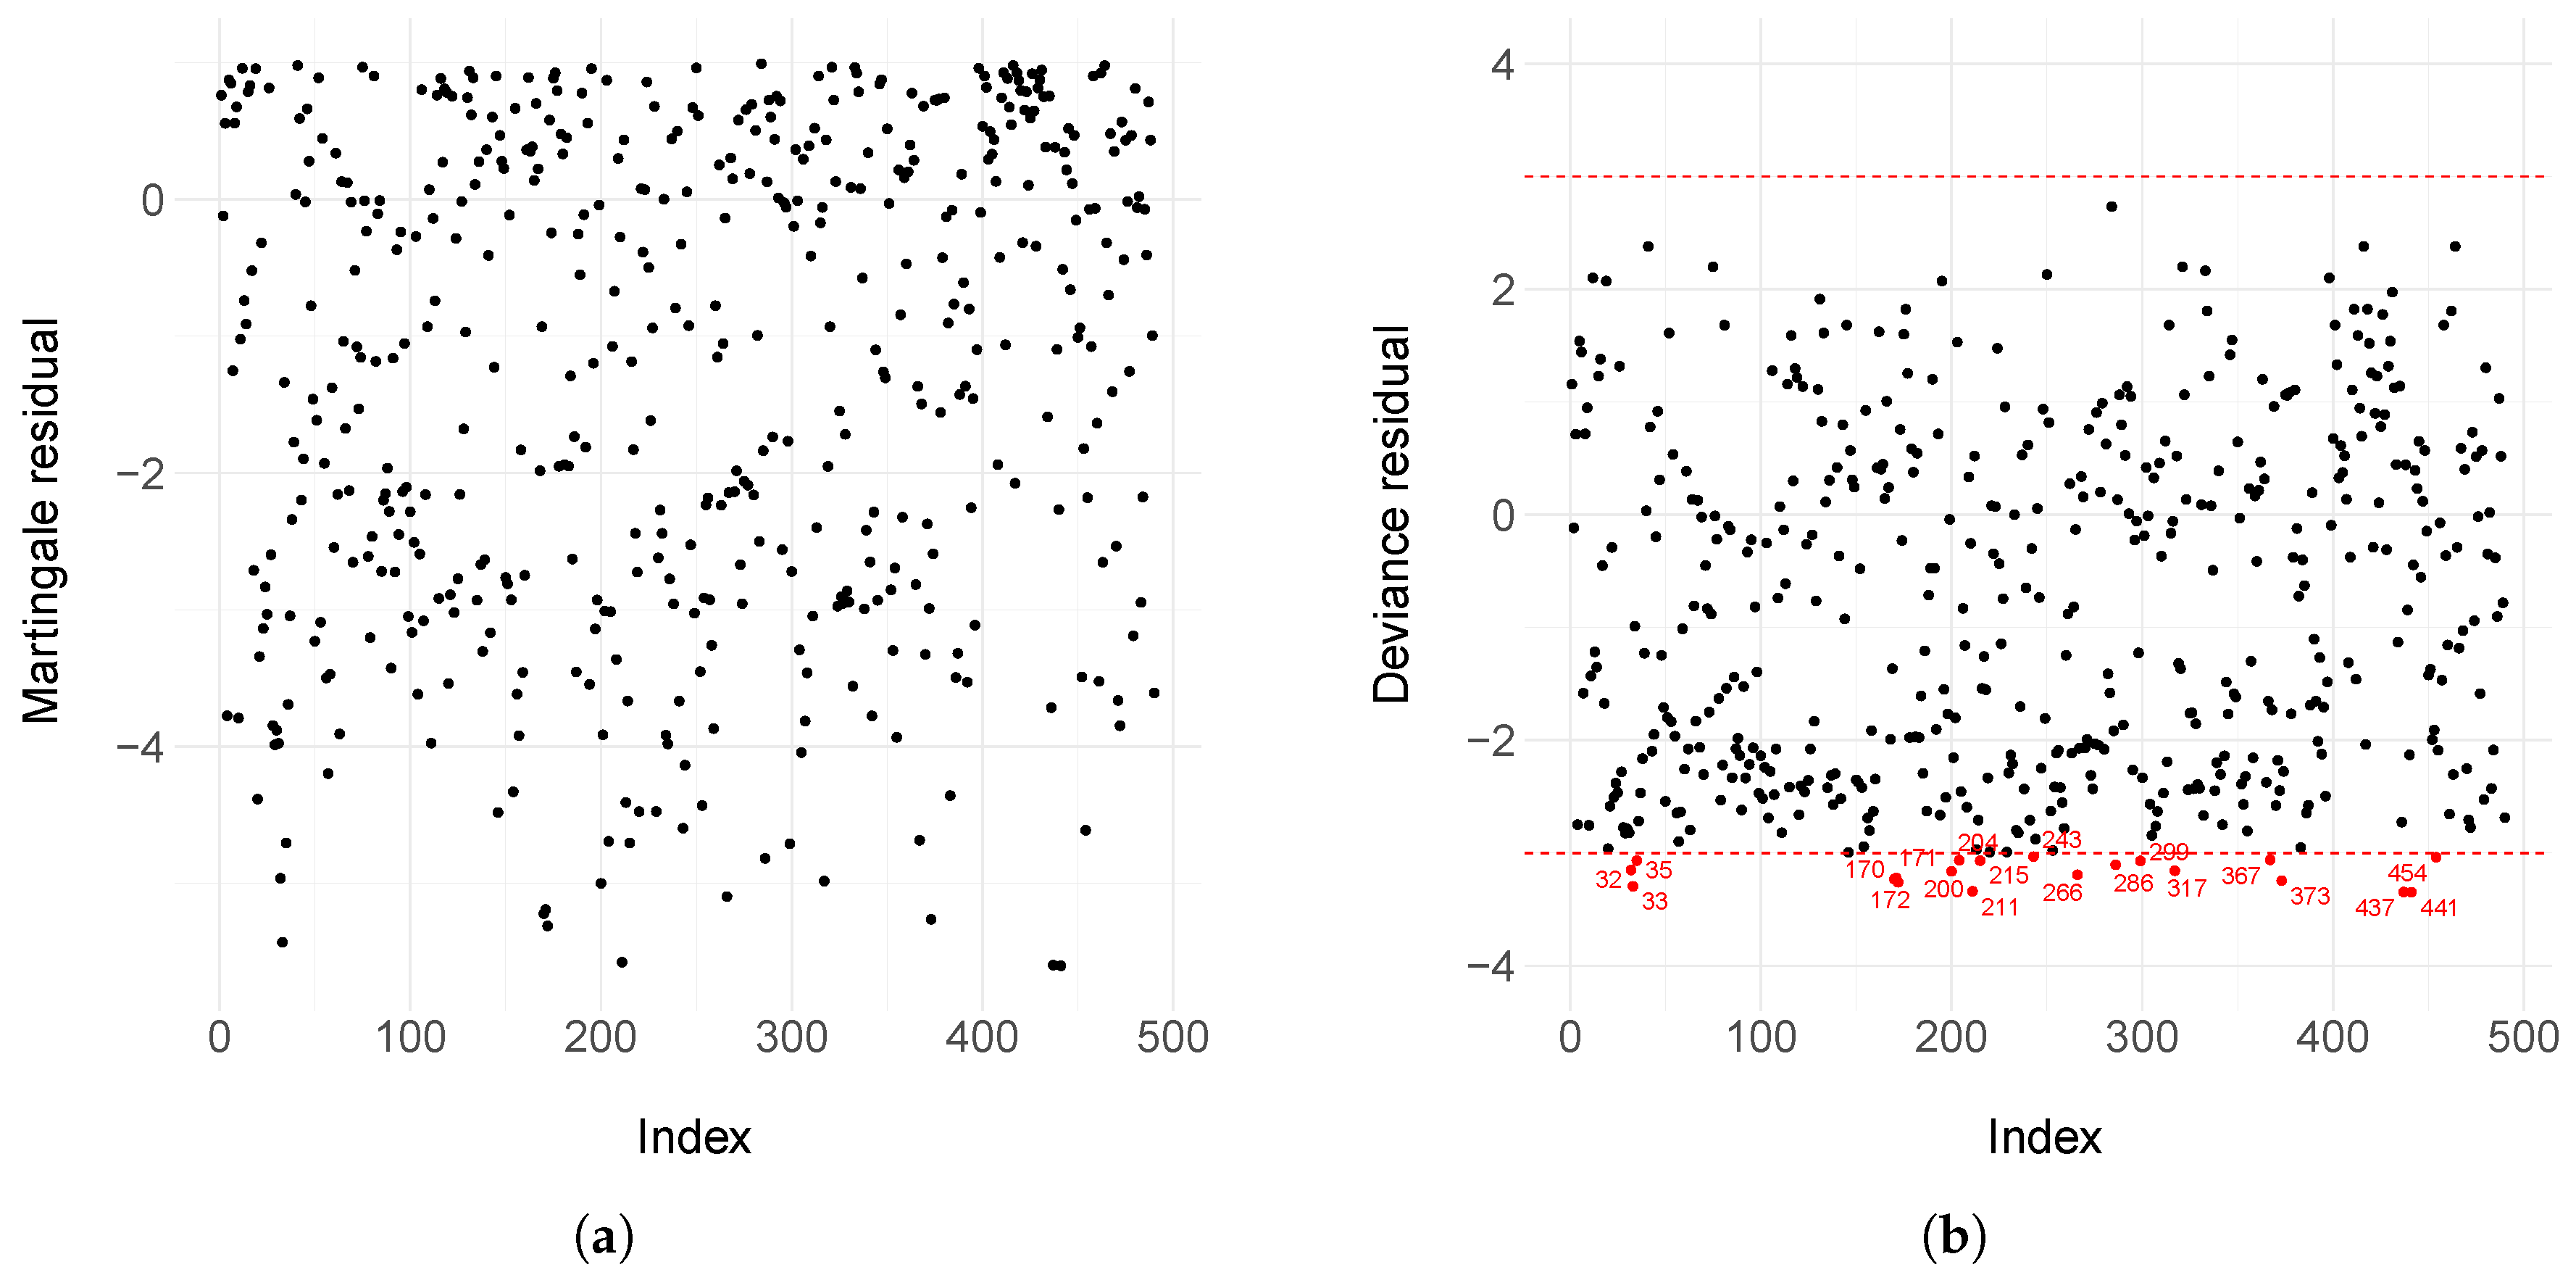
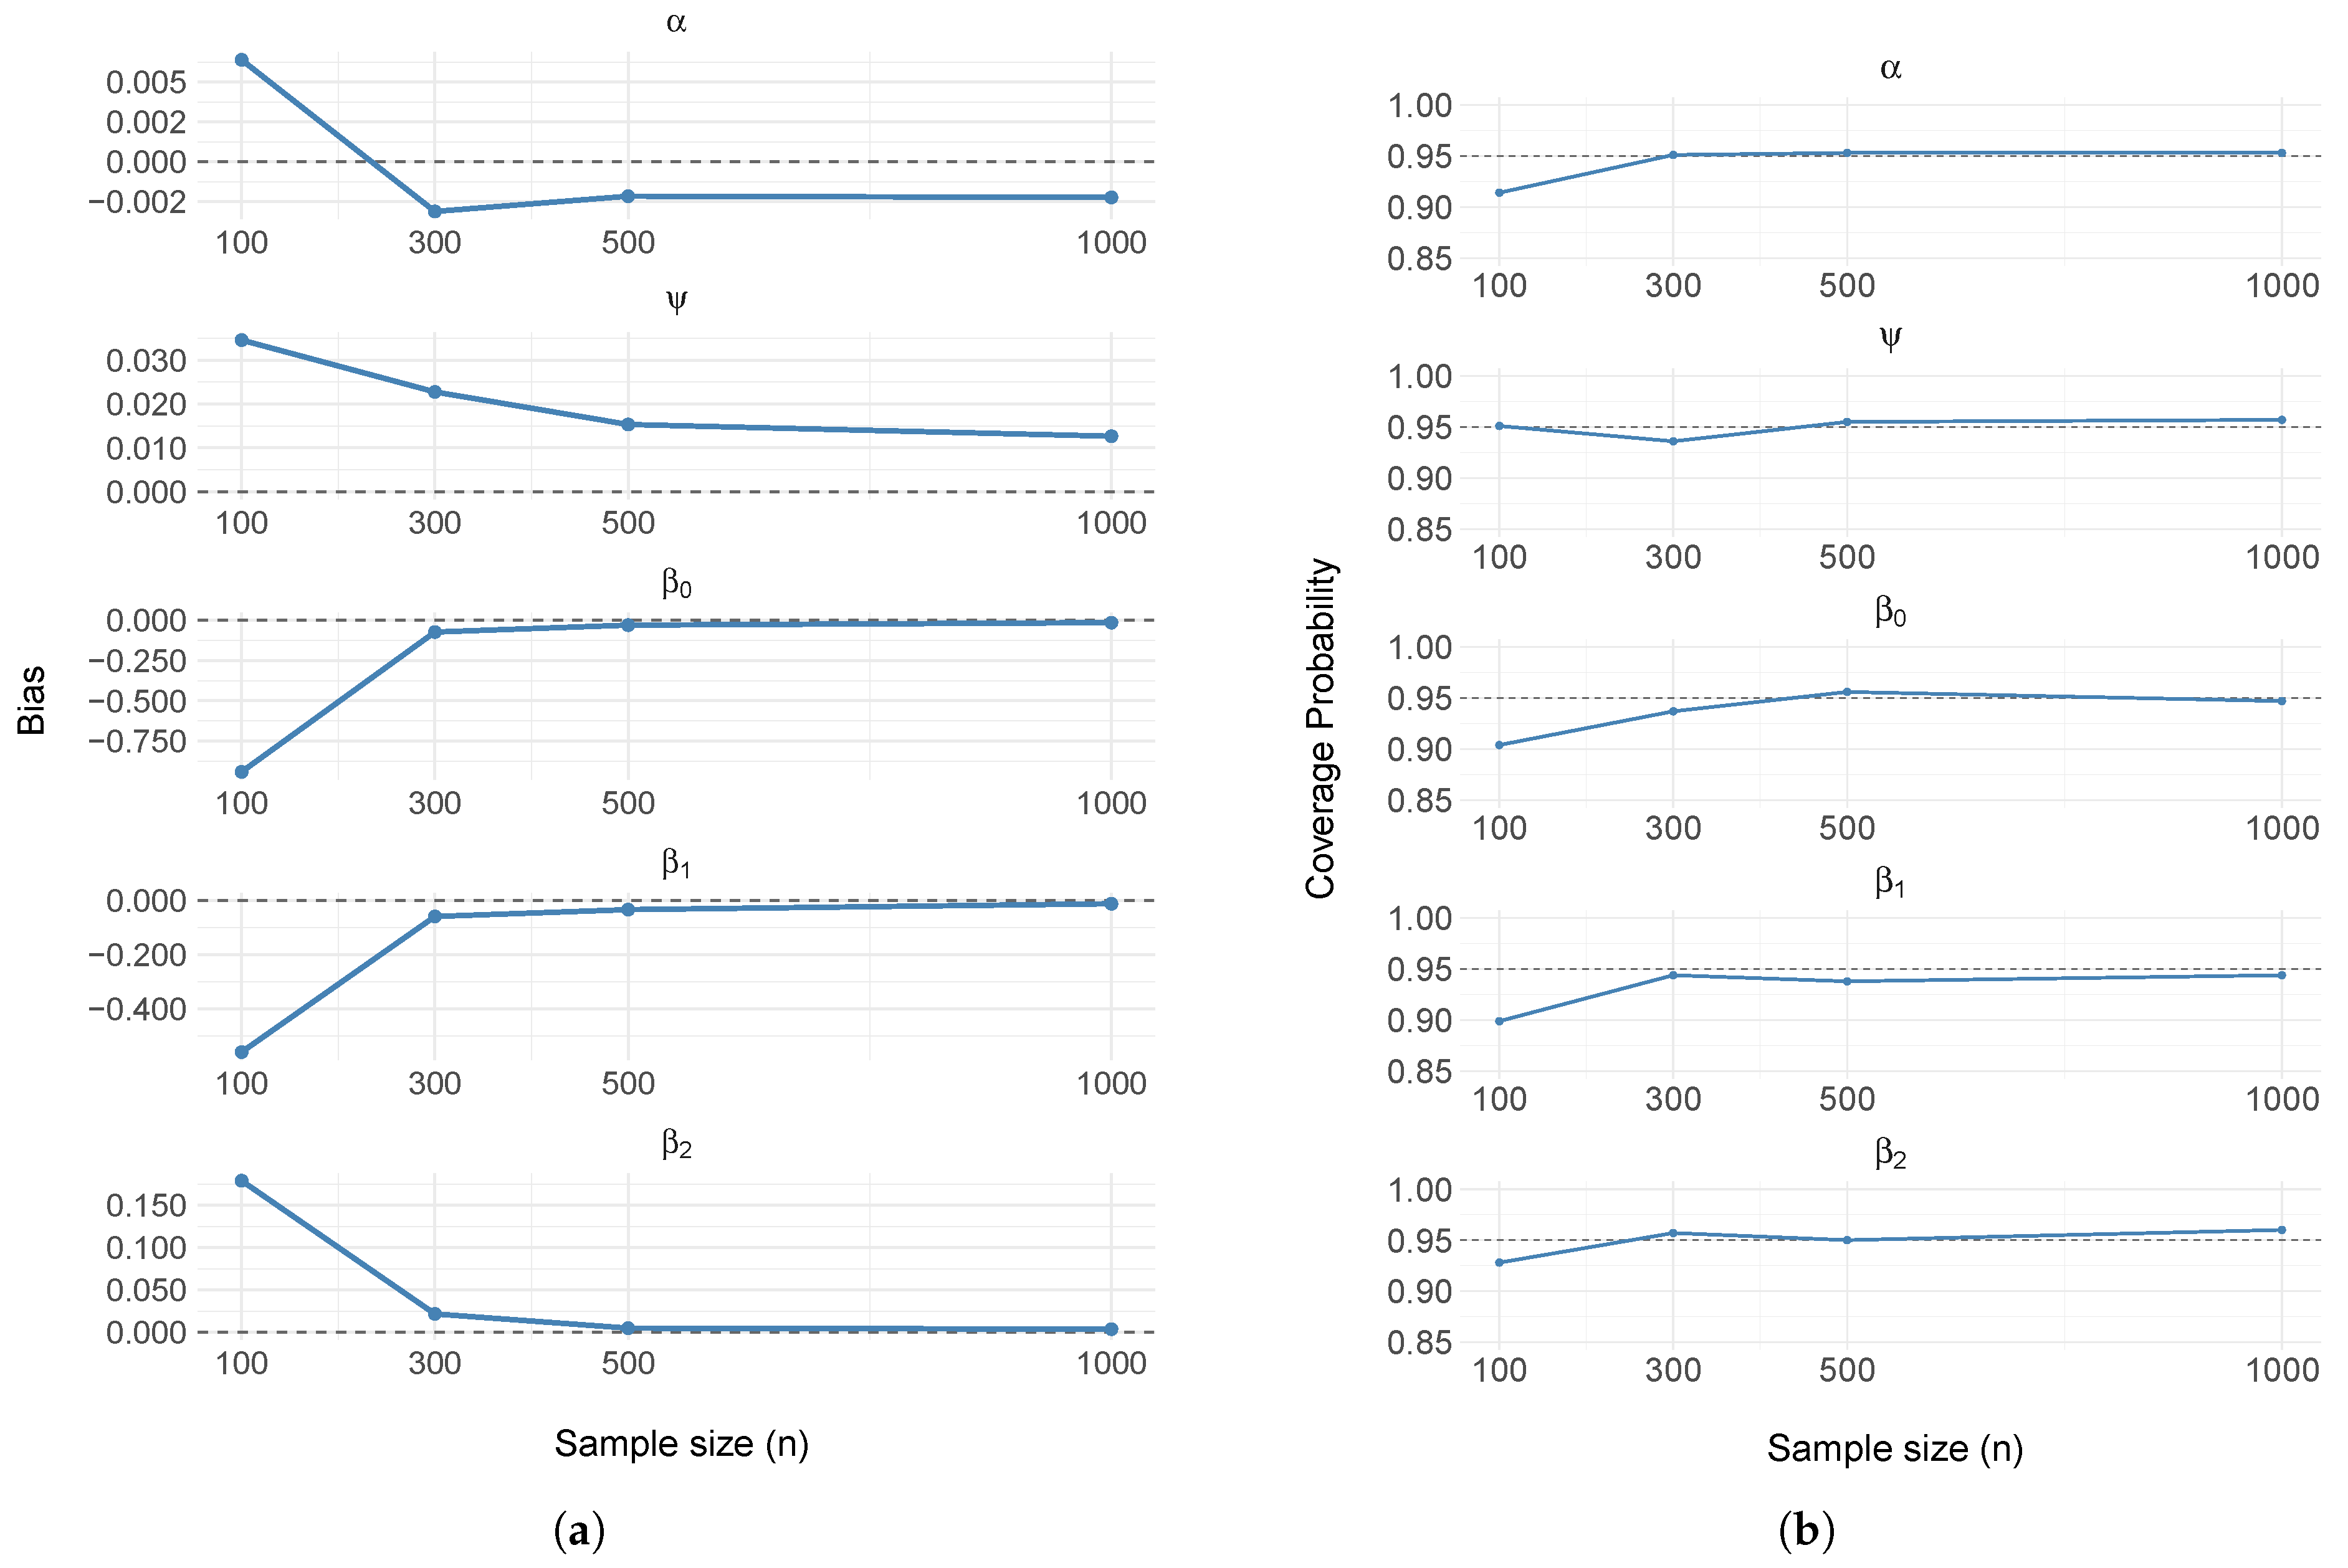
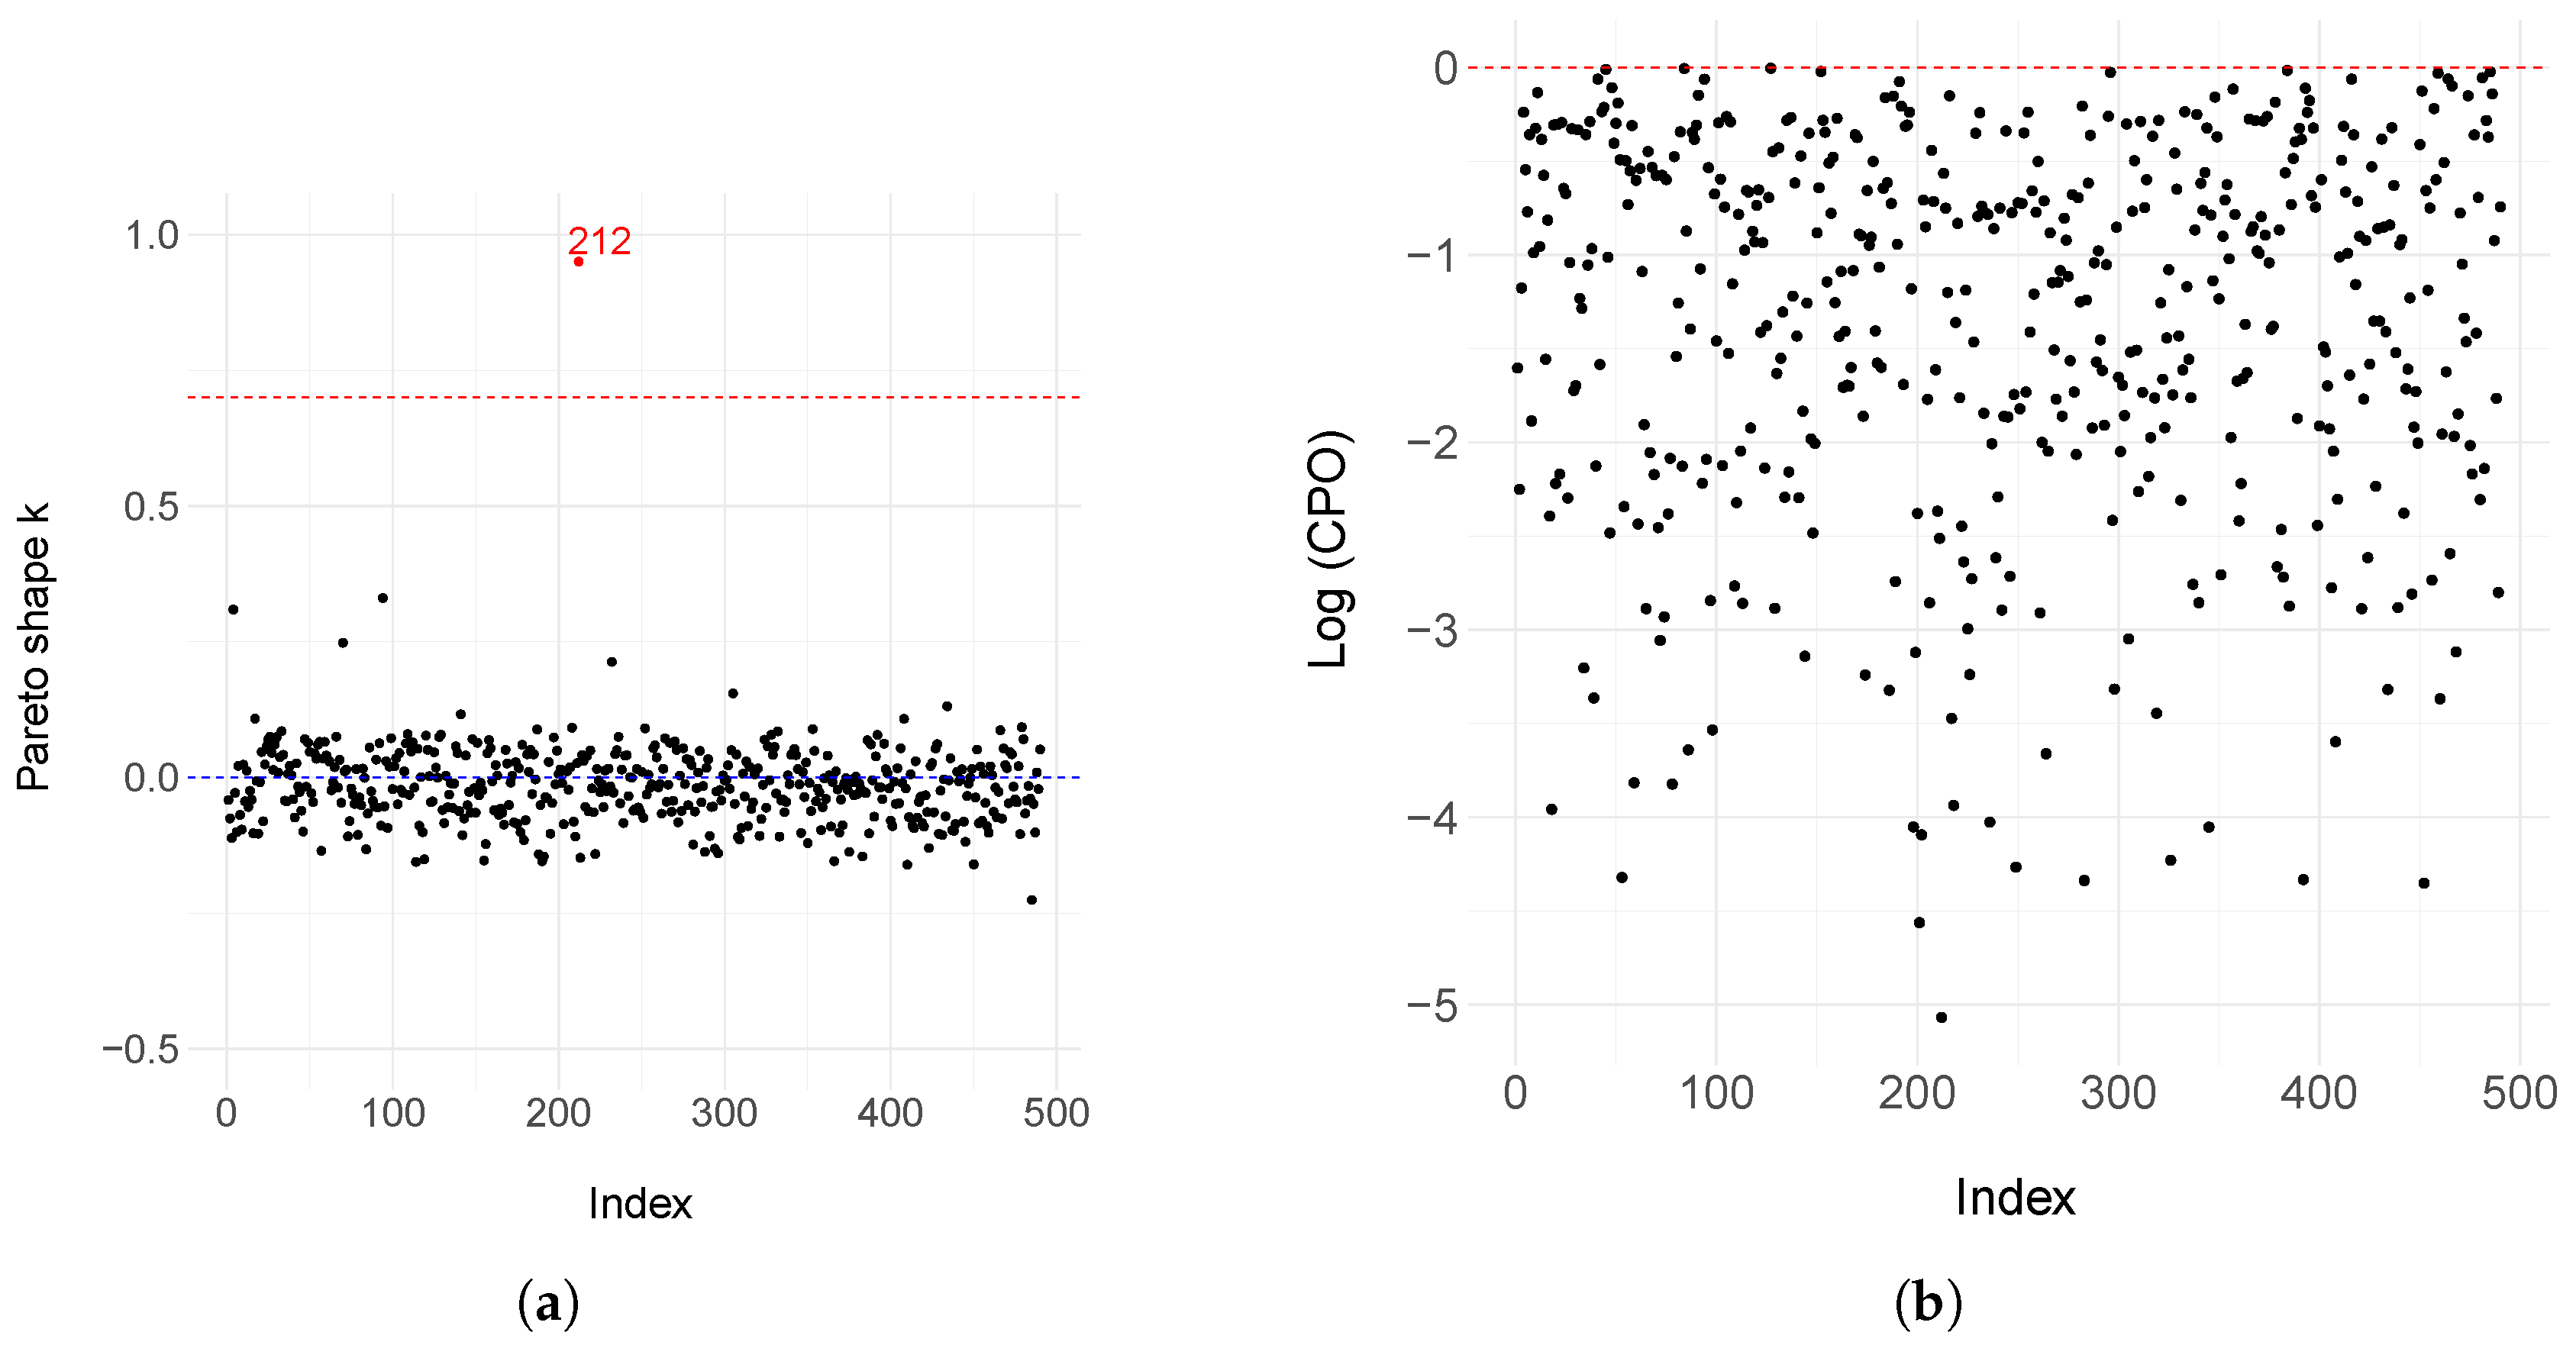
Regression Modeling for Cure Factors on Uterine Cancer Data Using the Reparametrized Defective Generalized Gompertz Distribution
Abstract
1. Introduction
2. Materials and Methods
2.1. The Defective Gompertz Distribution
2.2. The Defective Generalized Gompertz Distribution
2.3. Model with Covariates
2.4. Bayesian Inference
- (i)
- The state space is augmented by momentum parameters; therefore, the parameter vector consists of the parameters of interest and the momentum parameters;
- (ii)
- We define the Hamiltonian function as the negative value of the logarithm of the joint distribution with all parameters;
- (iii)
- The momentum of all parameters is sampled from a multivariate Gaussian, typically from the current value of the parameters;
- (iv)
- The proposal distribution of parameters of interest is defined, conditioned on the gradients of the Hamiltonian function in the current value. Then, we consider the local geometry of the distribution.
2.5. Residual Analysis
3. Results
3.1. Simulation Study
| Algorithm 1 Dataset generation algorithm from the DGGD with covariates. |
|
3.2. Motivating Dataset
4. Discussion
5. Conclusions
Author Contributions
Funding
Data Availability Statement
Acknowledgments
Conflicts of Interest
Abbreviations
| DGGD | Defective generalized Gompertz distribution |
| HIV | Human Immunodeficiency Virus |
| CDF | Cumulative distribution function |
| HMC | Hamiltonian Monte Carlo |
| MCMC | Markov Chain Monte Carlo |
| NUTS | No U-Turn Sampler |
| JAGS | Just Another Gibbs Sampling |
| FOSP | Fundação Oncocentro de São Paulo |
| HCR | Hospital Cancer Registry |
| PSIS-LOO | Pareto-smoothed importance sampling - Leave one out |
| LPLM | logarithm pseudo marginal likelihood |
| DIC | Deviance information criterion |
| CPO | Conditional predictive ordinate |
Appendix A. Model Estimation of the Defective Generalized Gompertz Distribution After Removing Influential and Outlier Observations
| Removed Data | Parameter | Mean | SD | C.I (95%) |
|---|---|---|---|---|
| {212} | Intercept | −1.3973 | 1.0447 | [−4.0915; −0.2253] |
| Age > 50 | −1.4142 | 0.4432 | [−2.5678; −0.7467] | |
| Metastasis | −1.4729 | 0.9731 | [−3.9467; 0.0110] | |
| Surgery | 1.9175 | 0.7386 | [ 1.0389; 3.8880] | |
| Chemotherapy | −0.7397 | 0.4043 | [−1.7157; −0.1142] | |
| Hormone therapy | 9.7783 | 5.0341 | [ 2.3046; 21.0769] | |
| −0.1362 | 0.0658 | [−0.2575; −0.0293] | ||
| 0.7024 | 0.0807 | [ 0.5494; 0.8641] | ||
| {284} | Intercept | −1.3975 | 1.1653 | [−4.9232; −0.2421] |
| Age > 50 | −1.3999 | 0.5414 | [−2.9091; −0.7272] | |
| Metastasis | −1.4743 | 1.1478 | [−4.4371; 0.0222] | |
| Surgery | 1.9470 | 0.8836 | [ 1.0640; 4.6306] | |
| Chemotherapy | −0.7330 | 0.4974 | [−2.2284; −0.0753] | |
| Hormone therapy | 2.5761 | 1.6771 | [−0.4502; 6.2489] | |
| −0.1442 | 0.0666 | [−0.2691; −0.0240] | ||
| 0.7236 | 0.0824 | [ 0.5736; 0.8894] | ||
| {212, 284} | Intercept | −1.1027 | 0.7712 | [−3.5164; −0.1631] |
| Age > 50 | −1.3609 | 0.3817 | [−2.3544; −0.7670] | |
| Metastasis | −1.3218 | 0.9824 | [−3.5103; 0.0167] | |
| Surgery | 1.7456 | 0.5600 | [ 1.0238; 3.3169] | |
| Chemotherapy | −0.6967 | 0.3837 | [−1.7032; −0.1046] | |
| Hormone therapy | 9.7721 | 5.2371 | [ 2.2277; 21.9298] | |
| −0.1544 | 0.0615 | [−0.2693; −0.0379] | ||
| 0.7344 | 0.0794 | [ 0.5900; 0.8948] |
Appendix B. Model Estimation and Diagnostic Assessment for the Weibull Cure Rate Model
| Parameter | Mean | SD | C.I (95%) |
|---|---|---|---|
| Intercept | 14.4195 | 6.3232 | [4.6634; 28.5369] |
| Age > 50 | 5.1642 | 7.6398 | [−8.3597; 21.6942] |
| Metastasis | 2.2384 | 8.6642 | [−13.5450; 19.8782] |
| Surgery | 4.8769 | 7.6505 | [−8.8583; 21.2047] |
| Chemotherapy | 4.6416 | 7.7020 | [−9.3570; 20.9949] |
| Hormone therapy | 2.7095 | 8.3540 | [−12.0451; 20.5551] |
| 1.5833 | 0.1250 | [1.3493; 1.8399] | |
| 0.8336 | 0.0399 | [0.7560; 0.9142] |


Appendix C. Model Selection Criteria in Bayesian Models
- (i)
- For each data point i, , a GPD is fitted to the largest 20% of the importance weightsThis is done independently for each observation using empirical Bayes estimation;
- (ii)
- The M largest weights are replaced by their expected order statistics from the fitted GPD, using the inverse cumulative distribution functionwhere M is the number of simulation draws used to fit the Pareto (in this case, ). This results in a smoothed set of weights , indexed by simulation draws s and data points i;
- (iii)
- To guarantee finite variance of the estimate, the stabilized weights are truncated at , where is the average of the smoothed weights for observation i. The final truncated weights are denoted by .
References
- Campos, L.N.; César, C.C.; Guimarães, M.D.C. Quality of life among HIV-infected patients in Brazil after initiation of treatment. Clinics 2009, 64, 867–875. [Google Scholar] [CrossRef] [PubMed]
- Bourke, L.; Boorjian, S.A.; Briganti, A.; Klotz, L.; Mucci, L.; Resnick, M.J.; Rosario, D.J.; Skolarus, T.A.; Penson, D.F. Survivorship and improving quality of life in men with prostate cancer. Eur. Urol. 2015, 68, 374–383. [Google Scholar] [CrossRef] [PubMed]
- Sugimura, H.; Yang, P. Long-term survivorship in lung cancer: A review. Chest 2006, 129, 1088–1097. [Google Scholar] [CrossRef] [PubMed]
- Vasan, N.; Baselga, J.; Hyman, D.M. A view on drug resistance in cancer. Nature 2019, 575, 299–309. [Google Scholar] [CrossRef]
- Boag, J.W. Maximum likelihood estimates of the proportion of patients cured by cancer therapy. J. R. Stat. Soc. Ser. B (Methodol.) 1949, 11, 15–53. [Google Scholar] [CrossRef]
- Berkson, J.; Gage, R.P. Survival curve for cancer patients following treatment. J. Am. Stat. Assoc. 1952, 47, 501–515. [Google Scholar] [CrossRef]
- Lambert, P.C. Modeling of the cure fraction in survival studies. Stata J. 2007, 7, 351–375. [Google Scholar] [CrossRef]
- Mazucheli, J.; Coelho-Barros, E.A.; Achcar, J.A. The exponentiated exponential mixture and non-mixture cure rate model in the presence of covariates. Comput. Methods Programs Biomed. 2013, 112, 114–124. [Google Scholar] [CrossRef]
- Balka, J.; Desmond, A.F.; McNicholas, P.D. Review and implementation of cure models based on first hitting times for Wiener processes. Lifetime Data Anal. 2009, 15, 147–176. [Google Scholar] [CrossRef]
- Rocha, R.; Nadarajah, S.; Tomazella, V.; Louzada, F. Two new defective distributions based on the Marshall–Olkin extension. Lifetime Data Anal. 2016, 22, 216–240. [Google Scholar] [CrossRef]
- Rocha, R.; Nadarajah, S.; Tomazella, V.; Louzada, F.; Eudes, A. New defective models based on the Kumaraswamy family of distributions with application to cancer data sets. Stat. Methods Med. Res. 2017, 26, 1737–1755. [Google Scholar] [CrossRef]
- Vieira Tojeiro, C.A.; Tomazella, V.; Jerez-Lillo, N.; Ramos, P.L. The Defective Beta-Gompertz Distribution for Cure Rate Regression Models. J. Stat. Theory Pract. 2025, 19, 19. [Google Scholar] [CrossRef]
- El-Gohary, A.; Alshamrani, A.; Al-Otaibi, A.N. The generalized Gompertz distribution. Appl. Math. Model. 2013, 37, 13–24. [Google Scholar] [CrossRef]
- Mudholkar, G.S.; Srivastava, D.K.; Freimer, M. The exponentiated Weibull family: A reanalysis of the bus-motor-failure data. Technometrics 1995, 37, 436–445. [Google Scholar] [CrossRef]
- Nadarajah, S.; Gupta, A.K. The exponentiated gamma distribution with application to drought data. Calcutta Stat. Assoc. Bull. 2007, 59, 29–54. [Google Scholar] [CrossRef]
- Gupta, R.D.; Kundu, D. Theory & methods: Generalized exponential distributions. Aust. New Zealand J. Stat. 1999, 41, 173–188. [Google Scholar] [CrossRef]
- Rodrigues, A.; Borges, P.; Santos, B. A defective cure rate quantile regression model for male breast cancer data. J. Appl. Stat. 2024, 52, 1485–1512. [Google Scholar] [CrossRef]
- Lehmann, E.L. The Power of Rank Tests. Ann. Math. Stat. 1953, 24, 23–43. [Google Scholar] [CrossRef]
- Gelman, A.; Carlin, J.B.; Stern, H.S.; Rubin, D.B. Bayesian Data Analysis; Chapman and Hall/CRC: New York, NY, USA, 1995. [Google Scholar]
- de Castro, M.; Gómez, Y.M. A Bayesian cure rate model based on the power piecewise exponential distribution. Methodol. Comput. Appl. Probab. 2020, 22, 677–692. [Google Scholar] [CrossRef]
- dos Santos Junior, P.C.; Schneider, S. Power piecewise exponential model for interval-censored data. J. Stat. Theory Pract. 2022, 16, 26. [Google Scholar] [CrossRef]
- Metropolis, N.; Rosenbluth, A.W.; Rosenbluth, M.N.; Teller, A.H.; Teller, E. Equation of state calculations by fast computing machines. J. Chem. Phys. 1953, 21, 1087–1092. [Google Scholar] [CrossRef]
- Hastings, W.K. Monte Carlo sampling methods using Markov chains and their applications. Biometrika 1970, 57, 97–109. [Google Scholar] [CrossRef]
- Geman, S.; Geman, D. Stochastic relaxation, Gibbs distributions, and the Bayesian restoration of images. IEEE Trans. Pattern Anal. Mach. Intell. 1984, 6, 721–741. [Google Scholar] [CrossRef] [PubMed]
- Neal, R.M. MCMC using Hamiltonian dynamics. Handb. Markov Chain Monte Carlo 2011, 2, 2. [Google Scholar]
- Duane, S.; Kennedy, A.D.; Pendleton, B.J.; Roweth, D. Hybrid Monte Carlo. Phys. Lett. B 1987, 195, 216–222. [Google Scholar] [CrossRef]
- Stan Development Team. RStan: The R Interface to Stan, R package version 2.32.7. 2025. Available online: https://mc-stan.org/ (accessed on 25 May 2025).
- Betancourt, M.; Byrne, S.; Livingstone, S.; Girolami, M. The geometric foundations of Hamiltonian Monte Carlo. Bernoulli 2017, 23, 2257–2298. [Google Scholar] [CrossRef]
- Hoffman, M.D.; Gelman, A. The No-U-Turn sampler: Adaptively setting path lengths in Hamiltonian Monte Carlo. J. Mach. Learn. Res. 2014, 15, 1593–1623. [Google Scholar]
- Monnahan, C.C.; Thorson, J.T.; Branch, T.A. Faster estimation of Bayesian models in ecology using Hamiltonian Monte Carlo. Methods Ecol. Evol. 2017, 8, 339–348. [Google Scholar] [CrossRef]
- Astfalck, L.; Hodkiewicz, M. Hamiltonian Monte Carlo sampling for Bayesian hierarchical regression in prognostics. PHM Soc. Asia Pac. Conf. 2017, 1. [Google Scholar] [CrossRef]
- Therneau, T.M.; Grambsch, P.M.; Fleming, T.R. Martingale-based residuals for survival models. Biometrika 1990, 77, 147–160. [Google Scholar] [CrossRef]
- Pather, S.; O’Leary, M.; Carter, J. Endometrial cancer and its management. Women’S Health 2007, 3, 45–54. [Google Scholar] [CrossRef]
- Jemal, A.; Tiwari, R.C.; Murray, T.; Ghafoor, A.; Samels, A.; Ward, E.; Feuer, E.J.; Thun, M.J. Cancer statistics, 2004. CA Cancer J. Clin. 2004, 54, 8–29. [Google Scholar] [CrossRef]
- Parkin, D.M.; Pisani, P.; Ferlay, J. Global cancer statistics. CA Cancer J. Clin. 1999, 49, 33–64. [Google Scholar] [CrossRef]
- Major, F.J.; Blessing, J.A.; Silverberg, S.G.; Morrow, C.P.; Creasman, W.T.; Currie, J.L.; Yordan, E.; Brady, M.F. Prognostic factors in early-stage uterine sarcoma: A gynecologic oncology group study. Cancer 1993, 71 (Suppl. S4), 1702–1709. [Google Scholar] [CrossRef] [PubMed]
- Giuntoli, R.L.; Metzinger, D.S.; DiMarco, C.S.; Cha, S.S.; Sloan, J.A.; Keeney, G.L.; Gostout, B.S. Retrospective review of 208 patients with leiomyosarcoma of the uterus: Prognostic indicators, surgical management, and adjuvant therapy. Gynecol. Oncol. 2003, 89, 460–469. [Google Scholar] [CrossRef] [PubMed]
- Vehtari, A.; Gelman, A.; Gabry, J. Practical Bayesian model evaluation using leave-one-out cross-validation and WAIC. Stat. Comput. 2017, 27, 1413–1432. [Google Scholar] [CrossRef]
- Boggess, J.F.; Kilgore, J.E.; Tran, A.-Q. Uterine cancer. In Abeloff’s Clinical Oncology; Elsevier: Amsterdam, The Netherlands, 2020; pp. 1508–1524. [Google Scholar]
- Green, J.A.; Kirwan, J.M.; Tierney, J.F.; Symonds, P.; Fresco, L.; Collingwood, M.; Williams, C.J. Survival and recurrence after concomitant chemotherapy and radiotherapy for cancer of the uterine cervix: A systematic review and meta-analysis. Lancet 2001, 358, 781–786. [Google Scholar] [CrossRef]
- Lee, N.K.; Cheung, M.K.; Shin, J.Y.; Husain, A.; Teng, N.N.; Berek, J.S.; Kapp, D.S.; Osann, K.; Chan, J.K. Prognostic factors for uterine cancer in reproductive-aged women. Obstet. Gynecol. 2007, 109, 655–662. [Google Scholar] [CrossRef]
- Chen, M.-H.; Ibrahim, J.G. Bayesian predictive inference for time series count data. Biometrics 2000, 56, 678–685. [Google Scholar] [CrossRef]
- Spiegelhalter, D.J.; Best, N.G.; Carlin, B.P.; Van Der Linde, A. Bayesian measures of model complexity and fit. J. R. Stat. Soc. Ser. B (Stat. Methodol.) 2002, 64, 583–639. [Google Scholar] [CrossRef]
- Vehtari, A.; Gelman, A.; Gabry, J. Efficient implementation of leave-one-out cross-validation and WAIC for evaluating fitted Bayesian models. arXiv 2015, arXiv:1507.04544. [Google Scholar]
- Peruggia, M. On the variability of case-deletion importance sampling weights in the Bayesian linear model. J. Am. Stat. Assoc. 1997, 92, 199–207. [Google Scholar] [CrossRef]
- Epifani, I.; MacEachern, S.N.; Peruggia, M. Case-deletion importance sampling estimators: Central limit theorems and related results. Electron. J. Stat. 2008, 2, 774–806. [Google Scholar] [CrossRef]


| Parameter | Mean | SD | C.I (95%) |
|---|---|---|---|
| Intercept | −1.3625 | 1.0914 | [−5.0000; −0.2572] |
| Age > 50 | −1.3333 | 0.4675 | [−2.6774; −0.7029] |
| Metastasis | −1.4899 | 1.2310 | [−5.5832; 0.0135] |
| Surgery | 1.8800 | 0.8130 | [ 1.0414; 4.4872] |
| Chemotherapy | −0.6978 | 0.4699 | [−1.9691; −0.0611] |
| Hormone Therapy | 2.6224 | 1.6631 | [−0.3416; 6.3090] |
| −0.1445 | 0.0641 | [−0.2648; −0.0246] | |
| 0.7111 | 0.0789 | [ 0.5616; 0.8709] |
| Model | DIC | PSIS-LOO | −2*LPLM |
|---|---|---|---|
| Generalized Gompertz | 1315.76 | 1325.42 | 1325.44 |
| Gompertz | 1328.69 | 1331.40 | 1331.59 |
Disclaimer/Publisher’s Note: The statements, opinions and data contained in all publications are solely those of the individual author(s) and contributor(s) and not of MDPI and/or the editor(s). MDPI and/or the editor(s) disclaim responsibility for any injury to people or property resulting from any ideas, methods, instructions or products referred to in the content. |
© 2025 by the authors. Licensee MDPI, Basel, Switzerland. This article is an open access article distributed under the terms and conditions of the Creative Commons Attribution (CC BY) license (https://creativecommons.org/licenses/by/4.0/).
Share and Cite
Silva-Neto, D.; Louzada-Neto, F.; Tomazella, V.L. Regression Modeling for Cure Factors on Uterine Cancer Data Using the Reparametrized Defective Generalized Gompertz Distribution. Math. Comput. Appl. 2025, 30, 93. https://doi.org/10.3390/mca30050093
Silva-Neto D, Louzada-Neto F, Tomazella VL. Regression Modeling for Cure Factors on Uterine Cancer Data Using the Reparametrized Defective Generalized Gompertz Distribution. Mathematical and Computational Applications. 2025; 30(5):93. https://doi.org/10.3390/mca30050093
Chicago/Turabian StyleSilva-Neto, Dionisio, Francisco Louzada-Neto, and Vera Lucia Tomazella. 2025. "Regression Modeling for Cure Factors on Uterine Cancer Data Using the Reparametrized Defective Generalized Gompertz Distribution" Mathematical and Computational Applications 30, no. 5: 93. https://doi.org/10.3390/mca30050093
APA StyleSilva-Neto, D., Louzada-Neto, F., & Tomazella, V. L. (2025). Regression Modeling for Cure Factors on Uterine Cancer Data Using the Reparametrized Defective Generalized Gompertz Distribution. Mathematical and Computational Applications, 30(5), 93. https://doi.org/10.3390/mca30050093


