Abstract
This study is the first to investigate the performance of ultraviolet germicidal irradiation (UVGI) in underfloor air distribution (UFAD) systems. A simplified mathematical model is developed to predict airborne pathogen transport and inactivation by upper room UVGI in UFAD spaces. The proposed model is substantiated for the SARS-CoV-2 virus as a simulated pathogen through a comprehensive computational fluid dynamics methodology validated against published experimental data of upper room UVGI and UFAD flows. Simulations show an 11% decrease in viral concentration within the upper irradiated zone when a 15 W louvered germicidal lamp is utilized. Finally, a case study on Mycobacterium tuberculosis (M. tuberculosis) bacteria is carried out using the validated simplified model to optimize the use of return air and UVGI implementation, ensuring acceptable indoor air quality and enhanced energy efficiency. Results reveal that the UFAD-UVGI system may consume up to 13.6% less energy while keeping the occupants at acceptable levels of M. tuberculosis concentration and UV irradiance when operated with 26% return air and a UVGI output of 72 W.
1. Introduction
Ultraviolet germicidal irradiation is an effective method for disinfecting indoor air and preventing the transmission of infectious diseases. This technique utilizes short-wave ultraviolet radiation, primarily at a wavelength of 254 nm, emitted by low-pressure mercury vapor lamps. This radiation damages the DNA of microorganisms, rendering them unable to replicate [1]. Wells and Fair (1935) were the first to demonstrate the principle of airborne infection and the effectiveness of UVGI in deactivating airborne microorganisms. Historically, UVGI has been crucial in controlling outbreaks of serious diseases like measles and tuberculosis. The recent COVID-19 pandemic has renewed interest in its application.
One common UVGI method is the upper room (UR) UVGI system, often used in occupied buildings to control airborne infections. UR-UVGI systems involve mounting UV fixtures in the upper part of a room, dividing it vertically into an upper irradiated zone and a lower occupied zone. To minimize the risk of skin and eye injuries, the American Conference of Governmental Industrial Hygienists mandates maintaining UV irradiance in the lower zone at or below 0.2 µW/cm2. It is then recommended to install UVGI fixtures at a minimum height of 2 m to prevent skin and eye injuries in occupants [2].
The effectiveness of UVGI disinfection depends on the type of microorganism and the UV dose received, which is determined by UV intensity and exposure time [3,4]. Therefore, the ventilation regime significantly influences UVGI’s efficacy in disinfecting indoor air as airflow patterns govern the transport of bio-aerosols and, consequently, their residence time in the irradiated zone.
Yao et al. [5] used computational fluid dynamics (CFD) to determine that at a ventilation rate of 6 ACH, UR-UVGI with an irradiation zone covering 20% of the space and an irradiation flux of 5 μW/cm2 achieved an average virus reduction of 70.44% in dental clinics, surpassing the effectiveness of doubling the ventilation rate from 6 to 12 ACH without UR-UVGI. McDonagh et al. [6] experimentally investigated the performance of a UR-UVGI system consisting of two UV outputs of 36 W and 72 W in a climatic chamber under two different ventilation regimes. They reported that at a ventilation rate of 3 ACH, a disinfection rate of 96% could be achieved for airborne Staphylococcus aureus bacteria. Karam et al. [7] studied the use of UR-UVGI for indoor air cleaning in conjunction with a pulsating jet ventilation system in classrooms. Their study found that this approach led to a reduction in pathogen concentrations by up to 58% within the breathing zone.
As air interactions between the occupied zone and the UVGI zone are vital for the high efficacy of UR-UVGI systems, the germicidal system is more effective in indoor environments with mixing ventilation compared to stratified environments such as those conditioned with displacement ventilation [8,9]. In these systems, air mixing between the upper irradiated zone and the lower zone is minimal, which significantly reduces the efficacy of UVGI in improving indoor air quality (IAQ). To enhance UR-UVGI performance and achieve better IAQ, the use of a ceiling fan is recommended to facilitate air mixing between the upper and lower zones of the room [10,11].
Another strategy for improving UR-UVGI effectiveness in stratified environments involves recirculating a fraction of the return air, which is typically extracted from the upper irradiated zone, and mixing it with the fresh air at the supply. This energy-efficient approach takes advantage of the relatively low pathogen concentration in the return air, resulting from the high disinfection rate in the upper irradiated zone. Won et al. [12] reported a 96.7% increase in the UVGI disinfection rate in a displacement ventilation system when 88% of the return air was recirculated. Kanaan et al. [13] conducted both modeling and experimental studies to evaluate the effectiveness of UR-UVGI in disinfecting a combined chilled ceiling and mixed displacement ventilation system. Their findings revealed a reduction in the airborne Serratia marcescens concentration of 78–88%, depending on the size of the bacteria-carrying droplets.
While the performance of upper room ultraviolet germicidal irradiation (UR-UVGI) has been investigated across various air conditioning systems and ventilation strategies, its effectiveness in underfloor air distribution (UFAD) systems remains unexplored. In UFAD systems, conditioned air is delivered through floor-mounted diffusers at velocities that fall between those typical of mixing and displacement ventilation. These systems are particularly well-suited for office environments with underfloor plenums, which serve as pathways for cooled air to reach the supply diffusers.
The interactions between the supply air jets and rising thermal plumes create two distinct zones within the UFAD space: a lower mixed zone and an upper unidirectional zone, essentially the reverse of what occurs in displacement ventilation. This configuration results in a reduced UV exposure time within the upper irradiated zone, thereby diminishing the disinfection efficiency of UR-UVGI in UFAD environments.
Heidarinejad et al. [14] examined UFAD systems with respect to thermal comfort, IAQ, and energy performance using CFD coupled with the Taguchi optimization algorithm. Their results suggest that optimal UFAD performance is achieved with a supply airflow rate of 4 ACH at a temperature of 19 °C, and a return vent positioned 1.6 m above the floor. Similarly, Wang et al. [15] found that thermal comfort in UFAD systems is maximized when the supply diffuser is positioned 0.7 m from the occupant, with supply air conditions maintained at a temperature range of 18–20 °C and a velocity of 1.2–1.5 m/s.
Kanaan et al. [16] investigated evaporative-cooled (EC) UFAD systems in temporary office settings within arid climates. Their findings indicated that a solar-powered EC-UFAD system could reduce grid electricity consumption by up to 93.5% compared to a vapor compression-based UFAD system, while maintaining equivalent levels of thermal comfort.
Cheong et al. [17] conducted simulation-based research on the role of UFAD in mitigating the spread of airborne pathogens in classroom environments. Their results show that UFAD systems are more effective than conventional mixing ventilation in reducing pathogen concentrations, particularly in areas distant from the source.
The aim of this paper is to evaluate the performance of UR-UVGI within UFAD systems using both analytical methods and CFD modeling. The UFAD space is virtually divided into horizontal layers and the lumped pathogen concentration in each layer is determined by applying the governing balances associated with the interactions of the thermal plumes and supply fountains with the room air. The germicidal effect is included as a sink term in the conservation equations. The analytical model is substantiated through CFD simulations for a UFAD space with SARS-CoV-2 generation. Finally, it is applied in a case study on airborne M. tuberculosis bacteria, where return air optimization enhances the energy efficiency of the UFAD system integrated with UR-UVGI while ensuring acceptable IAQ in accordance with WHO recommendations. This study suggests that it is the airborne pathogen, and not the CO2 concentration, that determines IAQ in indoor stratified environments [18,19,20].
2. Materials and Methods
This study will model airborne pathogen dispersion and inactivation by UR-UVGI in UFAD paces using both analytical and CFD approaches for IAQ analysis and cross-infection control. Additionally, the use of return air will be considered to enhance energy efficiency by reducing the cooling coil load of the system. The gravitational settling of pathogen-carrying particles is disregarded, as approximately 90% of human expiratory droplets evaporate within milliseconds into droplet nuclei (1–5 μm) that remain airborne for extended periods [19,20]. Consequently, the concentration of pathogenic droplet nuclei will be treated as a passive scalar transported by the air and expressed in parts per million (ppm) by volume. The model operates on the premise that pathogenic droplets are always emitted in conjunction with a heat source, with all droplets being carried upward by the thermal plume rising above it. Therefore, the model is suitable for droplets produced during low-momentum expiratory activities, such as breathing and talking. These droplets are unlikely to penetrate the thermal plume generated by an infected individual or disperse into the surrounding room air. Instead, they are consistently transported upward by the plume.
In our modeling approach, we use cylinder-shaped heat sources with equal heat output to simplify the analysis of thermal plume dynamics in the indoor environment. It is assumed that all walls are adiabatic, with conduction and radiation effects disregarded. The modeled UR-UVGI system features low-pressure mercury UV lamps with horizontal louvers to minimize UV irradiance levels in the occupied zone for safety reasons.
2.1. Analytical Modeling
UFAD systems supply cooled air through floor-mounted diffusers, allowing it to rise naturally through the conditioned space. The air then flows upward to the ceiling, where it is typically returned via ceiling-mounted return grills. This system relies on the buoyancy of warm air, which rises as it heats up, creating a natural convective airflow that carries air contaminants upwards. A density interface is established, dividing the space into two zones: a mixed lower zone with cooler, cleaner air and a unidirectional upper zone with warmer, contaminated air [21]. The flow dynamics are influenced by several factors, including the temperature differential between the floor and ceiling, the supply air flow rate, the heat loads, and the placement of supply and return diffusers.
The modeled UFAD-UV system features multiple supply diffusers and equal heat sources, with or without pathogen emission, along with UR-UVGI devices. In this model, the simulated fluid volume is categorized into a contaminated plume zone and a room air zone, reflecting the substantial differences in species concentration levels within and outside the plume. To predict the concentration profiles of pathogenic droplet nuclei in these two zones, it is essential to identify and quantify the physical phenomena governing species dispersion. These phenomena include vertical convection, room air entrainment driven by thermal plumes and turbulent fountains, the lateral diffusion of contaminants into the surrounding air, and vertical diffusion across adjacent layers. The corresponding mass interactions are calculated using empirical correlations for thermal plumes and supply fountain models found in the literature.
The simplified multilayer model of the UFAD space employs a physical approach, conceptually dividing the space into horizontal layers due to the stratified nature of UFAD flows [22,23]. In this study, five horizontal air layers are defined based on the following interface levels: the density interface height, the supply jet throw height, the thermal plume terminal height, and the UV zone height.
In UFAD spaces, the density interface is considered an indicator of good IAQ if it is above 1.2 m (sitting height), as it determines the height of the occupied zone. The plume terminal height is defined as being the level at which the temperature gradient vanishes and the plume spreads horizontally. The unidirectional flow region above the terminal height of the plume is divided into two layers since the UVGI does not cover the entire region. The schematic of the space model showing the different air layers and the physical phenomena affecting species transport is depicted in Figure 1.
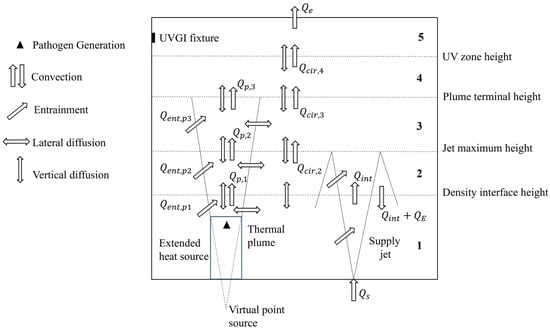
Figure 1.
Schematic of the UFAD space model and transport phenomena.
The supply jet, delivered at flow rate Qs by a floor-mounted diffuser, entrains adjacent room air (QE), reaches its maximum height, then reverses direction and falls back (QE + Qint) upon the diffuser, resulting in a relatively mixed lower zone. The term Qint represents the volume of the supply fountain at the density interface. In the region above the density interface, an upward flow develops (Qcir). Air heated by heat sources rises due to buoyancy forces, transporting contaminants upward towards the ceiling, where they are extracted by the exhaust/return grill. The thermal plume flow rate (Qp) increases with height as the plume entrains adjacent air (Qent). Vertical diffusion is assumed to occur between adjacent layers, while radial diffusion is considered from the contaminated plume into the surrounding air.
The simulation parameters must be carefully selected so that the dynamics of the supply jet and thermal plumes align with the above layering of the UFAD space. The heat sources present in the UFAD space must be identical for a single plume’s terminal height. Additionally, calculations must be performed to ensure that the supply jet surpasses the density interface without reaching the plume’s terminal height, and that the density gradients vanish in the rising air, allowing the plume to spread horizontally before reaching the ceiling.
Analyzing thermal plumes is essential for understanding airflow patterns in UFAD spaces and how buoyancy-driven flows interact with the surrounding indoor air. Moreover, thermal plumes are instrumental in facilitating the upward diffusion and dispersion of contaminants carried within the human exhaled air stream [24]. The empirical correlations of Mundt [25] for thermal plumes in stratified indoor environments are used to determine the plume parameters needed for the current model.
The terminal height the thermal plume is given by:
where Φ is the heat source power output and dT/dz is the vertical temperature gradient of the room. The plume flow rates at different heights are calculated as follows:
where the parameter m is a function of the height measured from the virtual point source corresponding to the cylindrical heat source. The detailed calculations can be found in [26].
Although not all heat sources emit pathogenic droplets, multiple heat sources are lumped into a single source with equivalent heat output and airborne pathogen generation in the simplified approach. This approximation is reasonable because the density interface height is governed by the sum of the flow rates of all thermal plumes rising above the heat sources.
To develop the airborne pathogen transport equations in UVGI spaces, our multilayer model in [27] is extended to include air disinfection by UR-UVGI. The multilayer model solves the contaminant balances for airflow and determines the density interface for a given supply condition, heat source intensity, pathogenic emission rate, and UV power output. The model considers the fundamental physics of the ventilation problem to estimate the volume-averaged pathogen concentration in each air layer. This model is founded on plume theory for heat sources and the fountain model for supply diffusers, incorporating the interactions between thermal plumes, supply jets, and the surrounding air, as well as the UV inactivation of airborne pathogens. The germicidal effect is treated as a sink term in the pathogen balance equation of the upper irradiated air layer.
This analytical model for airborne pathogen transport and inactivation via UR-UVGI is formulated based on contaminant balance calculations for each layer, encompassing both room air and contaminated plumes, within a typical UFAD room featuring a uniform UV field in the upper layer. The circulated air volume at each interface is calculated as:
The steady-state balance of the pathogenic droplet nuclei for the room air in Layer 1 is given by:
where Cs is the concentration of pathogenic droplet nuclei in the supply air stream. In the case of return air recirculation, the following equation is used at the supply, assuming the outdoor fresh air is free of pathogens, where x is the return air ratio.
In Equation (5), Qint is the fountain volume at the density interface and is calculated using the correlation from Rodi [28] and QE is the penetrative entrained volume flux across the density interface obtained using an entrainment coefficient of 0.6 [21]. The third term on the left-hand side is diffusion with Layer 2 through the interface of area A1. Only the central up-flows of the jets are accounted for, while the region defined by the surrounding annular down-flows is disregarded. The fourth term represents lateral diffusion from the contaminated plume to the adjacent room air through the lateral surface area of the plume Al,1.
A parabolic profile is assumed for the concentration of pathogenic droplet nuclei within the plume that varies with both radial coordinate r and vertical coordinate z [29]. The molecular diffusivity D is augmented by adding the Eddy diffusivity Dt because of turbulence at the boundaries of the plume.
The pathogenic droplet nuclei balances for room air in Layers 2 and 3 are given, respectively, by:
As the thermal plume expands horizontally at its terminal height, air entrainment is not found in the single-zone Layer 4, for which the pathogenic droplet nuclei balance is given by:
For the upper UV-irradiated zone (Layer 5), the pathogen balance is given by
where Qe is the exhaust flow rate. The term ZEVu is the UV inactivation term, where Z is the pathogen susceptibility to UV, E is the intensity of upper room UV field, and Vu is the volume of the UV zone.
The balance for pathogenic droplet nuclei inside the plume in Layer k is expressed as follows:
The first term on the left-hand side of Equation (10) corresponds to the plume convective flow exiting Layer k − 1 and entering the plume control volume in Layer k. The second term accounts for entrainment from the adjacent room air, while the third term represents the generation of pathogenic droplet nuclei within Layer k. On the right-hand side, the terms denote flows leaving the control volume through convection, vertical diffusion, and radial diffusion, respectively.
The first term on the left-hand side of Equation (10) is the plume convective flow leaving and entering the plume control volume in Layer k. The second term represents entrainment from the adjacent room air. The third term is the pathogenic droplet generation in Layer k. The right-hand side terms represent flows leaving the control volume by convection, vertical diffusion, and radial diffusion, respectively.
The above transport equations are discretized using the finite difference method and they are solved using MATLAB 13.0.10 for the concentrations of pathogenic droplet nuclei in the room air C1 to C5 and inside plumes Cp,1 to Cp,3. The detailed numerical solution methodology was presented in [27]. The results of the developed analytical model will be compared to those produced by CFD. The air quality will be evaluated based on the pathogenic droplet nuclei concentration levels in the occupied zone.
2.2. CFD Modeling
To substantiate the analytical model, a comprehensive three-dimensional CFD model is developed using ANSYS Fluent 15.0. This simulation replicates a standard UFAD space with upper room UVGI, providing insights into indoor air dynamics, airflow characteristics, and the dispersion of pathogenic droplet nuclei.
2.2.1. Simulated Geometry
The simulated space measures 3.2 × 4.6 × 2.4 m and is equipped with a wall-mounted UVGI fixture containing a 15 W germicidal lamp with horizontal louvers, positioned with its centerline 2 m above the floor. The room dimensions and UVGI settings match those of the test room in [30] for validating the present CFD-UV model against their experimental data of UV irradiance. This placement of the UV fixture forms an irradiated zone with a depth of 60 cm [30,31]. The UFAD system consists of six supply diffusers, each 15 × 15 cm in size, and a 0.4 × 0.4 m exhaust vent located at the ceiling, as illustrated in Figure 2.
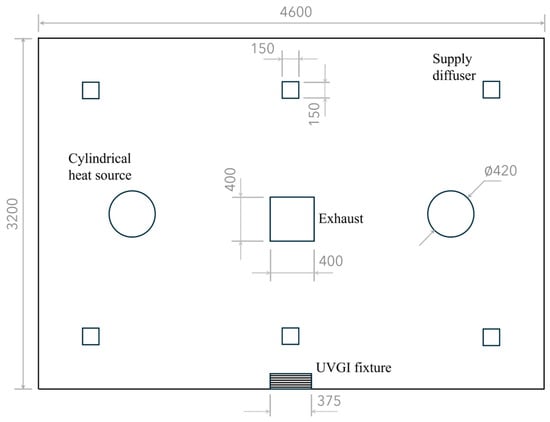
Figure 2.
Plan view of the UFAD-UVGI room. Dimensions are in millimeters.
The room contains two cylindrical heat sources, each with a diameter of 40 cm and a height of 80 cm, and each generates a thermal power output of 100 W. The two sources are sufficiently distant to avoid plume coalescence. It is assumed that droplet nuclei carrying the active SARS-CoV-2 virus are released at a rate of 2 L/min from a circular hole with a diameter of 1 cm at the top of each cylinder. The UV susceptibility constant for SARS-CoV-2 is 0.377 m2/J [32,33].
In the pre-processing stage, the geometry of the simulated UFAD space was divided into five layers using the computed interface heights for the purpose of comparing the CFD predictions of vertical pathogen distributions with those of the analytical multilayer model. To reduce computational time, only half of the geometry was simulated due to symmetry.
2.2.2. Mesh and Grid Independence Analysis
The simulated space was discretized into tetrahedral finite volumes forming the computational mesh of the geometry. The mesh was refined at the supply openings and viral droplet sources as they were the high-gradient regions. The high quality of the computational mesh was ensured by maintaining the maximal skewness below 0.9. A grid independence analysis was conducted by simulating the UFAD space with 100% fresh air, excluding UVGI. Three different mesh sizes were tested, and upon solution convergence, the area-weighted average air temperature, velocity, and molar fraction of SARS-CoV-2 droplet nuclei at the room exhaust were recorded, as presented in Table 1.

Table 1.
Grid independence results.
The quantities of interest stabilized significantly when transitioning from Mesh M2 to Mesh M3. Consequently, all simulations were conducted using Mesh M2 (934,792 cells) shown in Figure 3 to achieve a balance between computational accuracy and time efficiency.
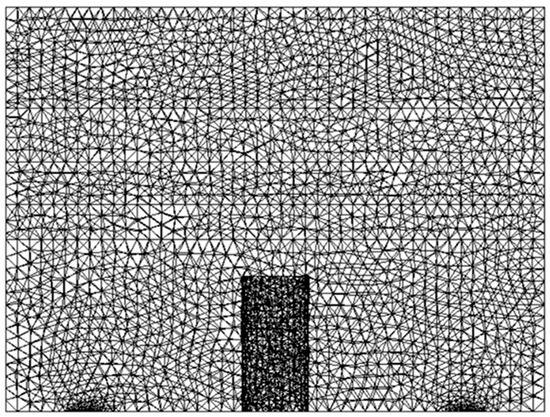
Figure 3.
Computational grid used for simulations.
2.2.3. Thermal and Airflow Modeling
The Boussinesq approximation was used for reasonable thermal buoyancy modeling with faster convergence in the indoor environment [34,35]. This method can capture the effects of thermal plumes on species concentration distributions [36]. The Realizable k-epsilon model with full buoyancy effects was used for solving the turbulence kinetic energy and its rate of dissipation. Additionally, the enhanced wall function was required to resolve the fluid velocity within the viscous sublayer near the heat sources. This model was proven able to accurately simulate the airflow in UFAD spaces [17,37].
2.2.4. Airborne Pathogen Transport and UV Inactivation Modeling
The following steady-state equation for pathogenic droplet nuclei dispersion and inactivation by UV is solved by the CFD code [38,39].
where U is the air velocity field and Ep is the spatial UV irradiance within the simulated space.
The species transport model in Fluent was activated, treating the droplet nuclei carrying SARS-CoV-2 as a gaseous contaminant as previously explained. A low diffusivity of 10−7 kg/m·s was used, following [40]. The generation of the viral droplets was imposed as a boundary condition in the simulations.
Two supplementary C++ codes were developed and implemented as interpreted user-defined functions (UDFs) in the Fluent solver. The first UDF simulates return air recirculation and determines the corresponding concentration profile of droplet nuclei with SARS-CoV-2 at the supply, as described in Equation (5). The second UDF defines the sink term in the transport equation, representing the UV disinfection of infectious droplet nuclei. It incorporates the UV irradiance model of [41], which estimates the UV field generated by upper room UVGI fixtures, both with and without louvers, using radiation view factors.
2.2.5. Boundary Conditions
To enhance the accuracy of CFD simulations, the boundary conditions were meticulously defined. A velocity inlet boundary condition was applied to the supply diffusers and pathogen sources, as the scalar properties of the flow were predetermined. This method is commonly employed in indoor air simulations and has been demonstrated to produce reliable results [42,43]. An outflow boundary condition was assigned to the exhaust to ensure reasonable simulation results [44]. A summary of the boundary conditions is provided in Table 2.
Table 2.
Boundary conditions for the simulations.
2.2.6. Numerical Solution
All variables, except for pressure, were discretized with the second-order UPWIND scheme, while the SIMPLE algorithm was used to couple pressure and velocity in the Navier–Stokes equations. ANSYS employs an implicit iterative numerical approach to solve the governing conservation equations for temperature, velocity, species concentration, and other air variables across each cell. The following under-relaxation factors were applied, ensuring a stable calculation process: 0.3 for pressure and momentum, 0.7 for density and body forces, 0.8 for turbulence scalars and species, and 0.9 for energy. Multiple criteria for the convergence of the numerical solution were used in each simulation: scaled residuals of the order of 10−5, stabilized values of the volume-averaged SARS-CoV-2 mole fractions in all the five air layers, and negligible net heat and mass fluxes within the computational domain.
3. Energy Analysis
UFAD systems offer an energy-efficient advantage over conventional mixing ventilation systems, primarily due to their higher supply temperature. Their economic viability can be further enhanced by recirculating a fraction of the return air, which reduces the enthalpy difference between indoor and outdoor air.
In this scenario, the cooling coil load is calculated as:
where hmix represents the enthalpy of air formed by mixing fresh outdoor air with return air upstream of the cooling coil, and is defined as:
However, recirculating return air can lead to unsafe levels of airborne pathogen concentrations in the occupied zone. This effect is particularly significant in UFAD spaces, where the highest concentrations of pathogenic droplet nuclei are found in the upper room, near the return vent. To address this, cost-effective upper room UVGI can be employed to lower indoor pathogen levels, thereby promoting the use of return air recirculation in UFAD systems. The effectiveness of UV disinfection, however, is a function of the UV output delivered to the indoor environment and the duration of pathogen exposure to UV radiation. To ensure optimal performance, a critical return air ratio must be determined for a given UV intensity within the UVGI system. This ratio represents the mixing point at which the concentration of pathogenic droplet nuclei in the occupied zone remains within IAQ standards, minimizing the risk of cross-infection among occupants. This optimization exercise will be carried out later in this work through a case study examining airborne tuberculosis transmission. This study aims to reduce disease spread while evaluating the potential energy savings of the combined UFAD-UVGI system.
4. Results
4.1. Validation of the CFD-UV Model
The developed CFD-UV model was validated using the experimental work of [30], where they assessed the effectiveness of upper room UVGI in disinfecting indoor air from three types of bacteria, M. luteus, B. subtilis, and E. coli, under steady-state conditions. Their experimental setup included an 80 W thermal manikin representing a seated occupant and an upper room UVGI system with 15 W UVC lamps, installed with the lower edge of the housing at 1.75 m above the floor. The bacteria were generated using a six-jet nebulizer at a rate of 14 L/min. Experiments were conducted for various configurations of the upper UVGI system. For the configuration with one operating lamp with horizontal louvers, the average UV irradiance at 2.1 m measured 1.60 W/cm2, while our irradiation model yielded a value of 1.42 W/cm2, with less than 12% error. Additionally, the average irradiance within the occupied zone did not exceed the permissible 8 h exposure limit of 0.2 μW/cm2 for occupant safety [45]. Furthermore, the same experimental work was used in our previous study [18] to validate a similar CFD-UV model based on UVGI efficacy values. The validation scenarios involved a single un-louvered 15 W UV lamp. The UVGI effectiveness values obtained from the CFD simulations for the three types of bacteria closely matched the reported experimental results, with an error margin within 8%, as shown in Figure 4. This demonstrates strong agreement between the model predictions and experimental data.
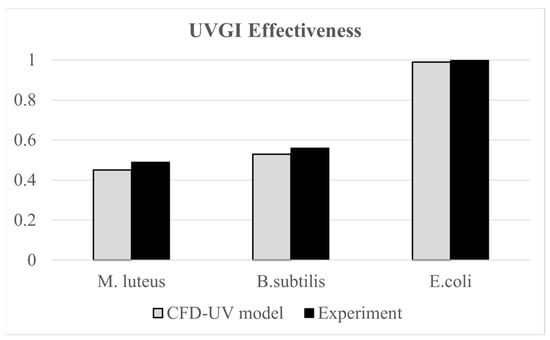
Figure 4.
Comparative plots of measured and CFD values of UVGI effectiveness values.
The current model instills confidence in its ability to provide accurate results based on the following key strengths:
- (a)
- In our previous work [46], the current CFD methodology was extensively validated against published experimental UFAD data on air temperature and velocity. It is widely accepted that the ability of the CFD model to accurately predict airflow patterns forms the foundation for reliably predicting the distribution of the pathogenic droplet nuclei concentration, treated as a passive scalar fully governed by the airflow.
- (b)
- The CFD-UV model was experimentally validated in our work [13], where it was proven to reasonably predict the efficacy of UVGI in disinfecting air in a stratified indoor environment at different pathogen-carrying particle sizes with a maximum error of 15%.
4.2. CFD Results
The UFAD room was simulated using the developed CFD model under four scenarios: (a) 100% fresh air without UVGI, (b) 100% fresh air with UVGI, (c) 50% fresh air without UVGI, and (d) 50% fresh air with UVGI. The velocity fields remain invariant across all scenarios. The air temperature distribution is similarly unaffected since the return air is mixed with outdoor fresh air upstream of the cooling coil, and the UV field has no significant impact on thermal flow transport. Figure 5a illustrates the indoor velocity vector field, taken along a cut plane intersecting a pair of supply diffusers, demonstrating the CFD model’s ability to accurately capture the supply jet dynamics, its downward return, and other UFAD flow characteristics. As expected, the airflow exhibits limited mixing in the lower occupied zone, enhancing air cleanliness and thermal comfort. In contrast, the upper room is characterized by unidirectional flow, facilitating the direct transport of droplet nuclei toward the exhaust vent. The thermal fields at the previously mentioned sampling plane are shown in Figure 5b, clearly illustrating thermal stratification. By maintaining cooler temperatures in the occupied zone and directing heat upward, UFAD systems enhance occupant comfort while improving energy efficiency. Notably, the interface heights of the multilayer model, calculated prior to the simulations, were reasonably estimated.
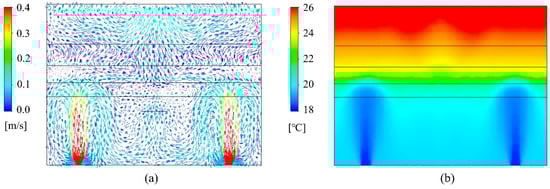
Figure 5.
CFD plots of (a) velocity vector field and (b) temperature contour plots on a cut plane.
Figure 6 shows the concentration contour plots for airborne SARS-CoV-2 droplet nuclei in the UFAD space, with and without the use of UR-UVGI for both the cases of 100% and 50% fresh air, taken along a cut plane through the heat sources. The CFD model effectively simulated species stratification within the UFAD system, distinctly identifying a clean lower zone and a contaminated upper zone. In cases with 50% fresh air, the lower zone exhibited higher airborne viral concentrations due to the recirculation of return air containing elevated levels of SARS-CoV-2 droplet nuclei. However, the implementation of UR-UVGI in the case of return air recirculation helped maintain lower pathogen concentrations in the lower zone compared to the upper zone. Results showed that the UVGI system achieved an 11% reduction in viral concentration within the upper air layer, while the layers below the density interface exhibited negligible reduction due to insufficient UV irradiance. Since the UFAD flow is unidirectional above the density interface, the UV dose received by pathogens in the upper UV zone is relatively low compared to mixing and displacement ventilation systems, where viral droplets undergo prolonged exposure to UV irradiation due to air recirculation within the irradiated zone. This suggests that UFAD systems may allow for lower return air ratios while still maintaining acceptable air quality in the occupied zone. Therefore, optimizing the return air ratio is essential for achieving a well-balanced trade-off between IAQ and energy efficiency.
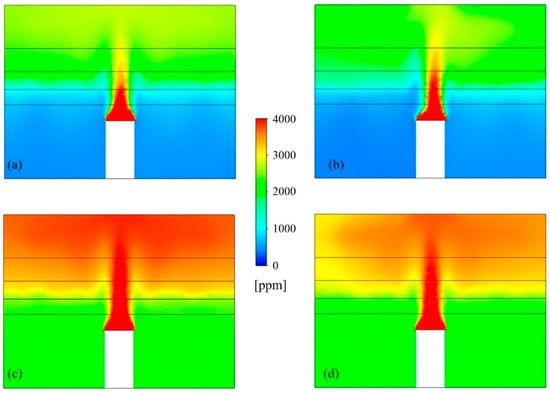
Figure 6.
Airborne SARS-CoV-2 distributions for (a) 100% fresh air without UV, (b) 100% fresh air with UV, (c) 50% fresh air without UV, and (d) 50% fresh air with UV.
4.3. Substantiation of the Analytical Model
The vertical distribution of SARS-CoV-2 droplet nuclei predicted by the multilayer transport model was compared with CFD results under three ventilation scenarios: 100%, 80%, and 50% fresh air. For each layer, the average volume concentration from the CFD model was evaluated against the mid-layer concentration predicted by the simplified model, both with and without UV. Figure 7 presents a comparison of airborne pathogen concentrations as a function of height, illustrating the agreement between the multilayer model and CFD predictions with a maximum discrepancy of 12% in UVGI cases and 7% in cases without UVGI.
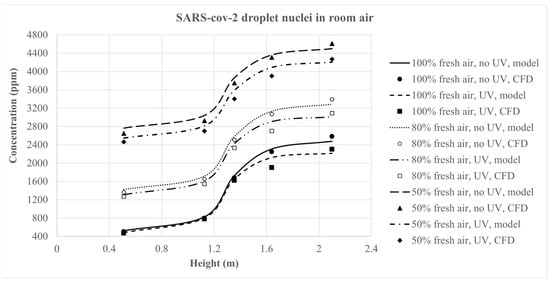
Figure 7.
Plots of SARS-CoV-2 concentration profiles from the analytical model and CFD as a function of height for the different ventilation scenarios.
5. Case Study
The World Health Organization’s maximal allowable bacteria concentration exposure for human occupancy in office environments is 500 CFU/m3 [47,48]. In this study, the equivalent bacteria concentration in colony-forming units per unit volume (CFU/m3) is determined by considering the volume of bacterial droplet nuclei, assuming a diameter of 1 μm. This conversion assumes that a single colony arises from one viable bacterium which is a conservative approach for evaluating the microbiological air quality. The validated multilayer transport model is applied in a case study to optimize return air recirculation in a UFAD system in the presence of UR-UVGI. This optimization aims to determine the maximum allowable return air ratio, enhancing energy efficiency while ensuring healthy air quality within the occupied zone, specifically below the density interface level, denoted Layer 1 in our simplified model.
5.1. System Description
This study considers a standard office space in Beirut, measuring 3 × 3 × 2.8 m, conditioned by a UFAD system. This system includes four diffusers, each measuring 0.2 × 0.2 cm, delivering 72 L/s of cooled air at 18 °C. The office contains three occupants, two of whom are infected with tuberculosis, a respiratory disease caused by bacteria called Mycobacterium tuberculosis. The susceptibility constant of M. tuberculosis is 0.23 m2/J, as reported by [49]. For simplicity, a seated occupant is approximated as a cylindrical shape (height: 1.2 m, diameter: 0.42 m) with a surface area of 1.72 m2. This simplified approach is commonly used in the literature and does not compromise much accuracy in global air quality and thermal comfort evaluations [50,51,52]. The heat output of an occupant is estimated at 100 W corresponding to light office work. Each occupant exhales 8.4 L/min while breathing and talking [53], with airflow exiting the mouth at a height of 1.05 m and a velocity of 1 m/s. At this speed, the respiratory flow cannot penetrate the thermal plume but is fully deflected toward the head plume region [54], a behavior consistent with the simplified model’s assumptions. An infected occupant is assumed to emit 700 CFU/min of M. tuberculosis, corresponding to an emission rate of 3.6 × 10⁻¹³ L/min of droplet nuclei carrying M. tuberculosis at the mouth boundary condition. The lighting load is typical of 12 W/m2. For air disinfection, two UVC lamps with horizontal louvers are mounted on the wall at 2.5 m above the floor.
According to Beirut weather data [55], the outdoor conditions in the cooling season during the working hours (8:00–16:00) vary between 24.6 °C (db), 20.8 °C (wb) to 31.4 °C (db), 22.7 °C (wb) and 25.2 °C (db), 20.8 °C (wb) to 32 °C (db), 22.7 °C (wb) in July and August.
5.2. Results of Energy Simulations
The multilayer model code was executed multiple times using various UV output values: 15 W, 18 W, 24 W, and 36 W UVC, all corresponding to a single germicidal lamp. The model simulation runs showed that further increasing the UV output may have resulted in harmful levels of UV irradiance in the occupied zone. Additionally, different mixing ratios of 0%, 5%, 10%, 15%, 20%, 25%, and 30% were applied. For each UV output level, the return air ratio was adjusted to determine the critical value required to maintain the standard limit of 500 CFU/m3 of bacterial droplet nuclei within the occupied zone. Figure 8 illustrates the variations in bacterial concentration within the occupied zone as a function of the return air ratio, considering different UV output levels. The optimal return air ratios were found to be 16%, 18%, 22%, and 26% for total UV outputs of 30 W, 36 W, 48 W, and 72 W, respectively.
Figure 8.
Variations in the M. tuberculosis concentration in the occupied zone with the mixing ratio and total UV output.
For each critical mixing ratio, the electrical power consumption of the UFAD system was calculated based on the summer indoor design conditions for Beirut (22 °C, 50% RH) and a cooling system COP of 2.0. The results of the hourly energy simulations, performed over the three-month cooling season excluding weekends, are shown in Figure 9. The graph presents the total electrical consumption (kWh/day) of the system throughout the whole season for conditions that meet the microbiological air quality requirements. Additionally, the power consumption of UV lamps was considered.
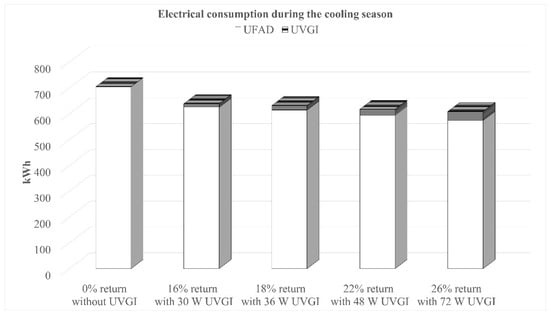
Figure 9.
Energy consumption of the system for the cooling season with conditions that meet WHO requirements.
Results show that operating the UFAD system with optimized mixing ratios and UVGI integration offers a promising energy-saving advantage. Compared to a 100% fresh air system without UVGI, the optimal settings (26% return air + 72 W UCV) reduce energy consumption by 13.6% while still ensuring an acceptable airborne bacteria concentration and safe UV irradiance levels within the occupied zone.
6. Conclusions and Limitations
An analytical multilayer model has been developed for airborne pathogen transport and disinfection by UR-UVGI in mixed UFAD systems. The model has been substantiated using SARS-CoV-2 virus as the simulated pathogen through a comprehensive CFD model that was validated against experimental data from the literature. The simplified model has been applied in a case study on M. tuberculosis bacteria to optimize the return air recirculation for a balance of IAQ and energy efficiency. Results indicate that UFAD can achieve up to 13.6% energy savings while maintaining an acceptable air quality for occupants when operated at the optimal combination of return air ratio and UV output delivered to the conditioned space.
The simplified model has practical usefulness, serving as a predictive tool that gives recommendations for the preliminary design and optimization of similar UFAD-UVGI systems without the need for complicated and time-consuming CFD simulations. However, it is subject to the following limitations:
- The model is unsuitable for extremely high supply velocities, where the jet throw exceeds the terminal plume height. In such cases, the proposed space model becomes invalid, as the flow dynamics require an alternative layering approach.
- The model assumes equal heat sources; however, when heat sources have different strengths, more attention must be given to the terminal height of the plume. In their proposed space model, Habchi et al. [56] recognized the height of the most dominant plume as a crucial determinant in structuring the stratified indoor airflow.
- The model does not account for coalescing plumes, assuming that heat sources are spaced far enough apart to prevent thermal plume interference. However, if plume coalescence occurs below the upper mixing zone, it alters the height of the density interface [57].
- Only adiabatic walls are considered, and wall plumes are therefore excluded from the modeling. However, when warm walls are present, upward wall plumes must be considered, as they entrain air while expanding, facilitate contaminant transport, and affect the air density interface level. Additionally, the effects of thermal radiation and heat gain from the return plenum are disregarded.
- The model is applicable only to low-momentum expiratory activities performed by a seated individual, where the exhaled airflow remains confined within the thermal plume and all droplet nuclei are carried upward by it.
- Gravitational settling of expiratory droplets is neglected in the current modeling approach, as previously discussed. As a result, the model predictions may slightly overestimate the pathogenic concentration in indoor air. However, this provides the advantage of a more cautious and conservative approach for IAQ assessment.
Author Contributions
Conceptualization, M.K., S.A. and E.G.-H.; methodology, M.K.; software, M.K.; validation, S.A. and E.G.-H.; formal analysis, M.K., S.A. and E.G.-H.; investigation, M.K. and S.A.; resources, E.G.-H.; writing—original draft preparation, S.A.; writing—review and editing, M.K.; visualization, E.G.-H.; project administration, M.K. All authors have read and agreed to the published version of the manuscript.
Funding
This research received no external funding.
Data Availability Statement
Data is contained within the article.
Conflicts of Interest
The authors declare no conflicts of interest.
References
- Reed, N.G. The History of Ultraviolet Germicidal Irradiation for Air Disinfection. Public Health Rep. 2010, 125, 15–27. [Google Scholar] [CrossRef]
- Nardell, E.A.; Bucher, S.J.; Brickner, P.W.; Wang, C.; Vincent, R.L.; Becan-McBride, K.; James, M.A.; Michael, M.; Wright, J.D. Safety of Upper-Room Ultraviolet Germicidal Air Disinfection for Room Occupants: Results from the Tuberculosis Ultraviolet Shelter Study. Public Health Rep. 2008, 123, 52–60. [Google Scholar] [CrossRef] [PubMed]
- Noakes, C.J.; Sleigh, P.A.; Fletcher, L.A.; Beggs, C.B. Use of CFD Modelling to Optimise the Design of Upper-Room UVGI Disinfection Systems for Ventilated Rooms. Indoor Built Environ. 2006, 15, 347–356. [Google Scholar] [CrossRef]
- Ko, G.; First, M.W.; Burge, H.A. The Characterization of Upper-Room Ultraviolet Germicidal Irradiation in Inactivating Airborne Microorganisms. Environ. Health Perspect. 2002, 110, 95–101. [Google Scholar] [CrossRef] [PubMed]
- Yao, G.; Liu, Z.; Liu, H.; Jiang, C.; Li, Y.; Liu, J.; He, J. Air Disinfection Performance of Upper-Room Ultraviolet Germicidal Irradiation (UR-UVGI) System in a Multi-Compartment Dental Clinic. J. Hazard. Mater. 2024, 477, 135383. [Google Scholar] [CrossRef]
- McDonagh, A.; Noakes, C.; Fletcher, L. Experimentally Evaluating the Effectiveness of an Upper-Room UVGI System. In Proceedings of the 11th REHVA World Congress Clima—Energy Efficient, Smart and Healthy Buildings, Prague, Czech Republic, 16–19 June 2013. [Google Scholar]
- Karam, J.; Ghali, K.; Ghaddar, N. Pulsating Jet Ventilation Add-Ons Performance for Reducing the Contaminant Spread in Classrooms: Portable Air Cleaners vs. Upper Room UVGI. Build. Environ. 2023, 229, 109946. [Google Scholar] [CrossRef]
- Kanaan, M.; Moughlbay, A.A. Comparative CFD Investigation of Upper Room UVGI Efficacy with Three Different Ventilation Systems. Int. J. Appl. Eng. Res. 2018, 13, 14897–14902. [Google Scholar]
- Park, S.; Mistrick, R.; Sitzabee, W.; Rim, D. Effect of Ventilation Strategy on Performance of Upper-Room Ultraviolet Germicidal Irradiation (UVGI) System in a Learning Environment. Sci. Total Environ. 2023, 899, 165454. [Google Scholar] [CrossRef]
- Pichurov, G.; Srebric, J.; Zhu, S.; Vincent, R.L.; Brickner, P.W.; Rudnick, S.N. A Validated Numerical Investigation of the Ceiling Fan’s Role in the Upper-Room UVGI Efficacy. Build. Environ. 2015, 86, 109–119. [Google Scholar] [CrossRef]
- Zhu, S.; Srebric, J.; Rudnick, S.N.; Vincent, R.L.; Nardell, E.A. Numerical Investigation of Upper-Room UVGI Disinfection Efficacy in an Environmental Chamber with a Ceiling Fan. Photochem. Photobiol. 2013, 89, 782–791. [Google Scholar] [CrossRef]
- Won, Y.; Rim, D.; Mistrick, R.; Bahnfleth, W. CFD Modeling of Room Airflow Effects on Inactivation of Aerosol SARS-CoV-2 by an Upper-Room Ultraviolet Germicidal Irradiation (UVGI) System. Sci. Technol. Built Environ. 2023, 29, 719–729. [Google Scholar] [CrossRef]
- Kanaan, M.; Ghaddar, N.; Ghali, K.; Araj, G. Upper Room UVGI Effectiveness with Dispersed Pathogens at Different Droplet Sizes in Spaces Conditioned by Chilled Ceiling and Mixed Displacement Ventilation System. Build. Environ. 2015, 87, 117–128. [Google Scholar] [CrossRef]
- Heidarinejad, G.; Shokrollahi, S.; Pasdarshahri, H. An investigation of thermal comfort, IAQ, and energy saving in UFAD systems using a combination of Taguchi optimization algorithm and CFD. Adv. Build. Energy Res. 2021, 15, 799–817. [Google Scholar] [CrossRef]
- Wang, C.; Shan, J.; Shuhong, L.I. Effect on the Performance of Underfloor Air Distribution (UFAD) system under different supply air parameters. IOP Conf. Ser. Earth Environ. Sci. 2020, 480, 012009. [Google Scholar] [CrossRef]
- Kanaan, M.; Amine, S.; Hmadi, M. Optimized Solar-Powered Evaporative-Cooled UFAD System for Sustainable Thermal Comfort: A Case Study in Riyadh, KSA. Thermo 2025, 5, 26. [Google Scholar] [CrossRef]
- Cheong, C.H.; Park, B.; Ryu, S.R. Effect of under-floor air distribution system to prevent the spread of airborne pathogens in classrooms. Case Stud. Therm. Eng. 2021, 28, 101641. [Google Scholar] [CrossRef]
- Kanaan, M.; Ghaddar, N.; Ghali, K.; Araj, G. New Airborne Pathogen Transport Model for Upper-Room UVGI Spaces Conditioned by Chilled Ceiling and Mixed Displacement Ventilation: Enhancing Air Quality and Energy Performance. Energy Convers. Manag. 2014, 85, 50–61. [Google Scholar] [CrossRef]
- Liu, H.; Liu, Z.; He, J.; Hu, C.; Rong, R.; Han, H.; Wang, L.; Wang, D. Reducing Airborne Transmission of SARS-CoV-2 by an Upper-Room Ultraviolet Germicidal Irradiation System in a Hospital Isolation Environment. Environ. Res. 2023, 237, 116952. [Google Scholar] [CrossRef]
- Fabian, P.; McDevitt, J.J.; DeHaan, W.H.; Fung, R.O.P.; Cowling, B.J.; Chan, K.H.; Leung, G.; Milton, D.K. Influenza Virus in Human Exhaled Breath: An Observational Study. PLoS ONE 2008, 3, e2691. [Google Scholar] [CrossRef]
- Lin, Y.J.P.; Linden, P.F. A Model for an under Floor Air Distribution System. Energy Build. 2005, 37, 399–409. [Google Scholar] [CrossRef]
- LIU, Q.A.; LINDEN, P.F. The Fluid Dynamics of an Underfloor Air Distribution System. J. Fluid Mech. 2006, 554, 323. [Google Scholar] [CrossRef]
- Webster, T.; Bauman, F.; Buhl, F.; Daly, A. Modeling of Underfloor Air Distribution (UFAD) Systems. In Proceedings of the Third National Conference of IBPSA-US, Berkeley, CA, USA, 30 July–1 August 2008. [Google Scholar]
- Jiang, N.; Yao, S.; Feng, L.; Sun, H.; Liu, J. Experimental Study on Flow Behavior of Breathing Activity Produced by a Thermal Manikin. Build. Environ. 2017, 123, 200–210. [Google Scholar] [CrossRef]
- Mundt, E. The Performance of Displacement Ventilation Systems-Experimental and Theoretical Studies. Ph.D. Thesis, Royal Institute of Technology, Stockholm, Sweden, 1996. [Google Scholar]
- Goodfellow, H.D. Industrial Ventilation Design Guidebook; Elsevier: Amsterdam, The Netherlands, 2011. [Google Scholar]
- Kanaan, M. Modelling of Contaminant Dispersion in Underfloor Air Distribution Systems: Comparison of Analytical and CFD Methods. J. Build. Perform. Simul. 2019, 12, 759–769. [Google Scholar] [CrossRef]
- Rodi, W. Turbulent Buoyant Jets and Plumes: HMT: The Science & Applications of Heat and Mass Transfer. Reports, Reviews & Computer Programs; Elsevier: Amsterdam, The Netherlands, 2014; Volume 6. [Google Scholar]
- Kanaan, M.; Ghaddar, N.; Ghali, K. Simplified Model of Contaminant Dispersion in Rooms Conditioned by Chilled-Ceiling Displacement Ventilation System. HVACR Res. 2010, 16, 765–783. [Google Scholar] [CrossRef]
- Miller, S.L.; MacHer, J.M. Evaluation of a Methodology for Quantifying the Effect of Room Air Ultraviolet Germicidal Irradiation on Airborne Bacteria. Aerosol Sci. Technol. 2000, 33, 274–295. [Google Scholar] [CrossRef]
- Heidarinejad, M.; Srebric, J. Computational Fluid Dynamics Modelling of UR-UVGI Lamp Effectiveness to Promote Disinfection of Airborne Microorganisms. World Rev. Sci. Technol. Sustain. Dev. 2013, 10, 78. [Google Scholar] [CrossRef]
- Beggs, C.B.; Avital, E.J. Upper-Room Ultraviolet Air Disinfection Might Help to Reduce COVID-19 Transmission in Buildings: A Feasibility Study. PeerJ 2020, 8, e10196. [Google Scholar] [CrossRef]
- Walker, C.M.; Ko, G. Effect of Ultraviolet Germicidal Irradiation on Viral Aerosols. Environ. Sci. Technol. 2007, 41, 5460–5465. [Google Scholar] [CrossRef]
- Hauke, G.; Lanzarote, J. Computing Buoyancy Flows with Stabilized Finite Volume Method. In Proceedings of the Sixteenth International Conference Zaragoza-Pau on Mathematics and its Applications, Jaca, Spain, 7–9 September 2024. [Google Scholar]
- Barletta, A. The Boussinesq Approximation for Buoyant Flows. Mech. Res. Commun. 2022, 124, 103939. [Google Scholar] [CrossRef]
- Tominaga, Y.; Stathopoulos, T. CFD Simulations of Near-Field Pollutant Dispersion with Different Plume Buoyancies. Build. Environ. 2018, 131, 128–139. [Google Scholar] [CrossRef]
- Lee, Y.-T.; Wen, C.-Y.; Shih, Y.-C.; Li, Z.; Yang, A.-S. Numerical and Experimental Investigations on Thermal Management for Data Center with Cold Aisle Containment Configuration. Appl. Energy 2022, 307, 118213. [Google Scholar] [CrossRef]
- Zhang, Z.; Chen, Q. Comparison of the Eulerian and Lagrangian Methods for Predicting Particle Transport in Enclosed Spaces. Atmos. Environ. 2007, 41, 5236–5248. [Google Scholar] [CrossRef]
- Zhao, Y.; Liu, Z.; Li, X.; Zhao, M.; Liu, Y. A Modified Turbulence Model for Simulating Airflow Aircraft Cabin Environment with Mixed Convection. Build. Simul. 2020, 13, 665–675. [Google Scholar] [CrossRef] [PubMed]
- Hathway, E.A.; Noakes, C.J.; Sleigh, P.A.; Fletcher, L.A. CFD Simulation of Airborne Pathogen Transport Due to Human Activities. Build. Environ. 2011, 46, 2500–2511. [Google Scholar] [CrossRef]
- Wu, C.L.; Yang, Y.; Wong, S.L.; Lai, A.C.K. A New Mathematical Model for Irradiance Field Prediction of Upper-Room Ultraviolet Germicidal Systems. J. Hazard. Mater. 2011, 189, 173–185. [Google Scholar] [CrossRef]
- Cao, Q.; Liu, M.; Li, X.; Lin, C.-H.; Wei, D.; Ji, S.; Zhang, T.; Chen, Q. Influencing Factors in the Simulation of Airflow and Particle Transportation in Aircraft Cabins by CFD. Build. Environ. 2022, 207, 108413. [Google Scholar] [CrossRef] [PubMed]
- Alsaad, H.; Voelker, C. Performance Assessment of a Ductless Personalized Ventilation System Using a Validated CFD Model. J. Build. Perform. Simul. 2018, 11, 689–704. [Google Scholar] [CrossRef]
- Izadyar, N.; Miller, W.; Rismanchi, B.; Garcia-Hansen, V. Numerical Simulation of Single-Sided Natural Ventilation: Impacts of Balconies Opening and Depth Scale on Indoor Environment. IOP Conf. Ser. Earth Environ. Sci. 2020, 463, 012037. [Google Scholar] [CrossRef]
- TLVs and BEIs; American Conference of Governmental Industrial Hygienists: Cincinnati, OH, USA, 1999.
- Kanaan, M.; Amine, S.; Gazo-Hanna, E. Optimizing Supply Conditions and Use of Return Air in UFAD System: Assessment of IAQ, Thermal Comfort and Energy Performance. Results Eng. 2024, 24, 103426. [Google Scholar] [CrossRef]
- Heseltine, E.; Rosen, J. WHO Guidelines for Indoor Air Quality: Dampness and Mould; World Health Organization: Geneva, Switzerland, 2009. [Google Scholar]
- World Health Organization. Indoor Air Quality: Biological Contaminants: Report on a WHO Meeting; World Health Organization Regional Office for Europe: Copenhagen, Denmark, 1988. [Google Scholar]
- Environmental Control for Tuberculosis: Basic Upper-Room Ultraviolet Germicidal Irradiation Guidelines for Healthcare Settings. Available online: https://www.govinfo.gov/app/details/GOVPUB-HE20_7000-PURL-gpo148482 (accessed on 21 July 2025).
- Zhao, W.; Lestinen, S.; Guo, M.; Kilpeläinen, S.; Jokisalo, J.; Kosonen, R. An Experimental Study on Airborne Transmission in a Meeting Room with Different Air Distribution Methods. Build. Environ. 2024, 256, 111522. [Google Scholar] [CrossRef]
- Mahaki, M.; Mattsson, M.; Salmanzadeh, M.; Hayati, A. Comparing Objects for Human Movement Simulation Regarding Its Air Flow Disturbance at Local Exhaust Ventilation. Energy Build. 2021, 247, 111117. [Google Scholar] [CrossRef]
- Lo, L.J.; Novoselac, A. Localized Air-Conditioning with Occupancy Control in an Open Office. Energy Build. 2010, 42, 1120–1128. [Google Scholar] [CrossRef]
- Habchi, C.; Ghali, K.; Ghaddar, N.; Chakroun, W.; Alotaibi, S. Ceiling Personalized Ventilation Combined with Desk Fans for Reduced Direct and Indirect Cross-Contamination and Efficient Use of Office Space. Energy Convers. Manag. 2016, 111, 158–173. [Google Scholar] [CrossRef]
- Liu, F.; Zhang, L.; Qian, H. The Penetration Phenomenon of the Expiratory Airflow from Thermal Plume of Human Body in the Microenvironment around People. Build. Environ. 2024, 259, 111656. [Google Scholar] [CrossRef]
- ASHRAE Handbook—Fundamentals; American Society of Heating Refrigerating and Air-Conditioning Engineers: New York, NY, USA, 2021.
- Habchi, C.; Ghali, K.; Ghaddar, N. A Simplified Mathematical Model for Predicting Cross Contamination in Displacement Ventilation Air-Conditioned Spaces. J. Aerosol Sci. 2014, 76, 72–86. [Google Scholar] [CrossRef]
- Sodec, F. The Underfloor Air Supply System–The European Experience. In Proceedings of the ASHRAE Transactions, San Diego, CA, USA, 24–28 June 1990; ASHRAE Transactions: New York, NY, USA, 1990. [Google Scholar]


Disclaimer/Publisher’s Note: The statements, opinions and data contained in all publications are solely those of the individual author(s) and contributor(s) and not of MDPI and/or the editor(s). MDPI and/or the editor(s) disclaim responsibility for any injury to people or property resulting from any ideas, methods, instructions or products referred to in the content. |
© 2025 by the authors. Licensee MDPI, Basel, Switzerland. This article is an open access article distributed under the terms and conditions of the Creative Commons Attribution (CC BY) license (https://creativecommons.org/licenses/by/4.0/).