Article

Decoding Retail Commerce Patterns with Multisource Urban Knowledge

1
Faculty of Innovation Engineering, Macau University of Science and Technology, Avenida Wai Long, Taipa, Macau
2
Department of Mechanical Engineering, University of Southern California, Los Angeles, CA 90007, USA
3
College of Professional and Continuing Education, The Hong Kong Polytechnic University, Hung Hom, Kowloon, Hong Kong
4
Independent Researcher, 10900 Euclid Ave., Cleveland, OH 44106, USA
5
Department of Industrial and Systems Engineering, The Hong Kong Polytechnic University, Hung Hom, Kowloon, Hong Kong
*
Author to whom correspondence should be addressed.
Math. Comput. Appl. 2025, 30(4), 75; https://doi.org/10.3390/mca30040075
Submission received: 20 May 2025 / Revised: 14 July 2025 / Accepted: 15 July 2025 / Published: 17 July 2025
(This article belongs to the Section Engineering)

Abstract

Urban commercial districts, with their unique characteristics, serve as a reflection of broader urban development patterns. However, only a handful of studies have harnessed point-of-interest (POI) data to model the intricate relationship between retail commercial space types and other factors. This paper endeavors to bridge this gap, focusing on the influence of urban development factors on retail commerce districts through the lens of POI data. Our exploration underscores how commercial zones impact the density of residential neighborhoods and the coherence of pedestrian pathways. To facilitate our investigation, we propose an ensemble clustering technique for identifying and outlining urban commercial areas, including Kernel Density Analysis (KDE), Density-based Spatial Clustering of Applications with Noise (DBSCAN), Geographically Weighted Regression (GWR). Our research uses the city of Manchester as a case study, unearthing the relationship between commercial retail catchment areas and a range of factors (retail commercial space types, land use function, walking coverage). These include land use function, walking coverage, and green park within the specified areas. As we explore the multiple impacts of different urban development factors on retail commerce models, we hope this study acts as a springboard for further exploration of the untapped potential of POI data in urban business development and planning.

1. Introduction

As cities expand, they give rise to a myriad of associated phenomena, urban data being a significant one. This has culminated in the profound diversity and omnipresence of urban data, which are increasingly pivotal for analyzing urban development. With the widespread adoption of urban digitalization [1], a wealth of urban data has become available for utilization and analysis [2]. Unraveling the interconnections between functional elements dispersed throughout the city holds immense significance for urban planners. This task can be accomplished through the efficient and accurate use of urban data [2]. Thus, urban data, in its richness and depth, becomes an indispensable tool for understanding and shaping the evolving urban planning processes.
Point-of-Interest (POI) data, which refers to a specific point location, or useful site, defined mainly by its geographical coordinates (longitude and latitude), with its inherent share ability and status, has been widely used in different data analysis software, including ArcGIS [3]. The utilization of analytical models for POI data is on the rise. However, urban data often exhibits multi modality, accompanied by issues of hybridization and precision. The extraction of effective, clear information from such heterogeneous data remains a subject of robust exploration. Kernel density analysis stands as the most prominent analytical model. Yet, traditional kernel density estimation methods, reliant on Euclidean distances, overlook the significant role of additional factors in urban development [4]. Furthermore, beyond these functional relationships, the distribution of urban function points is heavily influenced by urban activities, walking coverage, urban land function and so on [5]. Such influences cannot be adequately characterized through the extraction from a single POI data source, underscoring the necessity for more comprehensive and nuanced analytical approaches.
As the realm of urban data analytics evolves (GIS, RS application), researchers are no longer content with merely interpreting city-related data. Increasingly, they aspire to construct relational models that can meaningfully contribute to urban planning. To perform a comprehensive urban analysis, it is crucial to consider various factors. These include land utilization, traffic distribution, and POI [6], but current research falls short of incorporating these components into a cohesive model. The challenge of urban data analysis lies in harnessing the city’s multifaceted data sources, where integration and effective utilization are the linchpins. In practical terms, to enhance the dependability of urban analyses, planners must routinely scrutinize urban phenomena. In fact, in order to improve the reliability of urban analysis, planners must regularly scrutinize urban phenomena and realize that urban data analysis needs to be integrated with the physical form of the city, such as considering the impact of urban roads on the region, the impact of building distribution patterns on urban development, among others [7]. They should identify potential issues, propose suitable remedies, and offer recommendations for urban planning management [8]. The urban commercial district serves as a critical component in city planning and a valuable indicator for assessing a city’s developmental status [9]. Thus, it is essential that the commerce element is considered in the broader scope of urban data analysis and planning.
In light of these complexities, this study introduces a combination of different assessment techniques to urban retail commerce distribution assessment rooted in multi-source urban data. The objective of this study is to analyze the overall retail commercial pattern through kernel density estimation methods, and identify different commercial spatial forms through DBSCAN clustering algorithm. Then Geographically Weighted Regression was used to analyze the influence relationship between commercial distribution, transportation networks, green park, and residential environments through Geographically Weighted Regression, and finally find out which factors can promote the development of retail commerce [10]. To implement this aim, we have selected Manchester as our experimental subject, a city renowned for its vast shopping options offering a range that spans from high-street stores and independent boutiques to busy markets and grand shopping centres. The Manchester city retail industry has experienced a diversity that extends from single to multiple retailers and from low to high price points, providing a typical case for exploring urban retail commerce patterns. We explore its commercial landscape, pairing this with a varied range of road types to evaluate pedestrian accessibility. The data of Manchester retail commercial POI and urban land use were collected by fully leveraging big data acquisition methods. By combining spatial statistics and spatial analysis methods, the spatial dependence between different spatial types of Manchester retail commercial POI and urban land use, as well as between retail commercial POI and different urban land use functions was respectively explored. The combinations with higher spatial dependence were identified, which can provide certain empirical support for future retail practitioners in choosing store locations and for urban managers in developing a reasonable commercial layout. The research contributions of this study are three-fold:
(1) Study the impact of urban land on retail commerce development to evaluate the effectiveness of urban planning implementation.
(2) By establishing an analytical model, explore the promotion effect of different urban development factors on commercial space, and determine which type of retail commerce can play a role in different types of urban development.
(3) Distinguish the commercial layout by spatial types, and find the impact of urban development factors on different commercial layouts.
By shedding light on these aspects, we aspire to deepen our understanding of urban morphology and inform more effective urban planning strategies.
This paper unfolds as follows: Section 2 delves into preceding research on urban data analysis and the extraction of retail commerce characteristics. Section 3 elucidates the methodology of urban geographic data application and the interpretation of urban data. In Section 4, we assemble an urban commerce distribution analysis framework underpinned by data and discern the unique attributes of Manchester’s retail district. Lastly, Section 5 and Section 6 offers a synthesis of the study and delineates potential avenues for future research.

2. Related Work

2.1. Urban POI Data Application

POI generally denotes anything that can be abstractly represented as a point in a Geographic Information System (GIS), because all polygon and polyline data are accompanied by polypoint data in the mapping system. Examples include companies, shopping malls, schools, parks, and other entities we encounter in daily life [11]. Each POI datum essentially contains the name, category, latitude, longitude, address, and other basic attributes of the geographic entity represented [12]. The Point of Interest (POI) data can illustrate the geographic spread of the density and multifaceted use of urban social and economic functions, holding significant value for urban spatial structure analysis [13]. The distribution of POI data can directly mirror the city’s spatial structure, thereby offering potential for urban research [14].
POI data has emerged as a cornerstone in urban data research [15]. Compared to traditional measurement data, its contemporaneity, accuracy, share ability, and multi-classification have not only curtailed research costs but also enriched the research value for investigators. Utilizing POI data to assist and optimize urban spatial patterns will likely become a future trend [16]. Some of Manchester researcher have taken POI data as a research resources, which can quantitatively describe neighborhoods by means of a metric, that reflects which urban elements are distinctive features of each neighborhood [17]. Moreover, it can explore the relationship between a certain small element and the development of the whole city, such as identification of urban centers through the distribution of restaurants [18]. Thus, constructing and analyzing urban spatial patterns rooted in POI data mining is feasible.
Special-purpose data mining systems have garnered significant interest in recent years due to their application in practical environments [19]. A scalable spatial data analysis method for POI datasets, proposed on the ArcGIS platform, exemplifies this trend [20]. Data aggregation areas can be obtained by calculating density and quantity [11]. Upon analyzing urban land use data, one can discern locales with higher potential and those lagging behind [21]. For instance, POI data may indicate areas with a high concentration of stores, suggesting their potential for growth [22]. Apart from this, it can help determine the city center, aiding in urban planning [23].
After land value collection, researchers have employed ArcGIS software to analyze its distribution and identify areas of higher value within the city [24]. The grid system is used to partition urban land, and each cell is valued based on the underlying land value [25]. By considering the land value and function, predictions can be made about future urban space, including building heights and public construction locations [26].

2.2. Urban Retail Commerce Influence

Current studies on factors influencing urban commercial patterns remain in an exploratory phase [27]. The investigation into identifying factors pertinent to commercial space is notably underdeveloped [28]. There is an imminent need to unravel how constraints such as attributes, spatial location, geometry, and spatial relationships of urban commercial areas can be integrated to quantitatively delineate and discern their relationships [29]. As a complex system, retail commercial districts can be divided into different forms according to space, including agglomerated, linear, scattered distribution and so on [30].
The distribution of POI data can vividly illustrate the density of a city, such as a city’s central area or main street replete with commercial facilities and landmarks [11]. According to previous research, 50 m grid is also used in other similar cities in the UK [31], so the city’s overall attractiveness potential was calculated using an analytical grid with a resolution of 50 m [32]. Through the scale of commercial distribution, we can judge whether it is consistent with the direction of urban development [33].
The distribution forms of urban buildings also have different effects on the development of different retail commerce [34]. Large buildings are usually visited by a large number of customers, and buildings along the street are usually visited by pedestrians [35]. Therefore, different urban building forms will promote different types of commercial development [36]. Different spatial distribution modes of buildings have different spatial distances. We can use DBSCAN clustering algorithm to set different aggregate distance values for classification. [37]
It is crucial to note that solely counting the nearest point lacks significance, as diversity and the number of facilities also play a pivotal role in supply [38]. So there are multiple factors that affect retail commerce in cities, including road accessibility, surrounding residential land coverage, and urban agglomeration, among which road accessibility accounts for the largest proportion [39]. The relationship of different urban factors can be discovered through Geographically Weighted Regression [40], which has been used many times in the clustering analysis of various urban functions to find that the development of those factors is interrelated [41]. Due to its conveniences, retail commerce necessitates high transportation accessibility [42]. The physical demands of residential life can impact the turnover of retail commerce [43], and the degree of urban agglomeration indirectly affects the consumption level in retail commerce [44].

2.3. Synthesis of Related Work

From the perspective of the entire research process, the study of spatial POI data has become increasingly mature. The research content has gradually evolved from the initial qualitative analysis of location layout characteristics and patterns, location spatio-temporal evolution and the investigation of spatial structure influencing factors, to the combination of quantitative analysis and the construction of mathematical measurement models for multi-perspective and multi-disciplinary comprehensive research. Scholars’ in-depth exploration of this field has led to the continuous improvement of the research system for retail commercial space location. However, the research on the retail industry mainly focuses on first-tier cities, and there is relatively less research on non-first-tier cities. To form a relatively complete theoretical system of commercial geography, a large amount of empirical research is indispensable. Authors of this paper conducts research on the retail space layout of Manchester based on POI data, with the aim of contributing to the improvement of the theory of retail commercial space.

3. Methodology

This study leverages existing data resources, drawing from online repositories such as Digi Maps and Open Street Map, as well as city-specific urban vector data available from council websites. These sources provide objective evidence underpinning our quantitative research approach.
The study examines the distribution characteristics and scale computations of the city’s commercial POI data in conjunction with other urban elements— such as roads and natural features. In this context, we propose an urban retail commercial evaluation algorithm based on different categories of urban factors, augmenting traditional commercial distribution analysis methods.
As per the inference model framework shown in Figure 1. First, POI data are cleaned and classified, and the overall analysis is used to determine whether the commercial distribution is consistent with urban planning and development. The commercial locations are classified by different spatial models through cluster analysis, and the correlation between different urban factors and commercial distribution is judged. Finally, it can find out the influence of different urban functions on the development of different commercial space models.

3.1. Data Collection and Collation

The Digi map offers a wealth of information about geographical entities, from roads and government agencies to financial institutions, retail stores, and schools [11]. This forms the foundation for our POI experimental data. Typically, POI data can be extracted by employing map APIs (Application Programming Interfaces) and conducting local searches via open source mapping software.
With advancements in computing and the widespread application of big data, the variety of POI data types has expanded significantly over the years [11], embracing elements such as geocoding, coordinate transformation, and data collection. For this experiment, we utilized the Digi map to gather urban POI data (Figure 2). Land function data, traffic data, and resident income data can be obtained from Digi Map, while Points of Interest (POI) data can be obtained from Open Street Map. The research primarily focuses on several sub-categories within the broader categories of shopping, entertainment, and leisure for analysis. It also reclassifies sub-categories with ambiguous industry characteristics, such as ‘maternal and child’ and ‘other shopping’. However, some POI data fields are relatively complex, and certain retail commerce points are not marked with commercial categories but only with store names, such as ‘Tesco’. Therefore, it is necessary to match the name of a well-known local store with a similar field to identify its retail commerce classification. The research has ultimately selected several subcategories within the categories of shopping, entertainment, and leisure for analysis, and reclassified subcategories with ambiguous industry characteristics such as ‘maternal and child’ and ‘other shopping’, and obtained a total of 2681 effective POI data points. Through the above methods, we can gradually screen out the target data that the experiment requires (Figure 3, Table 1).
Upon collating data from the internet, it was discovered that each data type contained multiple fields in the table. As such, it becomes essential to streamline them [45]. Based on the original data, we identified a few key indices to focus on, including functions, categories, and operating conditions. These indices yield valuable insights into commerce attribute types.

3.2. Urban Retail Commerce Scope Analysis

Urban POI data offers a rich depiction of urban economic development, encompassing aspects as diverse as food and shopping services, service longevity, and commercial housing, all of which bear significant relevance to city residents.In this study, we will exclude the data that do not conform to the commercial factors of the city. To capture the spatial distribution of urban POI density, this paper leverages the kernel density analysis estimation method, a popular tool in spatial distribution studies, to scrutinize the density distribution of urban POI in metropolitan areas.
Kernel density analysis is a versatile method that measures the density values of point and line element neighborhoods to simulate the spatial distribution of measured elements. Its principle asserts that within a set bandwidth range, the estimated density value of a factor’s position at the urban center is at its apex, decreasing with increasing distance from the element until it reaches zero at the edge of the element bandwidth [46].
The estimated density of any point in space is the cumulative sum of the estimated density values of all elements in the calculated area. This aligns with the geography-first axiom of kernel density analysis, which posits that all things are interconnected, and the closeness of the distance correlates with the strength of the connection. This principle dovetails neatly with the real-world performance of POI such as parks, supermarkets, and bus stops. Their impact on the population adheres to the same theorem: geographical proximity enhances their appeal, which diminishes with increasing distance.
The formula for calculating kernel density is expressed as follows:
f ( x ) = 1 n h i = 1 n k x x i h ,
In the formula:
  • f ( x ) represents the kernel density estimate, denoting the value of f at point x;
  • k x x i h is the kernel function;
  • n is the quantity of known POI (Point of Interest) vector points;
  • h denotes the service radius (i.e., the bandwidth), where the service radius is defined as the accessibility distance of various POI;
  • ( x x i ) indicates the distance from the target point to the i-th POI point.
In this study, we mainly used the kernel density analysis module of ArcGIS software to conduct kernel density analysis of POI data. The kernel function is used to estimate the density contribution of each measured element to each grid. Each grid is assigned a density value that is the cumulative density contribution of each measured element to the grid within the grid search radius.

3.3. Urban Retail Commerce Space Types Analysis

An urban retail commercial district is fundamentally an irregular surface shaped by its POI achieving a certain level of spatial clustering. From a spatial standpoint, POI comprise randomly distributed discrete points, with each point representing a commercial service facility or a commercial entity.
Upon examining the urban road network, three principal distribution patterns of commercial attractions emerge. As depicted in Figure 4, the first is a “Discrete distribution”, where commercial entities are dispersed along the roadway, typically in suburban or urban fringe areas. The second pattern is “Linear distribution”, with commercial entities situated along the road network. Lastly, the “Infill distribution” pattern sees commercial entities occupying the entirety of the road grid network.
The Density-based Spatial Clustering of Applications with Noise (DBSCAN) algorithm is a quintessential example of density-based clustering. Ester et al. [47] introduced a clustering technique predicated on the density of data distribution. A pivotal advantage of the DBSCAN algorithm is its expedited clustering velocity, coupled with its efficacy in managing noise points and identifying clusters of arbitrary geometric configurations. Furthermore, the DBSCAN algorithm not only adeptly addresses the challenges posed by voluminous data and the superposition of points of interest but also discerns their distribution patterns from a macroscopic vantage point while preserving the precise spatial accuracy at a granular level. This study employs the density-based clustering capabilities of the ArcGIS software to perform spatial clustering analysis on retail Points of Interest (POI) data in Manchester. DBSCAN algorithm can distinguish “Discrete distribution”, “Linear distribution” and “Infill distribution”.
The DBSCAN algorithm mainly involves two parameters: m i n p o i n t s and ε (epsilon). m i n p o i n t s is the case that the user has eliminated a few super large clusters and many small clusters in the clustering results because the m i n p o i n t s value set is too small after many experiments, and selects the clustering results that have as many clusters as possible on the premise that the size of all clusters is as similar as possible, and finally determines the appropriate value of m i n p o i n t s . ε represents the radius of the research field, and ε is mainly determined by the distance of the practice.
The DBSCAN algorithm delineates a cluster as the most extensive collection of density-connected points, enabling the demarcation of areas with substantial density into clusters, thereby culminating in the formation of clusters of diverse shapes. To identify a density-connected set, the DBSCAN algorithm initiates the clustering process from an arbitrary object p within the dataset. If p is a core object, meaning that within a circle centered at p with a radius defined by the threshold ε , the count of POI points meets or exceeds m i n p o i n t s , the algorithm yields a density-connected set, with all entities within this set being categorized under the same cluster. Conversely, if p is not a core object and no other object is reachable from p in terms of density, then p is classified as noise. The DBSCAN algorithm replicates this procedure for each unexamined point, ultimately representing objects linked by density within the same cluster, while those not incorporated into any cluster are deemed noise. For any core object within the dataset, the algorithm ensures the retrieval of a density-connected set (Figure 5).

3.4. Retail Commerce Development Driving Factors

As highlighted in previous sections, the distribution of retail commerce is related to many factors in the city, including the type of community land, whether there are leisure facilities such as parks, and the accessibility of transportation and walking. People’s decision to visit retail commerce is influenced by many factors (geographical location, road accessibility, surrounding residential land cover, urban agglomeration, etc.), among which geographical location and road accessibility have the greatest impact.
Kernel density is used to analyze the single factor attribute of spatial distribution. GWR is a spatial analysis technique that is widely used in geography and related disciplines involving spatial pattern analysis. By establishing local regression equations at each point in the spatial range, GWR can explore the spatial changes of the research object at a certain scale and related driving factors, and can be used to predict future results. Since it takes into account local effects of spatial objects, it has the advantage of higher accuracy.If Geographically Weighted Regression (GWR) is used to calculate related driving factors, the in-depth quantitative information can be mined and the spatial distribution characteristics of the clustering can be verified.
Geographically Weighted Regression is a linear regression model with spatially varying weight functions. The specific calculation formula is as follows:
y i = β 0 u i , v i + β 1 u i , v i x i 1 + β 2 u i , v i x i 2 + + β p u i , v i x i p + ε i
where ( u , v ) is the geospatial coordinate of the sample point i, β is the regression coefficient, y is the dependent variable, ε is the independent equally distributed error term, which usually follows a normal distribution. Geographically Weighted Regression incorporates the spatial position of the research sample into the calculation of the regression model, and builds an independent model for each group of sample data. The weight of the sample changes with the change of spatial position, which enables the calculation result of Geographically Weighted Regression model can well show the spatial heterogeneity of the sample. It is helpful to explore the regional differences of urban factors and retail POI spatial dependence.

4. Case Study

4.1. Retail Commerce Cluster Layer

In kernel density analysis, setting the single-point radiation range value—an influencing factor of Points of Interest (POI)—determines the global density distribution of POs, which reflects both local density distribution and trend characteristics. The regional scope and quantity and spatial distribution characteristics of urban POI play a critical role in this process.
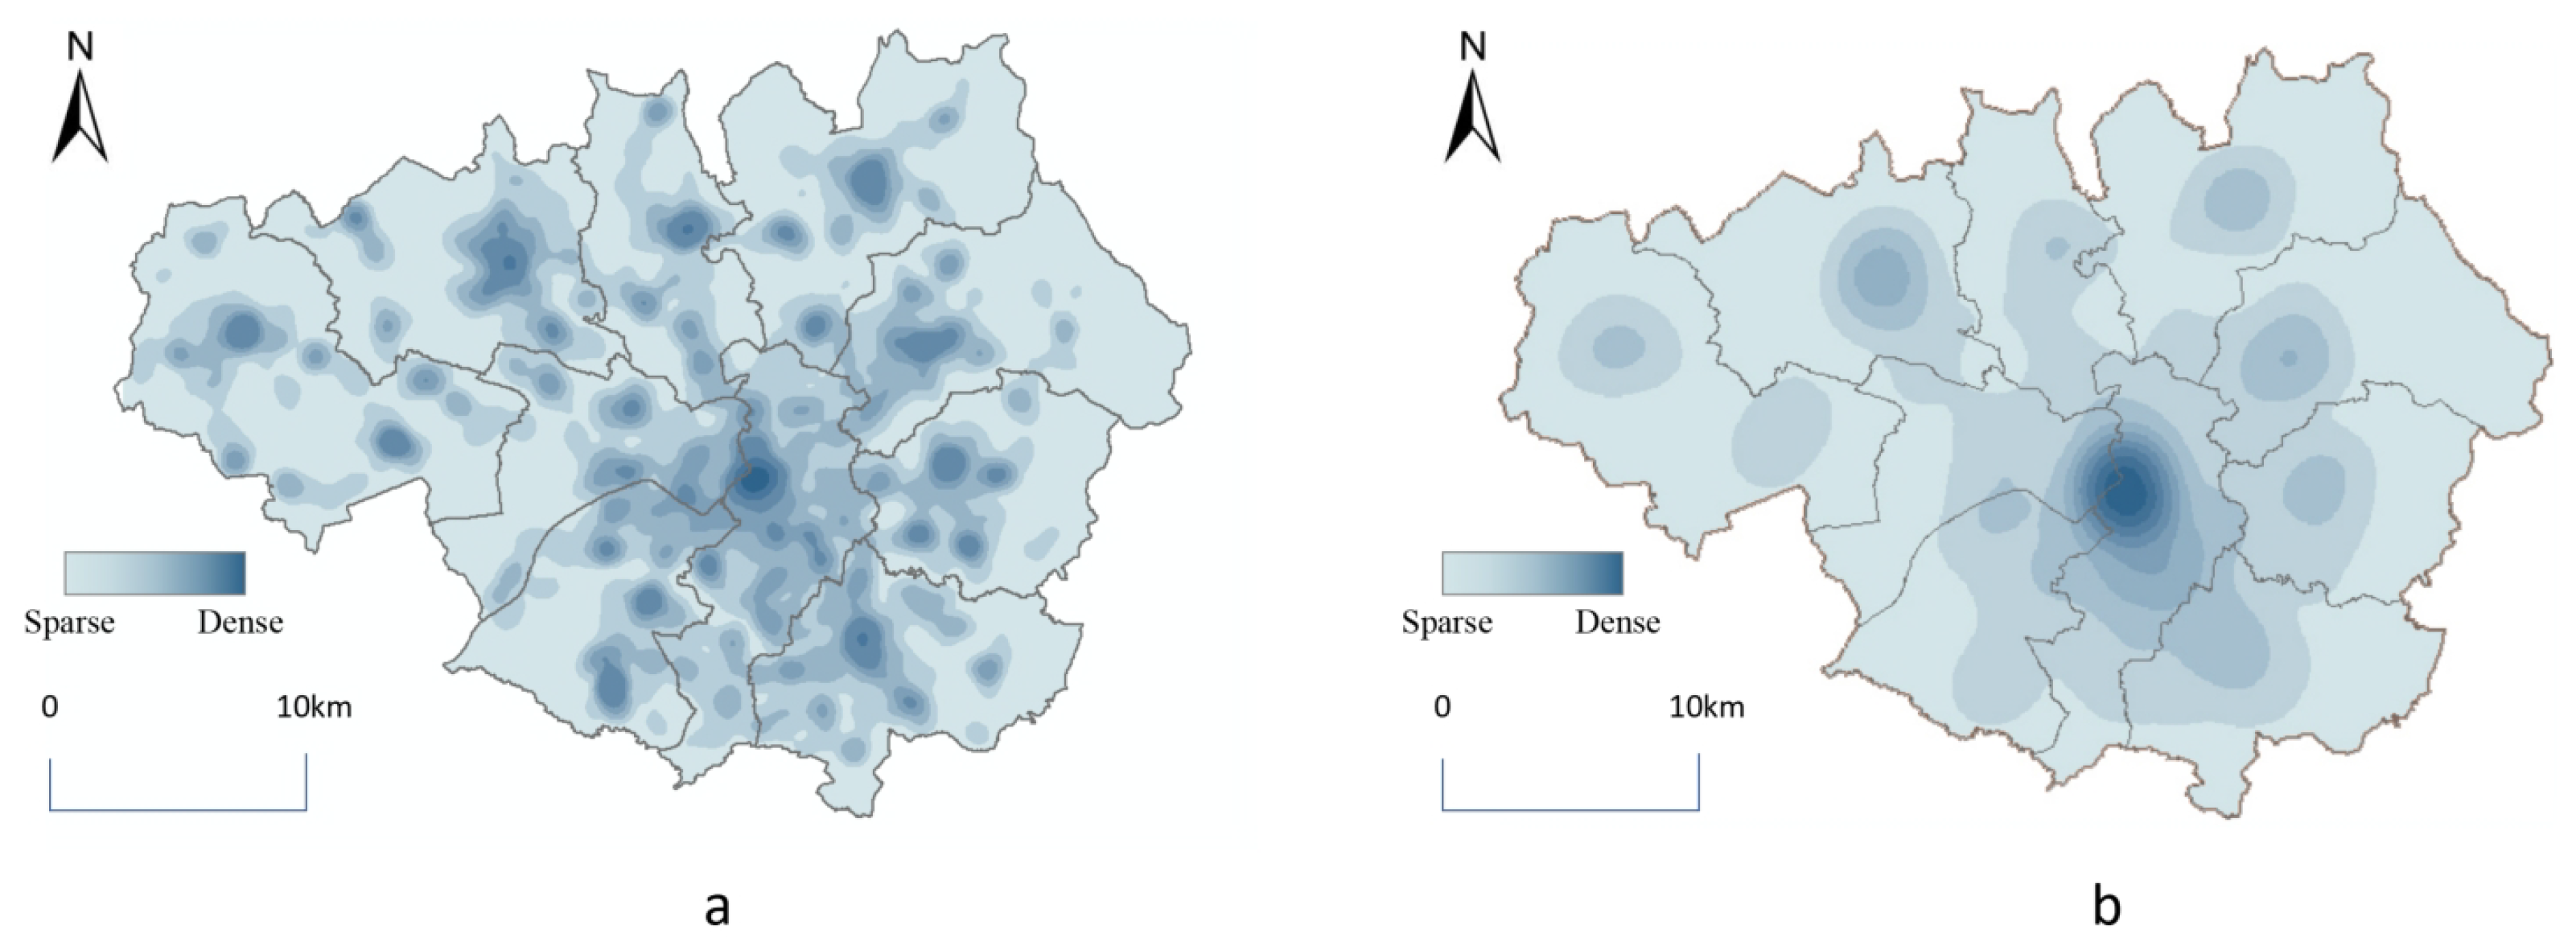
The grid pixel size of the kernel density analysis output also has an impact on the performance of the analysis results. By comprehensively considering the average influence range of commercial outlets and the dispersion degree of spatial distribution, the distance threshold of 50 m is selected for analysis, which can better identify the local hot information of the distribution of commercial outlets, and reflect the overall distribution characteristics. The ArcGIS software’s kernel density analysis tool sets the pixel size of the data layer to be analyzed at a radius of 50 m. Results were depicted in Figure 6.
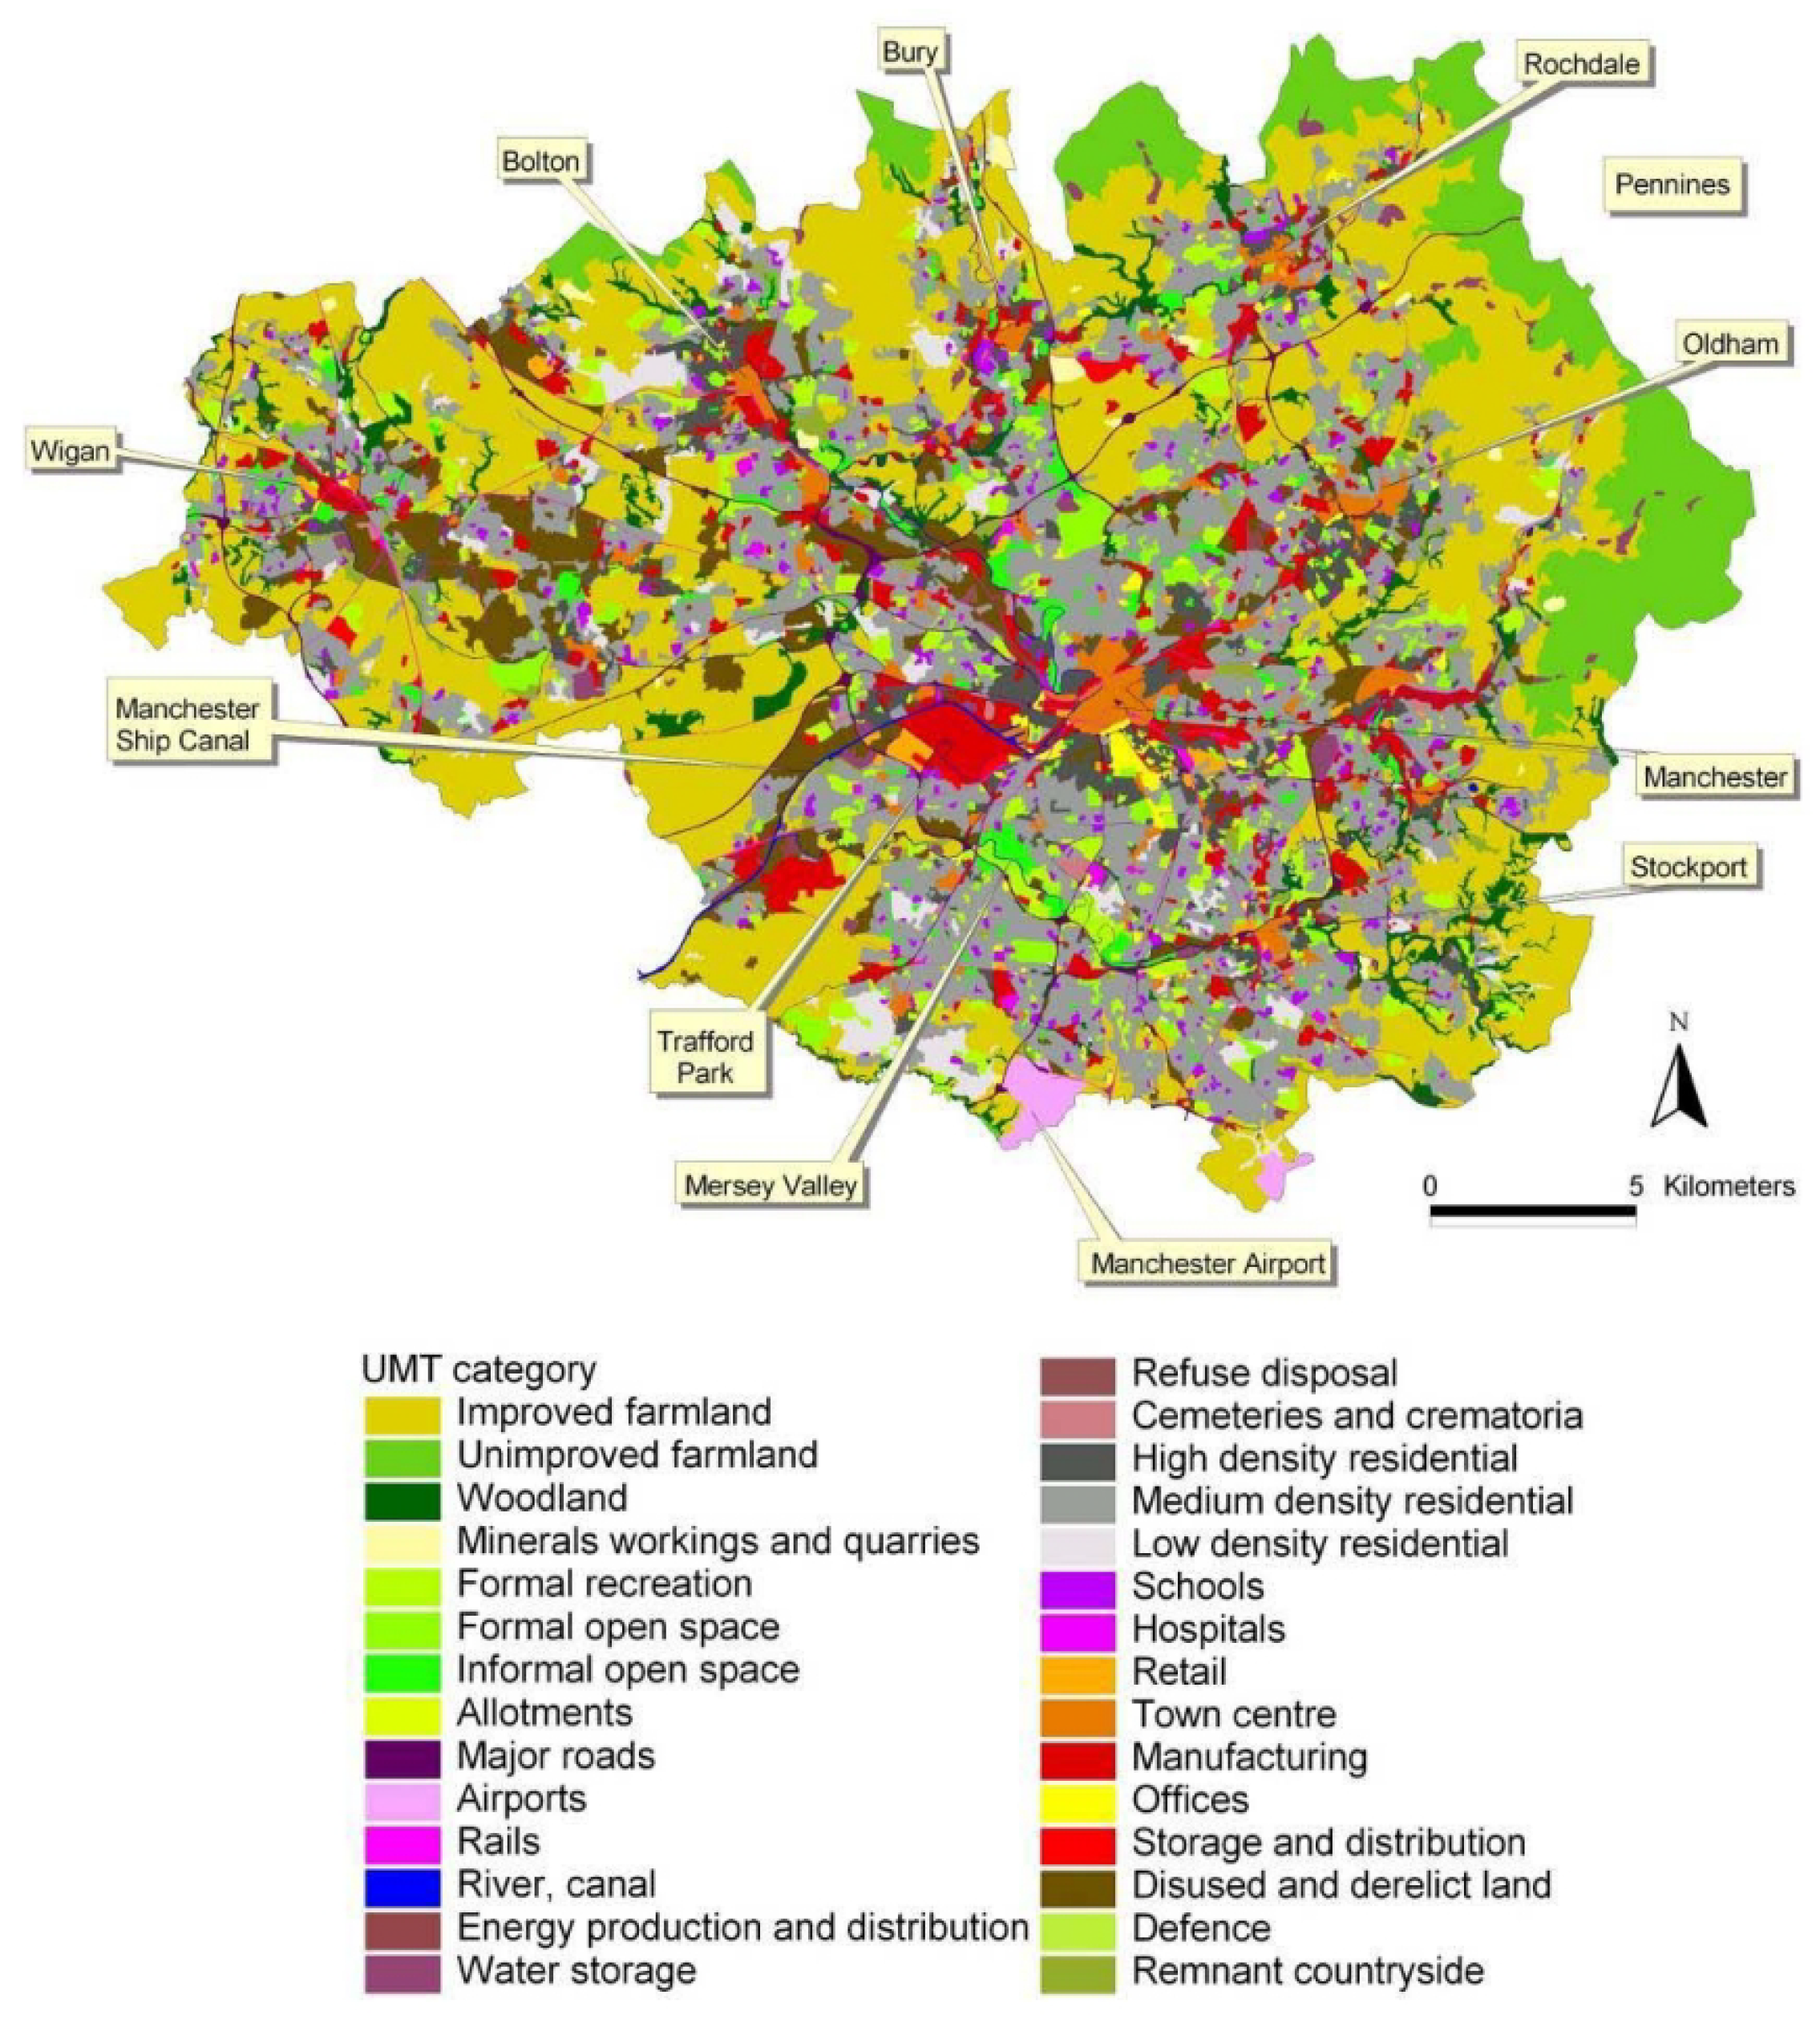
The kernel density analysis reveals that retail commerce in Greater Manchester exhibits a multicentric clustering pattern. This pattern, oriented along a “northwest-southeast” axis. When compared to Figure 7, this concentration can be attributed to the dense distribution of office and residential areas within these regions. Most of these areas have experienced both rapid and sustained growth, thus substantiating that the retail commercial agglomeration pattern in Manchester is predominantly associated with the clustering of residential and office areas.

4.2. Multi-Factor Analysis of Retail Distribution

The study conducted a Geographically Weighted Regression comparison between different commercial Spaces and urban pedestrian accessibility, community land and green park data to determine the influence of different factors.

4.2.1. Identify Retail Commercial Space Types

The DBSCAN algorithm was used to cluster the POI data spatial combination patterns of Manchester retail commerce. Appropriate m i n p o i n t s values and their corresponding ε values are selected, and the clustering results are shown in Figure 8. For the same type of data, clusters whose cluster density is greater than or equal to the mean value of all clusters can be regarded as relatively dense regions in the industry. The regions corresponding to these clusters are not only hot spots in the spatial aggregation of the service industry, but also important spatial nodes in the service industry. This method can also be used to identify “Discrete distribution” data, “Linear distribution” data, and “Infill distribution” data.
In reality, POI in Manchester city mainly gather in the city center, so no matter what values of Eps and m i n p o i n t s are taken, there will obviously exist one areas to form a large cluster. In the DBSCAN clustering algorithm, the selection of parameters Eps and m i n p o i n t s remains a non-trivial challenge. Toward the end of the 20th century, Ester et al. demonstrated that once K is fixed at 4 (a parameter employed to assist in determining Eps), variations in K have a relatively marginal impact on the final selection of Eps [48]. After iterative experiments, the clustering effect and the number of noise points are compared, and the best clustering result is selected. Finally, the parameters Eps = 100 m and m i n p o i n t s = 41 were selected, and the clustering results were 5 types (Table 2).
After DBSCAN algorithm analysis, 1338 POI data can be obtained as cluster type ‘1’ and ‘2’, which can be understood as “Infill distribution”. The remaining are clusters. Based on the cluster shape, cluster type ‘3’ can be identified as a commercial “Linear distribution”. The rest of the discrete isolated points are “Discrete distribution”.

4.2.2. The Relationship Between Different Urban Factors and Retail Commerce

Although many UK citizens may commute by car, the tendency to visit retail stores on foot should not be overlooked. However, not all community land falls within the retail service scope, especially in certain rural areas [49].
As depicted in Figure 9, through ArcGIS calculations, it can identify different data table fields and distinguish low-density, middle-density, and high-density community lands. All community lands are intended for residential use, and these areas are enveloped by retail commerce service areas. Notably, the service scope may vary depending on the functional role of the community land. Moreover, Green park is also an important leisure area, and it is distributed around low-density, middle-density, and high-density community lands, which may affect the distribution of retail stores.
In Manchester’s urban planning, it is valuable to conceive of 5-min ‘life scope’, the government should establish areas within 300 m of walking distance, encompassing various service facilities, including retail commerce. With these mathematical relationships, ArcGIS software can map out the boundaries of these walking distance regions based on the path of the walking principle. Figure 9a illustrates the boundaries for both the 300-m walking distance areas. These service scope contours, centered on retail stores, are based on equivalent time costs for walking distances from different roads.
The spatial heterogeneity of retail trade was studied by using a Geographically Weighted Regression model. In this paper, high-density residential land, medium-density residential land, low-density residential land, commercial land, park land and pedestrian coverage of roads were selected as dependent variable, and the spatial location of retail commerce (Infill, Linear, Discrete) was selected as independent variables. Spatial connection was made based on ArcGIS platform, and Geographically Weighted Regression model was used to visually analyze the influencing factors of retail industry distribution in local blocks. Across all GWR model outputs, the AICc (Akaike Information Criterion corrected) values exhibit a range from 1500 to 2000 . This indicates that the current GWR model more effectively characterizes the spatial relationship between retail commercial spaces and other types of urban land use. The regression coefficients of each influencing factor are shown in Table 3.
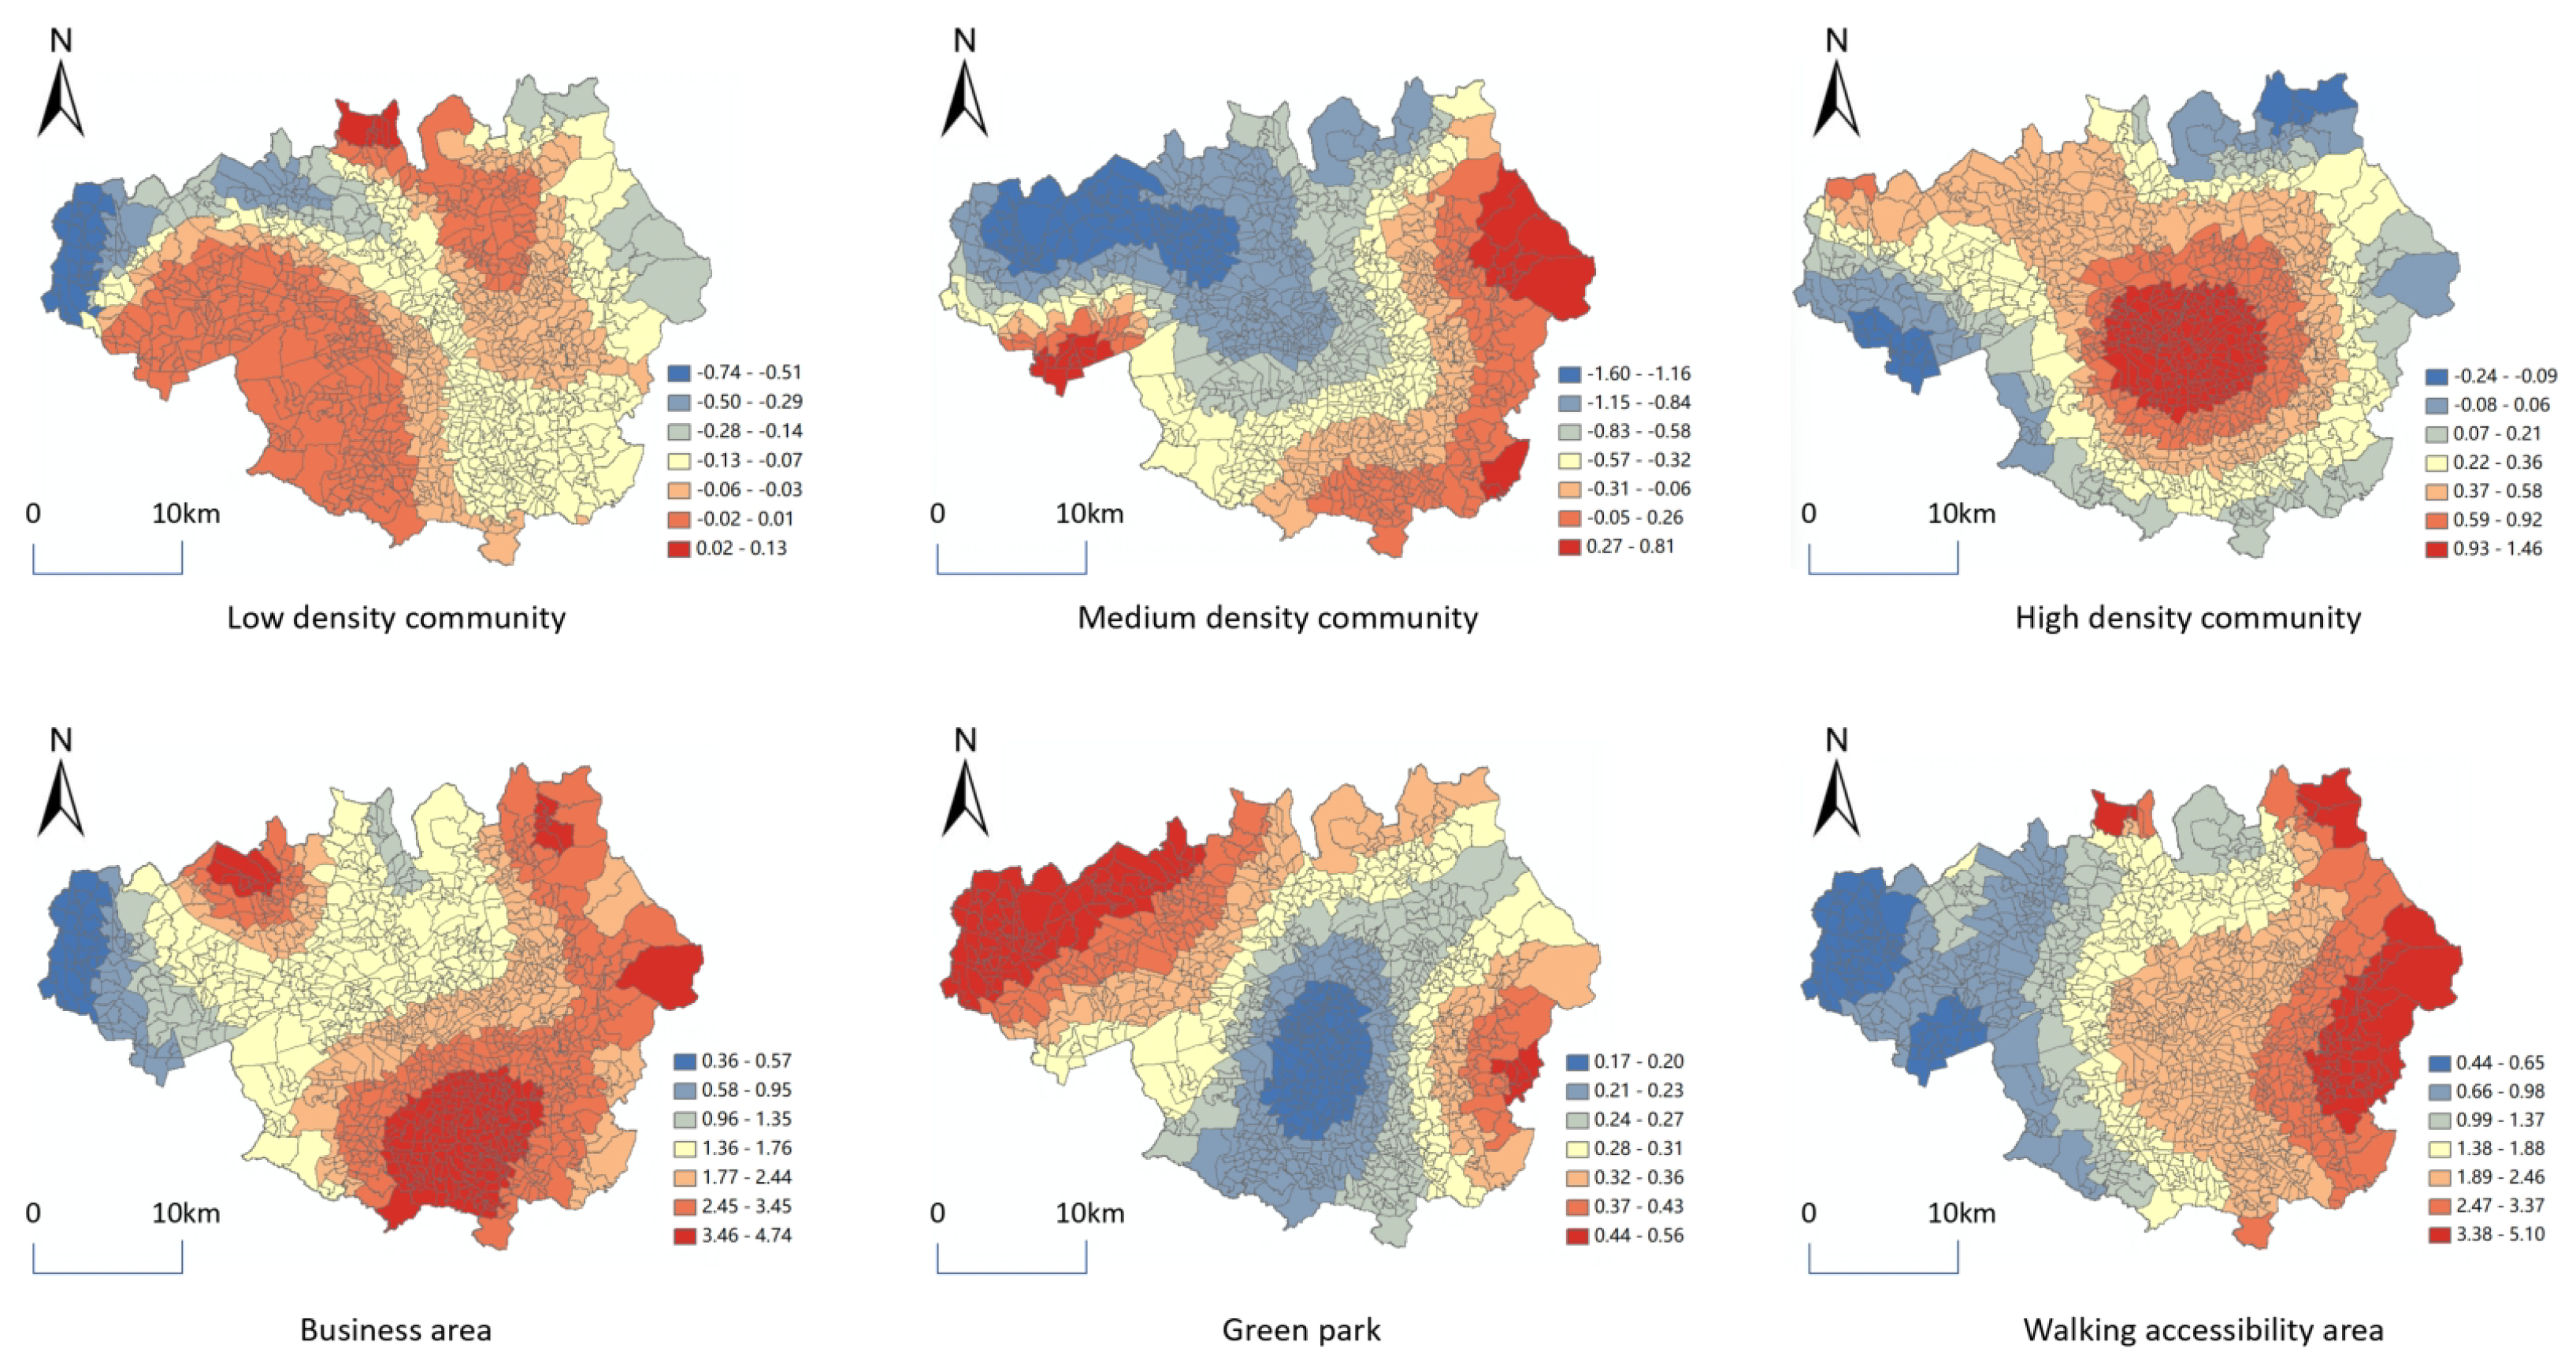
(1) For “Whole distribution” retail commerce analysis, R 2 of high-density community, walking accessibility area and business area is greater than 0.6. The results show that the three variables of high-density community, walking accessibility area and business area have positive effects on the spatial distribution of retail commerce in Manchester. Among them, the Business area has the greatest influence on the spatial distribution of retail, and R 2 is 0.724, indicating that the development structure of retail commerce in Manchester is similar to the development direction of the city, because its distribution is similar to that of Business area. As the spatial distribution of regression coefficient shows (Figure 10), it is confirmed once again that “Whole distribution” has a positive effect on the high-density community, Business area and Walking accessibility area, and its regression coefficient is positive. This shows that they can promote the development of “Whole distribution” of retail commerce. Reflecting the high walkability and commercial density of the site can promote the development of retail commerce.
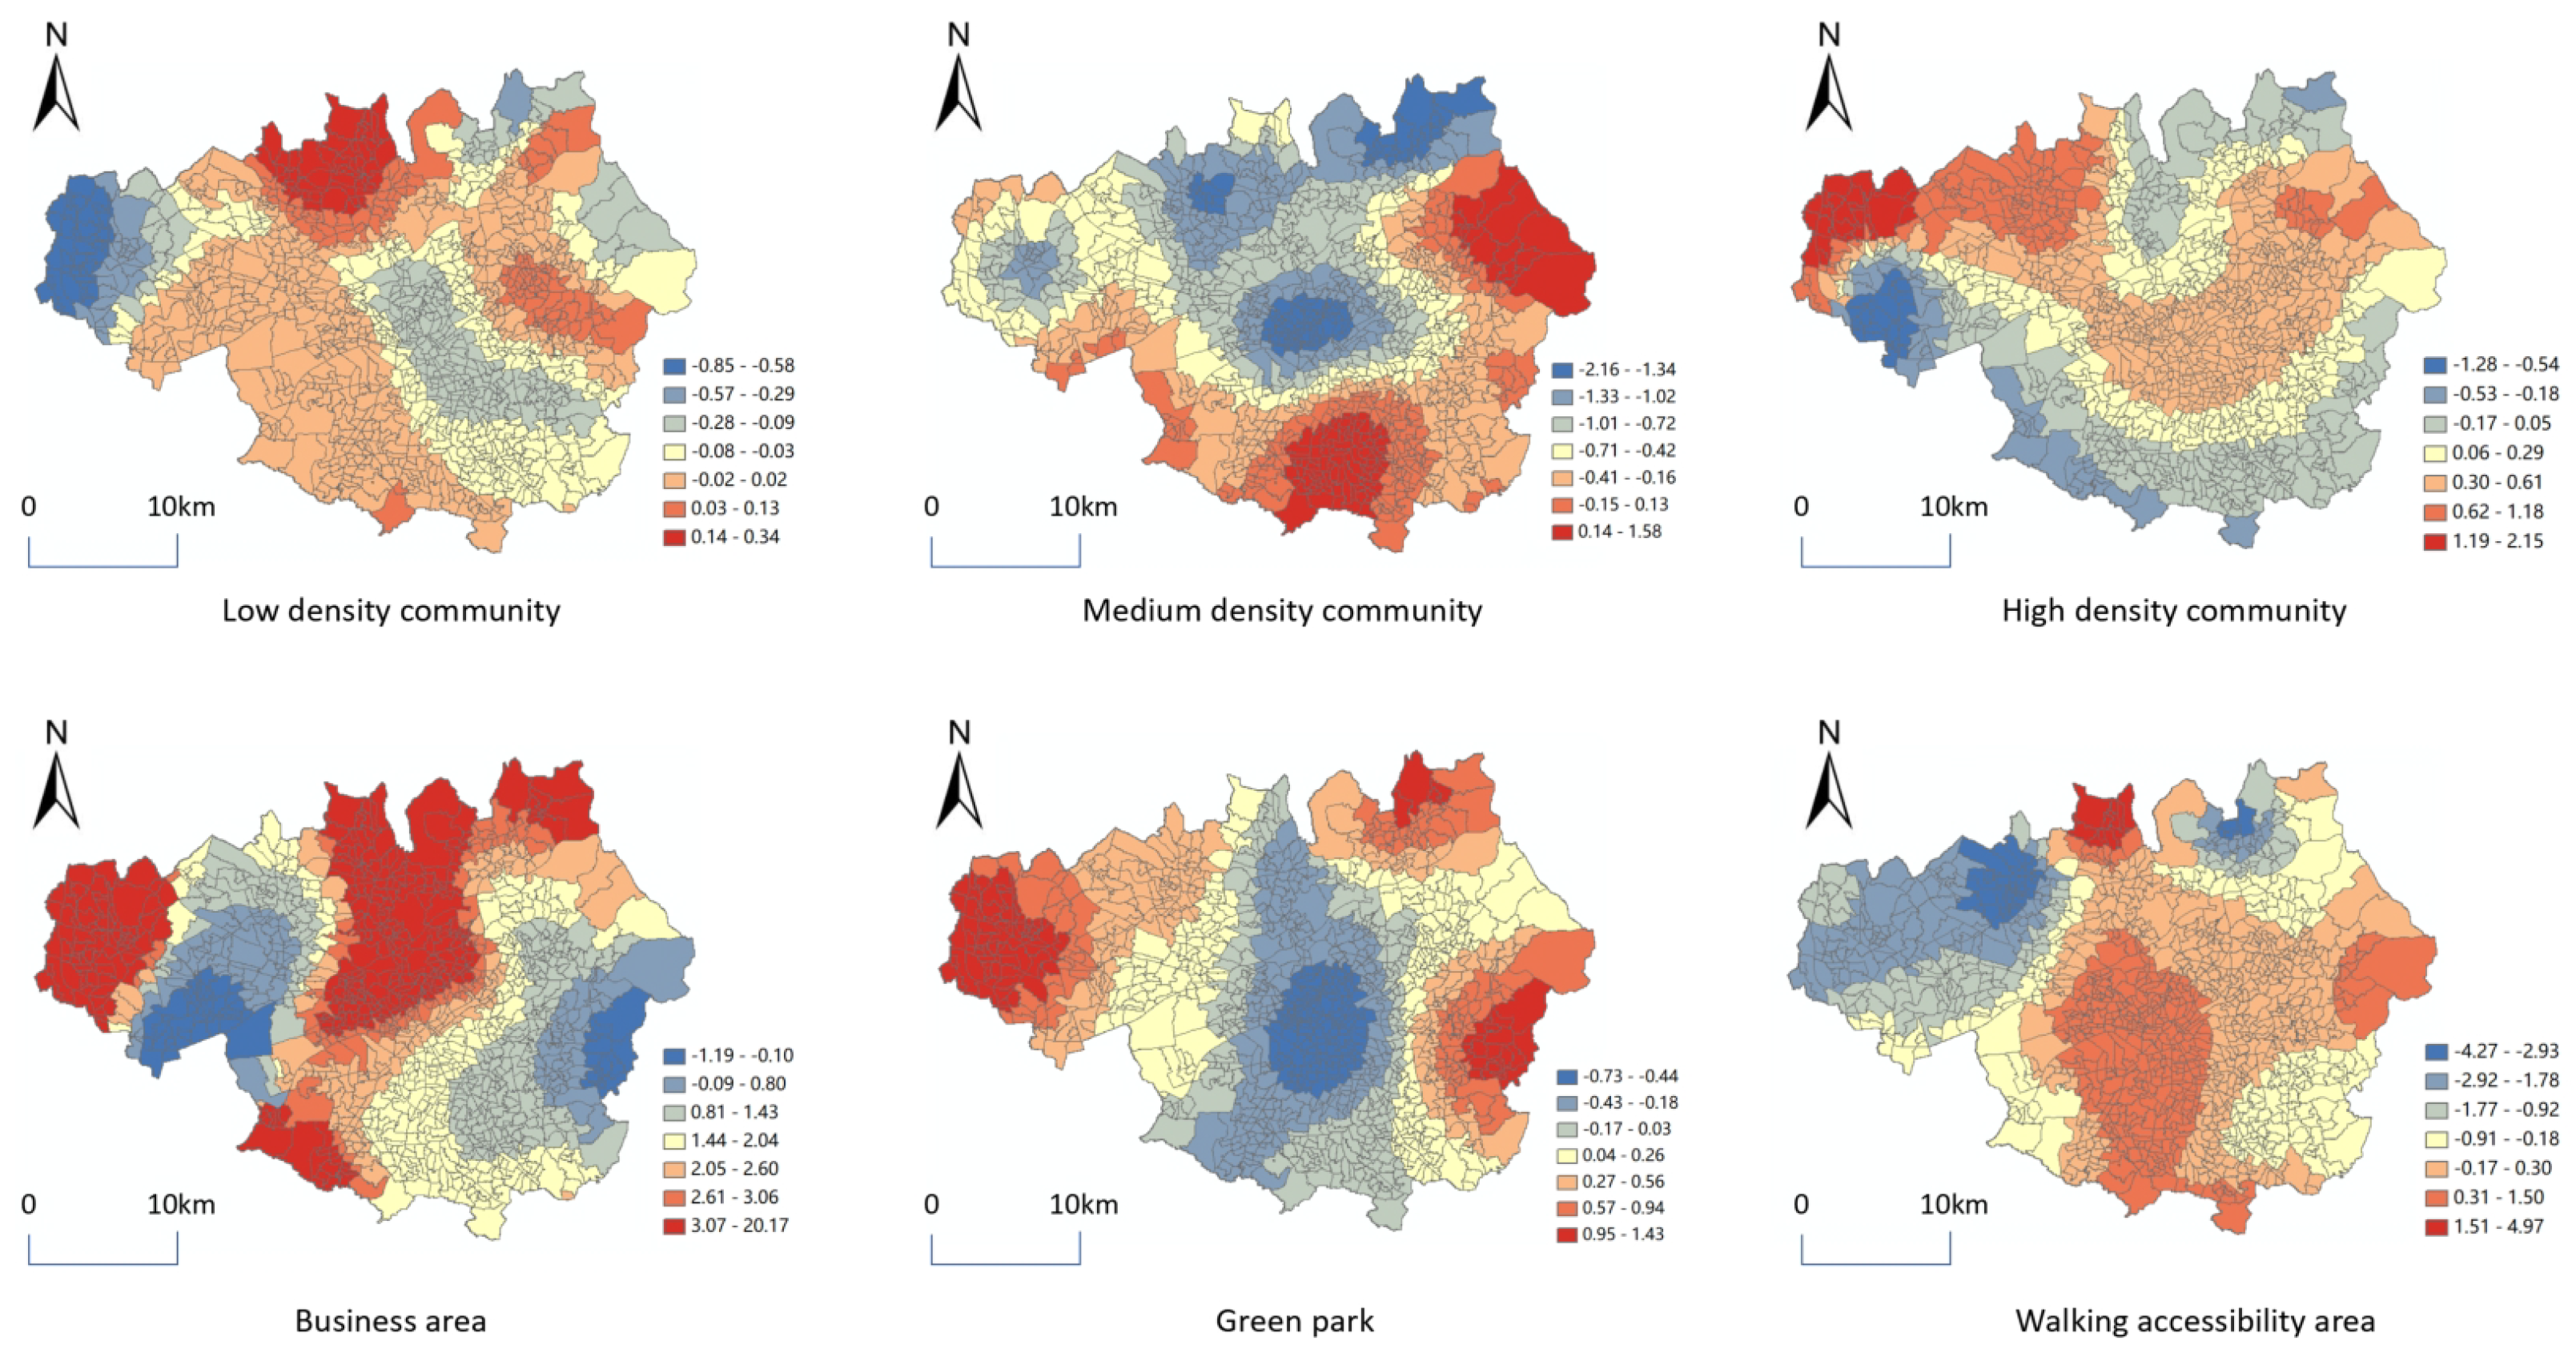
(2) In “Infill distribution” retail commerce analysis, the R 2 of high-density community, medium-density community and Business area is greater than 0.5. It has a positive attraction effect on the distribution of retail trade. Among them, the spatial similarity with the Business area is the greatest, and its agglomeration distribution pattern is also in line with the location of the central development area of the city. More people in a certain street lead to stronger purchasing power and consumption demand, which will be attractive to the distribution of retail industry. As the spatial distribution of regression coefficient shows in Figure 11, it is demonstrated that the Geographically Weighted Regression coefficient of “Infill distribution” for high-density community, medium-density community and Business area is positive. The “Infill distribution” of retail commerce is more suitable in areas of high-density and medium-density community and business dense premises.
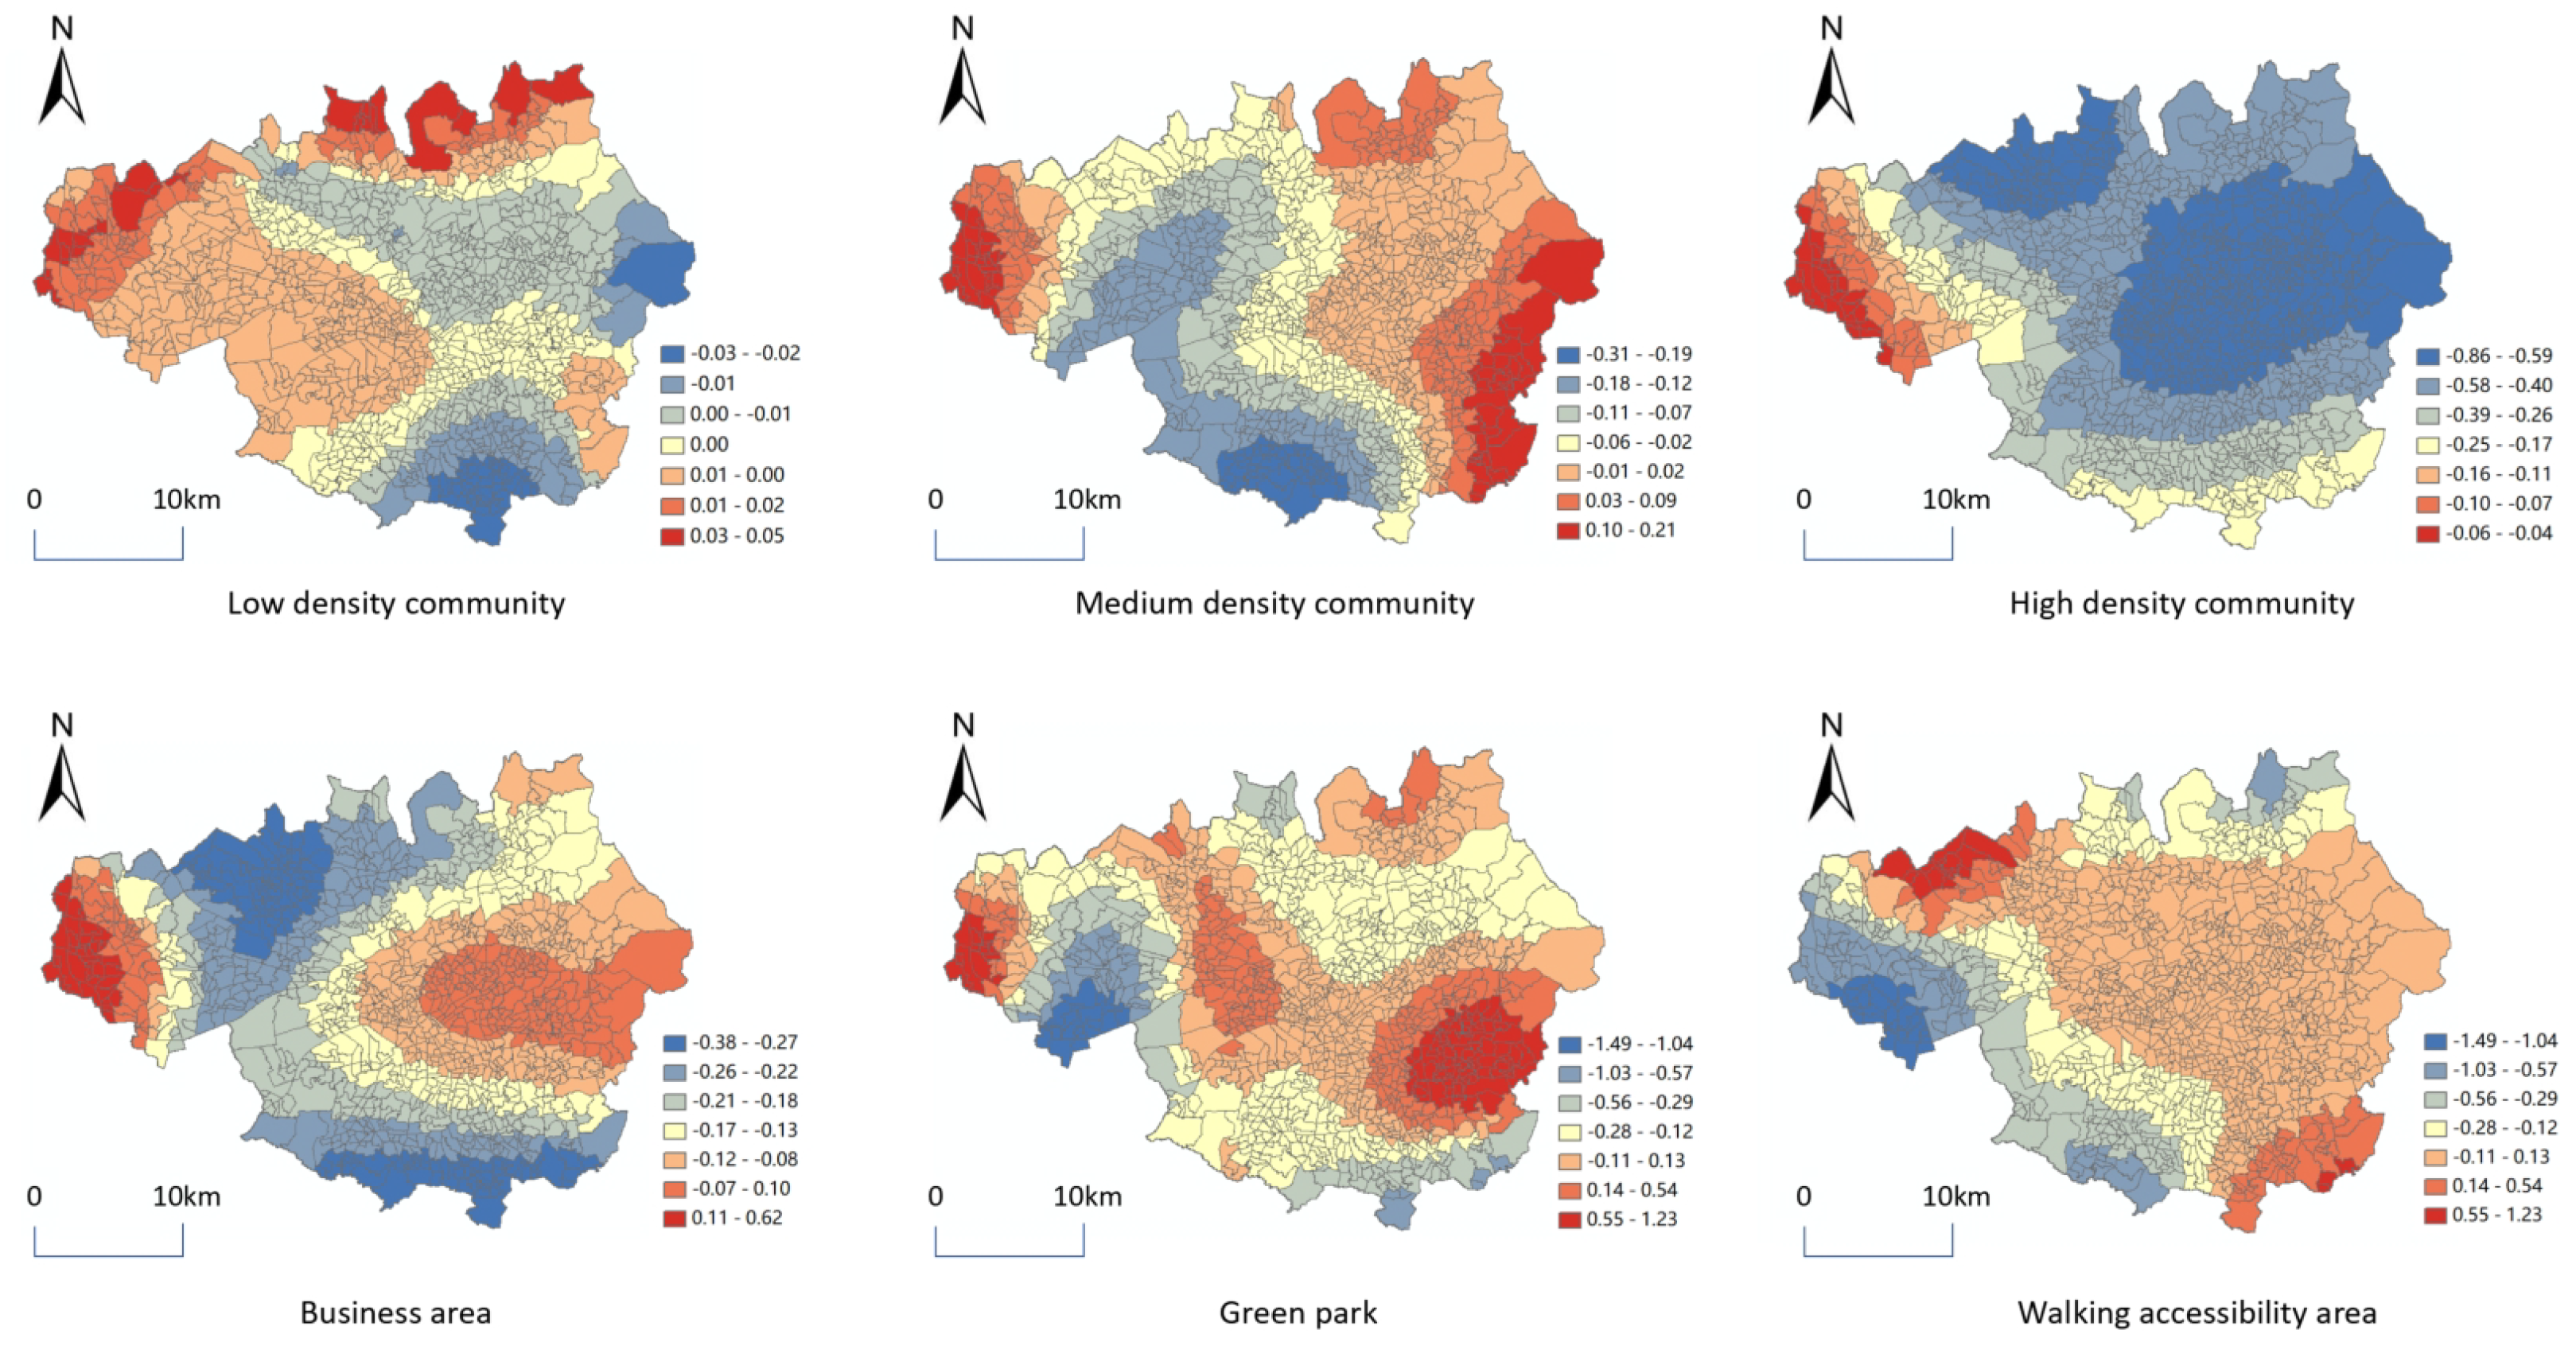
(3) In “Linear distribution” retail commerce analysis, it relatively scattered, and most of the correlation factors R 2 are less than 0.5. However, the R 2 of the Walking accessibility area is greater than 0.7, indicating that the development trajectory of “Linear distribution” retail commerce is very similar to that of the Walking accessibility area. As the spatial distribution of regression coefficient shows in Figure 12, it shows that the Geographically Weighted Regression coefficient of Linear distribution for Walking accessibility area is positive, and its highest value is 7.5, which is much higher than that of other types for Walking accessibility area. The Walking accessibility area is more suitable for Linear distribution retail commerce. Meanwhile, Green park also plays a positive role in promoting the development of “Linear distribution” retail commerce. It can be judged that areas with walking roads and green parks around them will also attract certain retail stores.
(4) “Discrete distribution” retail commerce, as shown in Figure 13, has a correlation with other urban development factors is lower than 0.5, but its correlation with Green park R 2 is greater than 0.4, which is significantly higher than other urban development factors. It shows that although the “Discrete distribution” retail commerce has little correlation with the factors of urban development, but the results indicate that the “Discrete distribution” exhibits the highest Geographically Weighted Regression coefficient related to green parks, with its value reaching 1.23. Notably, the spatial distribution of green parks can further promote this “Discrete distribution” pattern.

5. Discussion

Although this study has limitations, it also presents significant implications. Certain results or methodologies might serve as valuable references for fellow researchers. Consequently, areas for future exploration should encompass:
  • Comparison with data from different groups: Few instances exist where data sets have been utilized to elucidate the correlation between retail commerce dispersion and different urban function areas. This study endeavors to harness varying data types for comparison, with the aim of identifying meaningful relationships. DBSCAN identifies different retail commercial spaces, Kernel density analysis identifies the distribution characteristics of commercial quantity, and GWR identifies the relationship between commerce and different urban factors.
  • Assessing urban planning: Previously, urban studies in Manchester have given scant attention to the practicality of urban planning implementation. This study, however, juxtaposes the findings from our urban analysis with the Manchester City Plan, aiming to evaluate the urban planning from a commercial standpoint. We hope this will stimulate further scholarly contemplation regarding the multifaceted nature of future urban development appraisals.
  • Tapping the multiple potentials of POI data: This investigation explores the application of POI data analysis in the context of Manchester. Although our focus is squarely on the commercial facet, this research represents a novel contribution to Manchester-centric studies. Through the analysis of urban data, more laws of urban development can be found. Moreover, this inquiry aims to galvanize scholarly interest in POI data.
  • GWR model assumes continuous spatial relationships, yet reality often contradicts this: Geographically Weighted Regression (GWR) operates under the underlying assumption that spatial relationships change continuously across space. However, real-world spatial processes often exhibit discontinuous or abrupt changes. For instance, retail commercial density at urban edges may decline sharply due to zoning regulations, rather than decreasing gradually. Such mismatches between the model’s assumptions and empirical spatial dynamics can lead to biased or misleading coefficient estimates. A multitude of factors influence retail commerce patterns, with community, park, walking coverage serving as just some components. Moreover, specific operational conditions such as the turnover of retail commerce have not been taken into account. These caveats present avenues for future research to build upon our findings and methodology.
  • Strengthen the application of mathematical analysis models: Through the effectiveness comparison of various mathematical models, this study uses fewer mathematical models and lacks horizontal comparison. With the development of urban data analysis in the future, the application characteristics of different analysis conditions on different data models can be summarized, so as to enhance the accuracy of the research.

6. Conclusions

This study delves into the extraction and identification of key elements within urban retail commerce, scrutinizing the spatial distribution characteristics of these entities within Manchester. This is achieved through a novel application of land use data and urban POI data.
We propose a combination of different assessment techniques for analyzing the spatial distribution characteristics of retail commerce, rooted in land use functions and city data. Uniquely, unlike previous urban data which remained unsegmented, our distribution characterization methodology enables a comparison with Manchester’s original plan, providing insights into the trajectory of commercial patterns. Simultaneously, it furnishes a technique for analyzing the location strategy of retail commerce. In Lisbon, Portugal, analysis has revealed that street centrality has a positive impact on street commerce, especially when combined with transportation and convenience facilities [50].
This study aims to elucidate the impacts of urban factors within different categories of communities. The primary contributions of this paper can be distilled into two core elements:
  • Urban Retail Commercial Distribution Structure: Utilizing the collected commercial POI data, we derive the contour and distribution of commercial districts within the city using planar kernel density estimation’s Euclidean distance calculation. Our analysis reveals a decrease in POI distribution density from the cluster center to peripheral areas. Our analysis indicates that from the center to the peripheral areas, the distribution density of retail commerce POI points shows a downward trend, which is similar to the spatial characteristic of Manchester where urban land is concentrated internally and dispersed externally. Intuitively, there is a certain degree of spatial correlation between Manchester’s retail commerce POI and urban land.
  • Analysis of the correlation factors of retail commercial distribution in different cities: a correlation method leveraging urban land use function factors is proposed, based on the spatial distribution of clustered retail commercial POI identified through clustering algorithms. Spatial similarities between retail commerce and other factors were identified by Geographically Weighted Regression. The results show that different commercial space models are affected by different urban factors. ‘Infill stores’ are similar to the development of the city’s central business district, the distribution of ‘Linear stores’ is consistent with the urban road space, and the city’s green parks will attract ‘Discrete stores’. The spatial relationship between retail commercial POI points and different types of urban land in Manchester will change as the functional attributes of the community change. The spatial dependence between ‘Infill stores’ and ‘High density community’ is relatively high, while the spatial dependence between ‘Linear stores’ and ‘Walking accessibility area’ is also relatively high. From the perspective of the entire market mechanism, areas with large foot traffic require ‘Infill stores’ to meet the demand for foot traffic, and ‘Linear stores’ are needed along the roads to meet the shopping needs during daily commutes. However, from the perspective of urban managers, scattered areas require ‘Discrete stores’, and high-density residential areas need ‘Infill stores’ to address the living needs of citizens. Therefore, in future commercial layouts, if it is an urgent need, it can be located around the roads; if it is ‘Discrete stores’, it can be located in low-density communities; and ‘Infill stores’ should be placed in high-density communities.

Author Contributions

Conceptualization: T.X., Y.C., F.G., Y.T.H.C. and J.Z.; Methodology: T.X., Y.C., F.G. and Y.T.H.C.; Software: T.X., Y.C., F.G. and Y.T.H.C.; Validation: T.X., Y.C., F.G. and Y.T.H.C.; Formal analysis: T.X., Y.C., F.G. and Y.T.H.C.; Investigation: T.X., Y.C., F.G. and Y.T.H.C.; Resources: T.X., Y.C., F.G. and Y.T.H.C.; Data curation: T.X., Y.C., F.G. and Y.T.H.C.; Writing—original draft: T.X., Y.C. and F.G.; Writing—review & editing: T.X., Y.C., F.G., Y.T.H.C., J.Z. and K.L.K.; Visualization: T.X., Y.C., F.G. and Y.T.H.C. All authors have read and agreed to the published version of the manuscript.

Funding

This research received no external funding.

Data Availability Statement

The data and materials that support the findings of this study are available from the corresponding author upon reasonable request.

Conflicts of Interest

The authors declare no conflicts of interest.

Abbreviations

The following abbreviations are used in this manuscript:
GWRGeographically Weighted Regression
DBSCANDensity-Based Spatial Clustering of Applications with Noise
POIPoint of Interest

References

  1. Sassen, S.; Ufer, U. Urban digitization and financial capitalism: How do urban digitization and financial capitalism impact on the local transformation, sustainability and resilience of our cities? Tatup-Zeitschrift Tech. Theor. Prax./J. Technol. Assess. Theory Pract. 2021, 30, 70–73. [Google Scholar]
  2. Sarker, I.H. Smart City Data Science: Towards data-driven smart cities with open research issues. Internet Things 2022, 19, 100528. [Google Scholar] [CrossRef]
  3. Vojteková, J.; Vojtek, M. GIS-based landscape stability analysis: A comparison of overlay method and fuzzy model for the case study in Slovakia. Prof. Geogr. 2019, 71, 631–644. [Google Scholar] [CrossRef]
  4. Minoiu, M.C.; Reddy, S. Kernel Density Estimation Based on Grouped Data: The Case of Poverty Assessment; International Monetary Fund: Washington, DC, USA, 2008. [Google Scholar]
  5. Li, Q.; Bessell, L.; Xiao, X.; Fan, C.; Gao, X.; Mostafavi, A. Disparate patterns of movements and visits to points of interest located in urban hotspots across US metropolitan cities during COVID-19. R. Soc. Open Sci. 2021, 8, 201209. [Google Scholar] [CrossRef]
  6. Hoek, G.; Beelen, R.; De Hoogh, K.; Vienneau, D.; Gulliver, J.; Fischer, P.; Briggs, D. A review of land-use regression models to assess spatial variation of outdoor air pollution. Atmos. Environ. 2008, 42, 7561–7578. [Google Scholar] [CrossRef]
  7. Shirowzhan, S.; Lim, S.; Trinder, J.; Li, H.; Sepasgozar, S.M. Data mining for recognition of spatial distribution patterns of building heights using airborne lidar data. Adv. Eng. Inform. 2020, 43, 101033. [Google Scholar] [CrossRef]
  8. Kimanzi, J.K.; Wishitemi, B.E. Effects of land use changes on herbivores of Masai Mara ecosystem. Int. J. Environ. Stud. 2001, 58, 727–740. [Google Scholar] [CrossRef]
  9. Newton, P. Urban Consumption; CSIRO Publishing: Melbourne, Australia, 2011. [Google Scholar]
  10. Fotheringham, A.S.; Brunsdon, C.; Charlton, M. Geographically weighted regression. In The SAGE Handbook of Spatial Analysis; SAGE Publications Ltd: New York, NY, USA, 2009; Volume 1, pp. 243–254. [Google Scholar]
  11. Hou, G.; Chen, L. Regional commercial center identification based on POI big data in China. Arab. J. Geosci. 2021, 14, 1360. [Google Scholar] [CrossRef]
  12. Jiang, S.; Alves, A.; Rodrigues, F.; Ferreira, J., Jr.; Pereira, F.C. Mining point-of-interest data from social networks for urban land use classification and disaggregation. Comput. Environ. Urban Syst. 2015, 53, 36–46. [Google Scholar] [CrossRef]
  13. Lu, C.; Pang, M.; Zhang, Y.; Li, H.; Lu, C.; Tang, X.; Cheng, W. Mapping urban spatial structure based on poi (point of interest) data: A case study of the central city of Lanzhou, China. ISPRS Int. J. Geo-Inf. 2020, 9, 92. [Google Scholar] [CrossRef]
  14. Zheng, D.; Li, C. Research on Spatial Pattern and Its Industrial Distribution of Commercial Space in Mianyang Based on POI Data. J. Data Anal. Inf. Process. 2020, 8, 20. [Google Scholar] [CrossRef]
  15. Deng, Y.; Liu, J.; Liu, Y.; Luo, A. Detecting urban polycentric structure from POI data. ISPRS Int. J. Geo-Inf. 2019, 8, 283. [Google Scholar] [CrossRef]
  16. Malakootian, M.; Fatehizadeh, A.; Meydani, E. Investigation of corrosion potential and precipitation tendency of drinking water in the Kerman distribution system. Tolooebehdasht 2013, 11, 1–10. [Google Scholar]
  17. Venerandi, A.; Quattrone, G.; Capra, L.; Quercia, D.; Saez-Trumper, D. Measuring urban deprivation from user generated content. In Proceedings of the 18th ACM Conference on Computer Supported Cooperative Work & Social Computing, Vancouver, BC, Canada, 14–18 March 2015; pp. 254–264. [Google Scholar]
  18. Zhang, Y.; Li, X.; Jiang, Q.; Chen, M.; Liu, L. Quantify the spatial association between the distribution of catering business and urban spaces in London using catering POI data and image segmentation. Atmosphere 2022, 13, 2128. [Google Scholar] [CrossRef]
  19. Peng, S.; Fang, J.; Han, C.; Cheng, Z. VegaMinerPOI: A spatial data mining system for POI datasets. In Proceedings of the 2009 17th International Conference on Geoinformatics, Fairfax, VA, USA, 12–14 August 2009; pp. 1–4. [Google Scholar]
  20. Patroumpas, K.; Skoutas, D.; Mandilaras, G.; Giannopoulos, G.; Athanasiou, S. Exposing points of interest as linked geospatial data. In Proceedings of the 16th International Symposium on Spatial and Temporal Databases, Vienna, Austria, 19–21 August 2019; pp. 21–30. [Google Scholar]
  21. Faqe Ibrahim, G.R. Urban land use land cover changes and their effect on land surface temperature: Case study using Dohuk City in the Kurdistan Region of Iraq. Climate 2017, 5, 13. [Google Scholar] [CrossRef]
  22. Ponce-Lopez, R.; Ferreira, J., Jr. Identifying and characterizing popular non-work destinations by clustering cellphone and point-of-interest data. Cities 2021, 113, 103158. [Google Scholar] [CrossRef]
  23. Lou, G.; Chen, Q.; He, K.; Zhou, Y.; Shi, Z. Using nighttime light data and POI big data to detect the urban centers of Hangzhou. Remote Sens. 2019, 11, 1821. [Google Scholar] [CrossRef]
  24. Milias, V.; Psyllidis, A. Assessing the influence of point-of-interest features on the classification of place categories. Comput. Environ. Urban Syst. 2021, 86, 101597. [Google Scholar] [CrossRef]
  25. Mills, E.S. The value of urban land. In The Quality of the Urban Environment; Routledge: London, UK, 2015; pp. 229–253. [Google Scholar]
  26. Podrasa, D.; Zeile, P.; Neppl, M. Machine Learning for Land Use Scenarios and Urban Design. Cities 2021, 489–498. [Google Scholar]
  27. Fang, Y.; Mao, J.; Liu, Q.; Huang, J. Exploratory space data analysis of spatial patterns of large-scale retail commercial facilities: The case of Gulou District, Nanjing, China. Front. Archit. Res. 2021, 10, 17–32. [Google Scholar] [CrossRef]
  28. Humpel, N.; Owen, N.; Leslie, E. Environmental factors associated with adults’ participation in physical activity: A review. Am. J. Prev. Med. 2002, 22, 188–199. [Google Scholar] [CrossRef]
  29. Brenner, C. Building reconstruction from images and laser scanning. Int. J. Appl. Earth Obs. Geoinf. 2005, 6, 187–198. [Google Scholar] [CrossRef]
  30. Lian, H.; Li, G. Correlation Analysis of Retail Space and Shopping Behavior in a Commercial Street Based on Space Syntax: A Case of Shijiazhuang, China. Buildings 2023, 13, 2674. [Google Scholar] [CrossRef]
  31. Millward-Hopkins, J.; Tomlin, A.; Ma, L.; Ingham, D.; Pourkashanian, M. Assessing the potential of urban wind energy in a major UK city using an analytical model. Renew. Energy 2013, 60, 701–710. [Google Scholar] [CrossRef]
  32. De Gennaro, M.; Paffumi, E.; Scholz, H.; Martini, G. GIS-driven analysis of e-mobility in urban areas: An evaluation of the impact on the electric energy grid. Appl. Energy 2014, 124, 94–116. [Google Scholar] [CrossRef]
  33. Herold, M.; Goldstein, N.C.; Clarke, K.C. The spatiotemporal form of urban growth: Measurement, analysis and modeling. Remote Sens. Environ. 2003, 86, 286–302. [Google Scholar] [CrossRef]
  34. Dablanc, L. City distribution, a key element of the urban economy: Guidelines for practitioners. In City Distribution and Urban Freight Transport; Edward Elgar Publishing: Cheltenham, UK, 2011. [Google Scholar]
  35. Sun, Z.; Bell, S.; Scott, I.; Qian, J. Everyday use of urban street spaces: The spatio-temporal relations between pedestrians and street vendors: A case study in Yuncheng, China. Landsc. Res. 2020, 45, 292–309. [Google Scholar] [CrossRef]
  36. Rajakallio, K.; Cuthbertson, R.; Pulkka, L.; Junnila, S. Creating urban platforms—Opportunities and challenges for innovation in commercial real estate development. Cities 2018, 77, 92–103. [Google Scholar] [CrossRef]
  37. Cetinkaya, S.; Basaraner, M.; Burghardt, D. Proximity-based grouping of buildings in urban blocks: A comparison of four algorithms. Geocarto Int. 2015, 30, 618–632. [Google Scholar] [CrossRef]
  38. Kashef, M. Urban livability across disciplinary and professional boundaries. Front. Archit. Res. 2016, 5, 239–253. [Google Scholar] [CrossRef]
  39. Kickert, C.; Vom Hofe, R.; Haas, T.; Zhang, W.; Mahato, B. Spatial dynamics of long-term urban retail decline in three transatlantic cities. Cities 2020, 107, 102918. [Google Scholar] [CrossRef] [PubMed]
  40. Du, H.; Mulley, C. Relationship between transport accessibility and land value: Local model approach with geographically weighted regression. Transp. Res. Rec. 2006, 1977, 197–205. [Google Scholar] [CrossRef]
  41. He, J.; Huang, X.; Xi, G. Measuring urban metrics of creativity using a grid-based geographically weighted regression model. J. Urban Plan. Dev. 2018, 144, 05018008. [Google Scholar] [CrossRef]
  42. Vafeiadis, E. Exploring the Distribution of Accessibility by Public Transport Using Spatial Analysis: A Case Study for Retail Concentrations and Public Hospitals in Athens. Master’s Thesis, Lund University, Lund, Sweden, 2019. [Google Scholar]
  43. Deener, A. Commerce as the structure and symbol of neighborhood life: Reshaping the meaning of community in Venice, California. City Community 2007, 6, 291–314. [Google Scholar] [CrossRef]
  44. Sevtsuk, A. Location and agglomeration: The distribution of retail and food businesses in dense urban environments. J. Plan. Educ. Res. 2014, 34, 374–393. [Google Scholar] [CrossRef]
  45. Bilal, M.; Oyedele, L.O.; Qadir, J.; Munir, K.; Ajayi, S.O.; Akinade, O.O.; Owolabi, H.A.; Alaka, H.A.; Pasha, M. Big Data in the construction industry: A review of present status, opportunities, and future trends. Adv. Eng. Inform. 2016, 30, 500–521. [Google Scholar] [CrossRef]
  46. Aljumaily, H.; Laefer, D.F.; Cuadra, D. Urban point cloud mining based on density clustering and MapReduce. J. Comput. Civ. Eng. 2017, 31, 04017021. [Google Scholar] [CrossRef]
  47. Ester, M. Density-based clustering. In Data Clustering; Chapman & Hall/CRC: London, UK, 2018; pp. 111–127. [Google Scholar]
  48. Ester, M.; Kriegel, H.P.; Sander, J.; Xu, X. A density-based algorithm for discovering clusters in large spatial databases with noise. In Proceedings of the Second International Conference on Knowledge Discovery and Data Mining, Portland, OR, USA, 2–4 August 1996; Volume 96, pp. 226–231. [Google Scholar]
  49. Smith, S. For love or money? Fairtrade business models in the UK supermarket sector. J. Bus. Ethics 2010, 92, 257–266. [Google Scholar] [CrossRef]
  50. Colaço, R.; e Silva, J.d.A. Commercial land use change and growth processes—An assessment of retail location in Lisbon, Portugal, 1995–2020. J. Urban Manag. 2024, 13, 157–170. [Google Scholar] [CrossRef]
Figure 1. Overview of research.
Mca 30 00075 g001
Figure 2. Field matching.
Mca 30 00075 g002
Figure 3. (a) All kinds of POI data. (b) Commercial POI data. (c) Retail POI data.
Mca 30 00075 g003
Figure 4. (a) Discrete store and distribution. (b) Linear stores and distribution. (c) Infill stores and distribution.
Mca 30 00075 g004
Figure 5. Flowchart of DBSCAN algorithm.
Mca 30 00075 g005
Figure 6. (a) whole POI data kernel density analysis. (b) retail commerce POI data kernel density analysis.
Mca 30 00075 g006
Figure 7. Manchester land use (https://www.mangeogsoc.org.uk/pdfs/lawson_lindley.pdf, (accessed on 14 July 2025)).
Mca 30 00075 g007
Figure 8. (a) Clustering of “Infill distribution”. (b) Clustering of “Linear distribution”. (c) Clustering of “Discrete distribution”.
Mca 30 00075 g008
Figure 9. (a) Walking coverage. (b) Different categories of community land. (c) Green park.
Mca 30 00075 g009
Figure 10. “Whole distribution” retail commerce analysis.
Mca 30 00075 g010
Figure 11. “Infill distribution” retail commerce analysis.
Mca 30 00075 g011
Figure 12. “Linear distribution” retail commerce analysis.
Mca 30 00075 g012
Figure 13. “Discrete distribution” retail commerce analysis.
Mca 30 00075 g013
Table 1. POI data clustering type results.
Retail Commerce CategoryPOI CategoryNumberPercentage
Integrated retailConvenience stores, small commodity markets, comprehensive shopping malls, supermarkets85631.9%
Food, beverages and tobacco productsTobacco and alcohol stores, farmers’ market53620.0%
Textiles, clothing and daily necessitiesClothing, shoes, bags, cosmetics, gifts, watches, glasses, flower shops, bicycles monopoly37513.9%
Cultural, sporting goods and equipmentSports and outdoor, stationery, books, audio and video, antique calligraphy and painting, jewelry store1575.8%
Medicine and medical equipmentPharmacies, pharmacies, clinics33412.4%
Fuel and spare parts for automobile and motorcycleAutomobile sales, second-hand car market, auto parts sales, motorcycle and accessories sales2378.8%
Household appliances and electronic productsDigital home appliances1876.9%
Table 2. POI data clustering type results.
Cluster TypeNumber of POI Data
11209
2129
3440
486
565
Deemed noise752
Table 3. Comparison of Similarities between Retail and Different Urban Factors ( R 2 ).
DistributionLow-Density CommunityMedium-Density CommunityHigh-Density CommunityBusiness AreaGreen ParkWalking Accessibility Area
Infill0.2610.5270.6890.7810.1240.385
Linear0.2080.4170.3680.3510.1520.753
Discrete0.2160.2710.3410.2730.4810.319
Whole0.2920.4560.6060.7240.2350.713
Disclaimer/Publisher’s Note: The statements, opinions and data contained in all publications are solely those of the individual author(s) and contributor(s) and not of MDPI and/or the editor(s). MDPI and/or the editor(s) disclaim responsibility for any injury to people or property resulting from any ideas, methods, instructions or products referred to in the content.