Decoding Retail Commerce Patterns with Multisource Urban Knowledge

 ,
,
Abstract
1. Introduction
2. Related Work
2.1. Urban POI Data Application
2.2. Urban Retail Commerce Influence
2.3. Synthesis of Related Work
3. Methodology
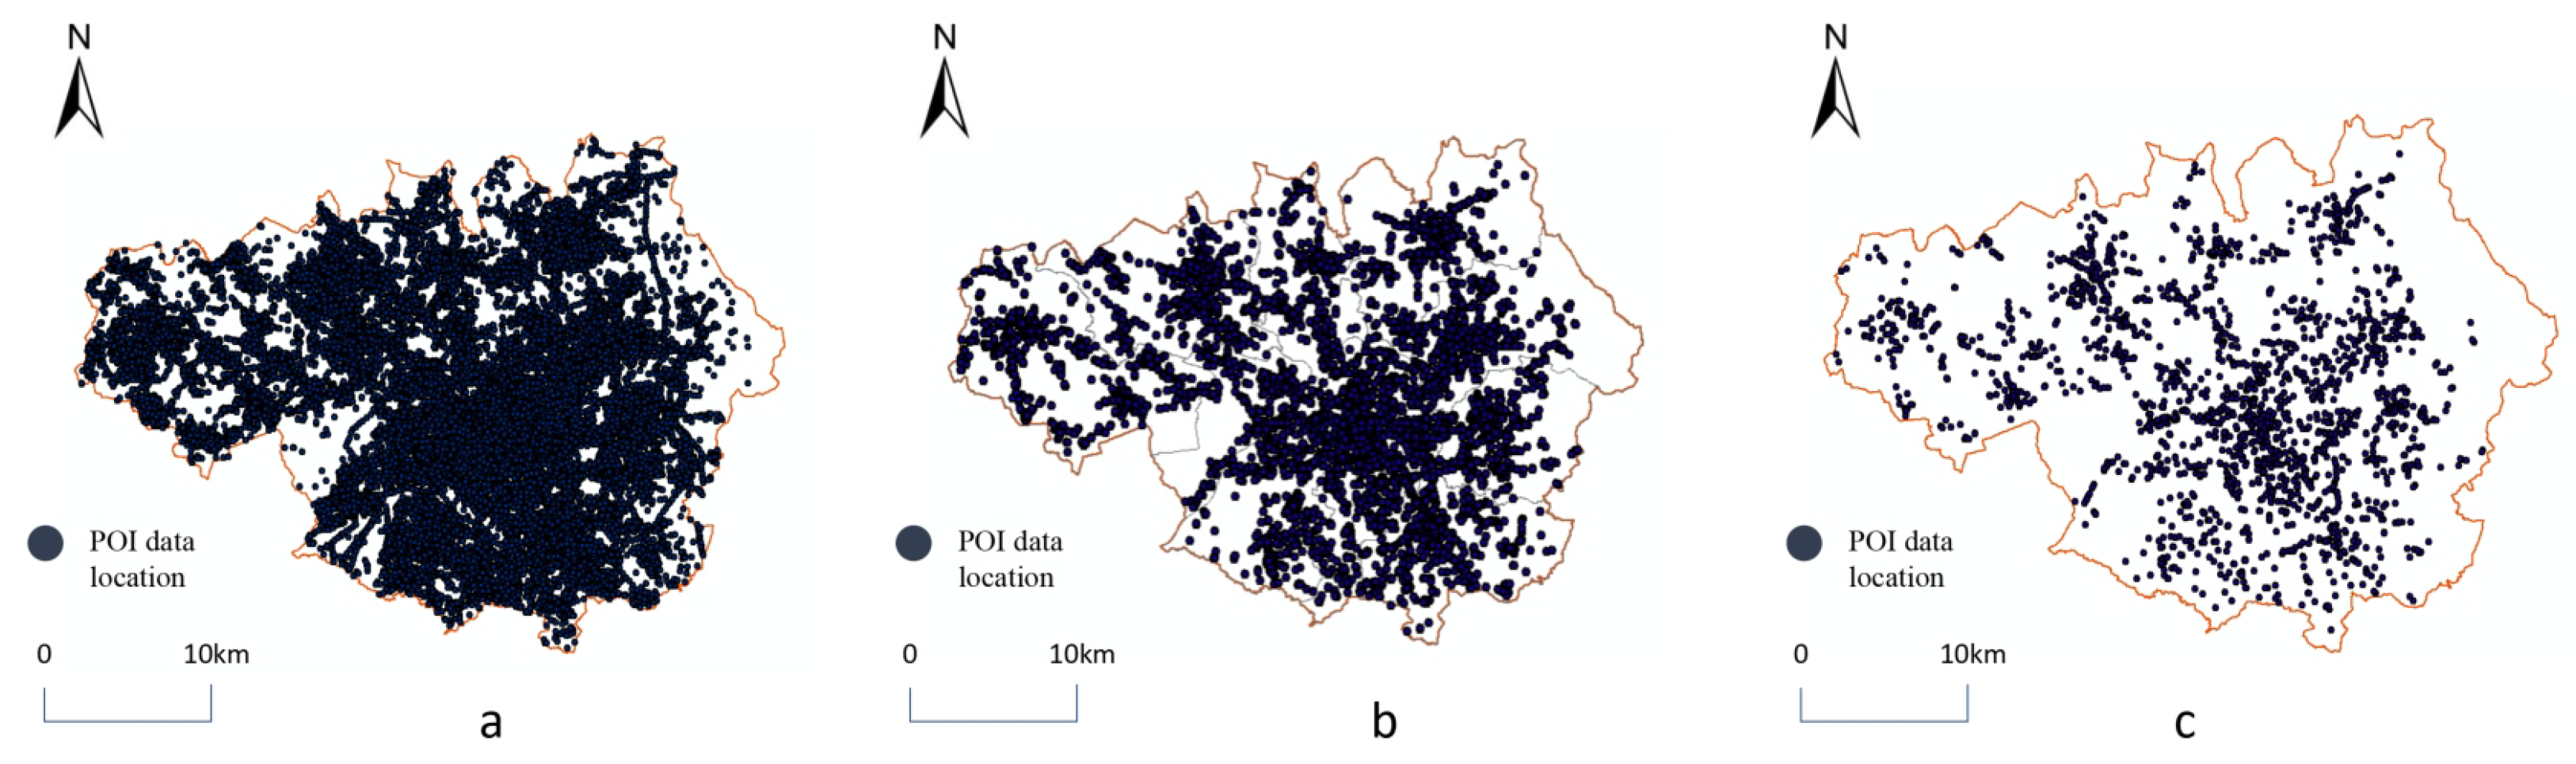
3.1. Data Collection and Collation
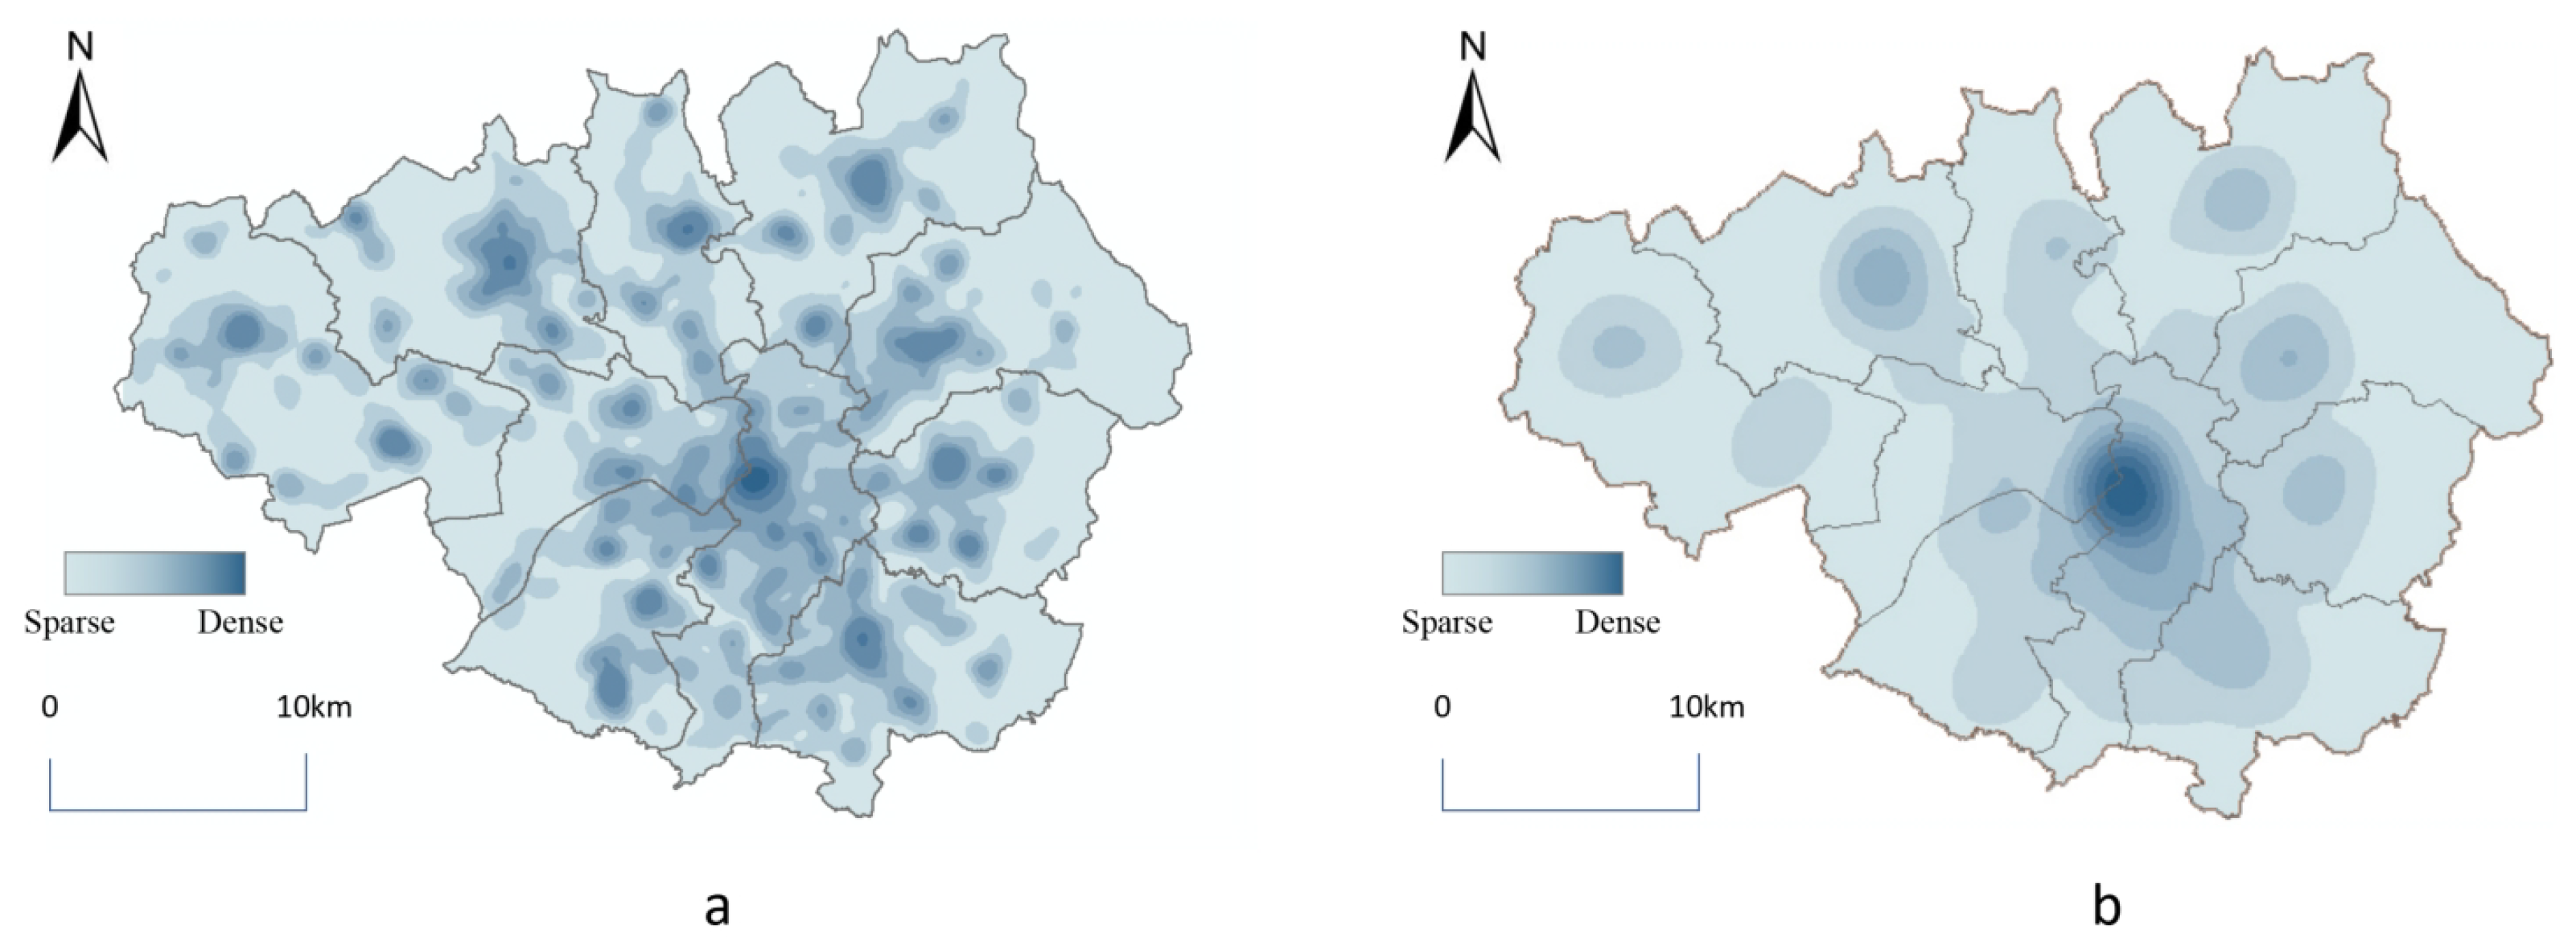
3.2. Urban Retail Commerce Scope Analysis
- represents the kernel density estimate, denoting the value of f at point x;
- is the kernel function;
- n is the quantity of known POI (Point of Interest) vector points;
- h denotes the service radius (i.e., the bandwidth), where the service radius is defined as the accessibility distance of various POI;
- indicates the distance from the target point to the i-th POI point.
3.3. Urban Retail Commerce Space Types Analysis
3.4. Retail Commerce Development Driving Factors
4. Case Study
4.1. Retail Commerce Cluster Layer
4.2. Multi-Factor Analysis of Retail Distribution
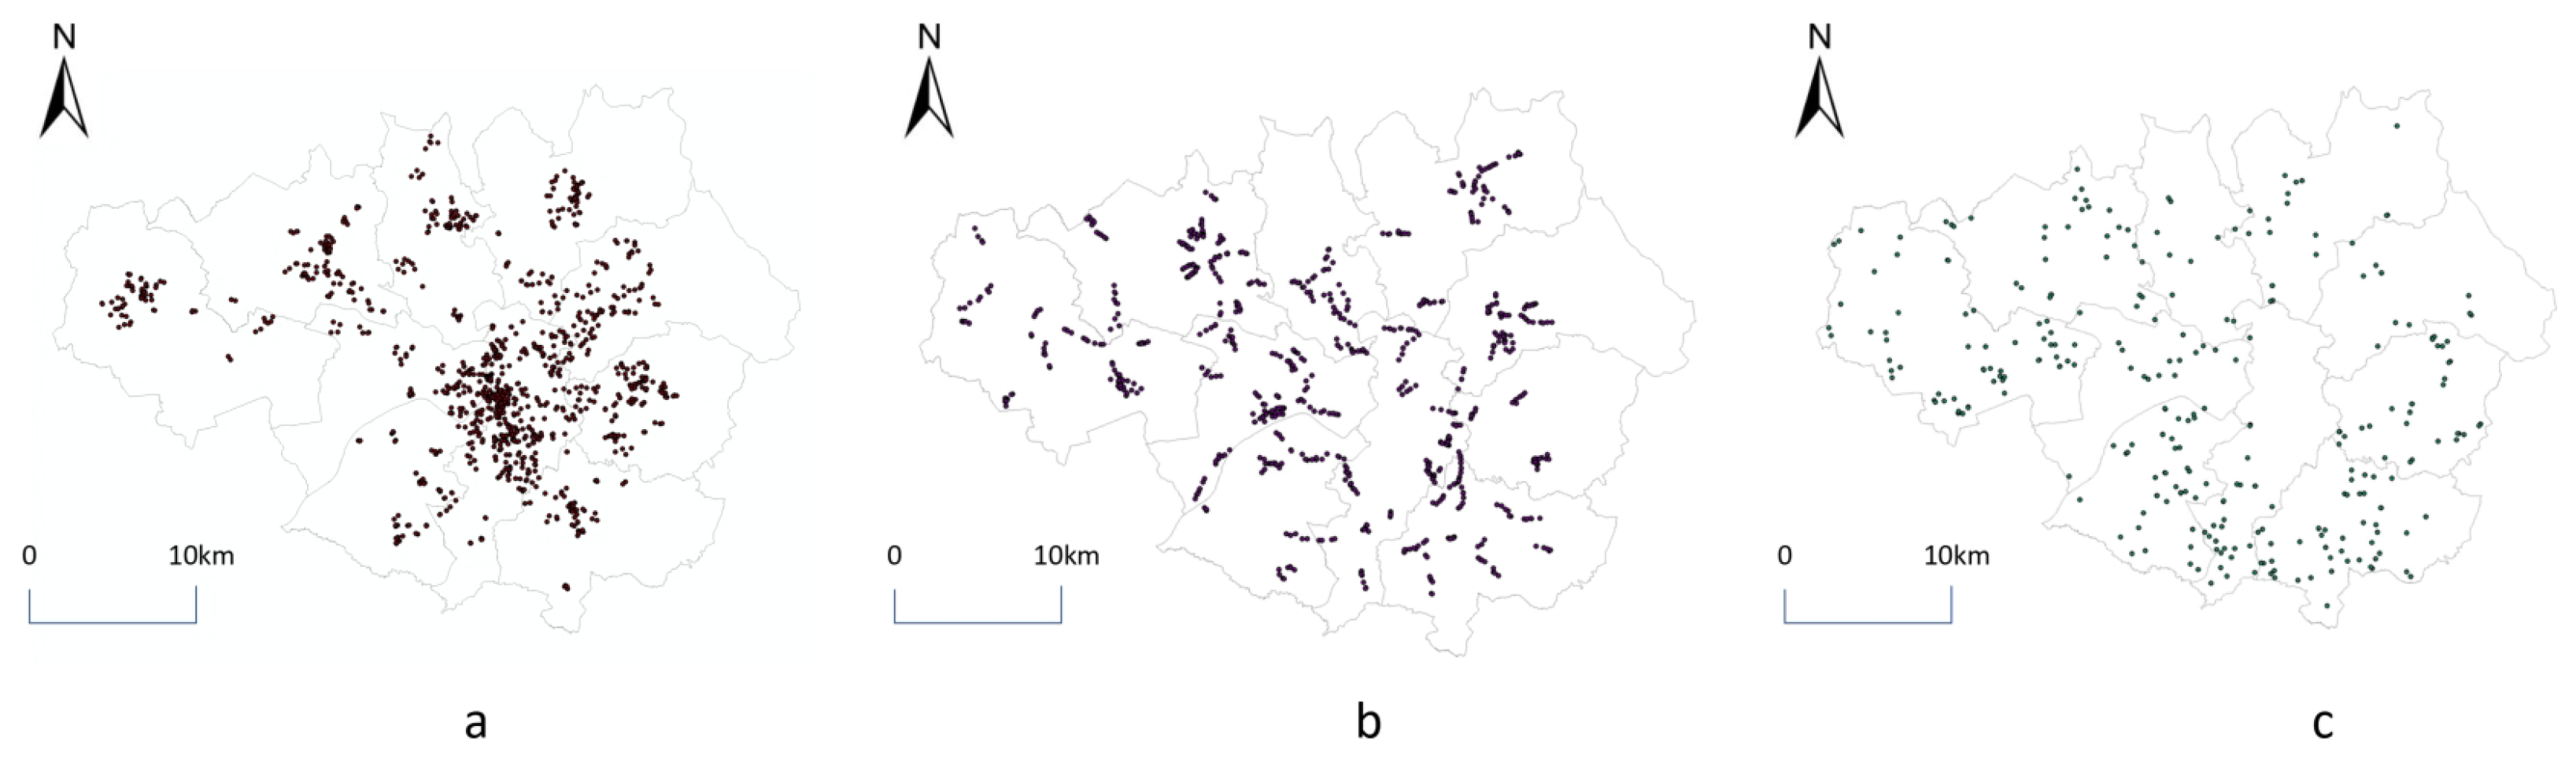
4.2.1. Identify Retail Commercial Space Types
4.2.2. The Relationship Between Different Urban Factors and Retail Commerce
5. Discussion
- Comparison with data from different groups: Few instances exist where data sets have been utilized to elucidate the correlation between retail commerce dispersion and different urban function areas. This study endeavors to harness varying data types for comparison, with the aim of identifying meaningful relationships. DBSCAN identifies different retail commercial spaces, Kernel density analysis identifies the distribution characteristics of commercial quantity, and GWR identifies the relationship between commerce and different urban factors.
- Assessing urban planning: Previously, urban studies in Manchester have given scant attention to the practicality of urban planning implementation. This study, however, juxtaposes the findings from our urban analysis with the Manchester City Plan, aiming to evaluate the urban planning from a commercial standpoint. We hope this will stimulate further scholarly contemplation regarding the multifaceted nature of future urban development appraisals.
- Tapping the multiple potentials of POI data: This investigation explores the application of POI data analysis in the context of Manchester. Although our focus is squarely on the commercial facet, this research represents a novel contribution to Manchester-centric studies. Through the analysis of urban data, more laws of urban development can be found. Moreover, this inquiry aims to galvanize scholarly interest in POI data.
- GWR model assumes continuous spatial relationships, yet reality often contradicts this: Geographically Weighted Regression (GWR) operates under the underlying assumption that spatial relationships change continuously across space. However, real-world spatial processes often exhibit discontinuous or abrupt changes. For instance, retail commercial density at urban edges may decline sharply due to zoning regulations, rather than decreasing gradually. Such mismatches between the model’s assumptions and empirical spatial dynamics can lead to biased or misleading coefficient estimates. A multitude of factors influence retail commerce patterns, with community, park, walking coverage serving as just some components. Moreover, specific operational conditions such as the turnover of retail commerce have not been taken into account. These caveats present avenues for future research to build upon our findings and methodology.
- Strengthen the application of mathematical analysis models: Through the effectiveness comparison of various mathematical models, this study uses fewer mathematical models and lacks horizontal comparison. With the development of urban data analysis in the future, the application characteristics of different analysis conditions on different data models can be summarized, so as to enhance the accuracy of the research.
6. Conclusions
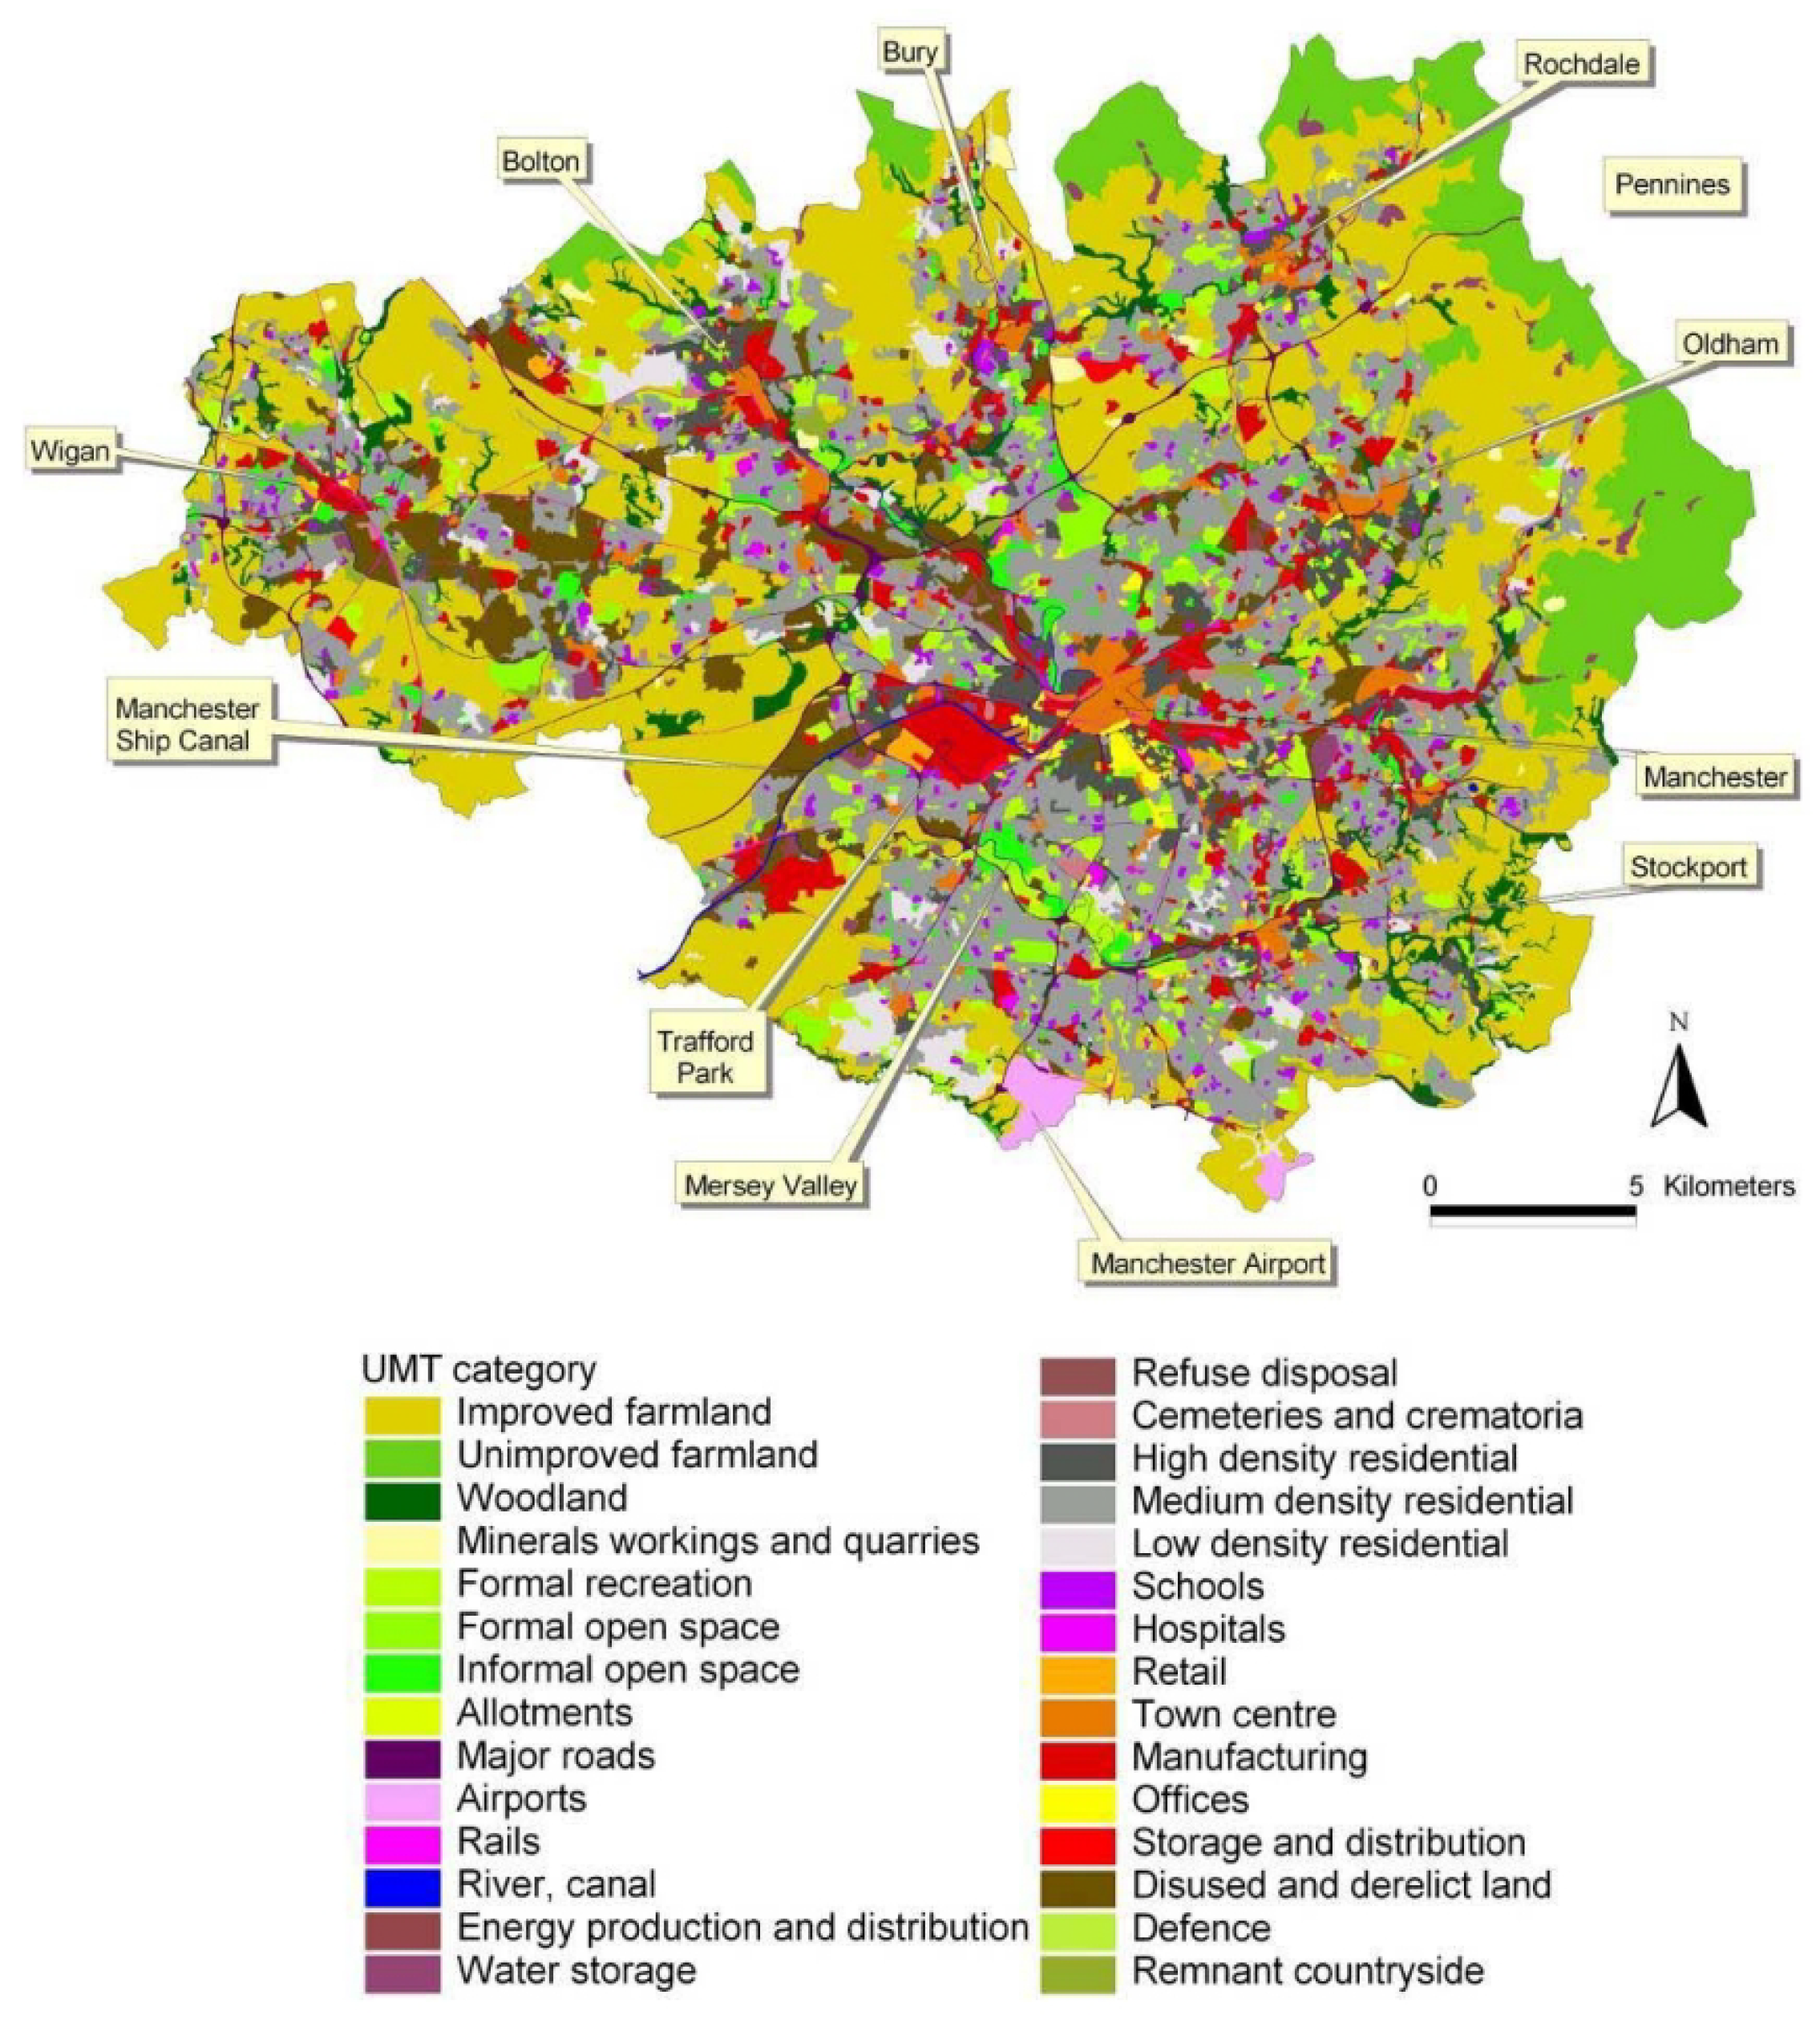
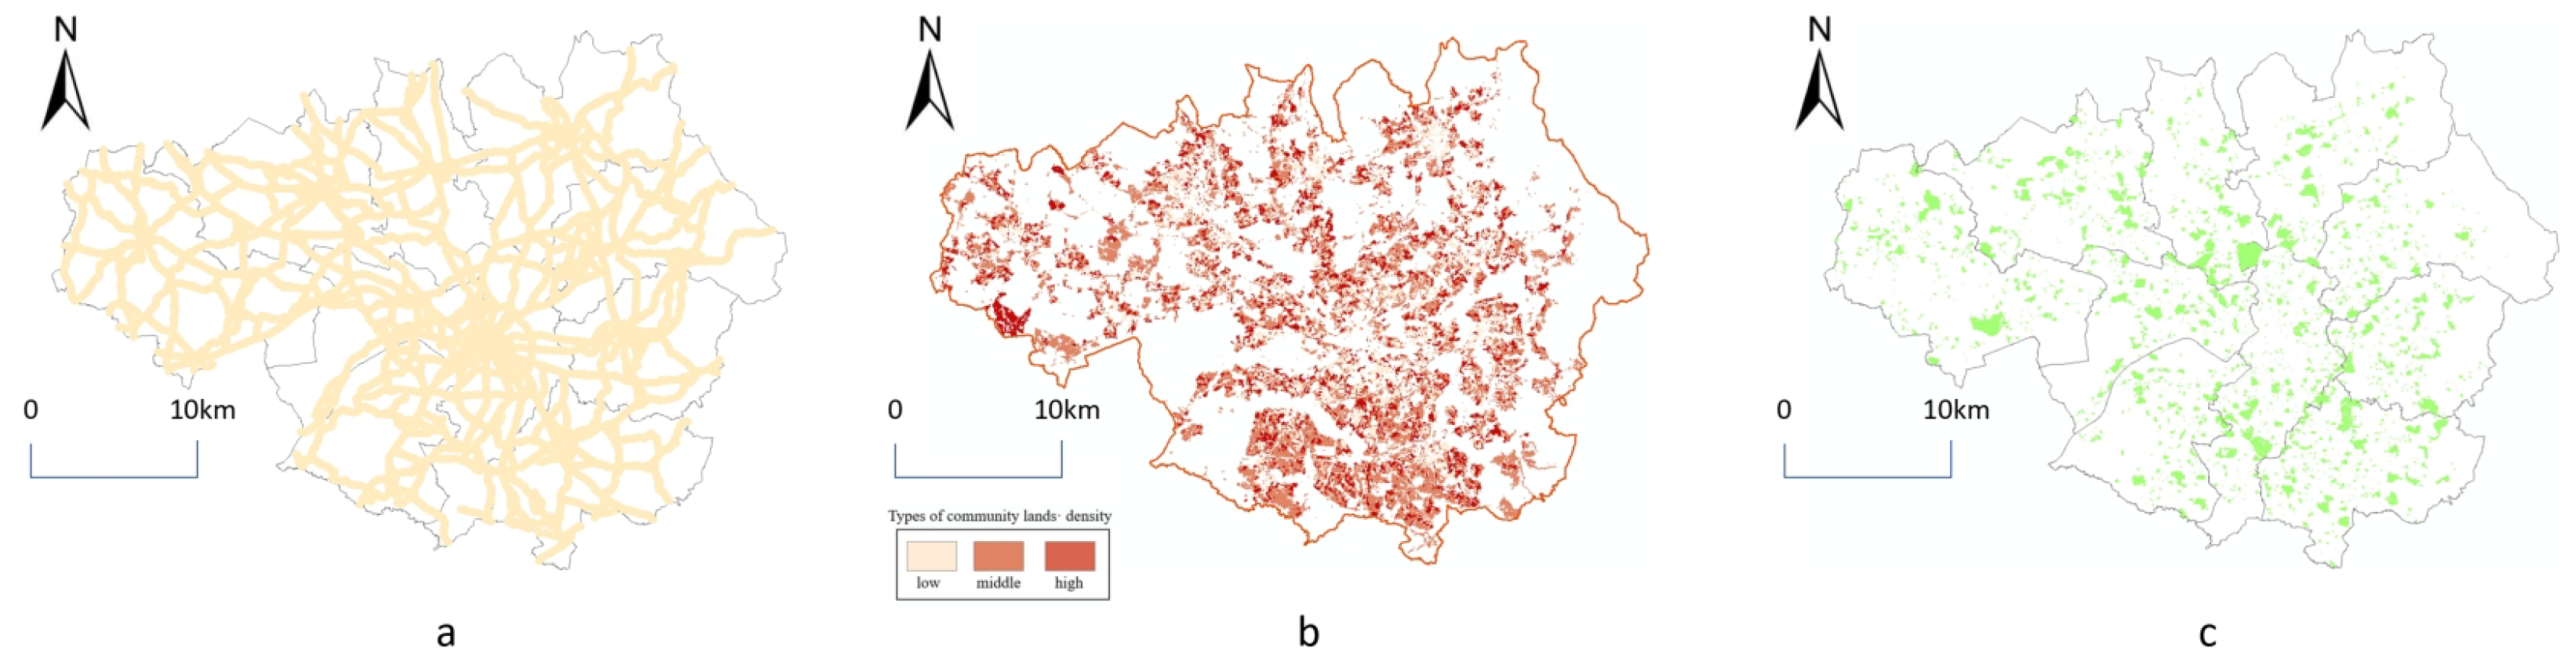
- Urban Retail Commercial Distribution Structure: Utilizing the collected commercial POI data, we derive the contour and distribution of commercial districts within the city using planar kernel density estimation’s Euclidean distance calculation. Our analysis reveals a decrease in POI distribution density from the cluster center to peripheral areas. Our analysis indicates that from the center to the peripheral areas, the distribution density of retail commerce POI points shows a downward trend, which is similar to the spatial characteristic of Manchester where urban land is concentrated internally and dispersed externally. Intuitively, there is a certain degree of spatial correlation between Manchester’s retail commerce POI and urban land.
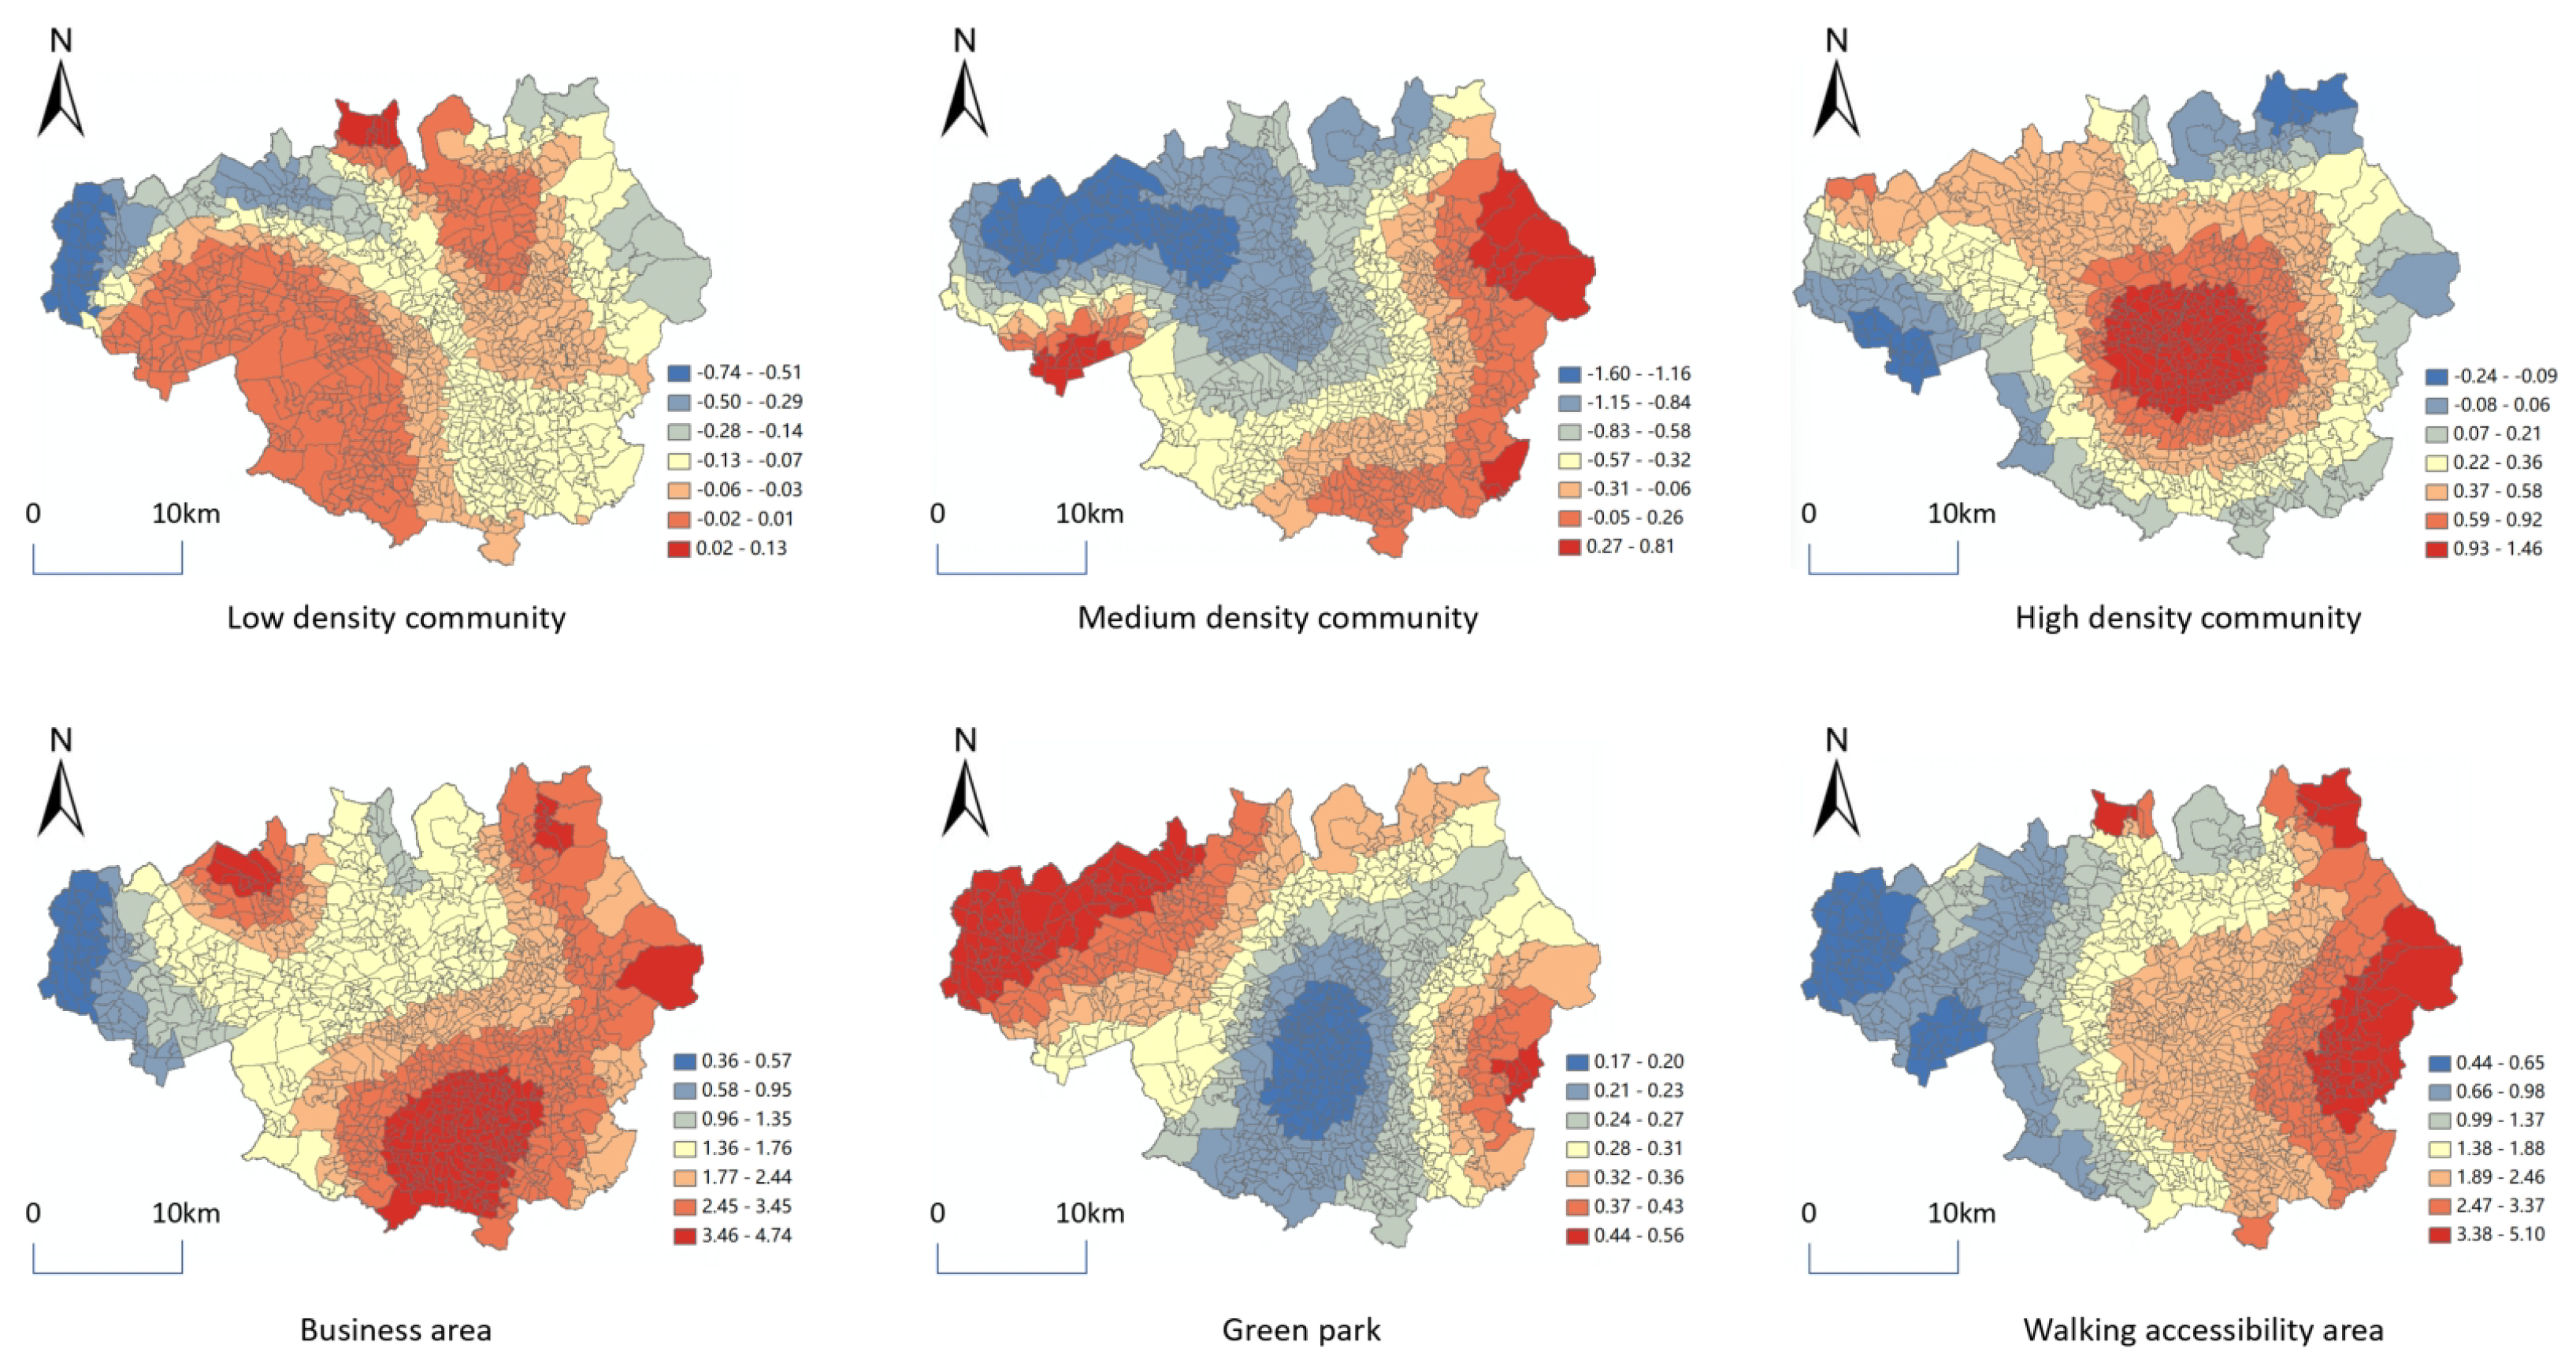
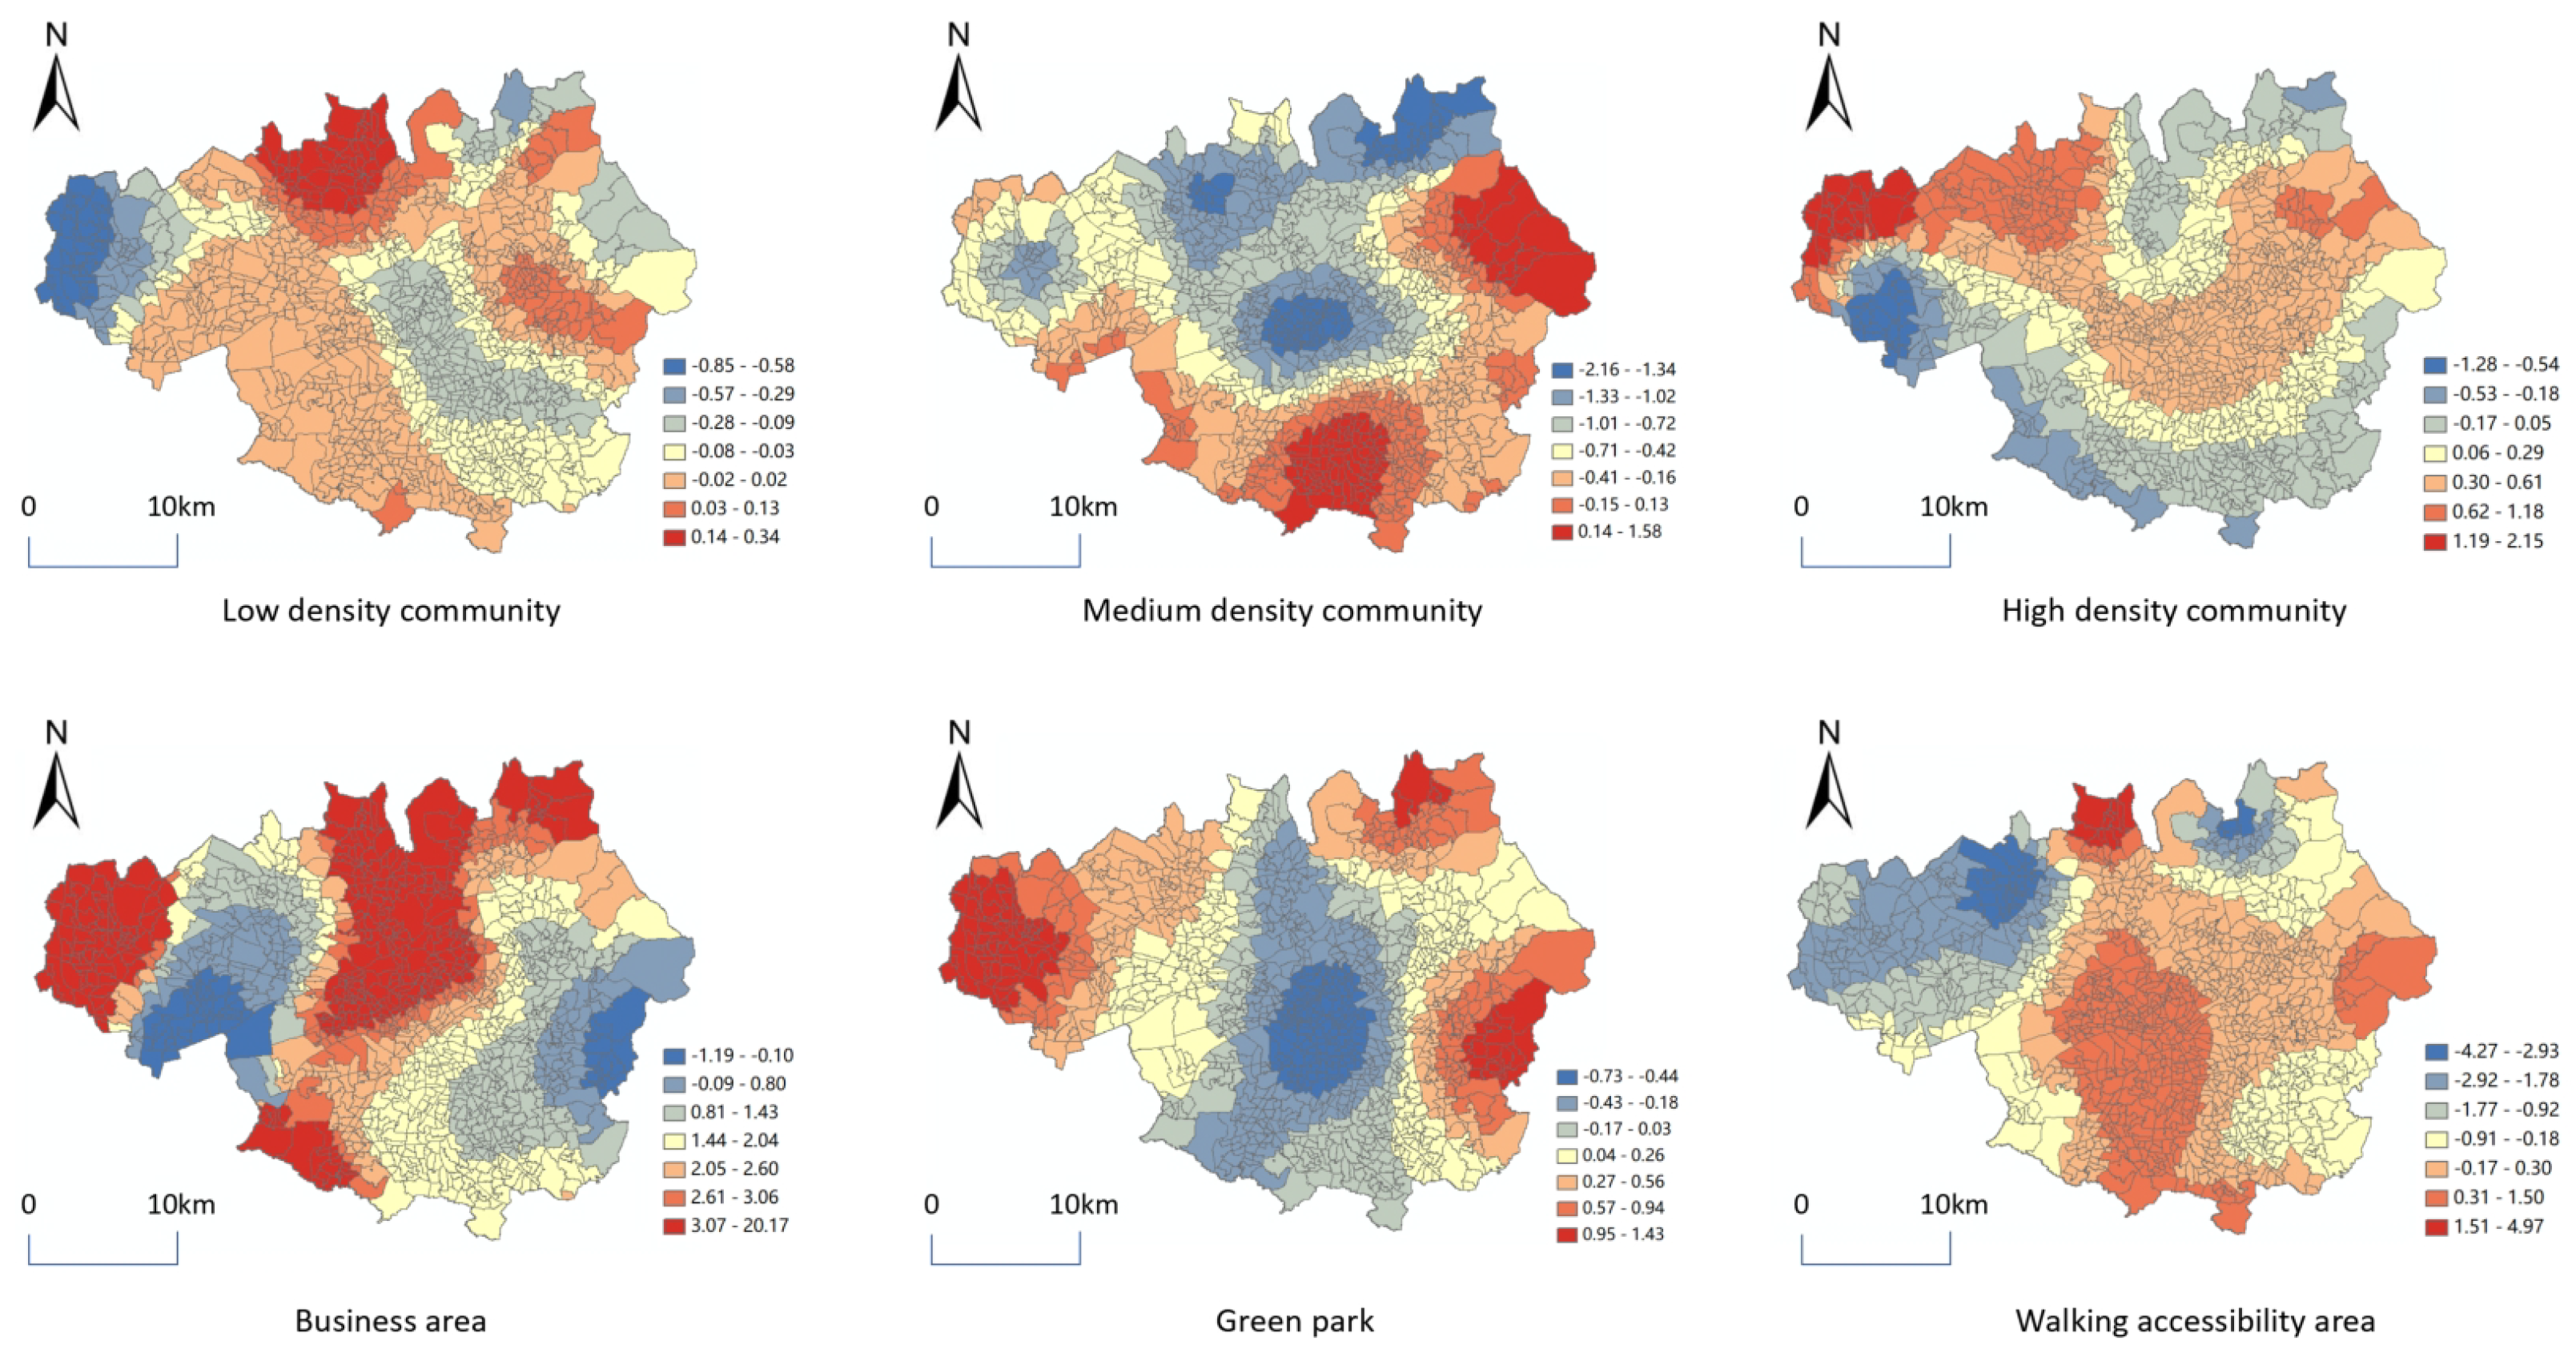
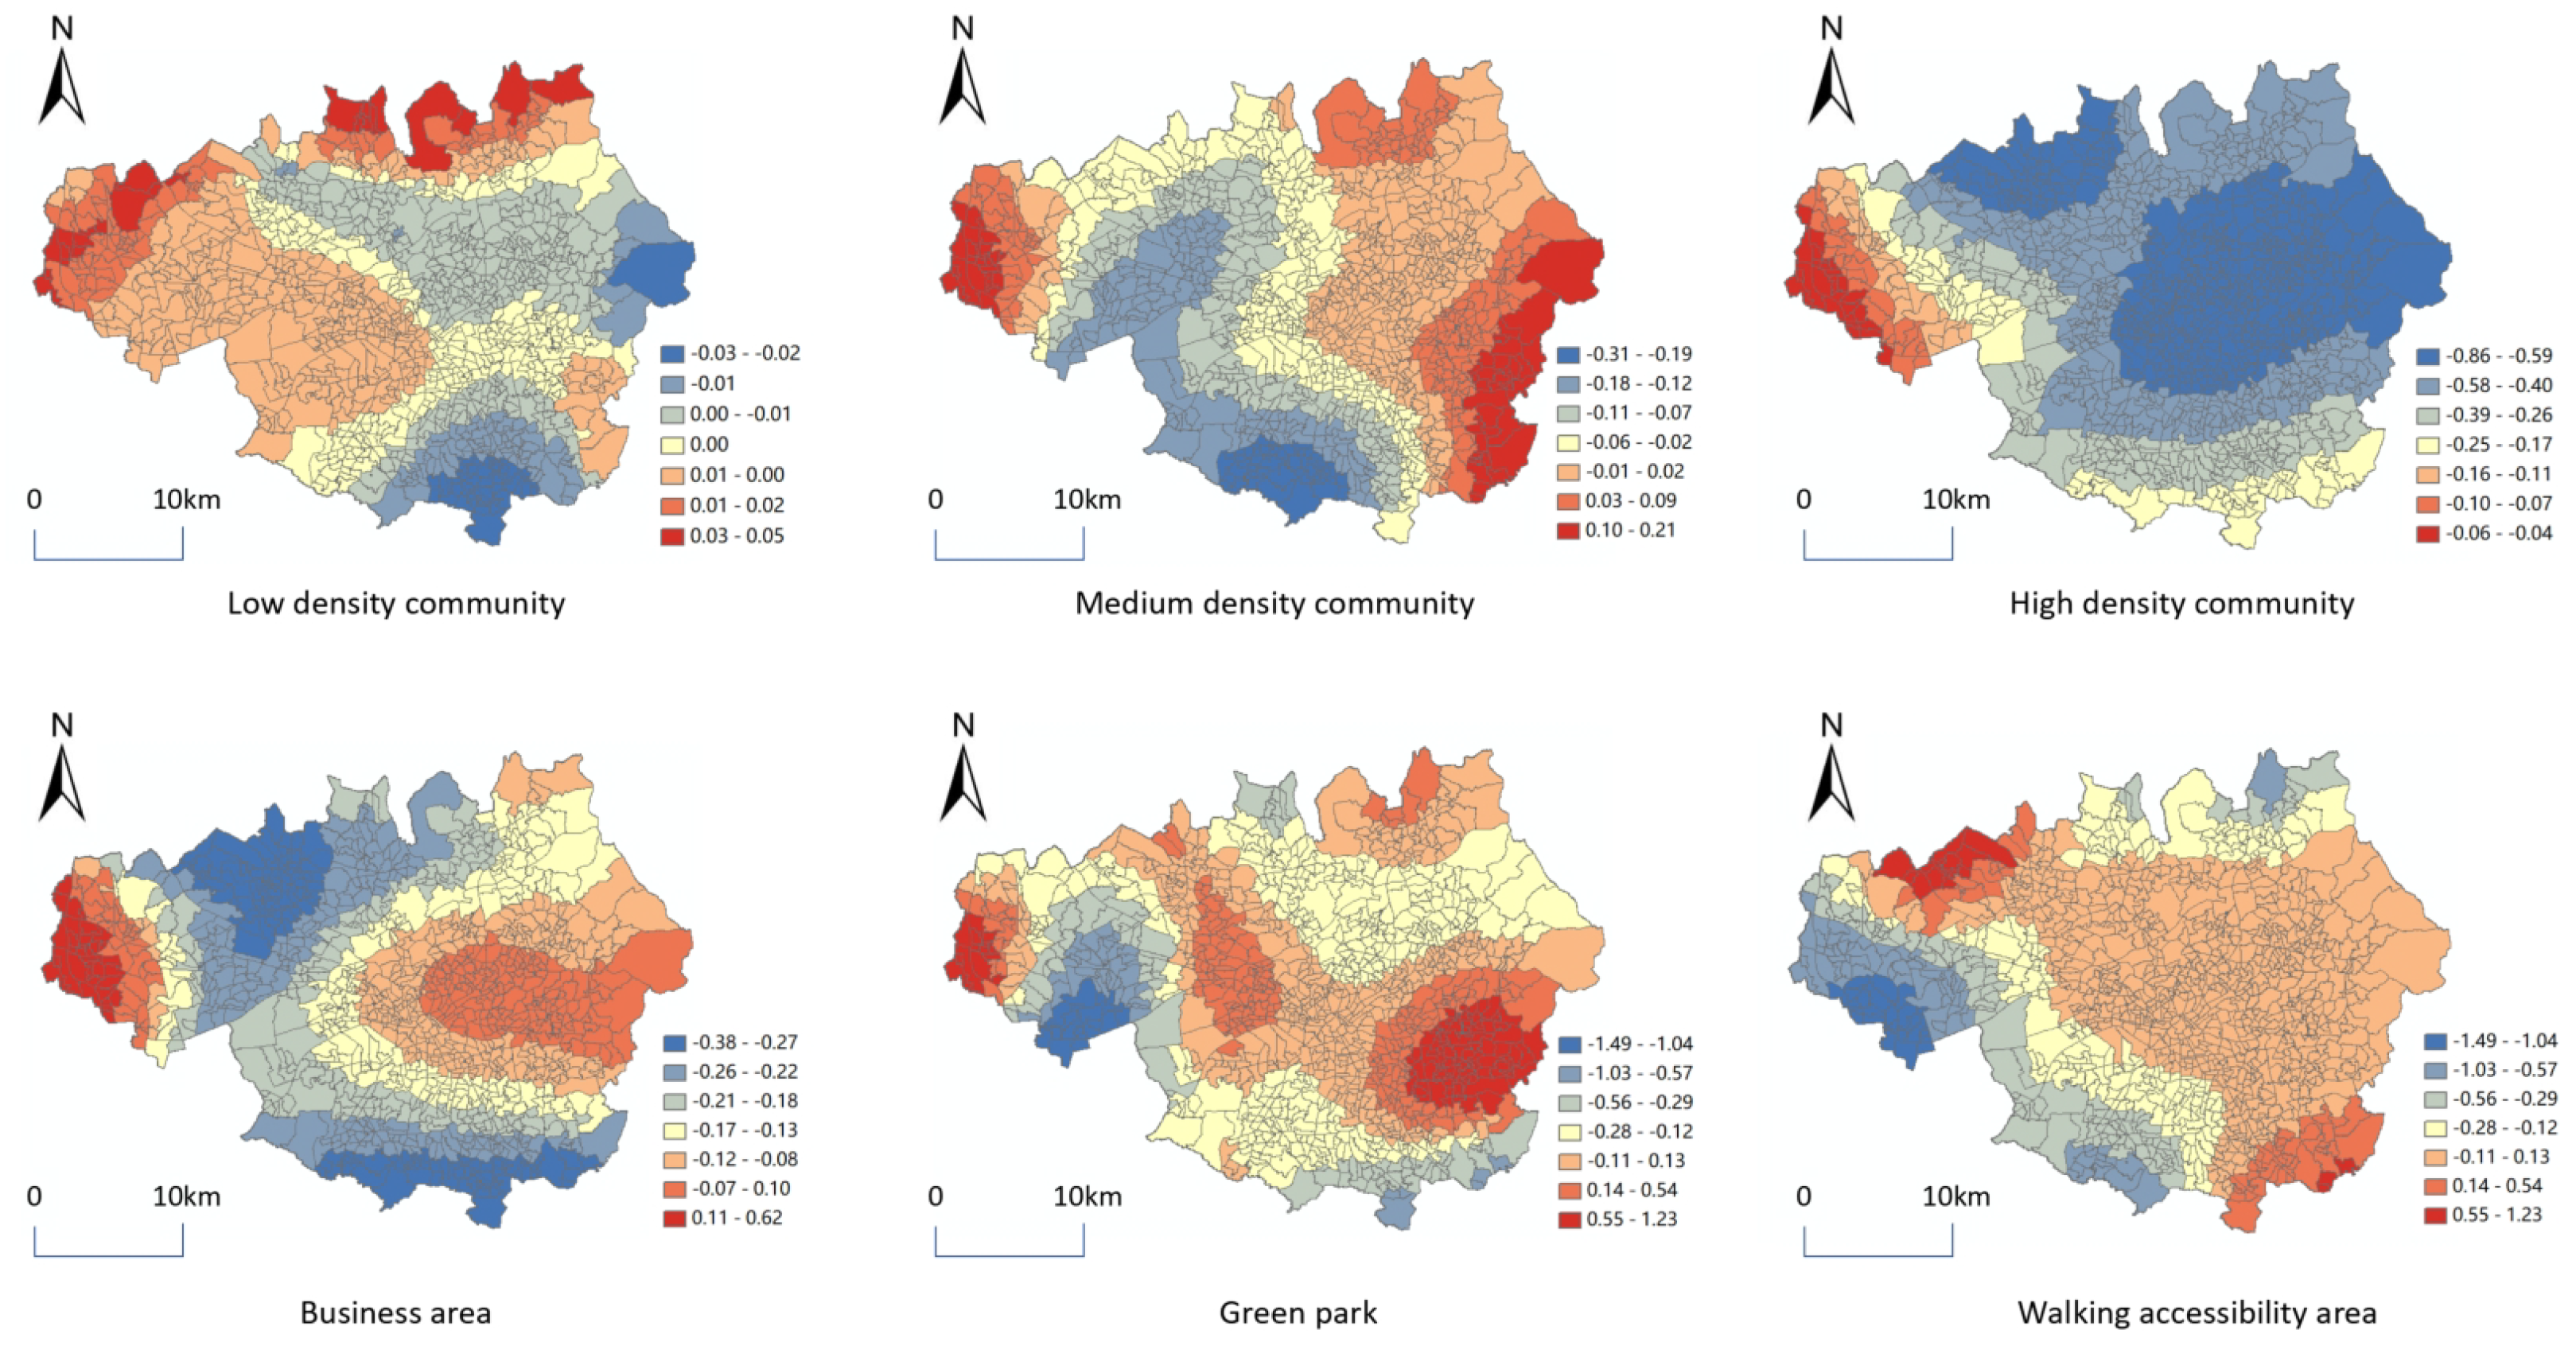
- Analysis of the correlation factors of retail commercial distribution in different cities: a correlation method leveraging urban land use function factors is proposed, based on the spatial distribution of clustered retail commercial POI identified through clustering algorithms. Spatial similarities between retail commerce and other factors were identified by Geographically Weighted Regression. The results show that different commercial space models are affected by different urban factors. ‘Infill stores’ are similar to the development of the city’s central business district, the distribution of ‘Linear stores’ is consistent with the urban road space, and the city’s green parks will attract ‘Discrete stores’. The spatial relationship between retail commercial POI points and different types of urban land in Manchester will change as the functional attributes of the community change. The spatial dependence between ‘Infill stores’ and ‘High density community’ is relatively high, while the spatial dependence between ‘Linear stores’ and ‘Walking accessibility area’ is also relatively high. From the perspective of the entire market mechanism, areas with large foot traffic require ‘Infill stores’ to meet the demand for foot traffic, and ‘Linear stores’ are needed along the roads to meet the shopping needs during daily commutes. However, from the perspective of urban managers, scattered areas require ‘Discrete stores’, and high-density residential areas need ‘Infill stores’ to address the living needs of citizens. Therefore, in future commercial layouts, if it is an urgent need, it can be located around the roads; if it is ‘Discrete stores’, it can be located in low-density communities; and ‘Infill stores’ should be placed in high-density communities.
Author Contributions
Funding
Data Availability Statement
Conflicts of Interest
Abbreviations
| GWR | Geographically Weighted Regression |
| DBSCAN | Density-Based Spatial Clustering of Applications with Noise |
| POI | Point of Interest |
References
- Sassen, S.; Ufer, U. Urban digitization and financial capitalism: How do urban digitization and financial capitalism impact on the local transformation, sustainability and resilience of our cities? Tatup-Zeitschrift Tech. Theor. Prax./J. Technol. Assess. Theory Pract. 2021, 30, 70–73. [Google Scholar]
- Sarker, I.H. Smart City Data Science: Towards data-driven smart cities with open research issues. Internet Things 2022, 19, 100528. [Google Scholar] [CrossRef]
- Vojteková, J.; Vojtek, M. GIS-based landscape stability analysis: A comparison of overlay method and fuzzy model for the case study in Slovakia. Prof. Geogr. 2019, 71, 631–644. [Google Scholar] [CrossRef]
- Minoiu, M.C.; Reddy, S. Kernel Density Estimation Based on Grouped Data: The Case of Poverty Assessment; International Monetary Fund: Washington, DC, USA, 2008. [Google Scholar]
- Li, Q.; Bessell, L.; Xiao, X.; Fan, C.; Gao, X.; Mostafavi, A. Disparate patterns of movements and visits to points of interest located in urban hotspots across US metropolitan cities during COVID-19. R. Soc. Open Sci. 2021, 8, 201209. [Google Scholar] [CrossRef]
- Hoek, G.; Beelen, R.; De Hoogh, K.; Vienneau, D.; Gulliver, J.; Fischer, P.; Briggs, D. A review of land-use regression models to assess spatial variation of outdoor air pollution. Atmos. Environ. 2008, 42, 7561–7578. [Google Scholar] [CrossRef]
- Shirowzhan, S.; Lim, S.; Trinder, J.; Li, H.; Sepasgozar, S.M. Data mining for recognition of spatial distribution patterns of building heights using airborne lidar data. Adv. Eng. Inform. 2020, 43, 101033. [Google Scholar] [CrossRef]
- Kimanzi, J.K.; Wishitemi, B.E. Effects of land use changes on herbivores of Masai Mara ecosystem. Int. J. Environ. Stud. 2001, 58, 727–740. [Google Scholar] [CrossRef]
- Newton, P. Urban Consumption; CSIRO Publishing: Melbourne, Australia, 2011. [Google Scholar]
- Fotheringham, A.S.; Brunsdon, C.; Charlton, M. Geographically weighted regression. In The SAGE Handbook of Spatial Analysis; SAGE Publications Ltd: New York, NY, USA, 2009; Volume 1, pp. 243–254. [Google Scholar]
- Hou, G.; Chen, L. Regional commercial center identification based on POI big data in China. Arab. J. Geosci. 2021, 14, 1360. [Google Scholar] [CrossRef]
- Jiang, S.; Alves, A.; Rodrigues, F.; Ferreira, J., Jr.; Pereira, F.C. Mining point-of-interest data from social networks for urban land use classification and disaggregation. Comput. Environ. Urban Syst. 2015, 53, 36–46. [Google Scholar] [CrossRef]
- Lu, C.; Pang, M.; Zhang, Y.; Li, H.; Lu, C.; Tang, X.; Cheng, W. Mapping urban spatial structure based on poi (point of interest) data: A case study of the central city of Lanzhou, China. ISPRS Int. J. Geo-Inf. 2020, 9, 92. [Google Scholar] [CrossRef]
- Zheng, D.; Li, C. Research on Spatial Pattern and Its Industrial Distribution of Commercial Space in Mianyang Based on POI Data. J. Data Anal. Inf. Process. 2020, 8, 20. [Google Scholar] [CrossRef]
- Deng, Y.; Liu, J.; Liu, Y.; Luo, A. Detecting urban polycentric structure from POI data. ISPRS Int. J. Geo-Inf. 2019, 8, 283. [Google Scholar] [CrossRef]
- Malakootian, M.; Fatehizadeh, A.; Meydani, E. Investigation of corrosion potential and precipitation tendency of drinking water in the Kerman distribution system. Tolooebehdasht 2013, 11, 1–10. [Google Scholar]
- Venerandi, A.; Quattrone, G.; Capra, L.; Quercia, D.; Saez-Trumper, D. Measuring urban deprivation from user generated content. In Proceedings of the 18th ACM Conference on Computer Supported Cooperative Work & Social Computing, Vancouver, BC, Canada, 14–18 March 2015; pp. 254–264. [Google Scholar]
- Zhang, Y.; Li, X.; Jiang, Q.; Chen, M.; Liu, L. Quantify the spatial association between the distribution of catering business and urban spaces in London using catering POI data and image segmentation. Atmosphere 2022, 13, 2128. [Google Scholar] [CrossRef]
- Peng, S.; Fang, J.; Han, C.; Cheng, Z. VegaMinerPOI: A spatial data mining system for POI datasets. In Proceedings of the 2009 17th International Conference on Geoinformatics, Fairfax, VA, USA, 12–14 August 2009; pp. 1–4. [Google Scholar]
- Patroumpas, K.; Skoutas, D.; Mandilaras, G.; Giannopoulos, G.; Athanasiou, S. Exposing points of interest as linked geospatial data. In Proceedings of the 16th International Symposium on Spatial and Temporal Databases, Vienna, Austria, 19–21 August 2019; pp. 21–30. [Google Scholar]
- Faqe Ibrahim, G.R. Urban land use land cover changes and their effect on land surface temperature: Case study using Dohuk City in the Kurdistan Region of Iraq. Climate 2017, 5, 13. [Google Scholar] [CrossRef]
- Ponce-Lopez, R.; Ferreira, J., Jr. Identifying and characterizing popular non-work destinations by clustering cellphone and point-of-interest data. Cities 2021, 113, 103158. [Google Scholar] [CrossRef]
- Lou, G.; Chen, Q.; He, K.; Zhou, Y.; Shi, Z. Using nighttime light data and POI big data to detect the urban centers of Hangzhou. Remote Sens. 2019, 11, 1821. [Google Scholar] [CrossRef]
- Milias, V.; Psyllidis, A. Assessing the influence of point-of-interest features on the classification of place categories. Comput. Environ. Urban Syst. 2021, 86, 101597. [Google Scholar] [CrossRef]
- Mills, E.S. The value of urban land. In The Quality of the Urban Environment; Routledge: London, UK, 2015; pp. 229–253. [Google Scholar]
- Podrasa, D.; Zeile, P.; Neppl, M. Machine Learning for Land Use Scenarios and Urban Design. Cities 2021, 489–498. [Google Scholar]
- Fang, Y.; Mao, J.; Liu, Q.; Huang, J. Exploratory space data analysis of spatial patterns of large-scale retail commercial facilities: The case of Gulou District, Nanjing, China. Front. Archit. Res. 2021, 10, 17–32. [Google Scholar] [CrossRef]
- Humpel, N.; Owen, N.; Leslie, E. Environmental factors associated with adults’ participation in physical activity: A review. Am. J. Prev. Med. 2002, 22, 188–199. [Google Scholar] [CrossRef]
- Brenner, C. Building reconstruction from images and laser scanning. Int. J. Appl. Earth Obs. Geoinf. 2005, 6, 187–198. [Google Scholar] [CrossRef]
- Lian, H.; Li, G. Correlation Analysis of Retail Space and Shopping Behavior in a Commercial Street Based on Space Syntax: A Case of Shijiazhuang, China. Buildings 2023, 13, 2674. [Google Scholar] [CrossRef]
- Millward-Hopkins, J.; Tomlin, A.; Ma, L.; Ingham, D.; Pourkashanian, M. Assessing the potential of urban wind energy in a major UK city using an analytical model. Renew. Energy 2013, 60, 701–710. [Google Scholar] [CrossRef]
- De Gennaro, M.; Paffumi, E.; Scholz, H.; Martini, G. GIS-driven analysis of e-mobility in urban areas: An evaluation of the impact on the electric energy grid. Appl. Energy 2014, 124, 94–116. [Google Scholar] [CrossRef]
- Herold, M.; Goldstein, N.C.; Clarke, K.C. The spatiotemporal form of urban growth: Measurement, analysis and modeling. Remote Sens. Environ. 2003, 86, 286–302. [Google Scholar] [CrossRef]
- Dablanc, L. City distribution, a key element of the urban economy: Guidelines for practitioners. In City Distribution and Urban Freight Transport; Edward Elgar Publishing: Cheltenham, UK, 2011. [Google Scholar]
- Sun, Z.; Bell, S.; Scott, I.; Qian, J. Everyday use of urban street spaces: The spatio-temporal relations between pedestrians and street vendors: A case study in Yuncheng, China. Landsc. Res. 2020, 45, 292–309. [Google Scholar] [CrossRef]
- Rajakallio, K.; Cuthbertson, R.; Pulkka, L.; Junnila, S. Creating urban platforms—Opportunities and challenges for innovation in commercial real estate development. Cities 2018, 77, 92–103. [Google Scholar] [CrossRef]
- Cetinkaya, S.; Basaraner, M.; Burghardt, D. Proximity-based grouping of buildings in urban blocks: A comparison of four algorithms. Geocarto Int. 2015, 30, 618–632. [Google Scholar] [CrossRef]
- Kashef, M. Urban livability across disciplinary and professional boundaries. Front. Archit. Res. 2016, 5, 239–253. [Google Scholar] [CrossRef]
- Kickert, C.; Vom Hofe, R.; Haas, T.; Zhang, W.; Mahato, B. Spatial dynamics of long-term urban retail decline in three transatlantic cities. Cities 2020, 107, 102918. [Google Scholar] [CrossRef] [PubMed]
- Du, H.; Mulley, C. Relationship between transport accessibility and land value: Local model approach with geographically weighted regression. Transp. Res. Rec. 2006, 1977, 197–205. [Google Scholar] [CrossRef]
- He, J.; Huang, X.; Xi, G. Measuring urban metrics of creativity using a grid-based geographically weighted regression model. J. Urban Plan. Dev. 2018, 144, 05018008. [Google Scholar] [CrossRef]
- Vafeiadis, E. Exploring the Distribution of Accessibility by Public Transport Using Spatial Analysis: A Case Study for Retail Concentrations and Public Hospitals in Athens. Master’s Thesis, Lund University, Lund, Sweden, 2019. [Google Scholar]
- Deener, A. Commerce as the structure and symbol of neighborhood life: Reshaping the meaning of community in Venice, California. City Community 2007, 6, 291–314. [Google Scholar] [CrossRef]
- Sevtsuk, A. Location and agglomeration: The distribution of retail and food businesses in dense urban environments. J. Plan. Educ. Res. 2014, 34, 374–393. [Google Scholar] [CrossRef]
- Bilal, M.; Oyedele, L.O.; Qadir, J.; Munir, K.; Ajayi, S.O.; Akinade, O.O.; Owolabi, H.A.; Alaka, H.A.; Pasha, M. Big Data in the construction industry: A review of present status, opportunities, and future trends. Adv. Eng. Inform. 2016, 30, 500–521. [Google Scholar] [CrossRef]
- Aljumaily, H.; Laefer, D.F.; Cuadra, D. Urban point cloud mining based on density clustering and MapReduce. J. Comput. Civ. Eng. 2017, 31, 04017021. [Google Scholar] [CrossRef]
- Ester, M. Density-based clustering. In Data Clustering; Chapman & Hall/CRC: London, UK, 2018; pp. 111–127. [Google Scholar]
- Ester, M.; Kriegel, H.P.; Sander, J.; Xu, X. A density-based algorithm for discovering clusters in large spatial databases with noise. In Proceedings of the Second International Conference on Knowledge Discovery and Data Mining, Portland, OR, USA, 2–4 August 1996; Volume 96, pp. 226–231. [Google Scholar]
- Smith, S. For love or money? Fairtrade business models in the UK supermarket sector. J. Bus. Ethics 2010, 92, 257–266. [Google Scholar] [CrossRef]
- Colaço, R.; e Silva, J.d.A. Commercial land use change and growth processes—An assessment of retail location in Lisbon, Portugal, 1995–2020. J. Urban Manag. 2024, 13, 157–170. [Google Scholar] [CrossRef]


| Retail Commerce Category | POI Category | Number | Percentage |
|---|---|---|---|
| Integrated retail | Convenience stores, small commodity markets, comprehensive shopping malls, supermarkets | 856 | 31.9% |
| Food, beverages and tobacco products | Tobacco and alcohol stores, farmers’ market | 536 | 20.0% |
| Textiles, clothing and daily necessities | Clothing, shoes, bags, cosmetics, gifts, watches, glasses, flower shops, bicycles monopoly | 375 | 13.9% |
| Cultural, sporting goods and equipment | Sports and outdoor, stationery, books, audio and video, antique calligraphy and painting, jewelry store | 157 | 5.8% |
| Medicine and medical equipment | Pharmacies, pharmacies, clinics | 334 | 12.4% |
| Fuel and spare parts for automobile and motorcycle | Automobile sales, second-hand car market, auto parts sales, motorcycle and accessories sales | 237 | 8.8% |
| Household appliances and electronic products | Digital home appliances | 187 | 6.9% |
| Cluster Type | Number of POI Data |
|---|---|
| 1 | 1209 |
| 2 | 129 |
| 3 | 440 |
| 4 | 86 |
| 5 | 65 |
| Deemed noise | 752 |
| Distribution | Low-Density Community | Medium-Density Community | High-Density Community | Business Area | Green Park | Walking Accessibility Area |
|---|---|---|---|---|---|---|
| Infill | 0.261 | 0.527 | 0.689 | 0.781 | 0.124 | 0.385 |
| Linear | 0.208 | 0.417 | 0.368 | 0.351 | 0.152 | 0.753 |
| Discrete | 0.216 | 0.271 | 0.341 | 0.273 | 0.481 | 0.319 |
| Whole | 0.292 | 0.456 | 0.606 | 0.724 | 0.235 | 0.713 |
Disclaimer/Publisher’s Note: The statements, opinions and data contained in all publications are solely those of the individual author(s) and contributor(s) and not of MDPI and/or the editor(s). MDPI and/or the editor(s) disclaim responsibility for any injury to people or property resulting from any ideas, methods, instructions or products referred to in the content. |
© 2025 by the authors. Licensee MDPI, Basel, Switzerland. This article is an open access article distributed under the terms and conditions of the Creative Commons Attribution (CC BY) license (https://creativecommons.org/licenses/by/4.0/).
Share and Cite
Xia, T.; Chen, Y.; Gao, F.; Chow, Y.T.H.; Zhang, J.; Keung, K.L. Decoding Retail Commerce Patterns with Multisource Urban Knowledge. Math. Comput. Appl. 2025, 30, 75. https://doi.org/10.3390/mca30040075
Xia T, Chen Y, Gao F, Chow YTH, Zhang J, Keung KL. Decoding Retail Commerce Patterns with Multisource Urban Knowledge. Mathematical and Computational Applications. 2025; 30(4):75. https://doi.org/10.3390/mca30040075
Chicago/Turabian StyleXia, Tianchu, Yixue Chen, Fanru Gao, Yuk Ting Hester Chow, Jianjing Zhang, and K. L. Keung. 2025. "Decoding Retail Commerce Patterns with Multisource Urban Knowledge" Mathematical and Computational Applications 30, no. 4: 75. https://doi.org/10.3390/mca30040075
APA StyleXia, T., Chen, Y., Gao, F., Chow, Y. T. H., Zhang, J., & Keung, K. L. (2025). Decoding Retail Commerce Patterns with Multisource Urban Knowledge. Mathematical and Computational Applications, 30(4), 75. https://doi.org/10.3390/mca30040075