3.4.2. Panel Compression
The results for the panel compression simulations are shown in
Table 8 and
Figure 12 and
Figure 13, and have been compared to experimental data. Note that the material parameters from
Table 6 were used to perform the analyses.
There was a 3% difference in the buckling load between the detailed and homogeneous models, while the failure load, and maximum in-plane and out-of-plane displacements, differed by 0.5%, 4.8% and 1.3%, respectively. Overall, there is a good correlation with the detailed and homogeneous models. The homogeneous model predicted a slightly higher failure load and displacements (in-plane and out-of-plane), while the detailed model had a slightly higher panel stiffness.
As seen in
Figure 12 and
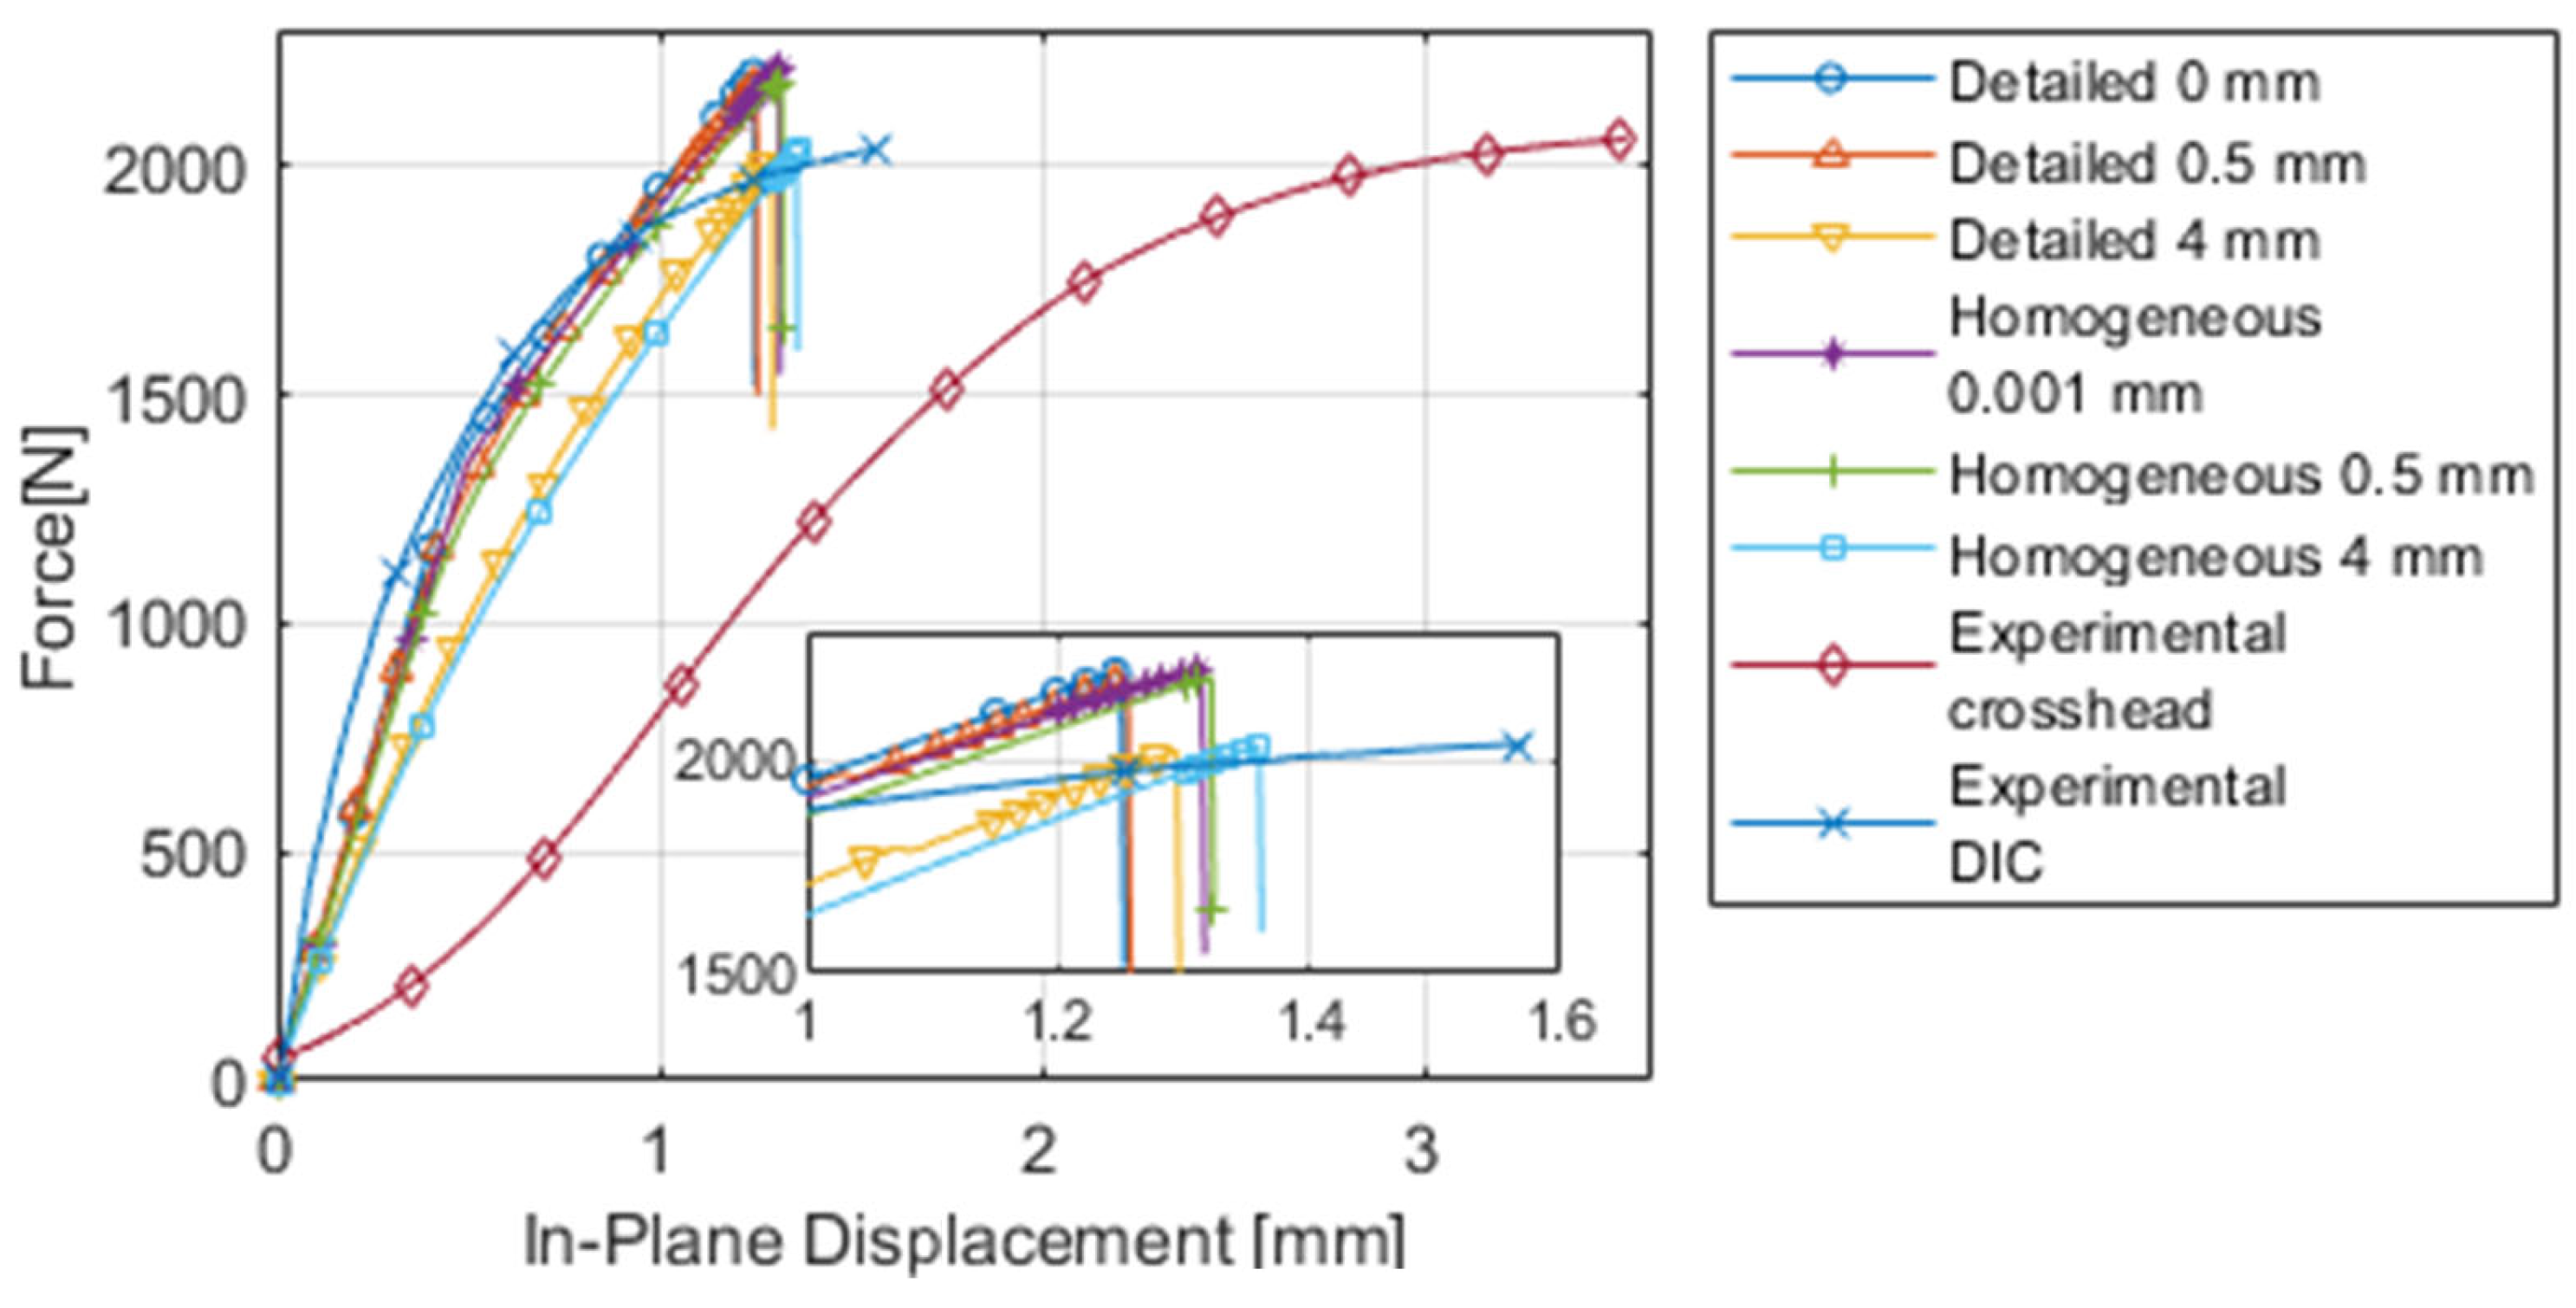
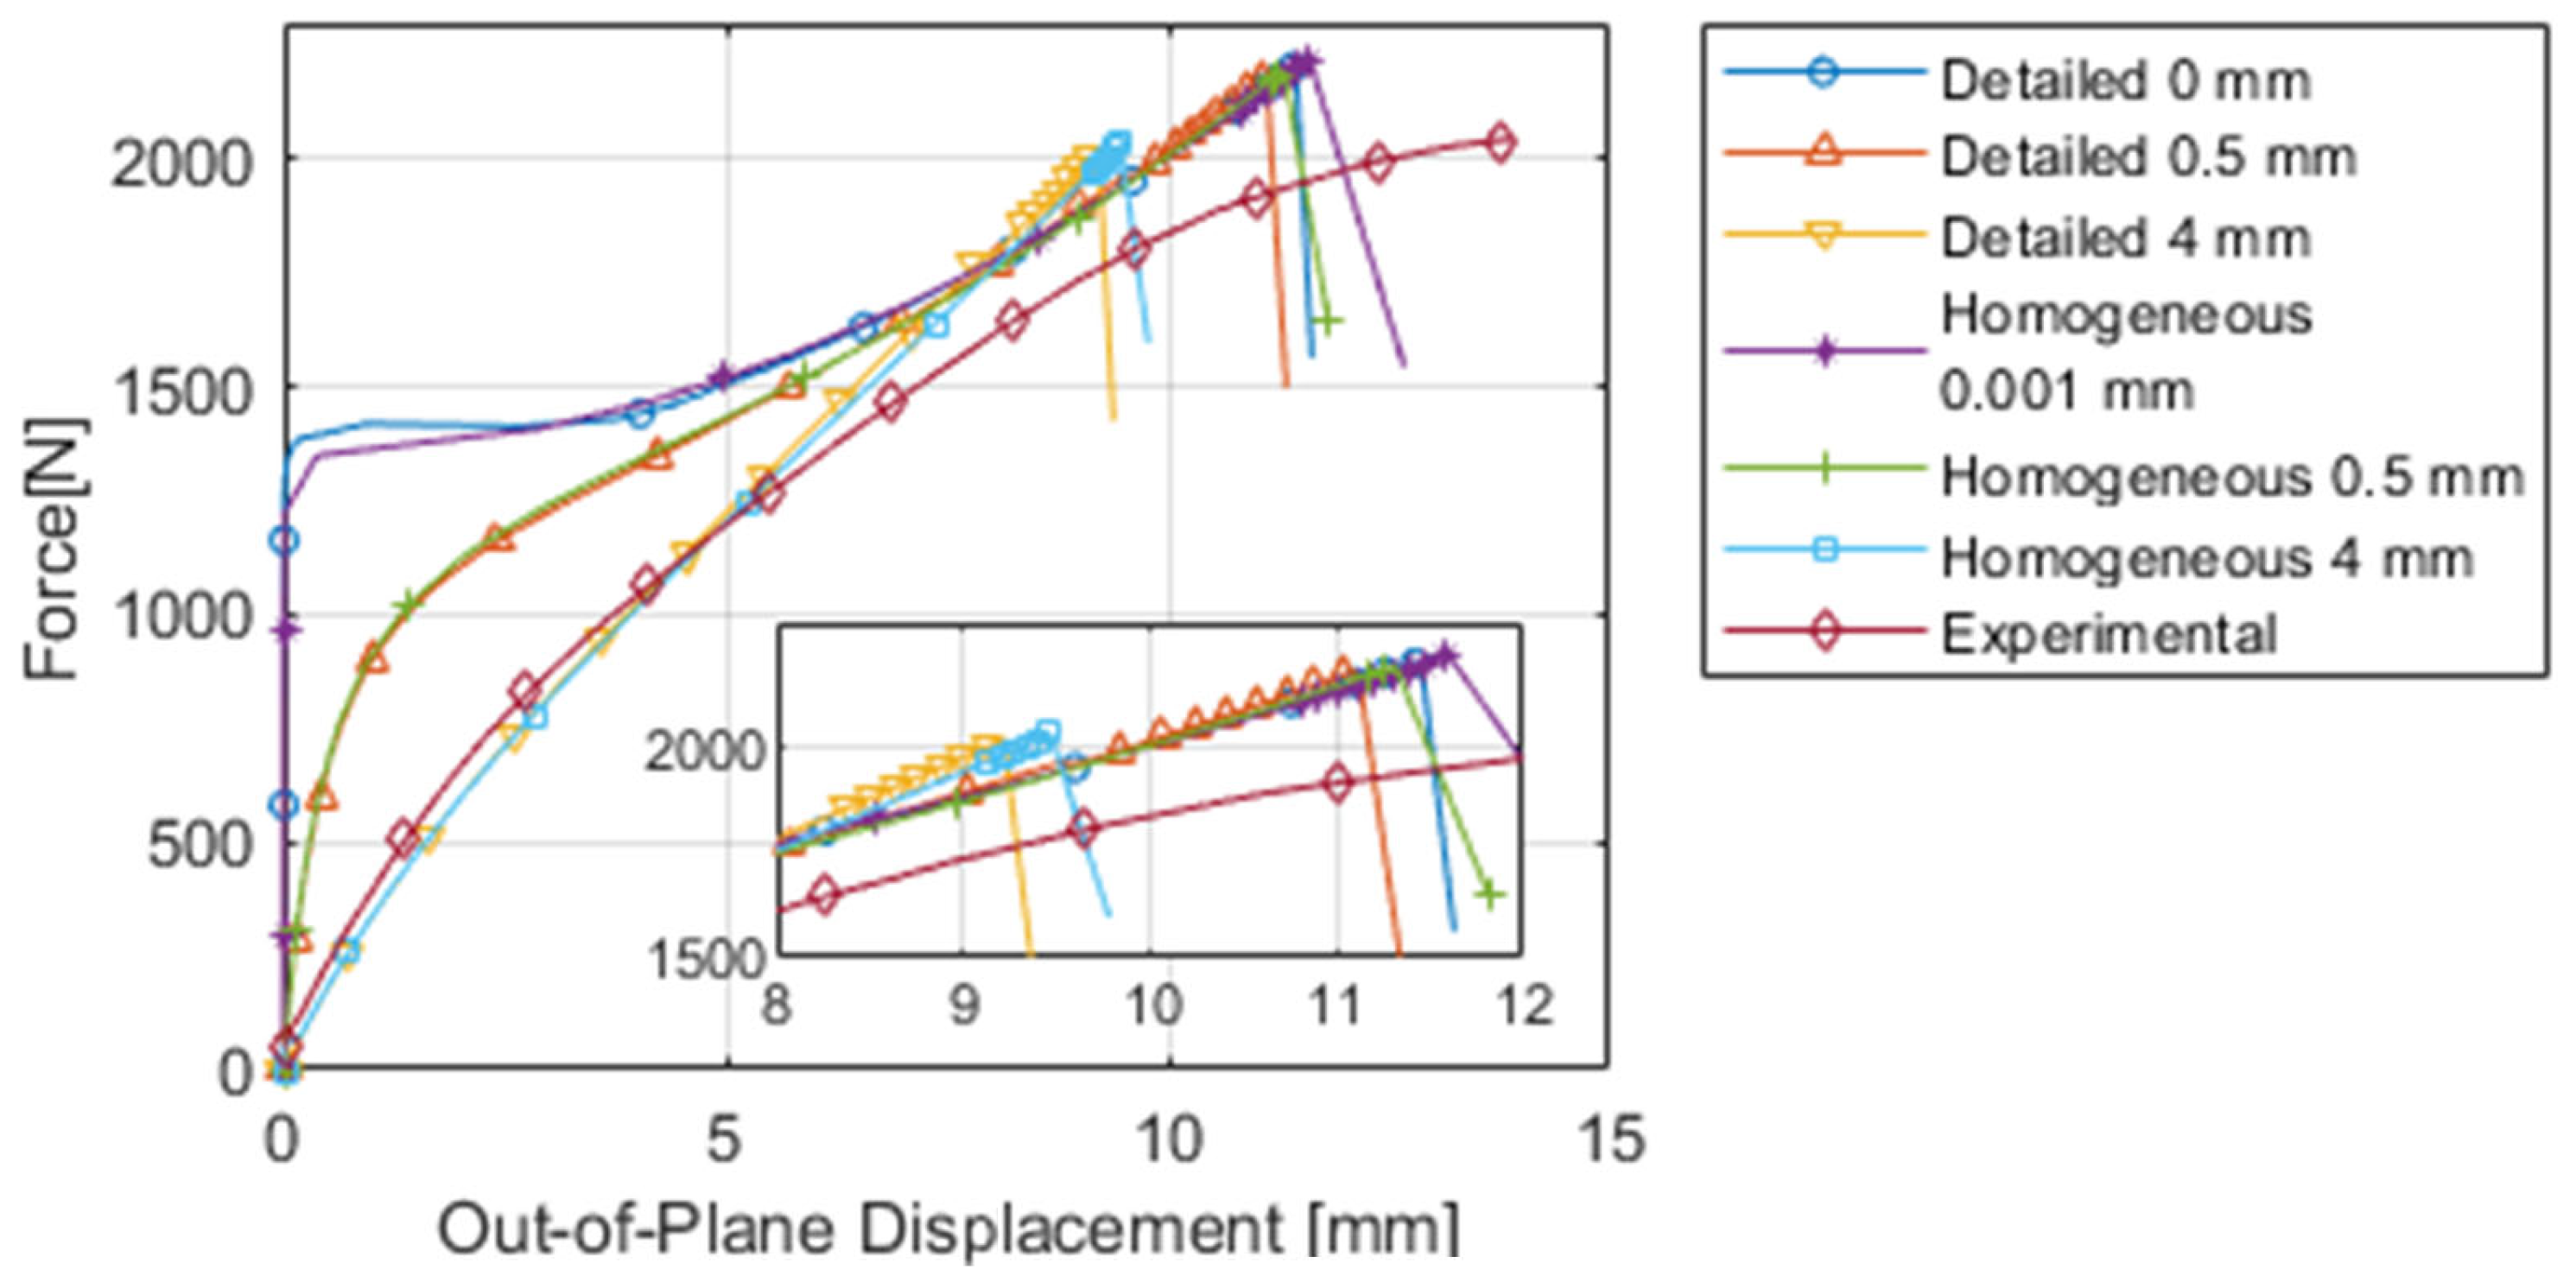
Figure 13, a 0.5 mm and 4 mm perturbation was also applied to the detailed and homogenised models. Since the experimental panels were not perfectly flat, the influence of different size perturbations was investigated. A larger perturbation resulted in an increased in-plane displacement, while out-of-plane displacement and failure load decreased. The load-displacement curves also became smoother with a larger perturbation, i.e., there was no clear kink (buckling event) in the curves as was seen with no (or small) perturbations. The 4 mm perturbation curves (
Figure 12 and
Figure 13) seem to match the stiffness of the experimental (crosshead) data better than the other models, both in terms of in-plane and out-of-plane displacements. No (or small) perturbations matched the stiffness of the DIC experimental data well in terms of in-plane displacement.
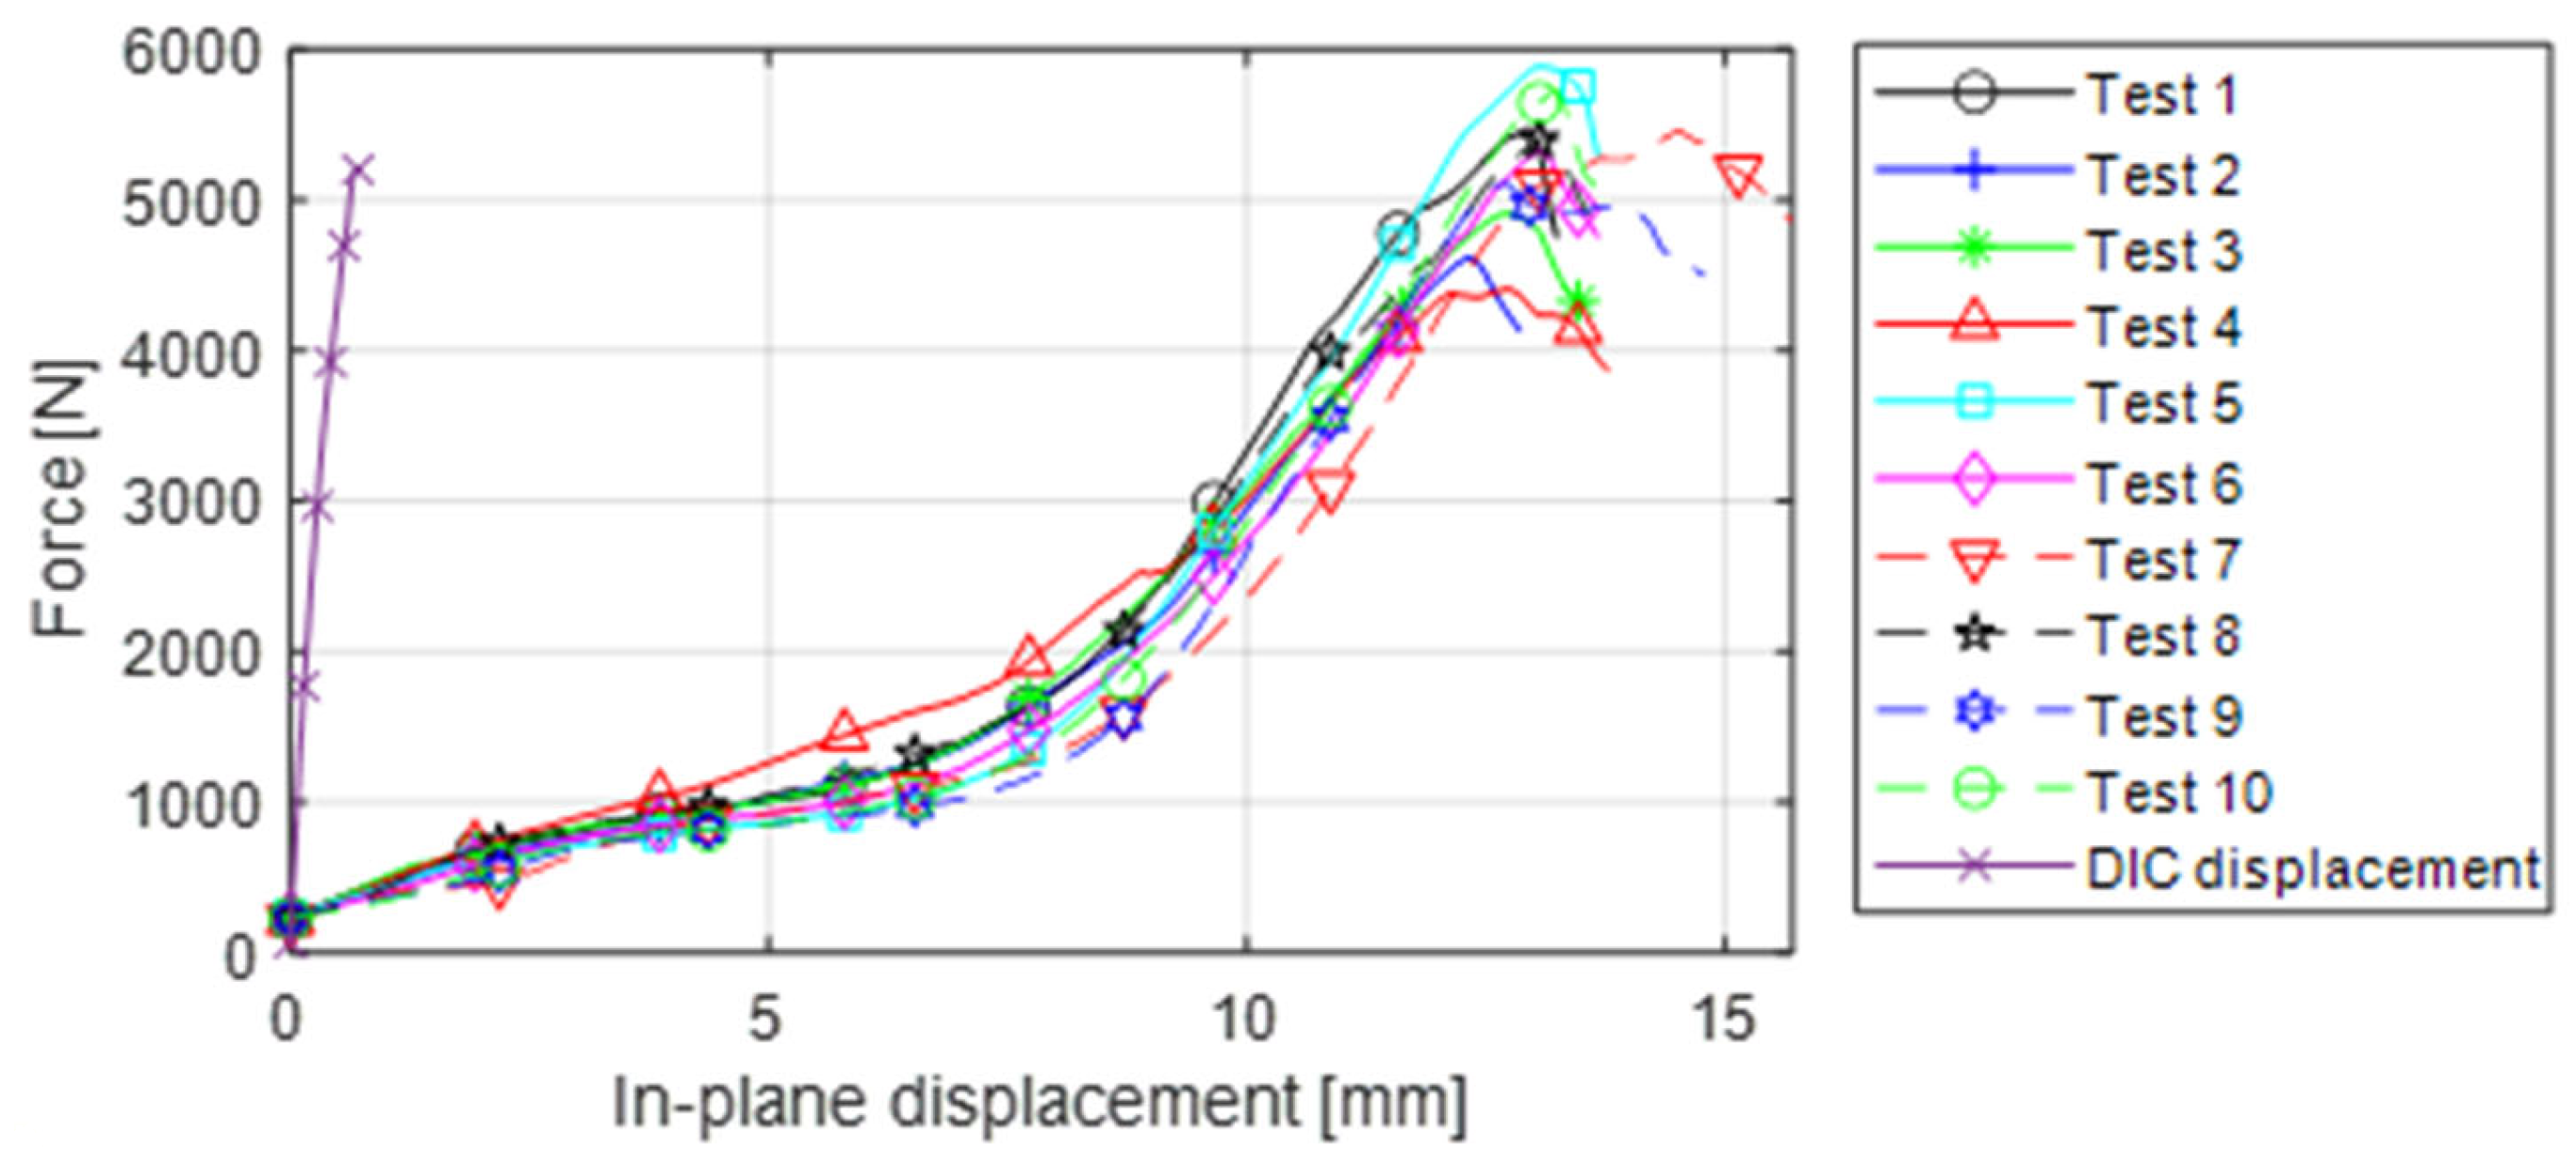
Considering
Figure 12, the experimental (crosshead) curve initially had low stiffness and then started to stiffen up before the stiffness decreased at the end. The FEA results do not reflect this initial low-stiffness region. This is likely caused by the localised crushing of the panel edges, where the edges and rollers are not perfectly parallel. It could also be due to settling if the panels are not perfectly square. This observation is supported by the DIC experimental curve which, like the FEA results, does not show a low-stiffness region.
The linear portion of the experimental (crosshead) curve had a lower stiffness than the FEA curves with a small perturbation (
Figure 12). It is seen that an initial imperfection, in the form of the first buckling mode shape, can decrease the stiffness of the FEA model in this region, suggesting the tested panels had some form of an initial imperfection that reduced the stiffness. From
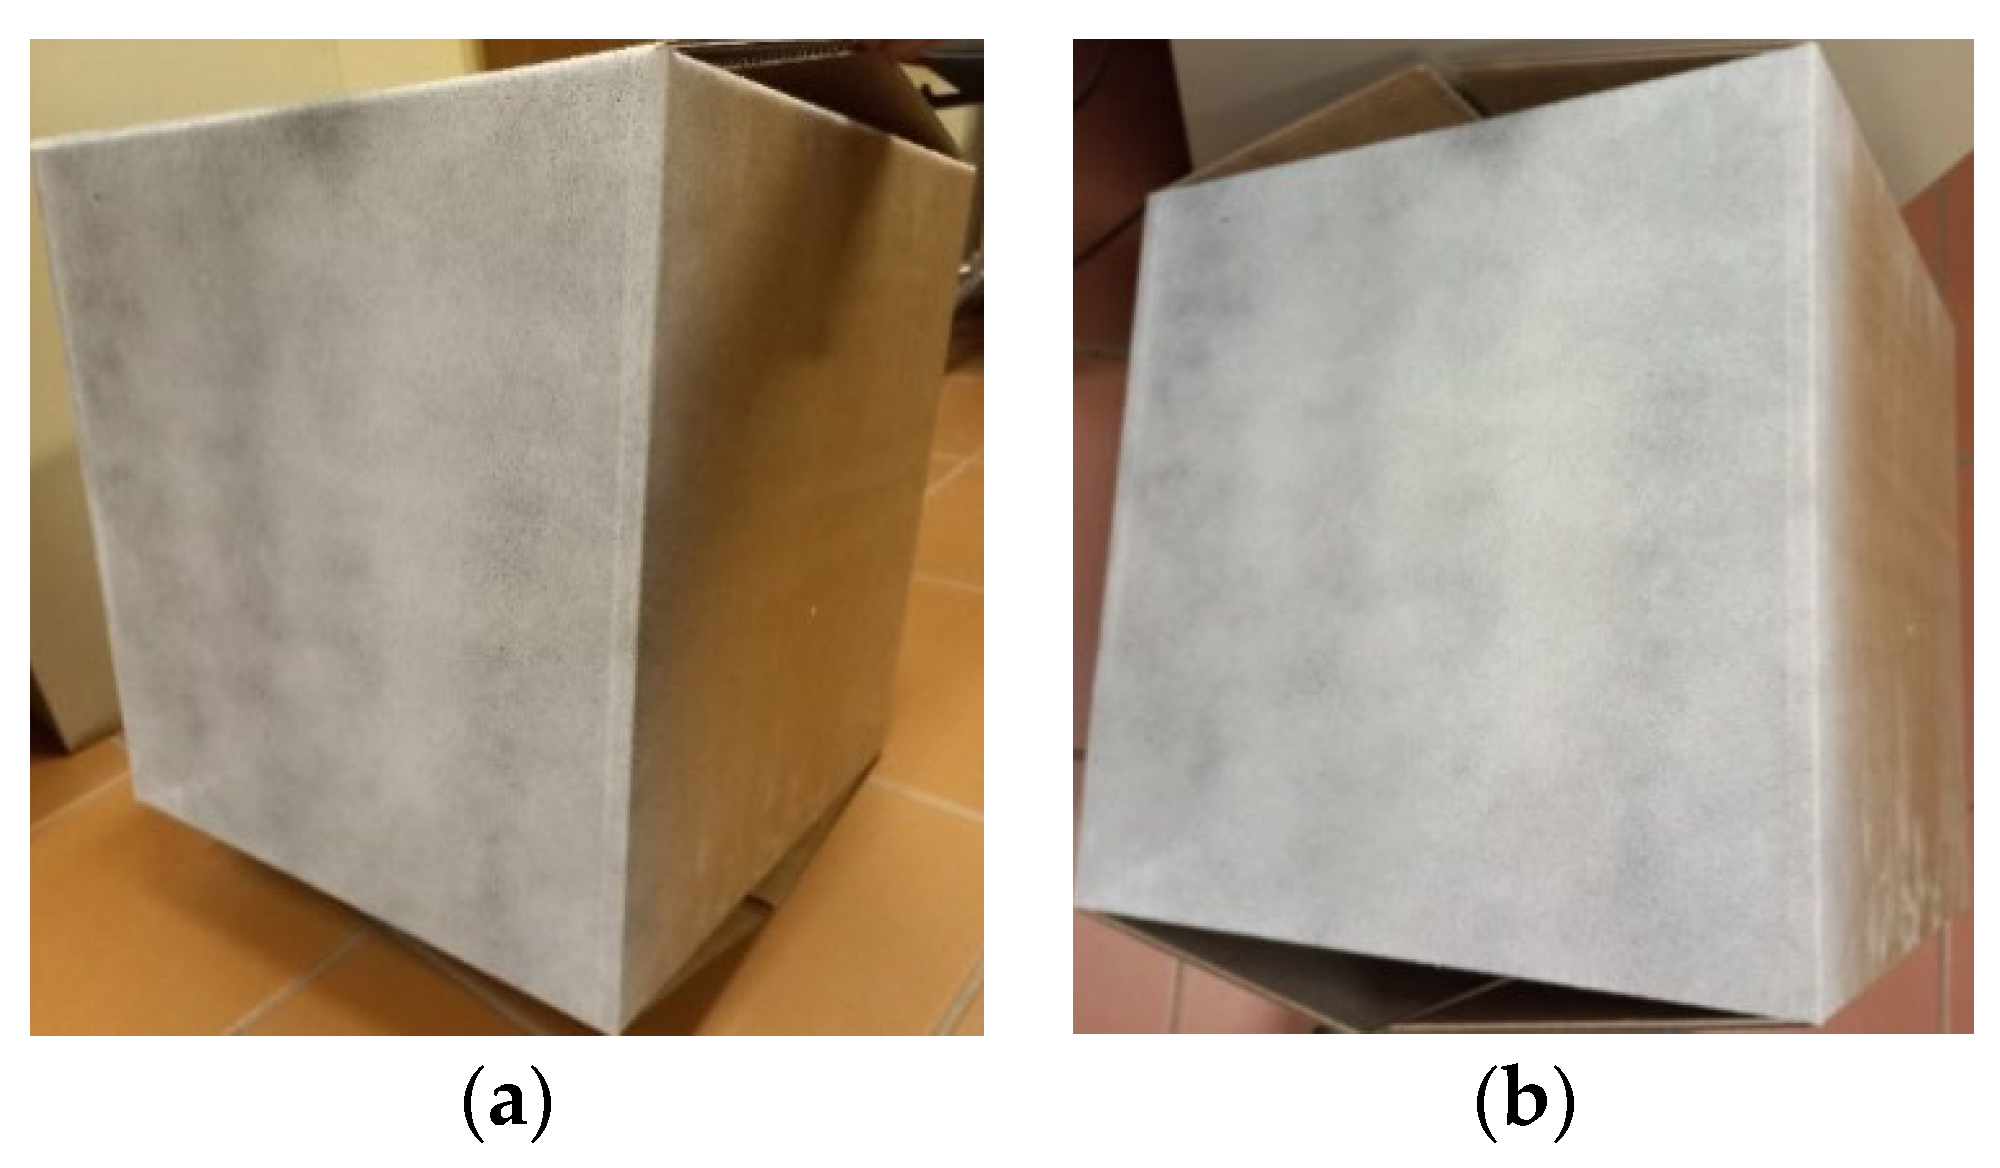
Figure 13, the same conclusion can be drawn for the out-of-plane deformation curve. When the samples were first received, there was no visible warping, but after spray-painting the samples for DIC purposes, there was visible warping. The precise severity is unknown, since the warpage was not measured, but from a visual inspection, we can see they fell within the range of 0.5 mm to 2 mm. Using a white kraft liner instead of brown will minimise the amount of paint needed for a speckle pattern, and thus minimise warpage. The DIC experimental curve, however, is slightly stiffer than the FEA with small (or no) perturbation. This would suggest that even after initial settling (the low stiffness region), there are still imperfections, causing the crosshead displacement to give different results than the DIC displacement.
Looking at the final portion of the experimental curves in
Figure 12 and
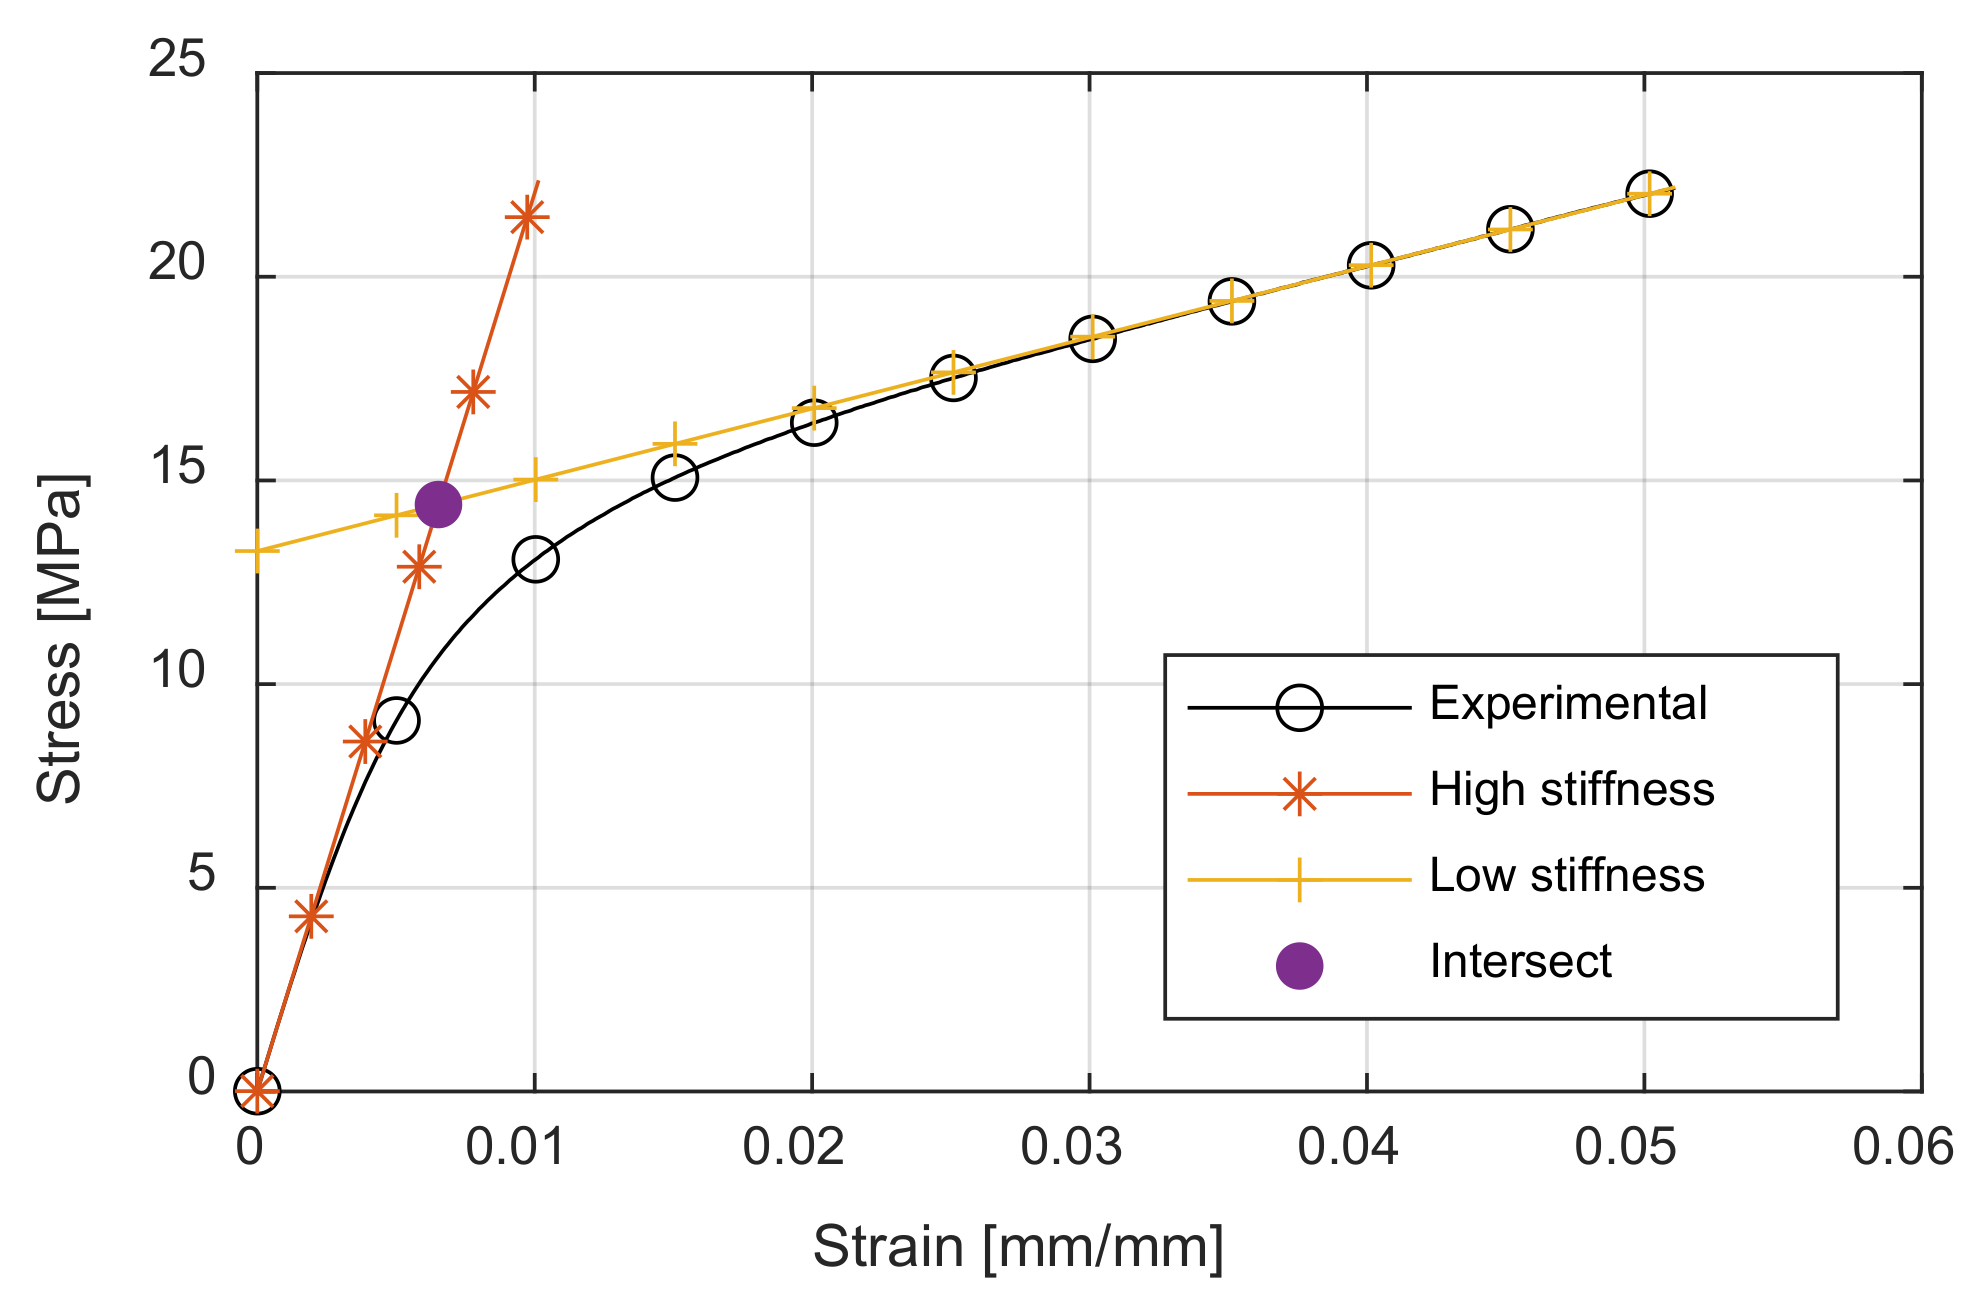
Figure 13, a decrease in stiffness is seen that is not captured in the FEA results. A decrease in stiffness is also seen in tensile tests performed on individual paper sheets—see
Figure 14 [
11]. The behaviour of the individual paper sheets (tested by [
11]) is approximately bi-linear (
Figure 14); thus, the use of a bi-linear material model [
27] with Hill’s yield criterion was investigated.
Since a nonlinear material model was not considered by [
11], whose data for individual sheets were used, all the required test data were not available, and some assumptions had to be made to implement Hill’s criterion. Hill’s yield criterion is not the most appropriate as it does not account for paper’s different strengths in tension and compression; however, other authors have used Hill’s criterion [
28,
29]. More applicable yield criteria have been investigated [
30], but would require even more assumptions to implement. The bi-linear material model thus serves as a feasibility study rather than a means of drawing clear conclusions.
Hill’s criterion would typically be determined using test data from the directions 0°, 45° and 90° relative to the “rolling” direction. The yield function, as proposed in 1948 (referred to as Hill-48), for plane stress is given as [
31]:
where
F,
G,
H and
N describe the anisotropy and may be determined in two ways. One is with
R-values (or Lankford coefficients, defined as the strain ratio of the testing direction and thickness direction) along the 0°, 90° and 45° directions:
The other is by using yield stresses along the 0°, 90° and 45° directions, and either
R0 or
R90. For
R0, the parameters may be given as:
However, the implementation in MSC Marc is slightly different [
24]. The anisotropy parameters are defined in terms of yield ratios, and these yield ratios are the input parameters, defined as:
where
σN is the yield stress in the thickness direction and
σav is the initial yield stress:
Since the
R-values and
σ45 were unknown, some assumptions had to be made. It was assumed that
σ45 was equal to
σ90, and the strain at
σ45 was equal to the strain at
σ0, based on the failure trends seen in [
32]. It was also assumed that the R-values were large, since the strain in the thickness direction was assumed small compared to the in-plane directions, i.e., plane stress [
16].
Thus, the
σN was large, and finally, since
R and
σN were large,
YRSHR (1) was approximated as 1.
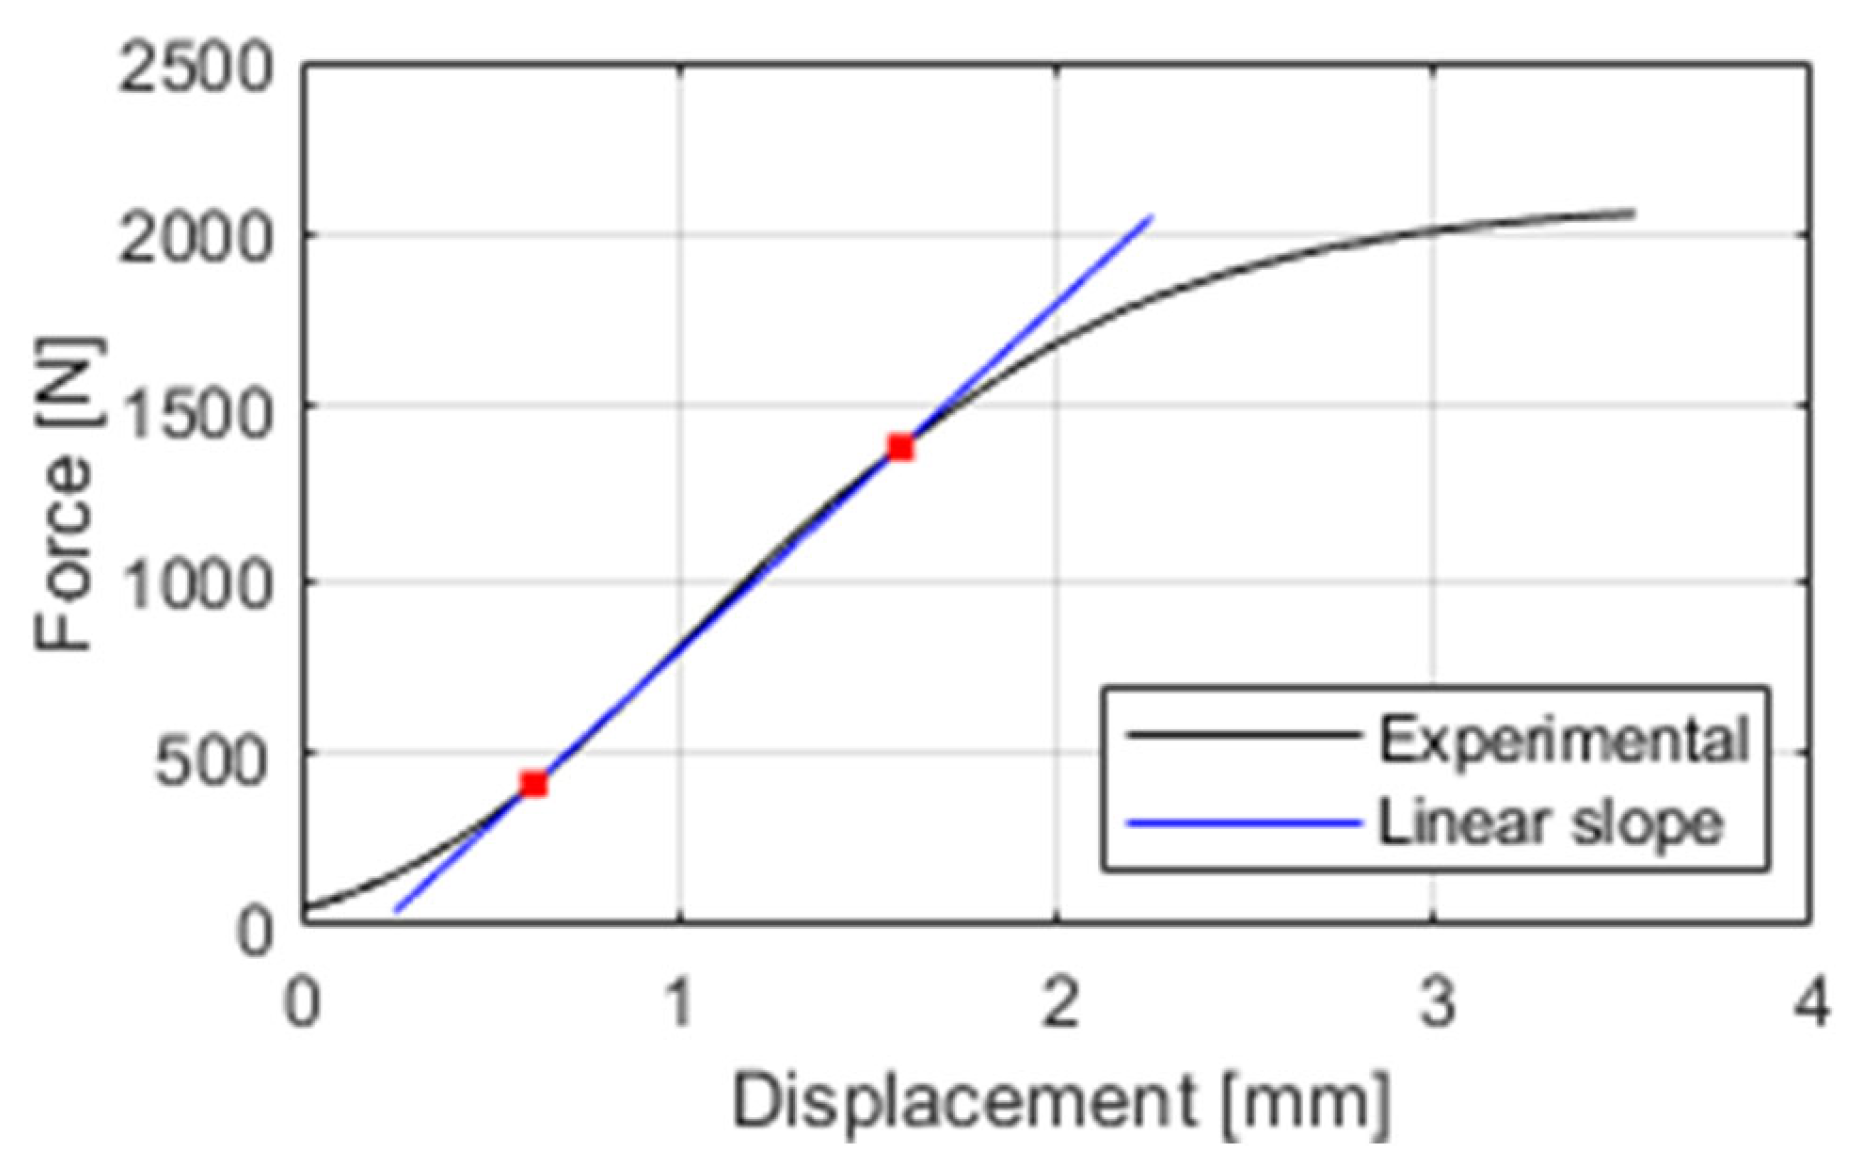
σ0 and
σ90 were estimated from
Figure 14 by fitting a linear slope to the high- and low-stiffness regions (see
Figure 15) and taking the intersect as the yield strength (
Table 9).
The bi-linear model was only considered for the detailed model. The bending adjusted material properties were used and the yield criterion was defined using the values in
Table 9. Since paper is stronger in tension than compression and the yield criterion was based on tensile data, it was expected that material failure, as defined by the Tsai-Wu failure criterion, may occur before plastic deformation (yielding). Thus, the Tsai-Wu failure criterion was not activated for the bi-linear model. A non-linear static structural analysis with large strain enabled, followed by a transient (dynamic with implicit time integration) analysis, was performed.
The load–displacement curves are shown in
Figure 16. Plastic deformation started at a much larger load than the experimental failure load, as expected, but the decrease in stiffness seen in both the in-plane and out-of-plane response was similar to what was seen in the final portion of the experimental curves. To investigate how the panel would respond to a lower yield criterion, the values in
Table 9 were reduced by 30%. A 40% reduction in tensile yield values was used by [
28] to model ECT behaviour based on values reported in the literature, but since this section is only a feasibility study, 30% was deemed acceptable. The overall response was similar to the original bi-linear curves, but the sample yielded at a smaller load—
Figure 16 (bi-linear 70% curve). This shows that including bi-linear behaviour can improve the FEA results. Paper testing with the intention of using a bi-linear model should provide the necessary data for more accurate material parameters, and thus even better results.
Determining the buckling and failure loads of the panel with FEA has been discussed above. Further, experimentally, the failure load is obvious, but the buckling load is less obvious, and will thus not be included in the following discussion (experimentally, there is no clear buckling event, as seen in the FEA results—see
Figure 12 and
Figure 13).
Table 10 compares the panel behaviour based on experimental, theoretical and FEA results. The buckling load, failure load and in- and out-of-plane displacements at failure are considered. For the theoretical values, two sample sizes were used, 400 mm × 400 mm and 415 mm × 400 mm. The 400 mm × 400 mm sample represents the ideal geometry and box dimensions. The 415 mm × 400 mm sample represents the overall dimensions of the physical samples, even though only 400 mm of the horizontal edges was loaded, and the vertical supports were 400 mm wide. Values relating to the 415 mm × 400 mm sample size are bracketed (see
Table 10). Error-values compare experimental values to the relevant method, except for the buckling load, where the error values are related to the theoretical buckling load. Note as well that, for the in-plane displacement, two values are given, i.e., crosshead (CH) and DIC displacement.
The FEA buckling loads corresponded well with the theoretical buckling load for both sample sizes, within 5.5%. The theoretical failure load does not correspond well with the experimental value, and is about 15% smaller. This deviation is not outside the margins seen in the literature [
4,
33], but it is towards the limits. The FEA failure load corresponded well to the experimental values, and was about 7% larger. A closer correlation to the experimental values (3%) was reported by [
11], but 7% is not uncommon [
19,
34].
The FEA out-of-plane displacement was about 17% less than the experimental values, which is in line with the 18% reported by [
11]. The FEA in-plane deformation is about 63% less than the experimental (CH) value. Even though this is not very accurate, it is a much better correlation than is typically seen for FEA results of BCT [
9,
11], and the in-plane deformation may in some cases not even be reported [
1,
34]. However, the FEA results are only about 20% less when looking at the DIC displacement. Further, the FEA and DIC curves (see
Figure 12) only differ largely in the final portion of the curve (which may be caused by yielding). Thus, the FEA is less inaccurate than expected when looking at the DIC displacement. Looking purely at crosshead displacement should be carefully considered when complexities such as settling and imperfect panels are not considered in the FEA model.

