Article

Coupled Neural–Glial Dynamics and the Role of Astrocytes in Alzheimer’s Disease

1
MS2Discovery Interdisciplinary Research Institute, Wilfrid Laurier University, Waterloo, ON N2L 3C5, Canada
2
BCAM—Basque Centre for Applied Mathematics, 48009 Bilbao, Spain
*
Author to whom correspondence should be addressed.
Math. Comput. Appl. 2022, 27(3), 33; https://doi.org/10.3390/mca27030033
Submission received: 16 January 2022 / Revised: 15 March 2022 / Accepted: 18 April 2022 / Published: 21 April 2022
(This article belongs to the Special Issue Computational Methods for Coupled Problems in Science and Engineering)

Abstract

:
Neurodegenerative diseases such as Alzheimer’s (AD) are associated with the propagation and aggregation of toxic proteins. In the case of AD, it was Alzheimer himself who showed the importance of both amyloid beta ( A β ) plaques and tau protein neurofibrillary tangles (NFTs) in what he called the “disease of forgetfulness”. The amyloid beta forms extracellular aggregates and plaques, whereas tau proteins are intracellular proteins that stabilize axons by cross-linking microtubules that can form largely messy tangles. On the other hand, astrocytes and microglial cells constantly clear these plaques and NFTs from the brain. Astrocytes transport nutrients from the blood to neurons. Activated astrocytes produce monocyte chemoattractant protein-1 (MCP-1), which attracts anti-inflammatory macrophages and clears A β . At the same time, the microglia cells are poorly phagocytic for A β compared to proinflammatory and anti-inflammatory macrophages. In addition to such distinctive neuropathological features of AD as amyloid beta and tau proteins, neuroinflammation has to be brought into the picture as well. Taking advantage of a coupled mathematical modelling framework, we formulate a network model, accounting for the coupling between neurons and astroglia and integrating all three main neuropathological features with the brain connectome data. We provide details on the coupled dynamics involving cytokines, astrocytes, and microglia. Further, we apply the tumour necrosis factor alpha (TNF- α ) inhibitor and anti- A β drug and analyze their influence on the brain cells, suggesting conditions under which the drug can prevent cell damage. The important role of astrocytes and TNF- α inhibitors in AD pathophysiology is emphasized, along with potentially promising pathways for developing new AD therapies.

1. Introduction

Alzheimer’s disease (AD) is one of the most common late-life dementias, with colossal social and economic impacts. The study by the Institute for Health Metrics and Evaluation published this year in [1] predicts 153 million people will be living with Alzheimer’s disease by 2050. While there are various medical products that help manage the symptoms of AD, as of today, there is only one drug officially approved by the FDA that was designed to treat a possible cause of this form of dementia, rather than the symptoms. Yet, the cost and controversy are limiting the use of this drug, known as aducanuman and marketed as aduhelm. Much of this controversy is related to whether or not the build-up of a protein called amyloid β in the brain can be used as a biomarker. According to the AD “amyloid cascade hypothesis”, this build-up causes neurodegeneration, but the link between clearance of amyloid β from the brain and deceleration of memory loss and cognitive decline requires further clarification. With over 99% of drugs developed for AD having failed in clinical trials, in addition to more traditional targets related to A β and tau proteins, there is an increasing interest in the potential of TNF- A β inhibition to prevent AD and improve cognitive function [2].
With underlying interconnections between the processes and factors mentioned above, computational experiments, based on mathematical modelling and computer simulations, can effectively supplement in vivo and in vitro research. In this paper, we present a multiscale model for the onset and evolution of AD that accounts for the diffusion and agglomeration of amyloid beta ( A β ) peptide (amyloid cascade hypothesis) and the spreading of the disease through neuron-to-neuron transmission (prionoid hypothesis). Indeed, to cover such diverse facets of AD in a single model, different spatial and temporal scales must be taken into account: microscopic spatial scales to describe the role of the neurons, macroscopic spatial and short temporal (minutes, hours) scales for the description of relevant diffusion processes in the brain, and large temporal scales (years, decades) for the description of the global development of AD. The way in which we combine distinct scales in a single model with brain connectome data assimilation forms the core and major novelty of the paper. Following closely the biomedical literature on AD, we briefly describe the processes that we shall include in our model. In the neurons and their interconnections, several microscopic phenomena take place. We know that A β monomers are present in healthy individuals, and therefore, they are unlikely to be toxic. Furthermore, the τ monomer is non-toxic [3]. On the other hand, A β oligomers are highly toxic, playing an important role in the process of cerebral damage, as postulated by the already mentioned amyloid cascade hypothesis.
In the analysis of neurodegenerative diseases, AD in particular, it is important to account for the coupling between neuronal and glial dynamics. Furthermore, given the importance of astrocytes (collectively known as astroglia) in amyloid production [4], several coupled models have been recently developed in this direction, describing Alzheimer’s A β accumulation based on calcium-dependent exosome release from astrocytes [5]. It represents a shift from a more traditional view, considering astrocytes as non-excitable brain cells, to a deeper investigation of reactive functions of astrocytes (e.g., increasing the calcium concentration level in response to neurotransmitters and neuromodulators) and their synaptic communication with neurons and other brain cells via what is sometimes labelled as astrocytic networks. Hence, with the ready availability of the data from the brain connectome, derived from various AD mouse models and obtained with the help of transcriptomics and other technologies [6], it is enlightening to go beyond single astrocyte’s consideration and to develop network models allowing such data assimilation (see, e.g., [7,8,9,10] and references therein). This idea is pursued further in this paper.
By now, it is well known that the neuronal and astroglial networks of the brain are innately interwoven, with astrocytes carrying out a multitude of functions in various brain processes, including homoeostasis and neurogenesis, with both positive and negative effects reported [11]. In particular, they are critical in defining the normal operation of the nervous system, but they could also actively contribute to the pathogenesis of AD and other neurodegenerative disorders [8]. As observed in experiments on astroglial atrophy at earlier stages of such neurodegenerative diseases such as Alzheimer’s, Parkinson’s, and various forms of dementia, they play a major role in them, leading to disruptions in synaptic connectivity, disbalance in neurotransmitter homoeostasis, and neuronal death through increased excitotoxicity [12,13]. They maintain their importance in the progression of these diseases at the later stages as well, in particular through their activation and contribution to the neuroinflammatory component of grey matter in pathological neurodegeneration. Given the significance of the contribution of neuroinflammation to Alzheimer’s disease (AD) progression [14], our better understanding and ultimately controlling of these coupled neuronal–astroglial networks become increasingly important, opening the door to developing future therapies. For this to happen, increasing attention is being paid to a relationship between the astrocytes’ effects in the brain and such fundamental processes as synaptic transmission, cognition, and myelination [11]. At the same time, conclusive experimental studies of the role of astrocytes remain extremely challenging, given that the multiple functionalities of these cells are dependent on numerous (and sometimes contradictory) factors during the disease progression. Researchers have shown that both microglia and astrocytes are very heterogeneous in their functions in the diseased brain [15,16,17]. Indeed, on the one hand, they can contribute to the clearance of A β and limit the growing inflammation in the brain, while, on the other hand, they may neglect their metabolic role and release neurotoxins, contributing in this way to AD neurodegenerative processes. This leads to a situation where mathematical and computational models developed in a data-driven environment may very efficiently complement the progress made in the experimental domain.
While we briefly touch on other aspects, in this paper, our focus is mainly on the role of astrocytes in Alzheimer’s disease via their dynamic interactions with agglomerations of A β peptides. Not only AD is typified by such agglomerations, along with activated glial cells, but also because A β plaques trigger intracellular NFT formation, neuronal cell death, neuroinflammation, and gliosis, whereas reactive astrocytes in AD, surrounding these plaques, may additionally contribute to the overall amyloid burden in the brain by secreting A β [4]. Indeed, today, we know that a reactive character of astrocytes in AD is usually expressed by intermediate filament proteins and cellular hypertrophy, as well as that these star-shaped glial cells can regulate synaptic communication and modulate brain network functions [7].
The rest of the paper is organised as follows. We develop a network mathematical model for brain connectome data assimilation in Section 2. With the help of brain connectome data, in Section 3, we provide details on two groups of computational experiments elucidating the role of cytokines and astrocytes in AD and giving further details on AD TNF- α inhibitor drugs, quantifying their influence on the reduction of neuronal damage. All numerical results, reported in this section, were obtained with our new network model. Several possible extensions of this work are discussed in Section 4, with concluding remarks given in Section 5.

2. AD Network Model for Brain Connectome Data Assimilation

In this section, we develop a network model based on the consideration originally presented in [18], where a PDE model on AD was discussed. Before going to the full network model in the brain connectome, we first define the diffusion and chemoattraction terms in a network [19,20]. Suppose the network graph G has V number of nodes and E number of edges. For j , k = 1 , 2 , 3 , , V , the elements of the adjacency matrix W l corresponding to the graph G are
W j k l = n j k l j k 2 ,
where n j k is the mean fiber number and l j k 2 is the mean length squared between the nodes j and k. We define a matrix L l with entries
L j k l = ( D j j l W j k l ) , j , k = 1 , 2 , 3 , , V ,
where D j j l = k = 1 V W j k l . Therefore, at each node j, we take the contribution of the diffusion term for a dummy variable denoted below as u in the following form
( Δ u ) j = k = 1 V L j k l u k .
Similarly, at each node j, we find the chemoattraction term as
( · ( v u ) ) j = ( k = 1 V L j k c v k ) ( k = 1 V L j k c u k ) v j k = 1 V L j k l u k ,
where L j k c = ( D j j c W j k c ) with W j k c = n j k / l j k and D j j c = k = 1 V W j k c .
Now, at the node j in the brain connectome, we are ready to define a network model for Alzheimer’s disease incorporating the astrocytes’ dynamics [18]. We use j as the node index in each of the upcoming equations. Suppose N j is the density of the living neurons and N 0 is the reference density of the neurons in brain cells. Inside the neurons, amyloid beta A β i is constitutively produced from APP at a rate λ β i and degraded at a rate d A β i . In the early stage of disease progression, A β i is overproduced by reactive oxygen species (ROS) factor R. Therefore, the dynamics of A β i is given by
d A β j i d t = ( λ β i ( 1 + R ) d A β i A β j i ) N j N 0 .
The density of extracellular amyloid beta peptides ( A β o ), depends on different factors, such as neuronal death, microglias, astrocytes, etc. The equation for A β o is given by
d A β j o d t = A β j i | d N j d t | + λ N N j N 0 + λ A A j A 0 ( d A β o M ^ ( M ^ 1 j + θ M ^ 2 j ) + d A β o M ( M 1 j + θ M 2 j ) ) A β j o A β j o + K ¯ A β o ,
where A 0 is the reference astrocyte cell density and K ¯ A β o is a Michaelis–Menten coefficient [21]. The first term on the right-hand side of (6) is the contribution due to neuronal death. The second and third terms of (6) are the growths released from amyloid precursor protein (APP) [22] and astrocytes [23], respectively. The last multiplying factor is the clearance of A β o by peripheral macrophages M ^ 1 and M ^ 2 and the activated microglias M 1 and M 2 . Here, 0 θ < 1 as M ^ 1 and M 1 are more effective in clearing the extracellular A β compared to M ^ 2 and M 2 . APP on live neurons shed A β peptides in both the intracellular and extracellular space [18]. We assumed that most of the A β o is produced from dead neurons, so the production from the live neurons is neglected.
The second most critical factor in AD is the tau protein. Suppose that the tau protein is constitutively produced, and the degradation rates are λ τ 0 and d τ , respectively. Due to the abnormal concentrations of A β , i.e., when the production of A β i exceeds a threshold, say A β c i , glycogen synthase kinase-type 3 (GSK-3) becomes activated, and it mediates the hyperphosphorylation of tau proteins. Suppose d τ is the degradation rate of tau proteins due to ROSs. Then, the rate of change of tau protein is given by
d τ j d t = ( λ τ 0 + λ τ R d τ τ j ) N j N 0 .
Inside the neurons, NFTs form from the hyperphosphorylation of tau proteins and are released into the extracellular space after the death of the neurons [24,25,26,27]. The equations for NFTs inside the neurons and the extracellular space are given by
d F i j d t = ( λ F τ j d F i F i j ) N j N 0 ,
d F o j d t = F i j | d N j d t | d F o F o j ,
respectively.
Due to NFTs’ formation in the brain cell, microtubules are depolymerised and destructed, leading to neuron death [24,25,26,27]. Not only NFTs, proinflammatory and anti-inflammatory cytokines are also responsible for neuronal death in the brain. Including these factors in the dynamics for N, we obtain
d N j d t = d N F F i j F i j + K F i N j d N T T α j T α j + K T α 1 1 + γ I 10 j K I 10 N j ,
where T α and I 10 denote the proinflammatory and anti-inflammatory cytokines, respectively.
Astrocytes are primarily activated by the proinflammatory cytokines T α [28], but they are also activated by the extracellular amyloid beta A β o [23]. Therefore, the equation for astrocytes is given by
d A j d t = λ A A β o A β j o + λ A T α T α j d A A j .
Microglias and peripheral macrophages clear the NFTs in the extracellular space and keep neurons healthy. Therefore, the dynamics of neuronal death is given by
d N d j d t = d N F F i j F i j + K F i N j + d N T T α j T α j + K T α 1 1 + γ I 10 j K I 10 N j d N d M ( M 1 j + M 2 j ) N d j N d j + K ¯ N d d N d M ^ ( M ^ 1 j + M ^ 2 j ) N d j N d j + K ¯ N d .
Amyloid beta oligomers are soluble, and they diffuse in the brain tissue [29,30,31]. Incorporating the diffusion of the oligomers in the network model along with its production (from A β o ) and degradation, we obtain
d A o j d t = D A o k = 1 V L j k l A o k + λ A o A β j o d A o A o j ,
where D A o is the diffusion coefficient.
In the AD-affected brain, dying neurons produce nonhistone chromatin-associated protein (HMGB-1), and it diffuses in the brain cells [32,33]. The reaction–diffusion equation for the PDE-based model of [18] is simplified into the ODE in the network as follows:
d H j d t = D H k = 1 V L j k l H k + λ H N d j d H H j .
Microglias travel in the brain cell [34]. Activated microglias are chemoattracted to the cytokines’ high mobility group box 1 (HMGB-1). Furthermore, microglias are activated by the extracellular NFTs and soluble oligomers. The M 1 and M 2 phenotypes are characterised by the proinflammatory and anti-inflammatory signals from T α and I 10 , respectively. These two types of microglias satisfy the following equations
d M 1 j d t = M 1 j k = 1 V L j k l H k ( k = 1 V L j k c M 1 k ) ( k = 1 V L j k c H k ) λ M 1 T β T β j T β j + K T β M 1 j d M 1 M 1 j + M G 0 ( λ M F F o j F o j + K F o + λ M A A o j A o j + K A o ) β ϵ 1 β ϵ 1 + ϵ 2 ,
d M 2 j d t = M 2 j k = 1 V L j k l H k ( k = 1 V L j k c M 2 k ) ( k = 1 V L j k c H k ) + λ M 1 T β T β j T β j + K T β M 1 j d M 2 M 2 j + M G 0 ( λ M F F o j F o j + K F o + λ M A A o j A o j + K A o ) ϵ 2 β ϵ 1 + ϵ 2 ,
where ϵ 1 = T α j / ( T α j + K T α ) , ϵ 2 = I 10 j / ( I 10 j + K I 10 ) . The parameter β is the ratio of the proinflammatory and anti-inflammatory environment, and it determines the relative strengths of T α and I 10 . Here, the ratios β ϵ 1 / ( β ϵ 1 + ϵ 2 ) and ϵ 2 / ( β ϵ 1 + ϵ 2 ) in the right-hand sides measure the activated microglias becoming M 1 and M 2 macrophages, respectively.
Depending on the relative concentrations of T α and I 10 , the incoming macrophages are divided into two phenotypes M ^ 1 and M ^ 2 [35]. Furthermore, the phenotype of macrophages M ^ 1 change to the macrophages M ^ 2 under the signal T β . Therefore, the peripheral macrophages satisfy the following equations:
d M ^ 1 j d t = M ^ 1 j k = 1 V L j k l A o k ( k = 1 V L j k c M ^ 1 k ) ( k = 1 V L j k c A o k ) λ M ^ 1 T β T β j T β j + K T β M ^ 1 j d M ^ 1 M ^ 1 j + α ( P j ) ( M 0 M ^ j ) β ϵ 1 β ϵ 1 + ϵ 2 ,
d M ^ 2 j d t = M ^ 2 j k = 1 V L j k l A o k ( k = 1 V L j k c M ^ 2 k ) ( k = 1 V L j k c A o k ) + λ M ^ 1 T β T β j T β j + K T β M ^ 1 j d M ^ 2 M ^ 2 j + α ( P j ) ( M 0 M ^ j ) ϵ 2 β ϵ 1 + ϵ 2 ,
where M ^ j = M ^ 1 j + M ^ 2 j and α ( P j ) = α P j / ( P j + K P ) .
T α is produced by proinflammatory macrophages M 1 and M ^ 1 . T β and I 10 are produced by M 2 and M ^ 2 . Therefore, the equations for T α , T β and I 10 are in the form
d T α j d t = D T α k = 1 V L j k l T α k + λ T α M 1 M 1 j + λ T α M ^ 1 M ^ 1 j d T α T α j ,
d T β j d t = D T β k = 1 V L j k l T β k + λ T β M M 2 j + λ T β M ^ M ^ 2 j d T β T β j ,
d I 10 j d t = D I 10 k = 1 V L j k l I 10 k + λ I 10 M M 2 j + λ I 10 M ^ M ^ 2 j d I 10 I 10 j .
Activated astrocytes and microglias produce monocyte chemoattractant protein-1 (MCP-1) [36,37], and it is assumed to be of the M 2 phenotype. Hence,
d P j d t = D P k = 1 V L j k l P k + λ P A A j + λ P M 2 M 2 j d P P j .
We have used the same estimated parameter values developed by Hao and Friedman [18] for the network model (5)–(22). Further details are provided in Table 1 and Table 2 with λ A A β o = 1.793 and λ A T α = 1.54 . We have assumed that these parameter values are uniform for all the nodes in the brain connectome.

3. Numerical Results Based on the Network Model

In this section, we report two groups of computational experiments, focusing on (a) the role of cytokines and astrocytes and (b) the importance of TNF- α inhibitors in reducing neuronal damage in AD. We considered a high-resolution brain connectome structure consisting of V = 1015 vertices and E = 70,892 edges; the data source is available for the patients’ connectome data at https://braingraph.org (accessed on 20 April 2022) [38]. The network model developed in Section 2 was implemented by using the C programming language and Matlab. We simulated the network model (5)–(22) for each node j = 1 , 2 , , V with uniform initial conditions for all the nodes [18,39]: A β i = 10 6 , A β o = 10 8 , τ = 1.37 × 10 10 , F i = 3.36 × 10 10 , F o = 3.36 × 10 11 , N = 0.14 , A = 0.14 , M 1 = M 2 = 0.02 , M ^ 1 = M ^ 2 = N d = 0 , H = 1.3 × 10 11 , T β = 10 6 , T α = 2 × 10 5 , I 10 = 10 5 , P = 5 × 10 9 . Table 3 lists all the variables used in the model, and the units of all these variables are given in g/mL. We used the value of R as
R = R 0 t / 100 0 t 100 , R 0 t > 100 .

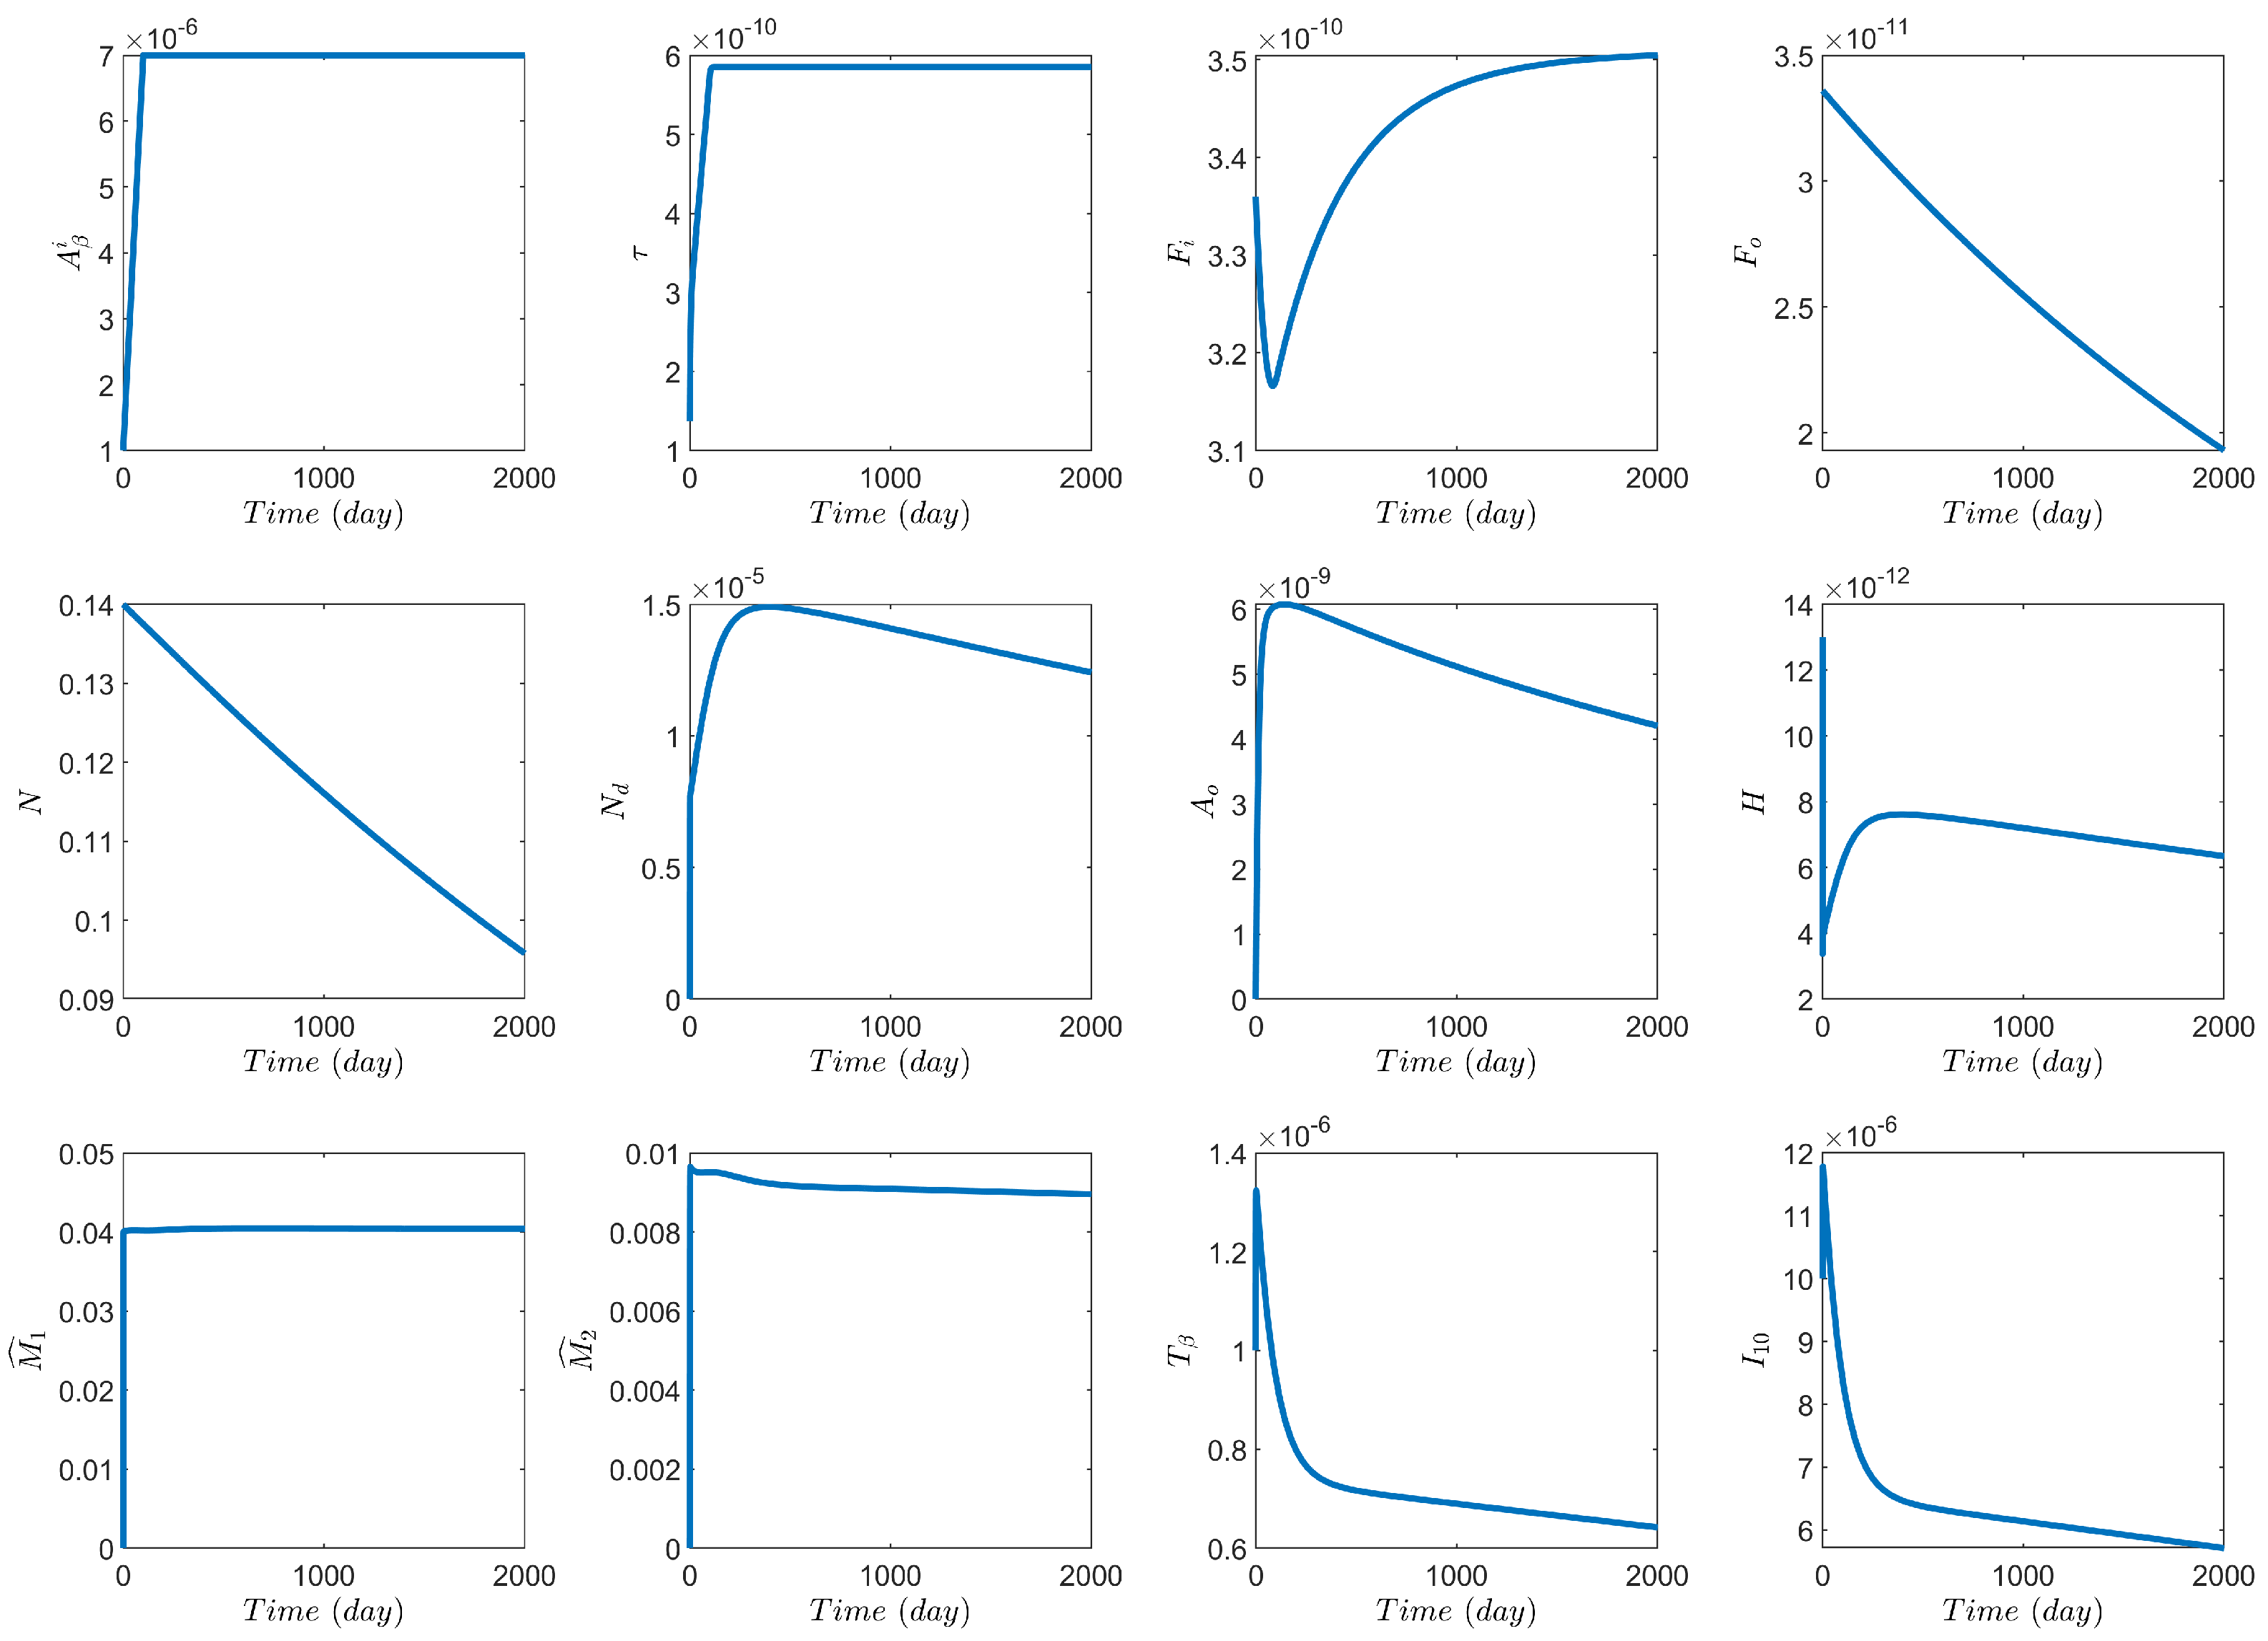
3.1. Computational Experiments on the Role of Cytokines and Astrocytes in AD

After integrating the brain connectome data, we computed all the components involved in Equations (1)–(4). We plot the average densities of twelve variables for the network model in Figure 1. These variables have an influence on the model, but we mainly focused on the astrocyte and microglia variables and the other variables directly associated with these two. Extracellular A β and the pro-inflammatory cytokines T α play a crucial role in the growth of astrocytes in the brain (see Equation (11)).
The density change in the astrocytes or the microglia causes a change in the MCP-1’s density, following from Equation (22). Figure 2 shows the density change in astrocytes and MCP-1 by changing the growth parameters in astrocytes, while the other concentrations do not change as such. As additional factors have been taken into account, here we obtained a different result as compared to [18]. As time progresses, the densities of extracellular A β , A β -oligomers, astrocytes, and MCP-1 decrease.

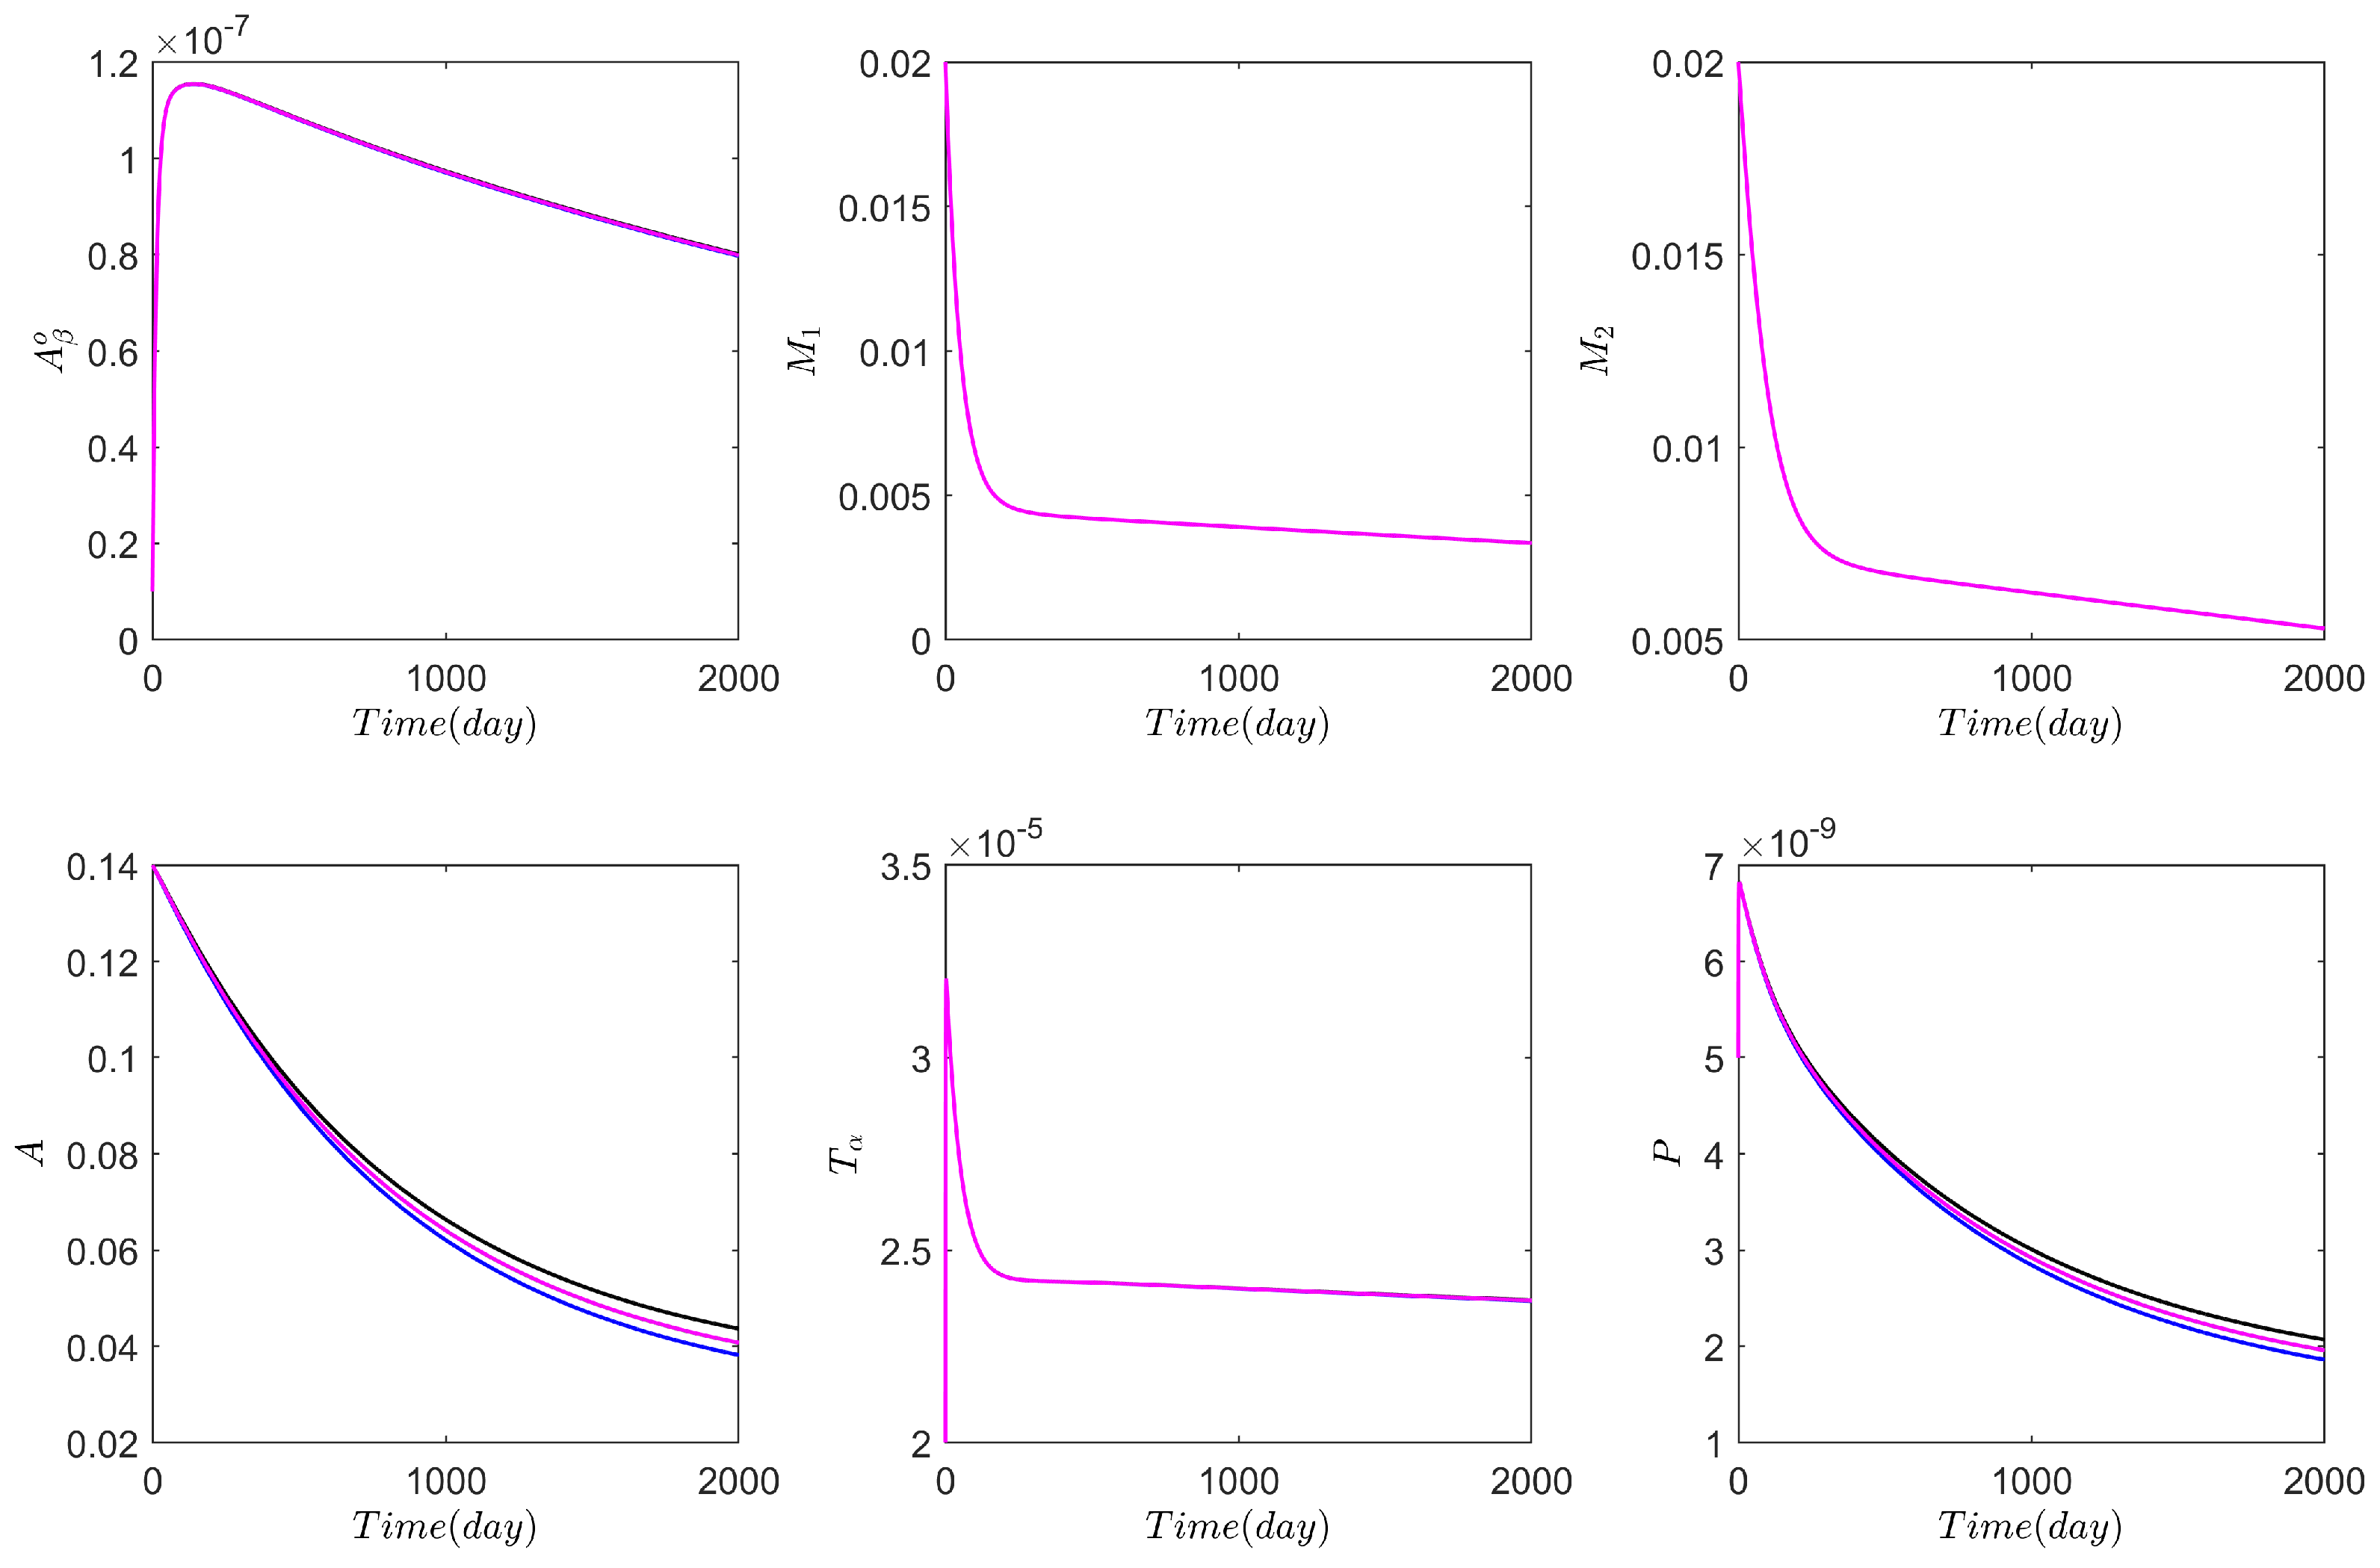
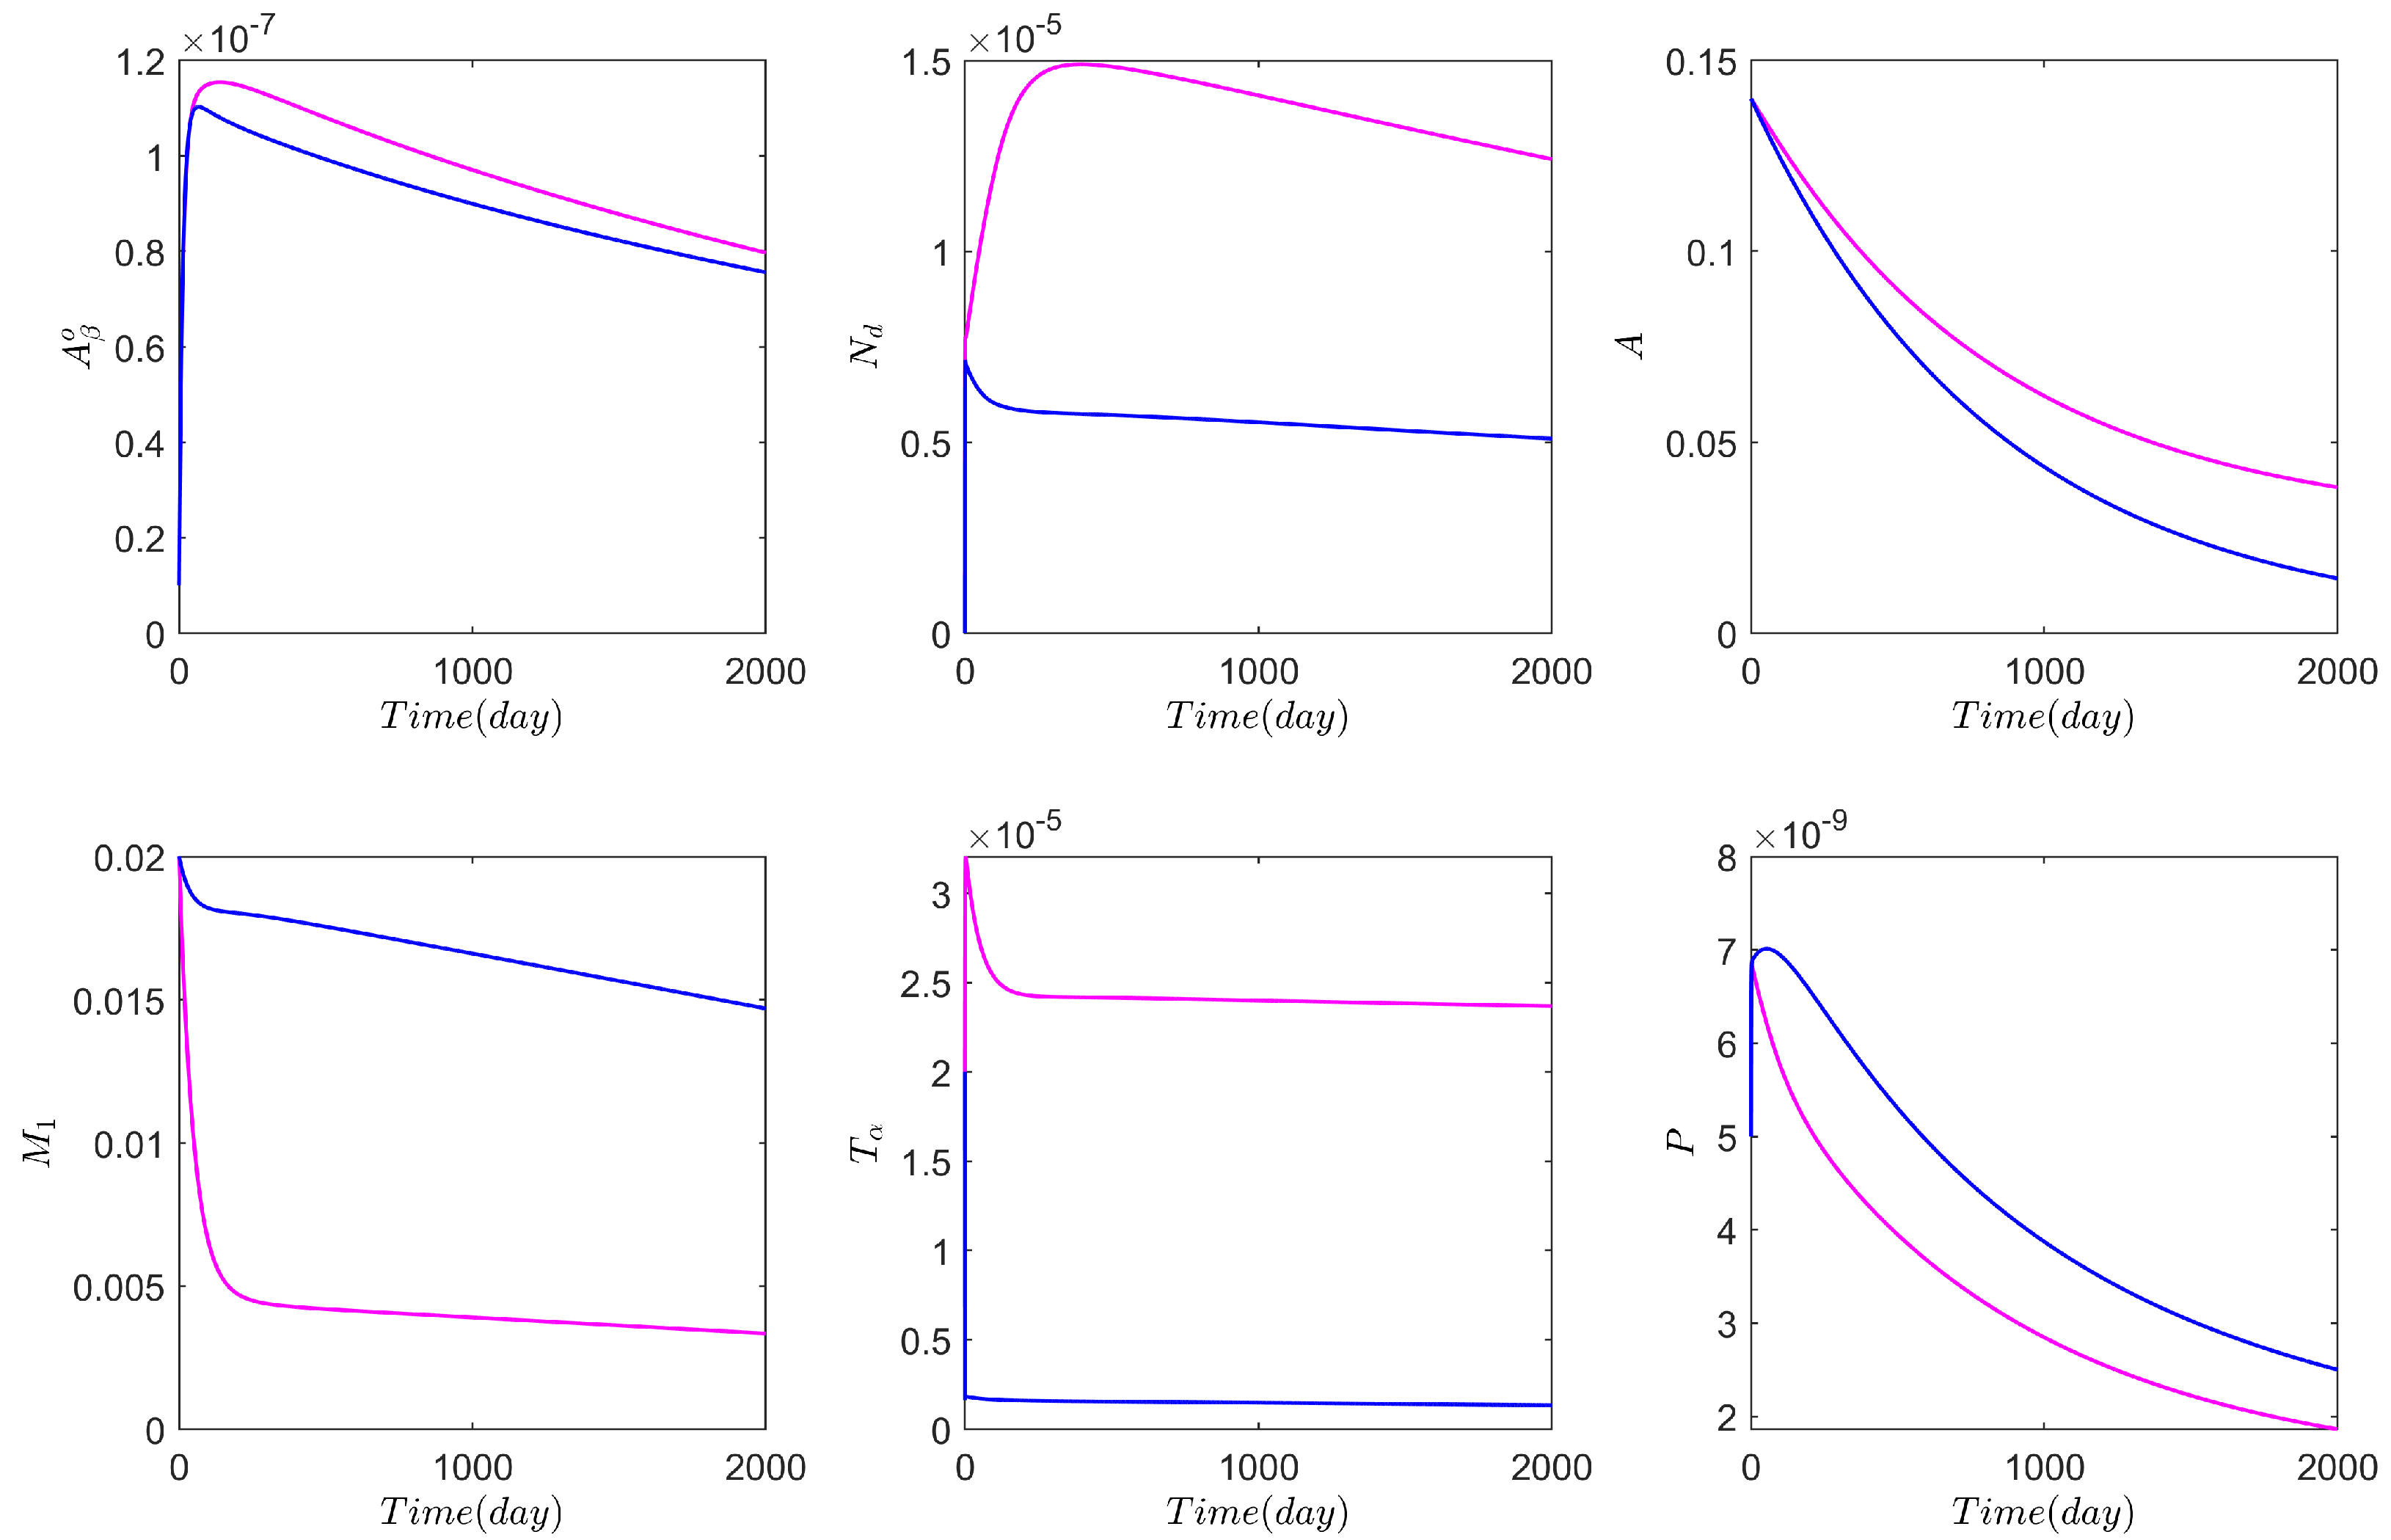
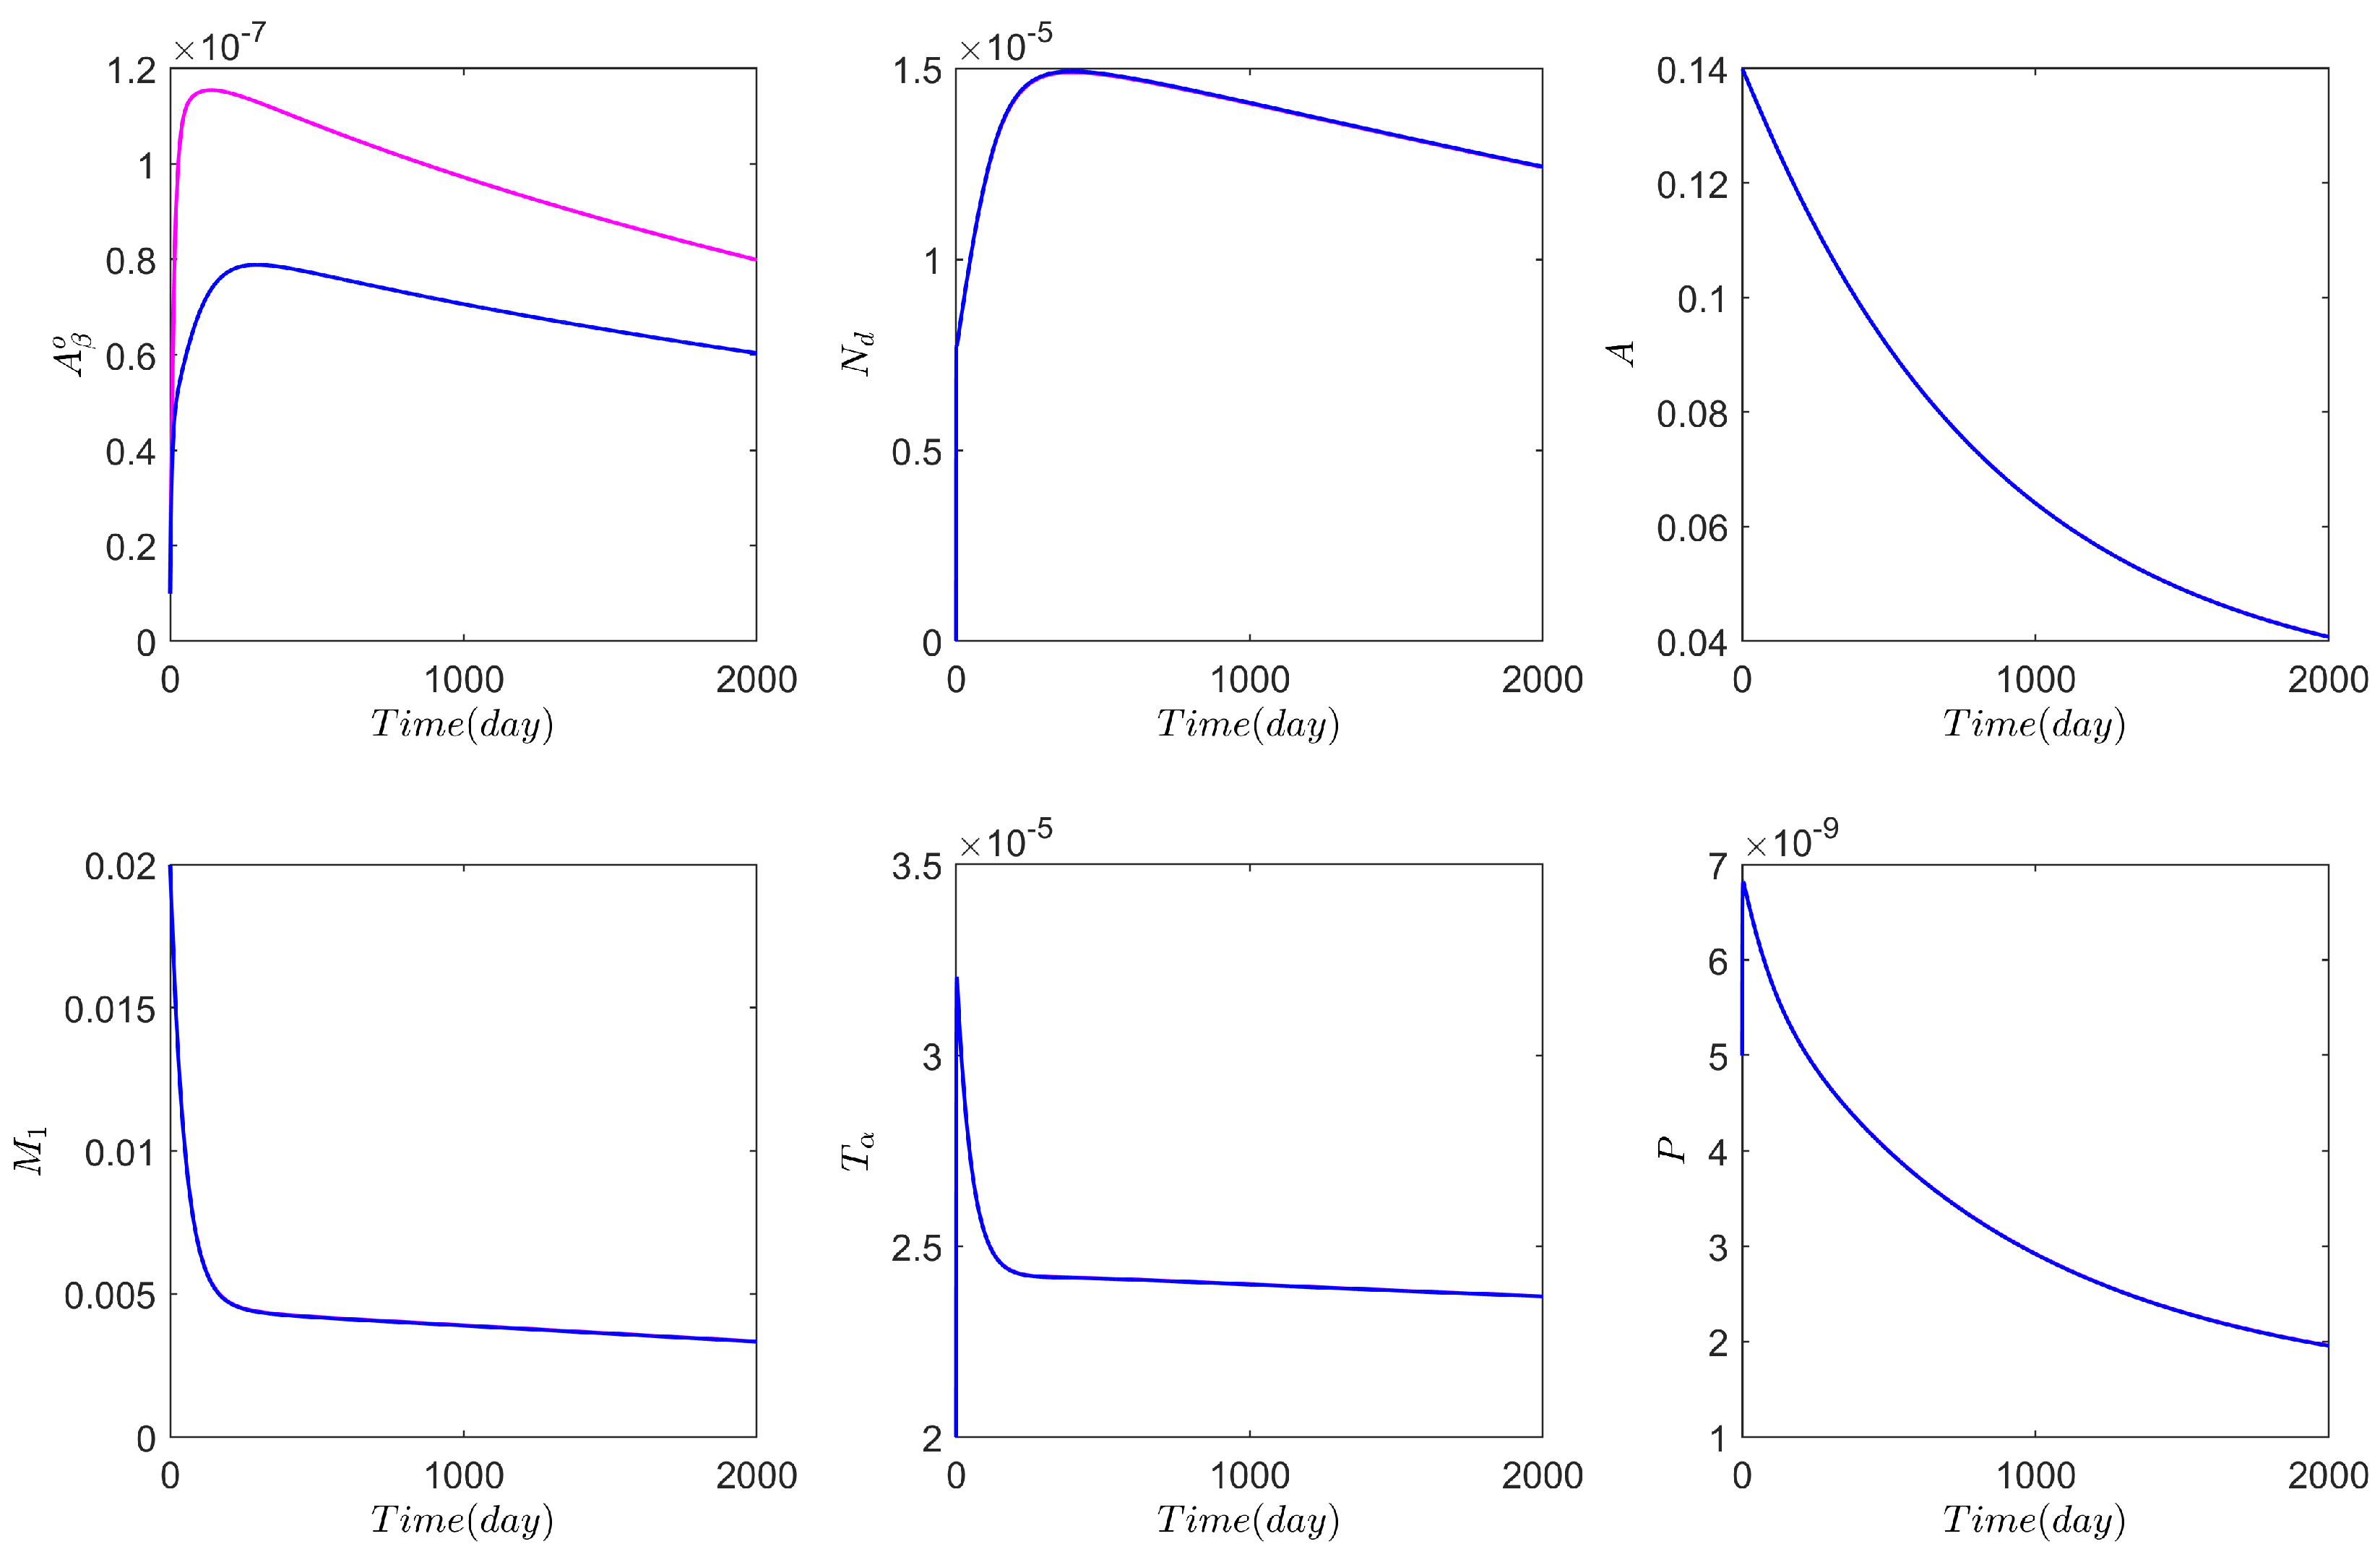
3.2. Computational Experiments on AD Drugs

Next, our attention is drawn to soluble inflammatory cytokines. It is well known that soluble cytokine receptors regulate inflammatory and immune events by functioning as antagonists of cytokine signalling. Among various biologic medical products that, by interfering with tumour necrosis factor (TNF), are used to treat autoimmune diseases, caused by an overactive immune response, etanercept (marketed as enbrel) is quite popular. In its essence, it is an amalgamation protein, produced by recombinant DNA, that fuses the TNF receptor to the constant end of the immunoglobulin G1 antibody. Etanercept acts as a TNF- α inhibitor, where TNF- α is considered to be the key regulator of the inflammatory/immune response in many organ systems. We used the amount of etanercept as a parameter in a series of computational experiments that will be discussed here.
Before going to the numerical results involving etanercept, we provide our motivation for focusing on TNF- α and further insight into its leading role in AD pathophysiology. First, we recall that three distinctive neuropathological features of AD are: (a) extracellular deposits of A β peptides assembled in plaques, (b) intraneuronal accumulation of hyperphosphorylated tau proteins forming tangles, and (c) chronic inflammation [40]. While (a) and (b) we addressed earlier, here, we note that as far as (c) is concerned, the pro-inflammatory cytokine TNF- α plays a critical role. Moreover, with existing evidence, indicating that TNF- α signalling frequently makes pathologies related to (a) and (b) worse, a growing interest is seen in modulating this signalling and developing anti-TNF- α AD therapies, allowing improved cognitive performance. Compared to other approaches in developing AD treatments [41], TNF- α inhibitors have been consistently rated favourably. While the full range of pathogenetic mechanisms underlying neuronal death and dysfunction in AD remain unclear, most recent analyses convincingly imply that TNF-mediated neuroinflammation is linked to AD neuronal necroptosis [42]. Furthermore, given the pathophysiological importance of the entire TNF-TNFR1/2 system, more and more attention is currently paid to its other components as well, in particular to tumour necrosis factor receptor 2 (TNFR2) of the cytokines, which promotes neuronal survival downstream. While both TNFR1 and TNFR2 can induce pro-inflammatory activities, it is TNFR2 that can also elicit strong anti-inflammatory activities and has protective effects. Recent studies (e.g., [43]) indicate that the TNF pathway can contribute to resilience in AD. The latter concept is important in understanding heterogeneity in cognitive and behavioural phenotypes of AD, which requires involvement not only of A β and tau proteins, but other molecular factors as well. This leads, among other things, to the investigation of genetic variants of the TNFR2 pathway as a marker of resilience and the TNFR2 pathway itself as a target for developing new AD therapies [43].
As we already mentioned earlier, debates over AD drugs continue today, with the first drug able to remove amyloid approved only in 2021 (it is also the first new AD drug approved since 2003). The controversy around this new drug, aducanumab, is effectively centred on AD biomarkers and whether the extent of amyloid plaques can be considered as one of them because some scientists believe that they are more like a side-effect of the disease process. In the meantime, this controversy has generated a burst of new research activities and the development of another drug, known as donanemab, which is currently in late-stage clinical trials. Considered to be an important advance in amyloid pathology, it is expected to be able to treat early symptoms of AD. In the meantime, scientists are in agreement that new treatments, drugs, and therapies are urgently needed [44], and mathematical modelling and computational experiments will be playing an increasingly important role in these new developments.
In what follows, we account for the fact that many clinical trials of drugs aimed at preventing or clearing the A β and tau protein pathology have failed to demonstrate efficacy and that one of the possible treatments could be based on TNF- α inhibitors (suggested also in [18]). For the treatment, we first ran the model for what corresponds to 300 days in order to ensure that AD has been diagnosed, and then, we applied continuous treatment by the drug from Day 300 until the end of 10 years. In this case, we can replace Equation (19) with
d T α j d t = D T α k = 1 V L j k l T α k + λ T α M 1 M 1 j + λ T α M ^ 1 M ^ 1 j d T α T α j f T α j ,
where f is proportional to the amount of etanercept. We simulated this equation with the full network model for the brain connectome and plotted the result in Figure 3. For this set of computations, we took f = 10 d T α along with λ A A β o = 1.793 and λ A T α = 1.4 . After applying the drug, we observed reduced neuronal damage in the brain (see the middle-top sub-figure in Figure 3).
The drug aducanumab is considered to be one of the most effective in clearing A β . In this case, we replaced Equation (6) with
d A β j o d t = A β j i | d N j d t | + λ N N j N 0 + λ A A j A 0 ( d A β o M ^ ( M ^ 1 j + θ M ^ 2 j ) + d A β o M ( M 1 j + θ M 2 j ) ( 1 + g ) ) A β j o A β j o + K ¯ A β o ,
where g is proportional to the amount of the dosing level of the drug aducanumab. We simulated the entire network model (5)–(22) with (24) with g = 10 , λ A A β o = 1.793 , and λ A T α = 1.54 . Figure 4 depicts the effect of the drug in A β aggregation in the advancement of time. It has a pronounced effect only on the extracellular A β concentrations, not on neuronal death. However, the TNF- α inhibitors have a strong effect of reducing neuronal death. These results agree with those obtained in [18].

4. Discussion and Future Directions

There are several recently developed models, dealing with astrocytes, that consider averaged characteristics such as the collective exosomal release rate in astrocytes. Such models have an advantage of their generalisations to account for temperature effects, which is an important consideration, given the recent discovery of an intrinsic connection between the temperature dependence of exosome release and A β neurotoxicity [5]. Among other things, such models can describe the synapse and astrocyte couplings and allow replicating typical calcium oscillations in astrocytes under the influence of A β . Therefore, it would be instructive to extend the network model proposed here to account for thermal effects.
Tau proteins play a more prominent role than the amyloid hypothesis suggests. The τ Ps are usually considered as secondary agents in the disease even though: (i) other τ P -related diseases (tauopathies), such as frontotemporal lobar degeneration, are mostly dominated by tau spreading; (ii) brain atrophy in AD is directly correlated with large concentrations of NFT; (iii) the τ P distribution determines disease staging, and lowering τ P levels prevent neuronal loss; (iv) τ P reduces neural activity and is the main factor associated with cognitive decline. This motivates another possible extension of the developed model by combining the tau protein dynamics more precisely [19,45], rather than considering only a linear contribution of the tau protein. In addition, the dynamics of the variables in different regions in the brain connectome would give a better understanding of the disease progression [45]. Following this recent study, we note that although we chose here uniform parameter values all over the brain connectome, this can be extended to different parameter values in respective regions according to the clinical data.
Regarding the route connected with TNF inhibitors, in addition to the possible extensions already mentioned in the previous section, we will also mention that one of the existing difficulties lies with the fact that classical biologic TNF- α inhibitor macromolecules cannot cross the blood–brain barrier [46,47]. This requires the development of blood–brain-barrier-penetrating TNF- α inhibitors, and from a modelling point of view, further extensions of the models developed here may be needed to qualitatively estimate this factor.

5. Conclusions

We constructed a network model to study neurodegenerative disorders in the brain connectome, focusing on Alzheimer’s disease. The developed model can capture the concentrations of the variables in different regions of the brain connectome, which could not be identified by earlier-developed simple PDE-based models. All three distinctive neuropathological features of AD, including amyloid beta and tau proteins, as well as neuroinflammation were considered in the network model for brain connectome data assimilation. Special attention was given to the role of cytokines and astrocytes, as well as to the influence of anti- A β and TNF- α inhibitor drugs in AD pathophysiology. We showed that etanercept has good efficacy in most of the aspects, including neuronal death, while aducanumab has a good efficacy only in reducing the aggregation of extracellular amyloid beta. Among other applications, one may choose the developed methodology to address the diffusion and chemoattraction challenges by evaluating the corresponding term’s contributions in the network model. Finally, potentially promising pathways for developing new AD therapies were also discussed.

Author Contributions

Conceptualisation, S.P. and R.M.; initial formal analysis and visualisation, S.P.; writing, S.P. and R.M.; initial draft preparation, S.P.; supervision of the study and review, R.M. All authors have read and agreed to the published version of the manuscript.

Funding

This research was funded by the Natural Sciences and Engineering Research Council (NSERC) of Canada and Canada Research Chairs (CRC) Program.

Acknowledgments

The authors are grateful to the Natural Sciences and Engineering Research Council (NSERC) of Canada and Canada Research Chairs (CRC) Program, and R.M. also acknowledges the support of the BERC 2018-2021 program, the Spanish Ministry of Science, Innovation, and Universities through the Agencia Estatal de Investigacion (AEI) BCAM Severo Ochoa excellence accreditation SEV-2017-0718, and the Basque Government fund AI in BCAM EXP. 2019/00432.

Conflicts of Interest

The authors declare no conflict of interest.

References

  1. Nichols, E.; Steinmetz, J.D.; Vollset, S.E.; Fukutaki, K.; Chalek, J.; Abd-Allah, F.; Abdoli, A.; Abualhasan, A.; Abu-Gharbieh, E.; Akram, T.T.; et al. Estimation of the global prevalence of dementia in 2019 and forecasted prevalence in 2050: An analysis for the Global Burden of Disease Study 2019. Lancet 2022, 7, e105–e125. [Google Scholar] [CrossRef]
  2. Torres-Acosta, N.; O’Keefe, J.H.; O’Keefe, E.L.; Isaacson, R.; Small, G. Therapeutic potential of TNF-α inhibition for Alzheimer’s disease prevention. J. Alzheimer’s Dis. 2020, 78, 619–626. [Google Scholar] [CrossRef] [PubMed]
  3. Mroczko, B.; Groblewska, M.; Litman-Zawadzka, A. The Role of Protein Misfolding and Tau Oligomers (TauOs) in Alzheimer’s Disease (AD). Int. J. Mol. Sci. 2019, 20, 4661. [Google Scholar] [CrossRef] [Green Version]
  4. Frost, G.R.; Li, Y.M. The role of astrocytes in amyloid production and Alzheimer’s disease. Open Biol. 2017, 7, 170228. [Google Scholar] [CrossRef] [PubMed] [Green Version]
  5. Shaheen, H.; Singh, S.; Melnik, R. A neuron-glial model of exosomal release in the onset and progression of Alzheimer’s disease. Front. Comput. Neurosci. 2021, 15, 653097. [Google Scholar] [CrossRef]
  6. Lowe, R.; Shirley, N.; Bleackley, M.; Dolan, S.; Shafee, T. Transcriptomics technologies. PLoS Comput. Biol. 2017, 13, e1005457. [Google Scholar] [CrossRef] [PubMed] [Green Version]
  7. Smit, T.; Deshayes, N.A.; Borchelt, D.R.; Kamphuis, W.; Middeldorp, J.; Hol, E.M. Reactive astrocytes as treatment targets in Alzheimer’s disease—Systematic review of studies using the APPswePS1dE9 mouse model. Glia 2021, 69, 1852–1881. [Google Scholar] [CrossRef]
  8. Preman, P.; Alfonso-Triguero, M.; Alberdi, E.; Verkhratsky, A.; Arranz, A.M. Astrocytes in Alzheimer’s disease: Pathological significance and molecular pathways. Cells 2021, 10, 540. [Google Scholar] [CrossRef]
  9. Raj, A.; Tora, V.; Gao, X.; Cho, H.; Choi, J.Y.; Ryu, Y.H.; Lyoo, C.H.; Franchi, B. Combined Model of Aggregation and Network Diffusion Recapitulates Alzheimer’s Regional Tau-Positron Emission Tomography. Brain Connect. 2021, 11, 624–638. [Google Scholar] [CrossRef]
  10. Bertsch, M.; Franchi, B.; Raj, A.; Tesi, M.C. Macroscopic modelling of Alzheimer’s disease: Difficulties and challenges. Brain Multiphysics 2021, 2, 100040. [Google Scholar] [CrossRef]
  11. Planas-Fontanez, T.M.; Sainato, D.M.; Sharma, I.; Dreyfus, C.F. Roles of astrocytes in response to aging, Alzheimer’s disease and multiple sclerosis. Brain Res. 2021, 1764, 147464. [Google Scholar] [CrossRef]
  12. Verkhratsky, A.; Olabarria, M.; Noristani, H.N.; Yeh, C.Y.; Rodriguez, J.J. Astrocytes in Alzheimer’s disease. Neurotherapeutics 2010, 7, 399–412. [Google Scholar] [CrossRef] [PubMed] [Green Version]
  13. Liddelow, S.A.; Guttenplan, K.A.; Clarke, L.E.; Bennett, F.C.; Bohlen, C.J.; Schirmer, L.; Bennett, M.L.; Münch, A.E.; Chung, W.S.; Peterson, T.C.; et al. Neurotoxic reactive astrocytes are induced by activated microglia. Nature 2017, 541, 481–487. [Google Scholar] [CrossRef] [PubMed]
  14. Birch, A.M. The contribution of astrocytes to Alzheimer’s disease. Biochem. Soc. Trans. 2014, 42, 1316–1320. [Google Scholar] [CrossRef] [PubMed]
  15. Deczkowska, A.; Keren-Shaul, H.; Weiner, A.; Colonna, M.; Schwartz, M.; Amit, I. Disease-Associated Microglia: A Universal Immune Sensor of Neurodegeneration. Cell 2018, 173, 1073–1081. [Google Scholar] [CrossRef] [Green Version]
  16. Habib, N.; Centini, G.; Lazzeri, L.; Amoruso, N.; El Khoury, L.; Zupi, E.; Afors, K. Bowel Endometriosis: Current Perspectives on Diagnosis and Treatment. Int. J. Women’s Health 2020, 12, 35–47. [Google Scholar] [CrossRef] [PubMed] [Green Version]
  17. Liddelow, S.A.; Barres, B.A. Reactive Astrocytes: Production, Function, and Therapeutic Potential. Immunity 2017, 46, 957–967. [Google Scholar] [CrossRef] [Green Version]
  18. Hao, W.; Friedman, A. Mathematical model on Alzheimer’s disease. BMC Syst. Biol. 2016, 10, 108. [Google Scholar] [CrossRef] [Green Version]
  19. Thompson, T.B.; Chaggar, P.; Kuhl, E.; Goriely, A. Protein-protein interactions in neurodegenerative diseases: A conspiracy theory. PLoS Comput. Biol. 2020, 16, e1008267. [Google Scholar] [CrossRef]
  20. Pal, S.; Melnik, R. Pathology dynamics in healthy-toxic protein interaction and the multiscale analysis of neurodegenerative diseases. In Computational Science—ICCS 2021; Paszynski, M., Kranzlmüller, D., Krzhizhanovskaya, V.V., Dongarra, J.J., Sloot, P.M., Eds.; Lecture Notes in Computer Science; Springer: Cham, Switzerland, 2021; Volume 12746, pp. 528–540. [Google Scholar]
  21. Roskoski, R. Michaelis-Menten Kinetics. In Reference Module in Biomedical Sciences; Elsevier: Amsterdam, The Netherlands, 2015. [Google Scholar]
  22. Seeman, P.; Seeman, N. Alzheimer’s disease: Beta-amyloid plaque formation in human brain. Synapse 2011, 65, 1289–1297. [Google Scholar] [CrossRef]
  23. Zhao, J.; O’Connor, T.; Vassar, R. The contribution of activated astrocytes to production: Implications for Alzheimer’s disease pathogenesis. J. Neuroinflamm. 2011, 8, 150. [Google Scholar] [CrossRef] [Green Version]
  24. Liu, Z.; Li, P.; Wu, J.; Wang, Y.; Li, P.; Hou, X.; Zhang, Q.; Wei, N.; Zhao, Z.; Liang, H.; et al. The Cascade of Oxidative Stress and Tau Protein Autophagic Dysfunction in Alzheimer’s Disease. Alzheimer’s Dis. Challenges Future 2015, 2, 48347. [Google Scholar]
  25. Bloom, G.S. Amyloid-beta and tau: The trigger and bullet in Alzheimer disease pathogenesis. JAMA Neurol. 2014, 71, 505–508. [Google Scholar] [CrossRef] [PubMed] [Green Version]
  26. Mondragon-Rodriguez, S.; Perry, G.; Zhu, X.; Boehm, J. Amyloid Beta and tau proteins as therapeutic targets for Alzheimer’s disease treatment: Rethinking the current strategy. Int. J. Alzheimers Dis. 2012, 2012, 630182. [Google Scholar] [CrossRef] [PubMed] [Green Version]
  27. Wray, S.; Noble, W. Linking amyloid and tau pathology in Alzheimer’s disease: The role of membrane cholesterol in Abeta-mediated tau toxicity. J. Neurosci. 2009, 29, 9665–9667. [Google Scholar] [CrossRef]
  28. Garwood, C.J.; Pooler, A.M.; Atherton, J.; Hanger, D.P.; Noble, W. Astrocytes are important mediators of Abeta-induced neurotoxicity and tau phosphorylation in primary culture. Cell Death Dis. 2011, 2, 167. [Google Scholar] [CrossRef] [Green Version]
  29. Kevrekidis, P.G.; Thompson, T.B.; Goriely, A. Anisotropic diffusion and traveling waves of toxic proteins in neurodegenerative diseases. Phys. Lett. A 2020, 384, 12935. [Google Scholar] [CrossRef]
  30. Bertsch, M.; Franchi, B.; Meschini, V.; Tesi, M.C.; Tosin, A. A sensitivity analysis of a mathematical model for the synergistic interplay of amyloid beta and tau on the dynamics of Alzheimer’s disease. Brain Multiphys. 2021, 2, 1–13. [Google Scholar] [CrossRef]
  31. Waters, J. The concentration of soluble extracellular amyloid beta protein in acute brain slices from CRND8 mice. PLoS ONE 2010, 5, e15709. [Google Scholar] [CrossRef]
  32. Gao, H.M.; Zhou, H.; Zhang, F.; Wilson, B.C.; Kam, W.; Hong, J.S. HMGB1 acts on microglia Mac1 to mediate chronic neuroinflammation that drives progressive neurodegeneration. J. Neurosci. 2011, 31, 1081–1092. [Google Scholar] [CrossRef]
  33. Zou, J.Y.; Crews, F.T. Release of neuronal HMGB1 by ethanol through decreased HDAC activity activates brain neuroimmune signalling. PLoS ONE 2014, 9, e87915. [Google Scholar]
  34. Savchenko, V.L.; McKanna, J.A.; Nikonenko, I.R.; Skibo, G.G. Microglia and astrocytes in the adult rat brain: Comparative immunocytochemical analysis demonstrates the efficacy of lipocortin 1 immunoreactivity. Neuroscience 2000, 96, 195–203. [Google Scholar] [CrossRef]
  35. Hao, W.; Crouser, E.D.; Friedman, A. Mathematical model of sarcoidosis. Proc. Natl. Acad. Sci. USA 2014, 111, 16065–16070. [Google Scholar] [CrossRef] [PubMed] [Green Version]
  36. Hohsfield, L.A.; Humpel, C. Migration of blood cells to beta-amyloid plaques in Alzheimer’s disease. Exp. Gerontol. 2015, 65, 8–15. [Google Scholar] [CrossRef] [PubMed] [Green Version]
  37. Theriault, P.; ElAli, A.; Rivest, S. The dynamics of monocytes and microglia in Alzheimer’s disease. Alzheimers Res. Ther. 2015, 7, 41. [Google Scholar] [CrossRef] [PubMed] [Green Version]
  38. Szalkai, B.; Kerepesi, C.; Varga, B.; Grolmusz, V. High-Resolution Directed Human Connectomes and the Consensus Connectome Dynamics. PLoS ONE 2019, 14, e0215473. [Google Scholar] [CrossRef]
  39. Hao, W.; Friedman, A. The LDL-HDL profile determines the risk of atherosclerosis: A mathematical model. PLoS ONE 2014, 9, e90497. [Google Scholar] [CrossRef] [Green Version]
  40. Decourt, B.; Lahiri, D.K.; Sabbagh, M.N. Targeting tumour necrosis factor alpha for Alzheimer’s disease. Curr. Alzheimer. Res. 2017, 14, 412–425. [Google Scholar] [CrossRef] [Green Version]
  41. Kern, D.M.; Lovestone, S.; Cepeda, M.S. Treatment with TNF-α inhibitors versus methotrexate and the association with dementia and Alzheimer’s disease. Alzheimer’s Dement. 2021, 7, e12163. [Google Scholar] [CrossRef]
  42. Jayaraman, A.; Htike, T.T.; James, R.; Picon, C.; Reynolds, R. TNF-mediated neuroinflammation is linked to neuronal necroptosis in Alzheimer’s disease hippocampus. Acta Neuropathol. Commun. 2021, 9, 159. [Google Scholar] [CrossRef]
  43. Pillai, J.A.; Bebek, G.; Khrestian, M.; Bena, J.; Bergmann, C.C.; Bush, W.S.; Leverenz, J.B.; Bekris, L.M. TNFRSF1B gene variants and related soluble TNFR2 levels impact resilience in Alzheimer’s disease. Front. Aging Neurosci. 2021, 13, 638922. [Google Scholar] [CrossRef]
  44. Cummings, J.; Lee, G.; Zhong, K.; Fonseca, J.; Taghva, K. Alzheimer’s disease drug development pipeline: 2021. Alzheimer’s Dement. 2021, 7, e12179. [Google Scholar] [CrossRef] [PubMed]
  45. Pal, S.; Melnik, R. Nonlocal models in the analysis of brain neurodegenerative protein dynamics with application to Alzheimer’s disease. arXiv 2021, arXiv:2112.11681. [Google Scholar]
  46. Chang, R.; Yee, K.L.; Sumbria, R.K. Tumour necrosis factor α inhibition for Alzheimer’s disease. J. Cent. Nerv. Syst. Dis. 2017, 9, 1–5. [Google Scholar] [CrossRef] [PubMed]
  47. Chang, R.; Knox, J.; Chang, J.; Derbedrossian, A.; Vasilevko, V.; Cribbs, D.; Boado, R.J.; Pardridge, W.M.; Sumbria, R.K. Blood–Brain Barrier Penetrating Biologic TNF-α Inhibitor for Alzheimer’s Disease. Mol. Pharm. 2017, 14, 2340–2349. [Google Scholar] [CrossRef] [PubMed]
Figure 1. Average concentration of the variables with respect to time.
Mca 27 00033 g001
Figure 2. Average solutions of the six variables associated with astrocytes and microglias. We take all the parameter values from Table 1 and Table 2. Blue curve: λ A A β o = 1.793 and λ A T α = 1.4 ; black curve: λ A A β o = 1.793 and λ A T α = 1.7 ; magenta curve: λ A A β o = 1.65 and λ A T α = 1.54 .
Mca 27 00033 g002
Figure 3. Average solutions of the six variables associated with astrocytes and microglias. We take all the parameter values from Table 1 and Table 2 with λ A A β o = 1.793 and λ A T α = 1.4 . Magenta and blue curve curves correspond to the absence and presence of TNF- α inhibitor, respectively.
Mca 27 00033 g003
Figure 4. Average solutions of the six variables associated with astrocytes and microglias. We take all the parameter values from Table 1 and Table 2 with λ A A β o = 1.793 and λ A T α = 1.54 . Magenta and blue curve curves correspond to the absence and presence of anti- A β drug, respectively.
Mca 27 00033 g004
Table 1. Parameter values.
ParameterValueParameterValueParameterValue
d A β i 9.51 d A β i 9.51 K M 1 0.03
d F i 2.77 × 10 3 d F o 2.77 × 10 4 K M 2 0.017
d τ 0.277 d N 1.9 × 10 4 K M ^ 1 0.04
d N F 3.4 × 10 4 d N T 1.7 × 10 4 K M ^ 2 0.007
d N d M 0.06 d N d M ^ 0.02 K F i 3.36 × 10 10
d A 1.2 × 10 3 d A o 0.951 K F o 2.58 × 10 11
d M 1 0.015 d M 2 0.015 K M 0.47
d M ^ 1 0.015 d M ^ 2 0.015 K I 10 2.5 × 10 6
d H 58.71 d I 10 16.64 K T β 2.5 × 10 7
d T α 55.45 d T β 333 K T α 4 × 10 5
d P 1.73 A 0 0.14 K M ^ 0.47
R 0 6 M 0 0.05 K A o 10 7
M G 0 0.47 N 0 0.14 K P 6 × 10 9
K ¯ A β o 7 × 10 3 K ¯ N d 10 3
Table 2. Parameter values.
ParameterValueParameterValueParameterValue
D A o 4.32 × 10 2 D H 8.11 × 10 2 D P 2 × 10 1
D T α 6.55 × 10 2 D T β 6.55 × 10 2 D I 10 6.04 × 10 2
λ β i 9.51 × 10 6 λ N 8 × 10 9 λ A 8 × 10 10
λ τ 0 8.1 × 10 11 λ τ 1.35 × 10 11 λ F 1.662 × 10 3
λ P A 6.6 × 10 8 λ P M 2 1.32 × 10 7 λ A o 5 × 10 2
λ H 3 × 10 5 λ M F 2 × 10 2 λ M A 2.3 × 10 3
λ M 1 T β 6 × 10 3 λ M ^ 1 t β 6 × 10 4 λ T β M 1.5 × 10 2
λ T β M ^ 1.5 × 10 2 λ T α M 1 3 × 10 2 λ T α M ^ 1 3 × 10 2
λ I 10 M 2 6.67 × 10 3 λ I 10 M ^ 2 6.67 × 10 3 θ 0.9
α 5 β 10 γ 1
Table 3. The variables of the model and their functions.
VariableFunctionVariableFunction
A β i Amyloid beta inside neurons A β o Amyloid beta outside neurons
τ hyperphosphorylated tau protein F i Neurofibrillary tangle inside neurons
F o Neurofibrillary tangle outside neuronsNLive neurons
AAstrocytes N d Dead neurons
A o Amyloid beta oligomerHHigh mobility group box 1
M 1 Proinflammatory microglias M 2 Anti-inflammatory microglias
M ^ 1 Peripheral proinflammatory macrophages M ^ 2 Peripheral anti-inflammatory macrophages
T α Tumour necrosis factor alpha T β Transforming growth factor beta
I 10 Interleukin 10PMonocyte chemoattractant protein-1
Publisher’s Note: MDPI stays neutral with regard to jurisdictional claims in published maps and institutional affiliations.

