
Predicting Rice Production in Central Thailand Using the WOFOST Model with ENSO Impact


Abstract
:1. Introduction
2. Materials and Methods
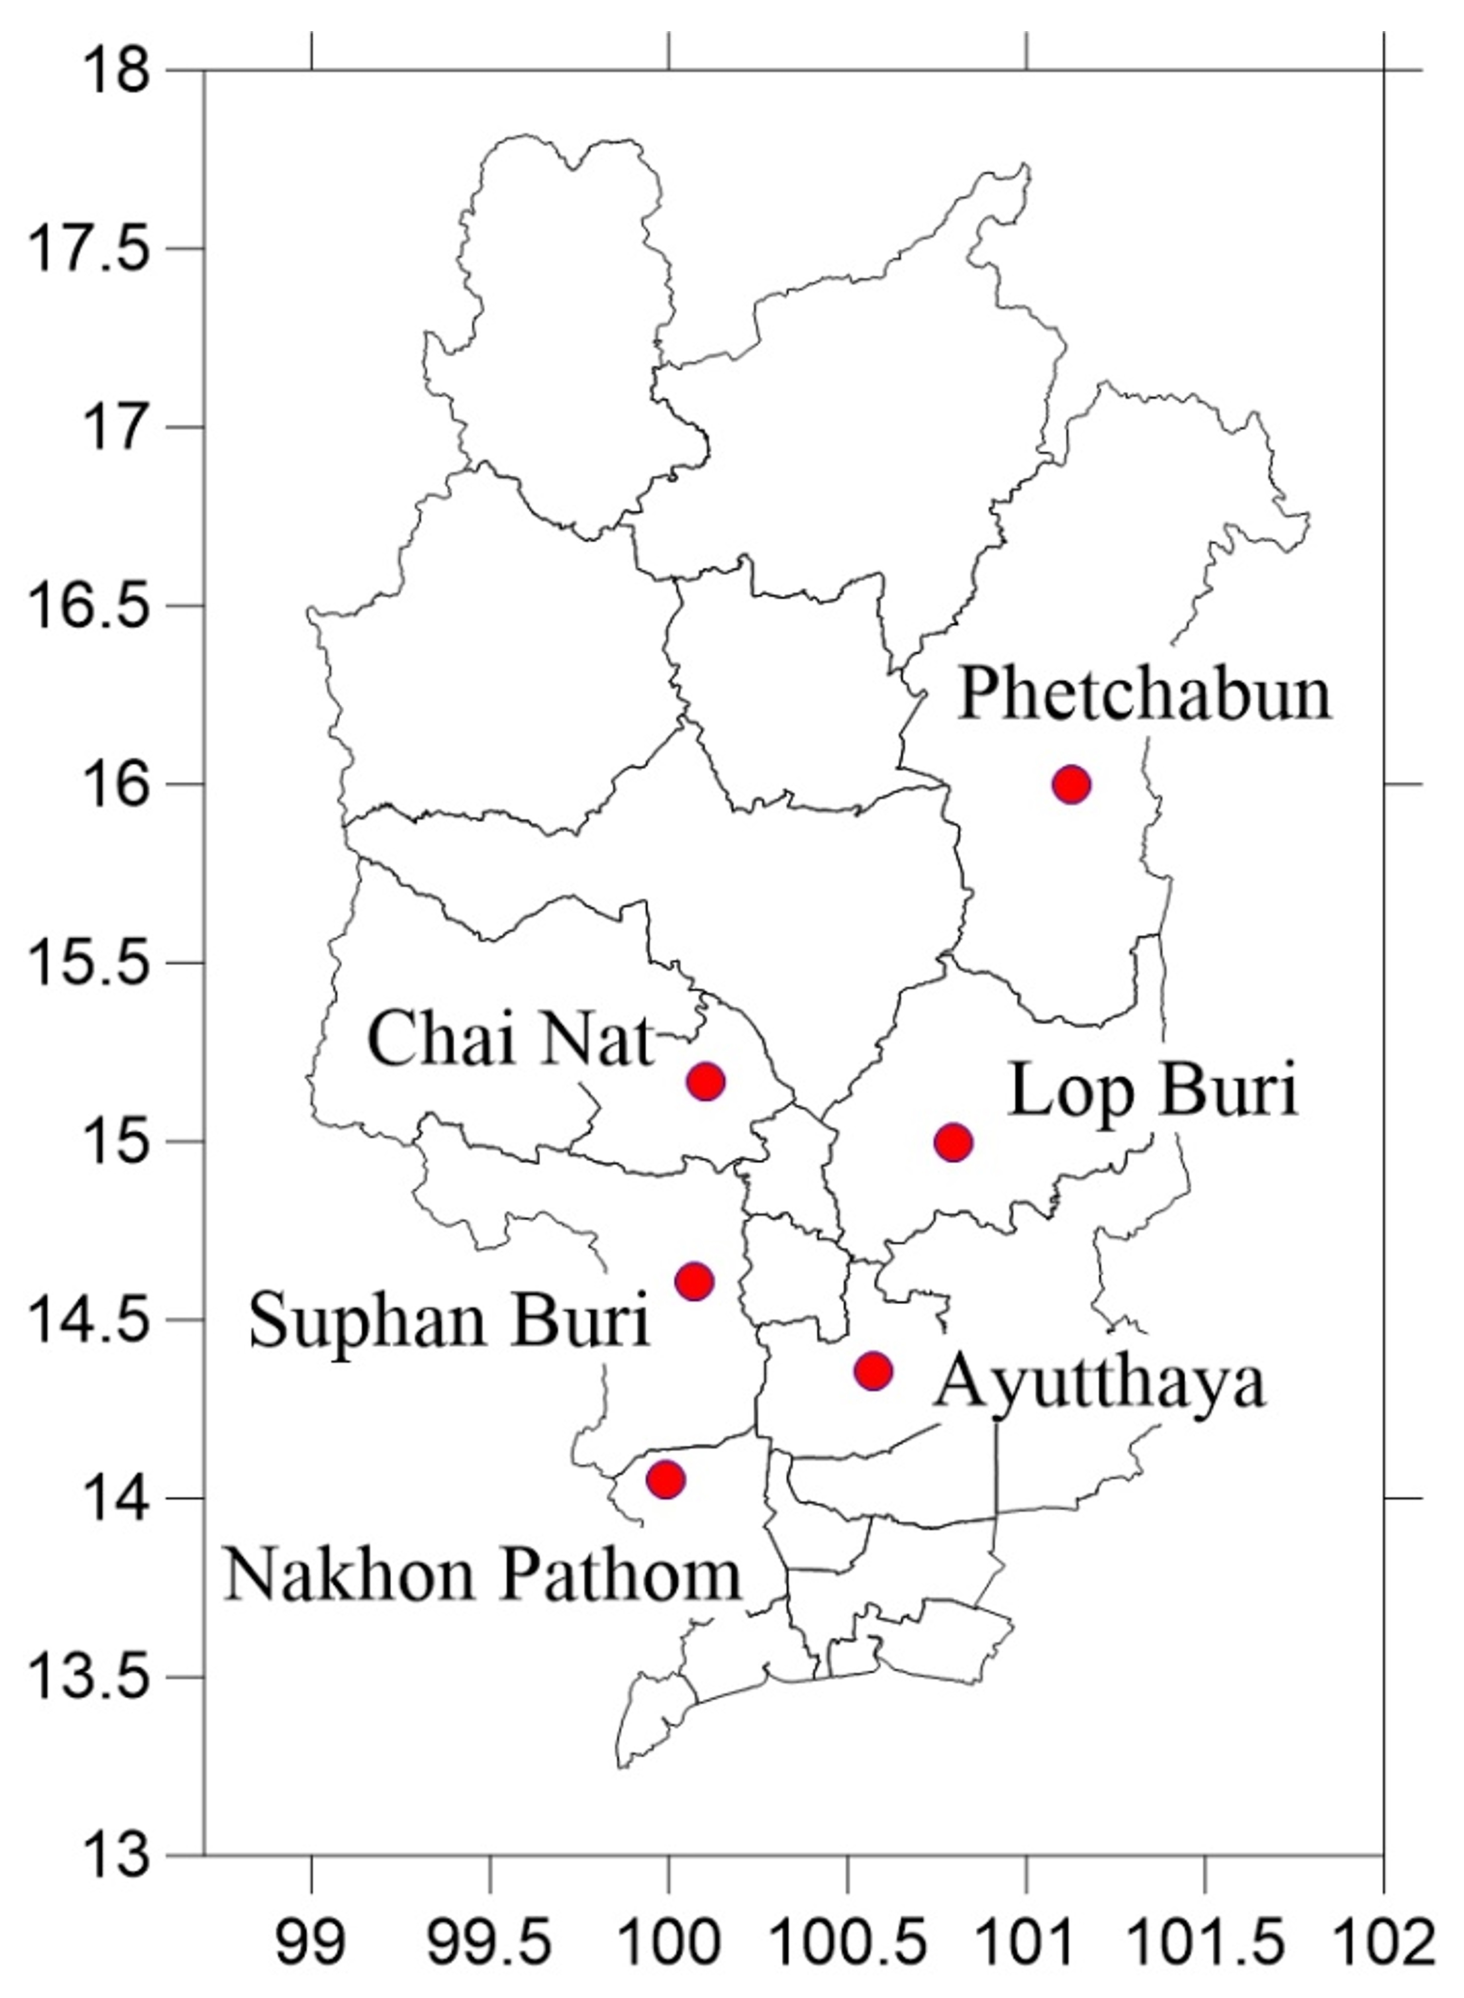
2.1. Study Area Description and Model Input Data
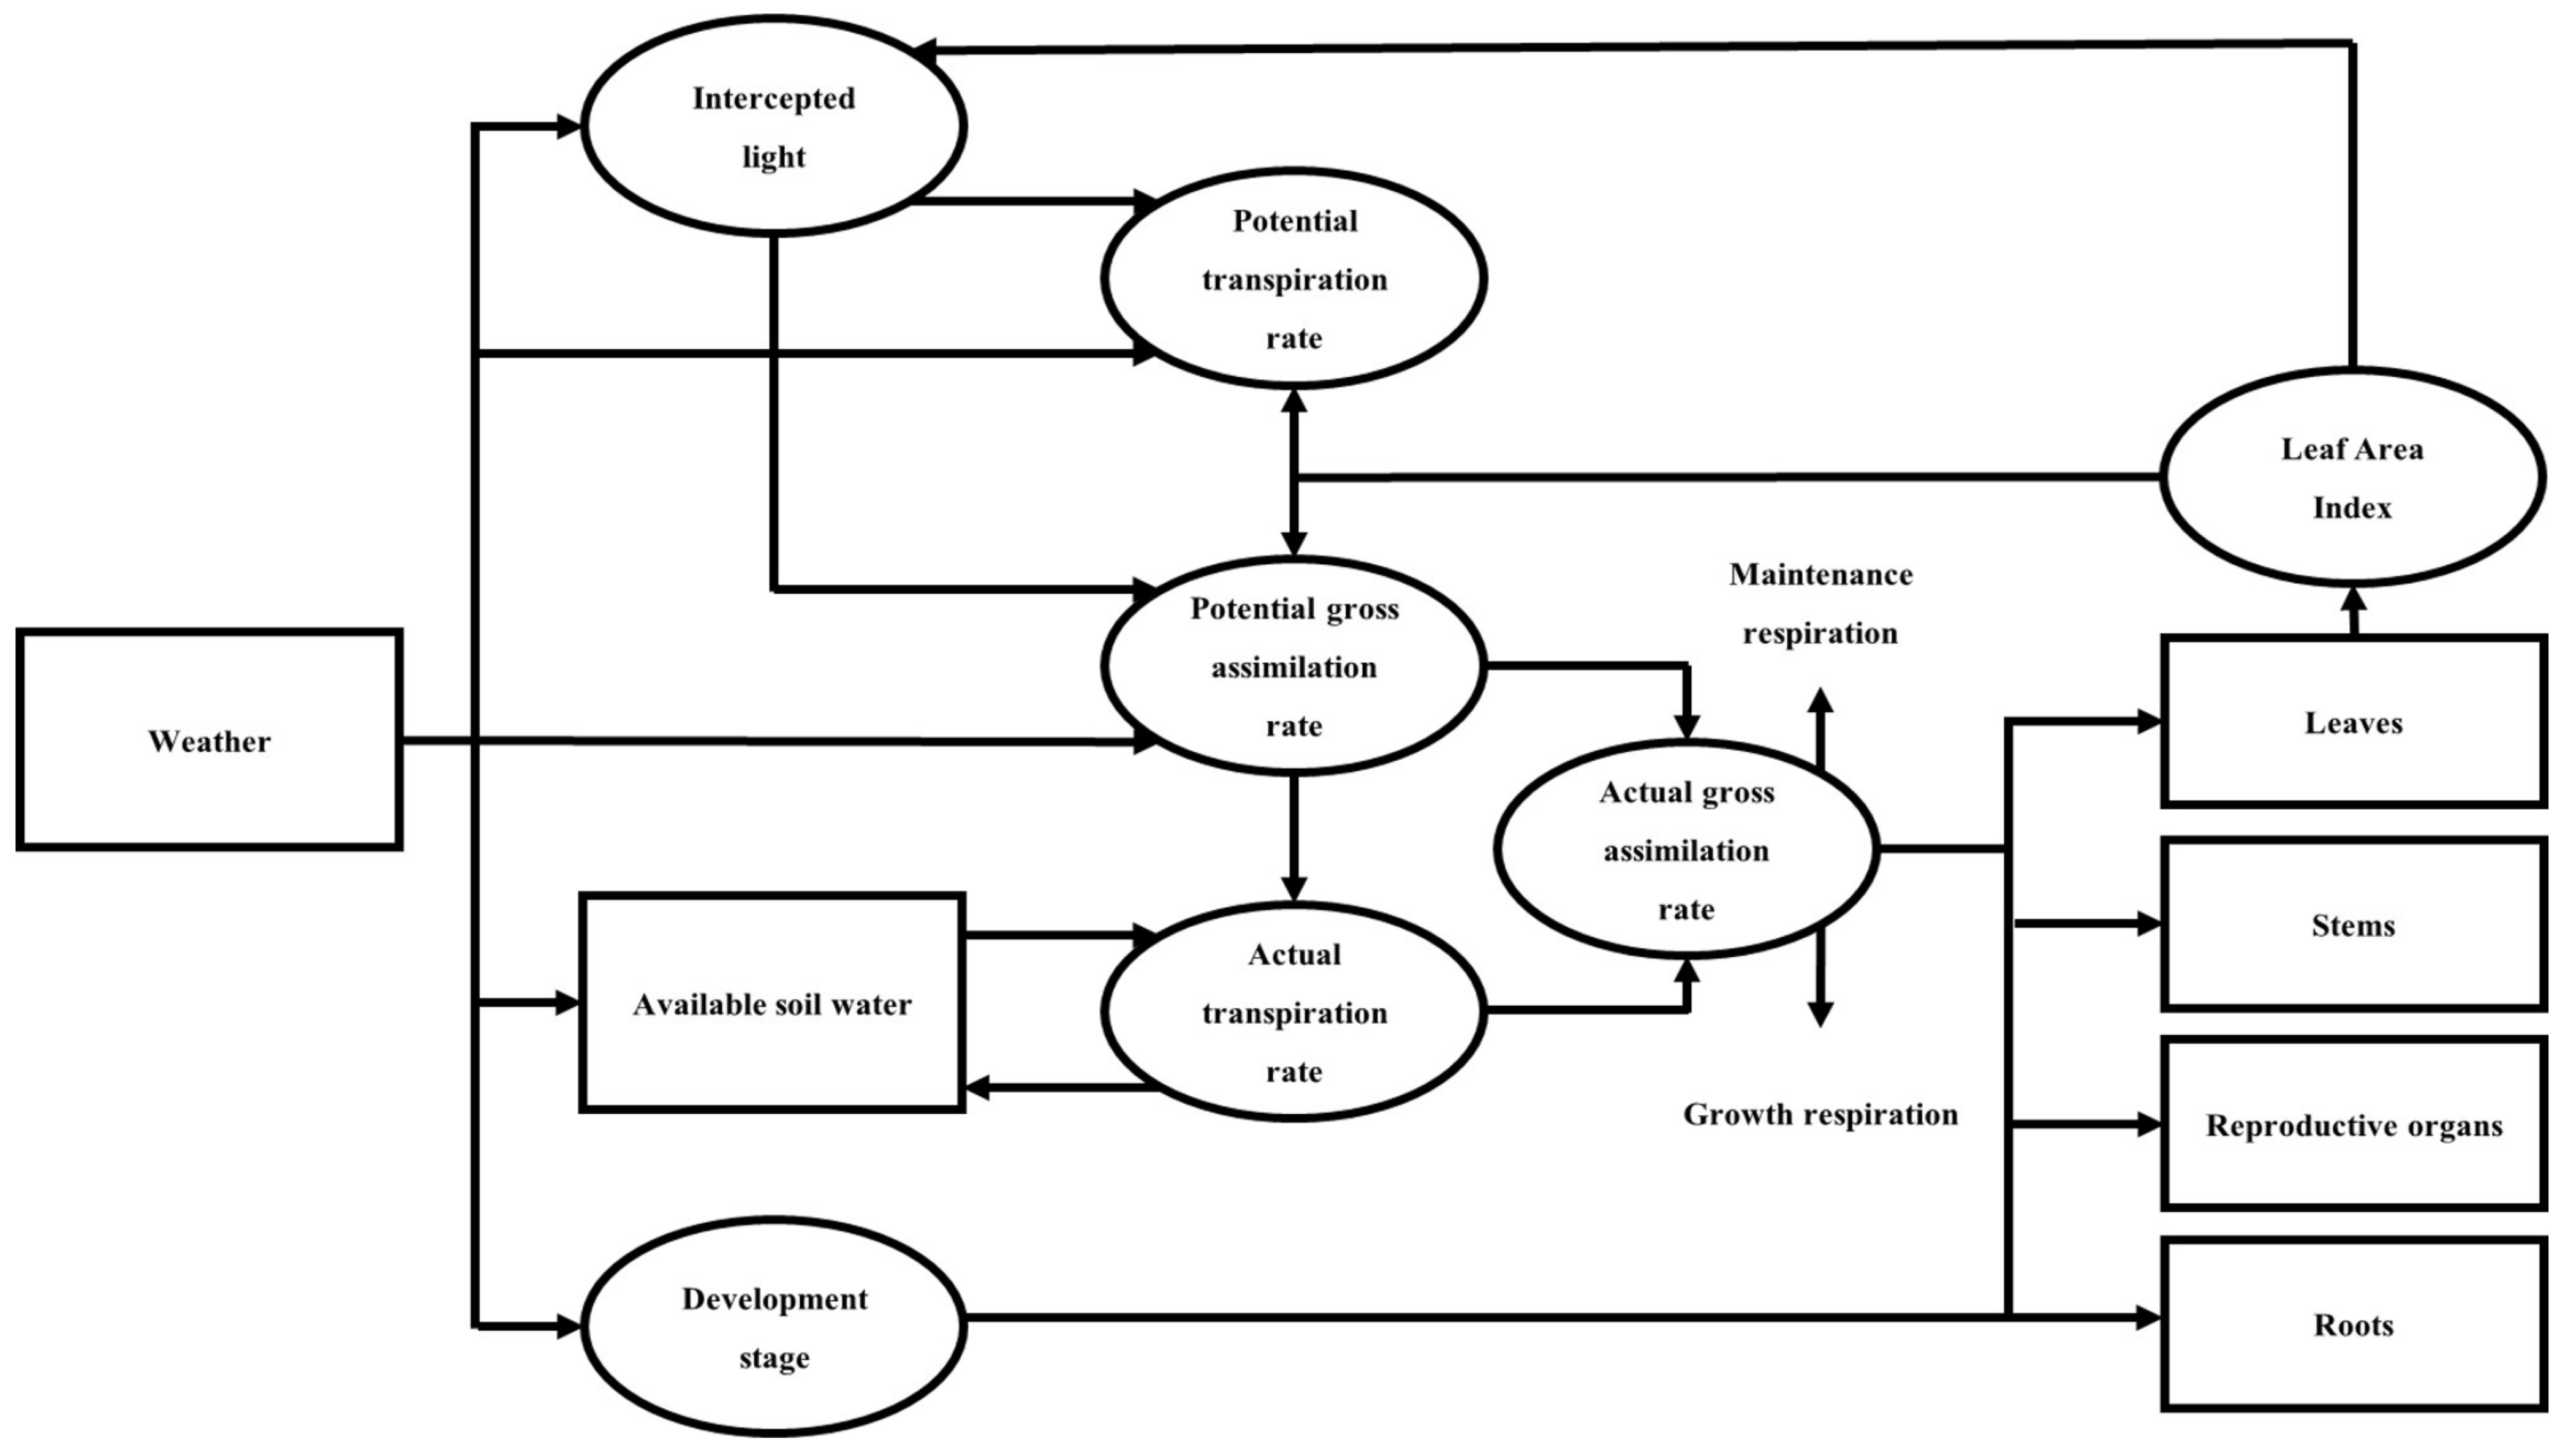
2.2. Crop Model Simulation
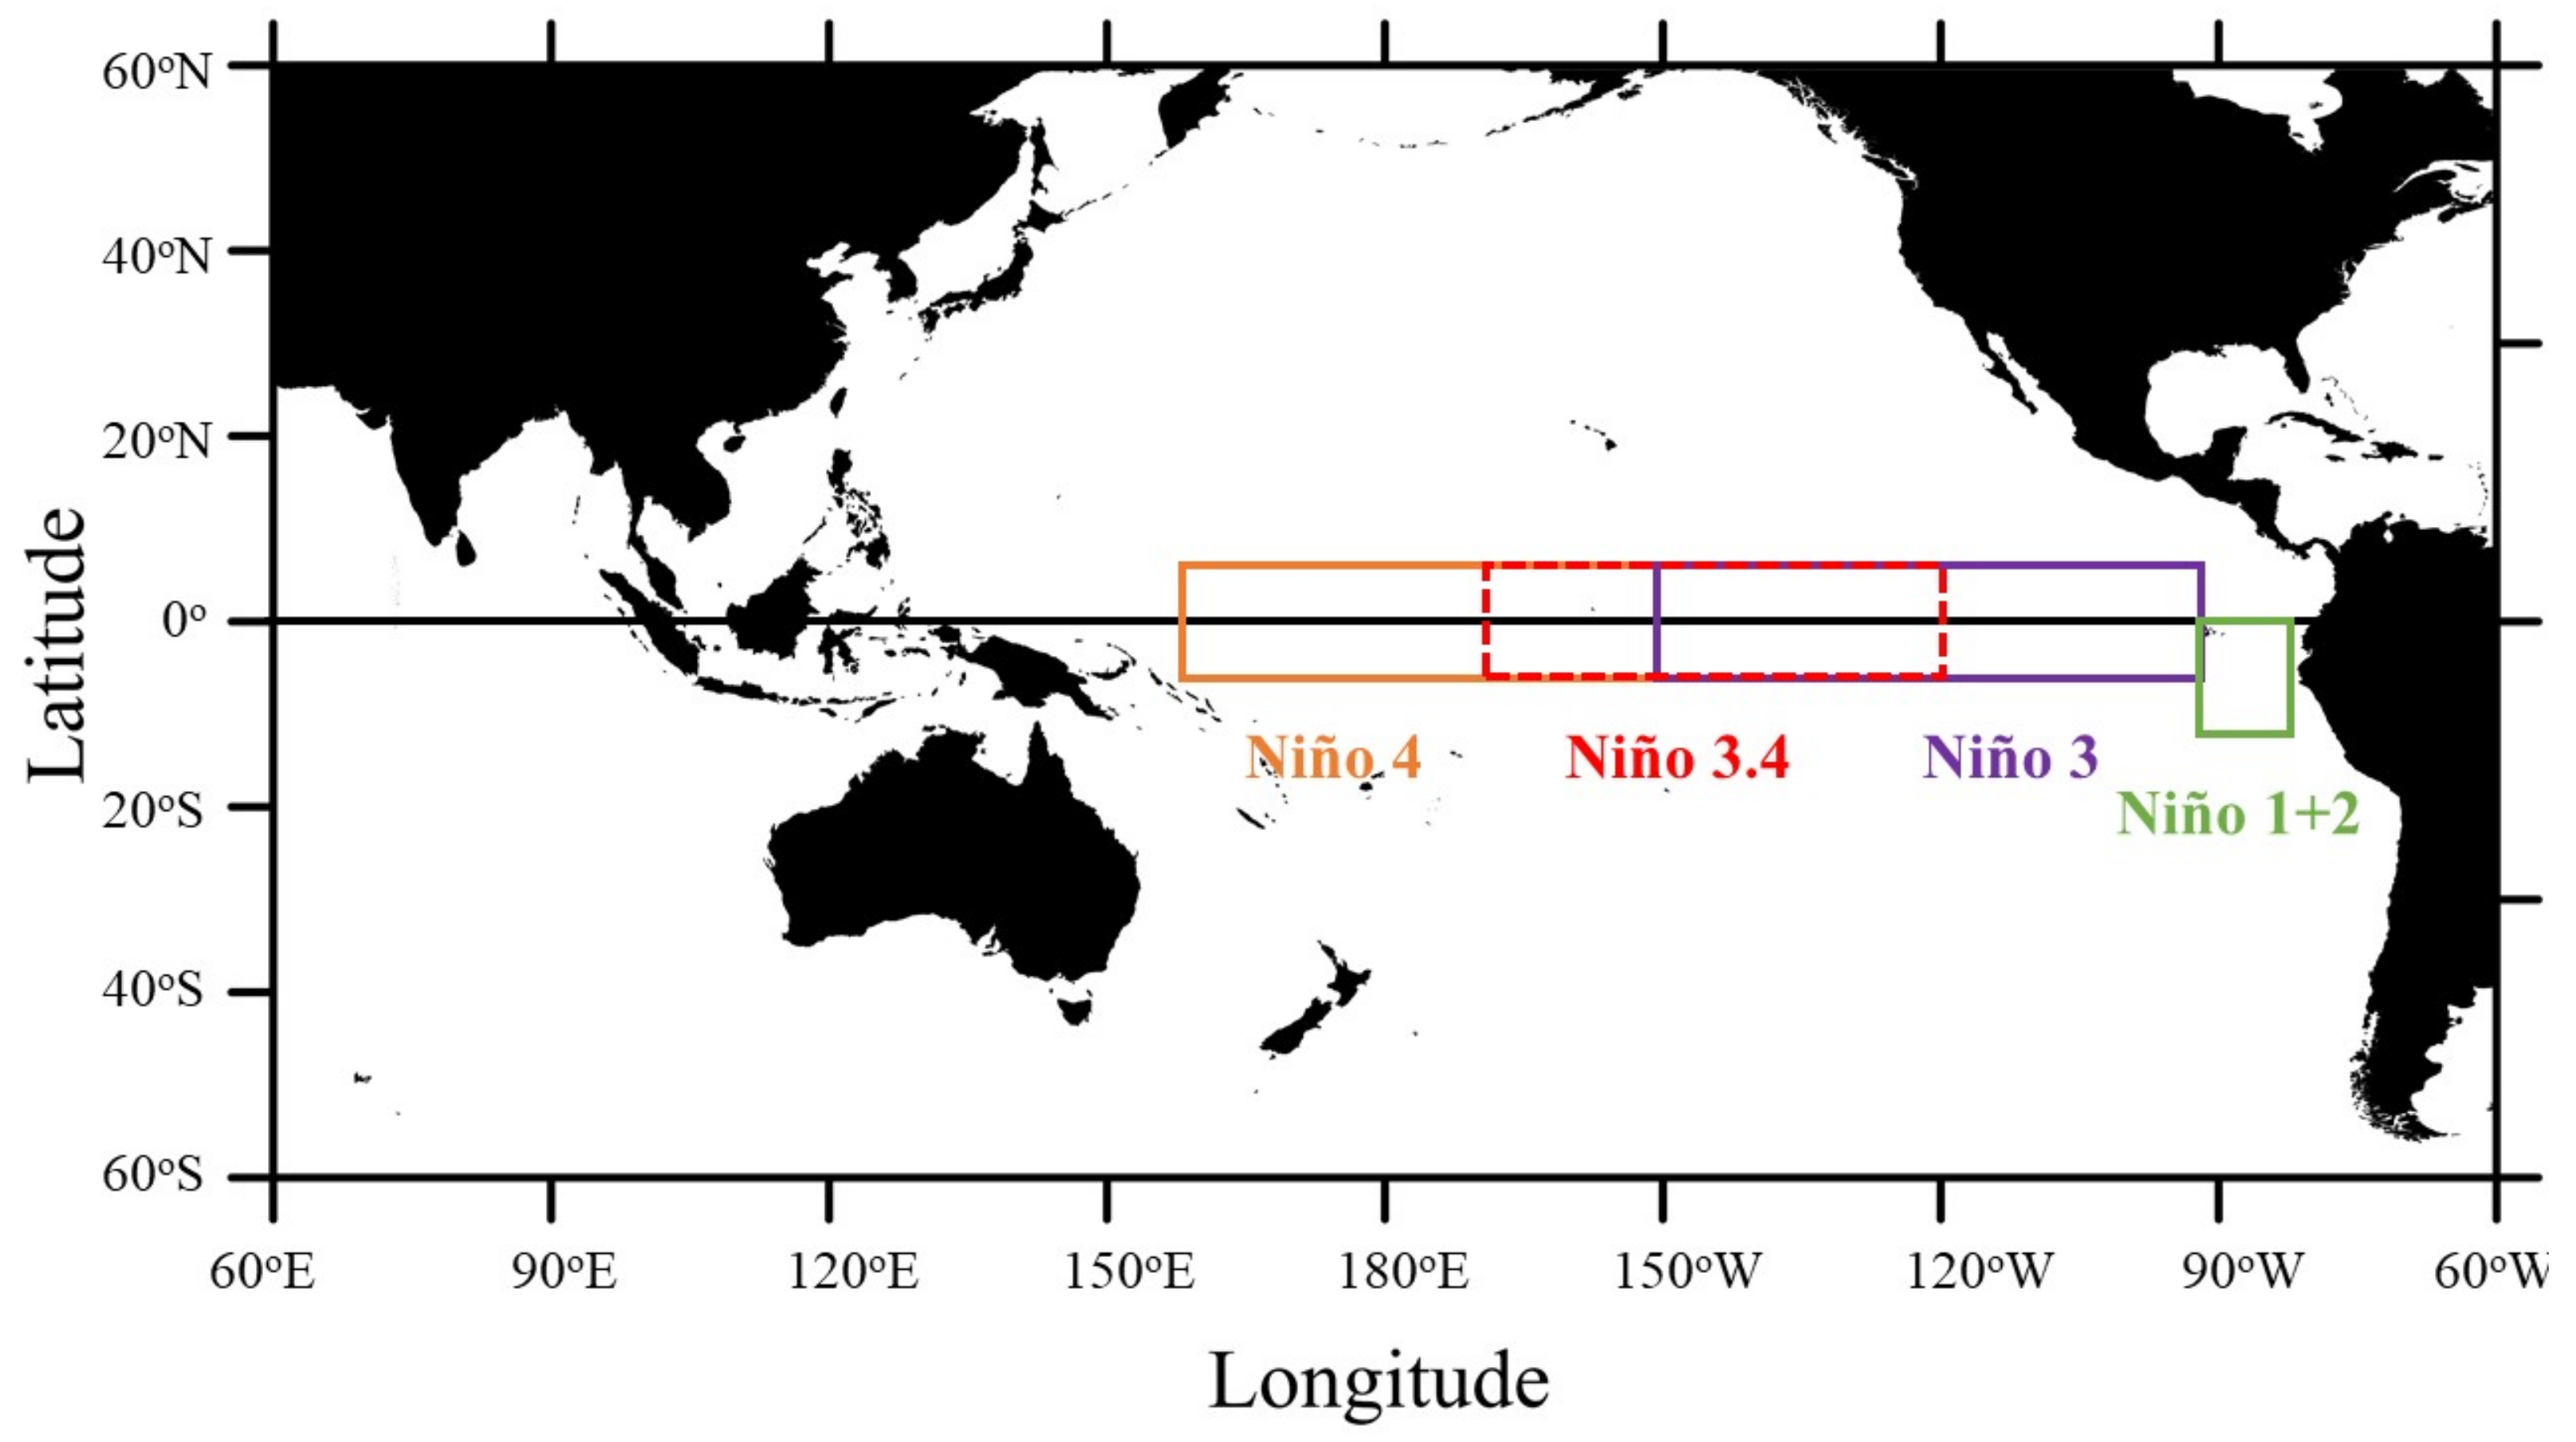
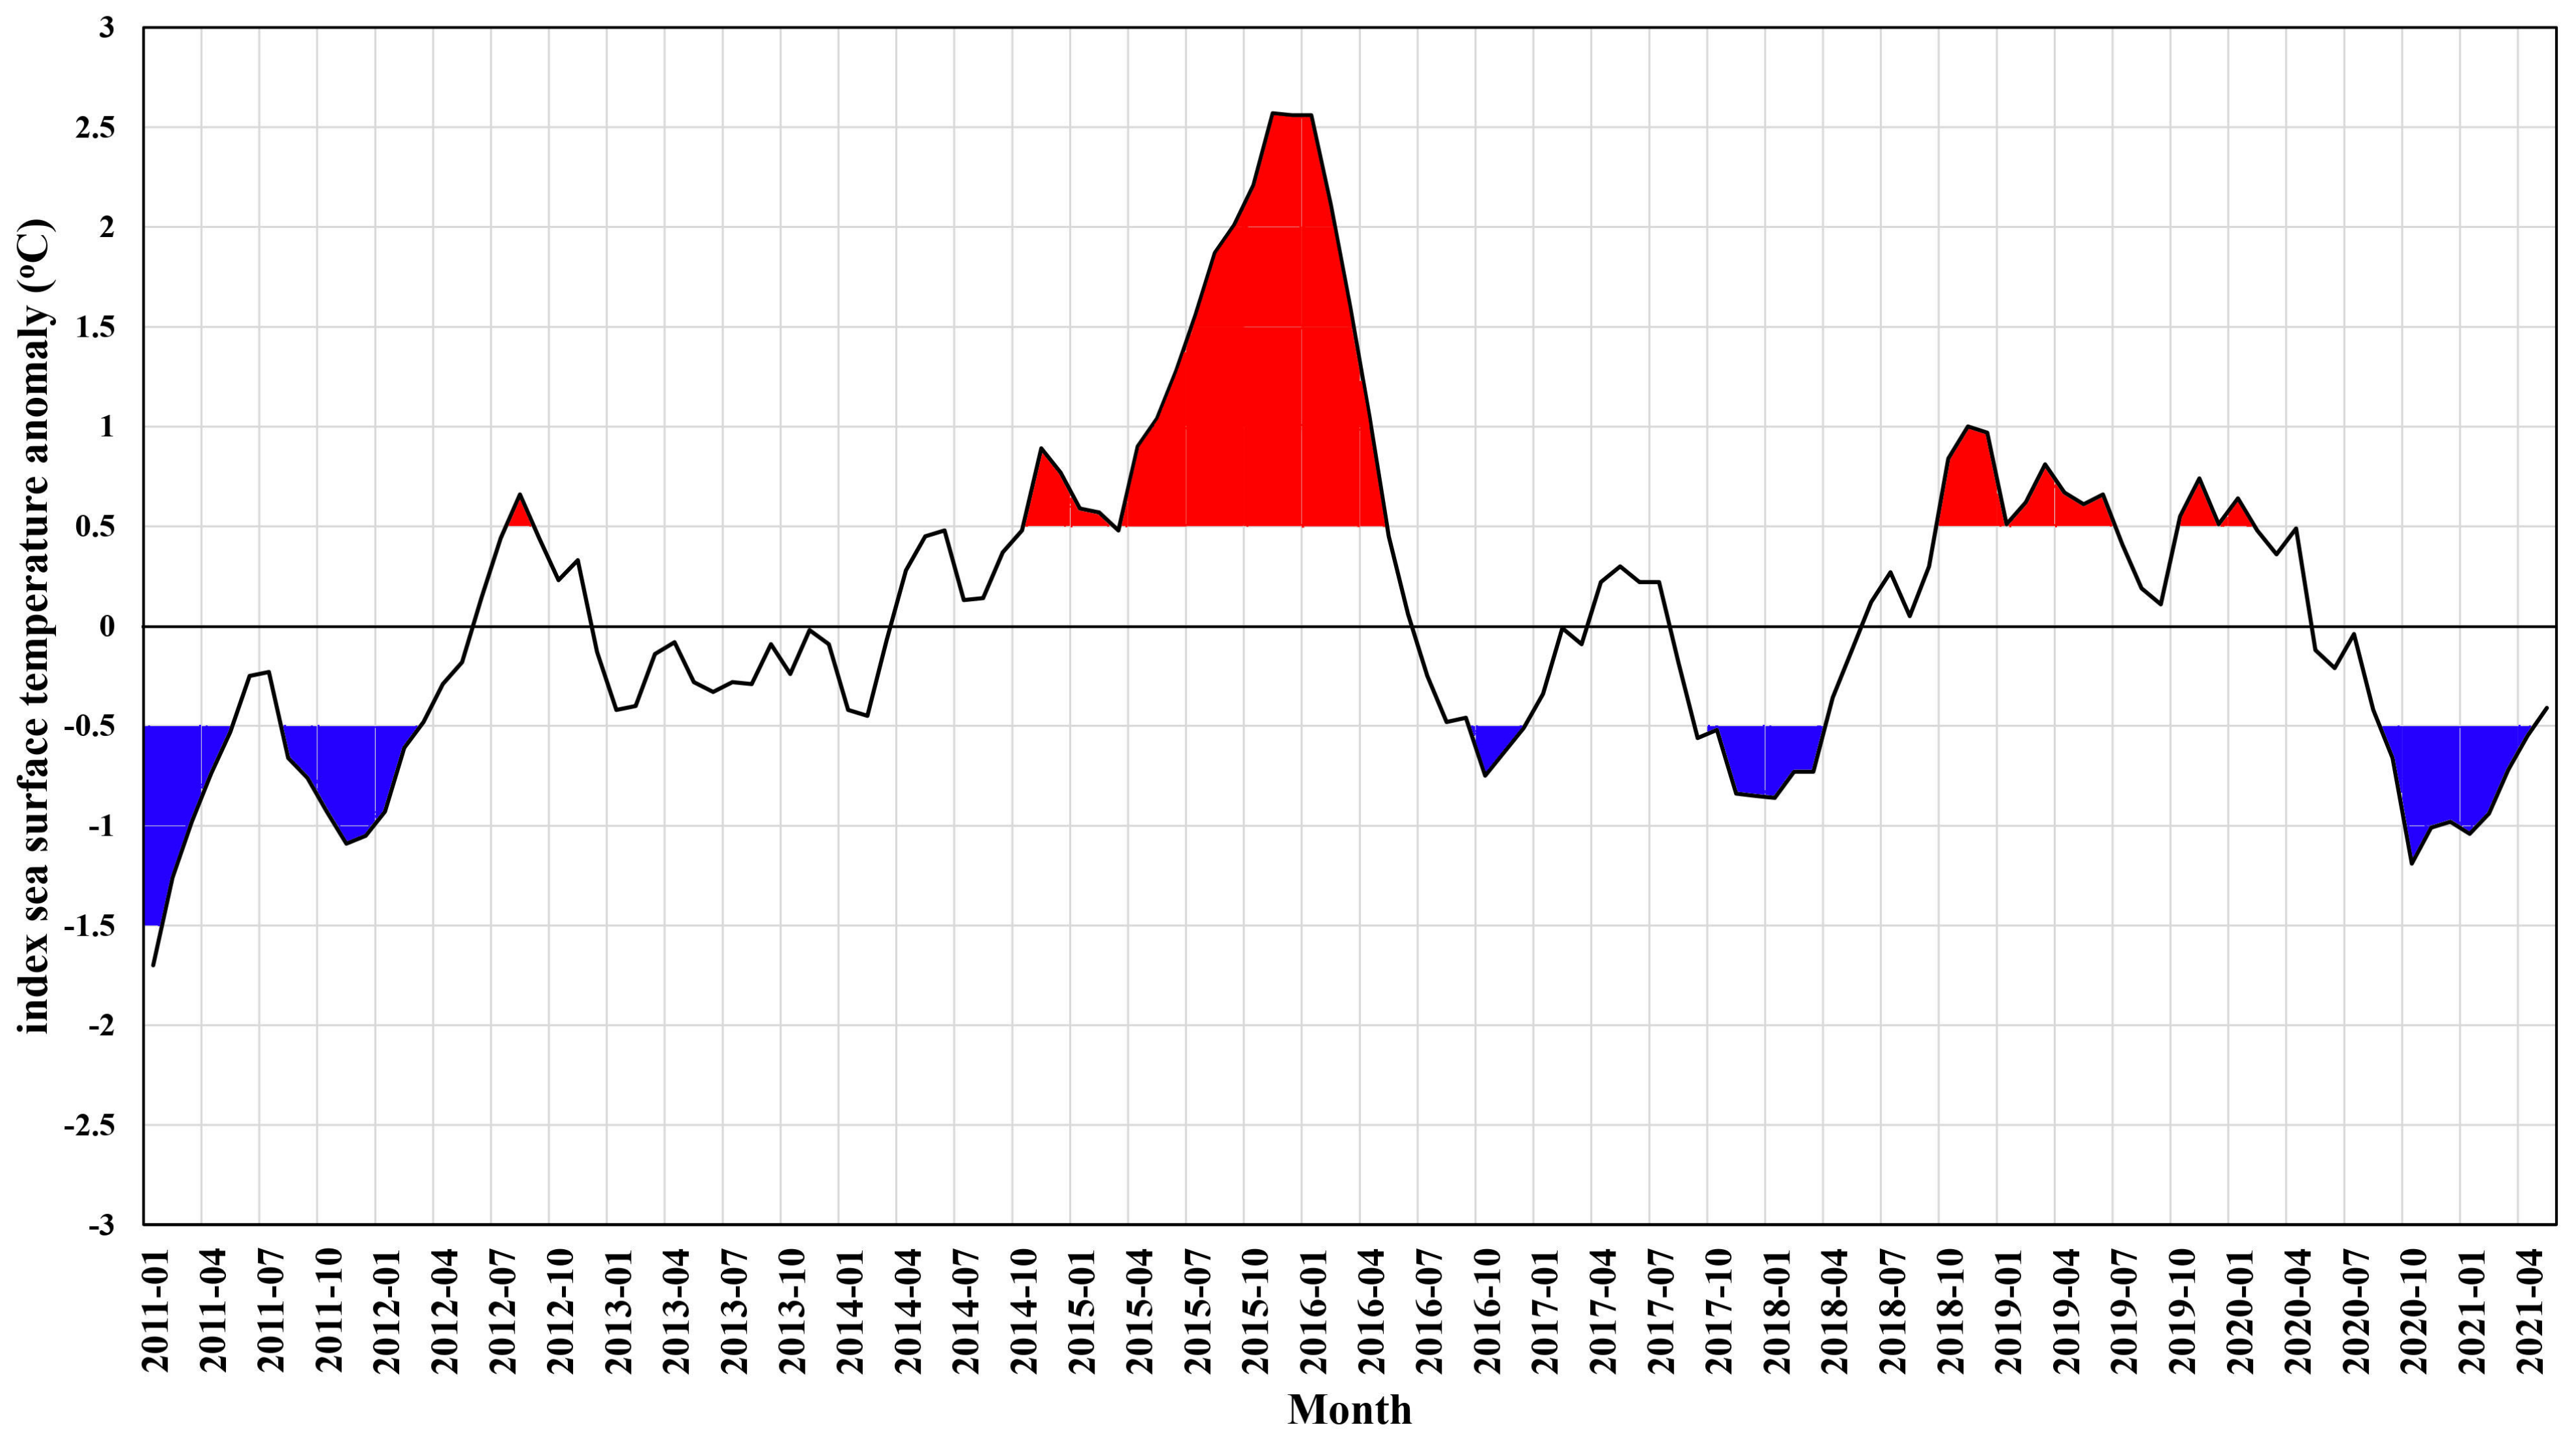
2.3. The El Niño–Southern Oscillation
2.4. The Evaluation of the Model
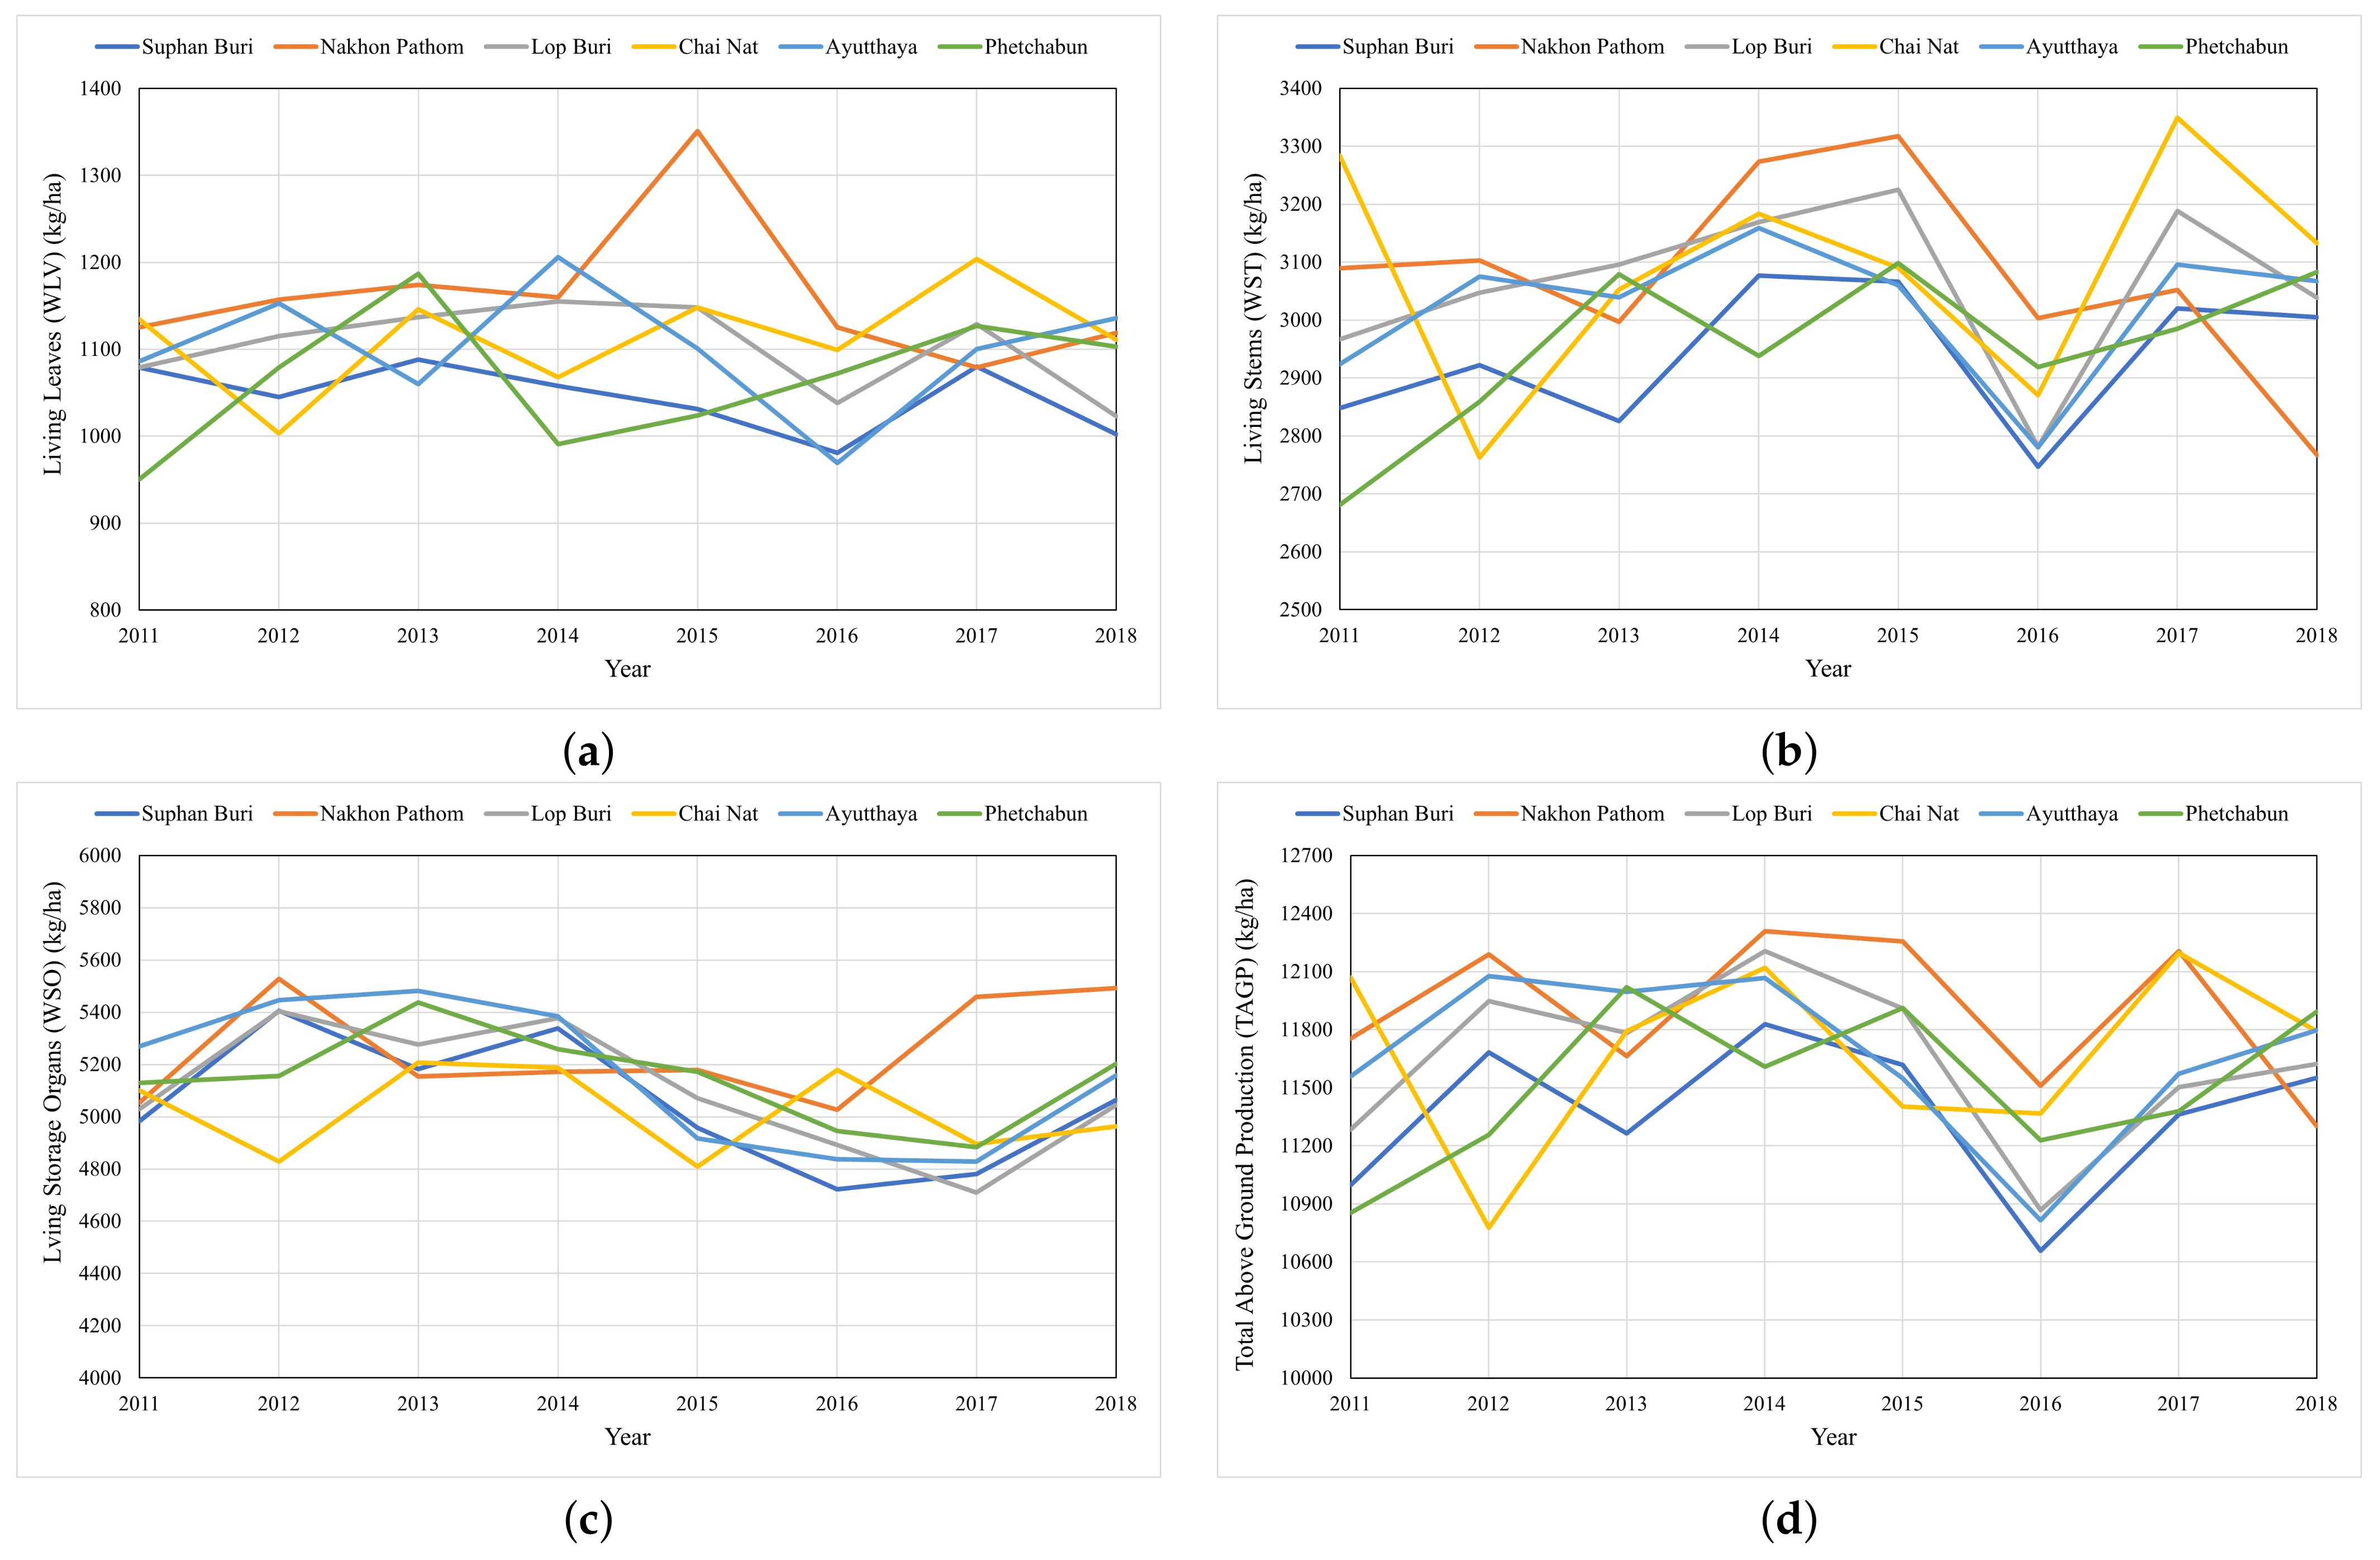
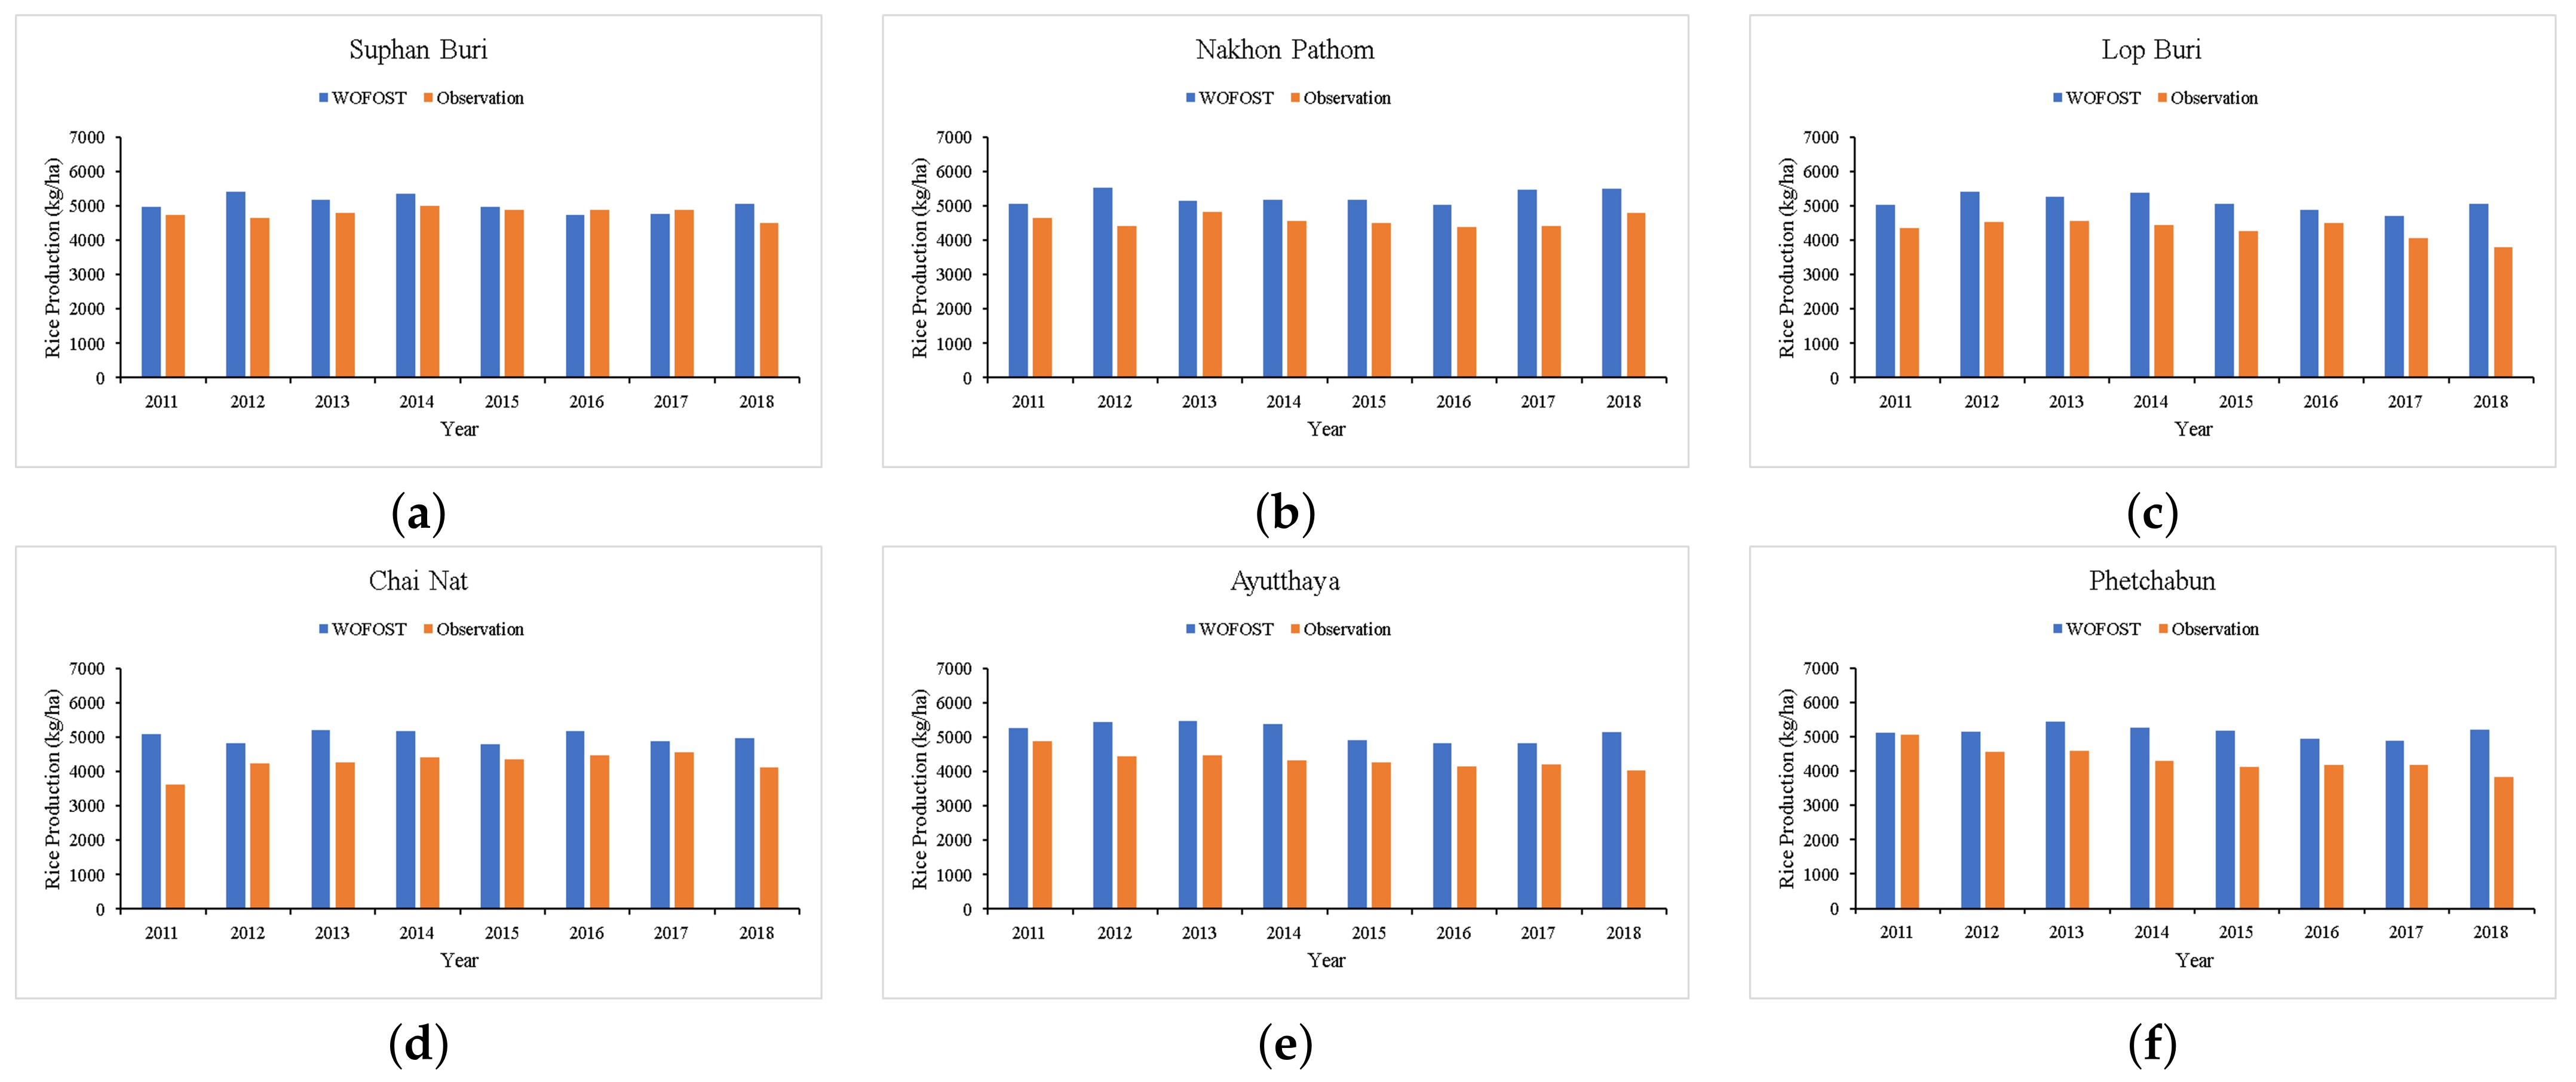
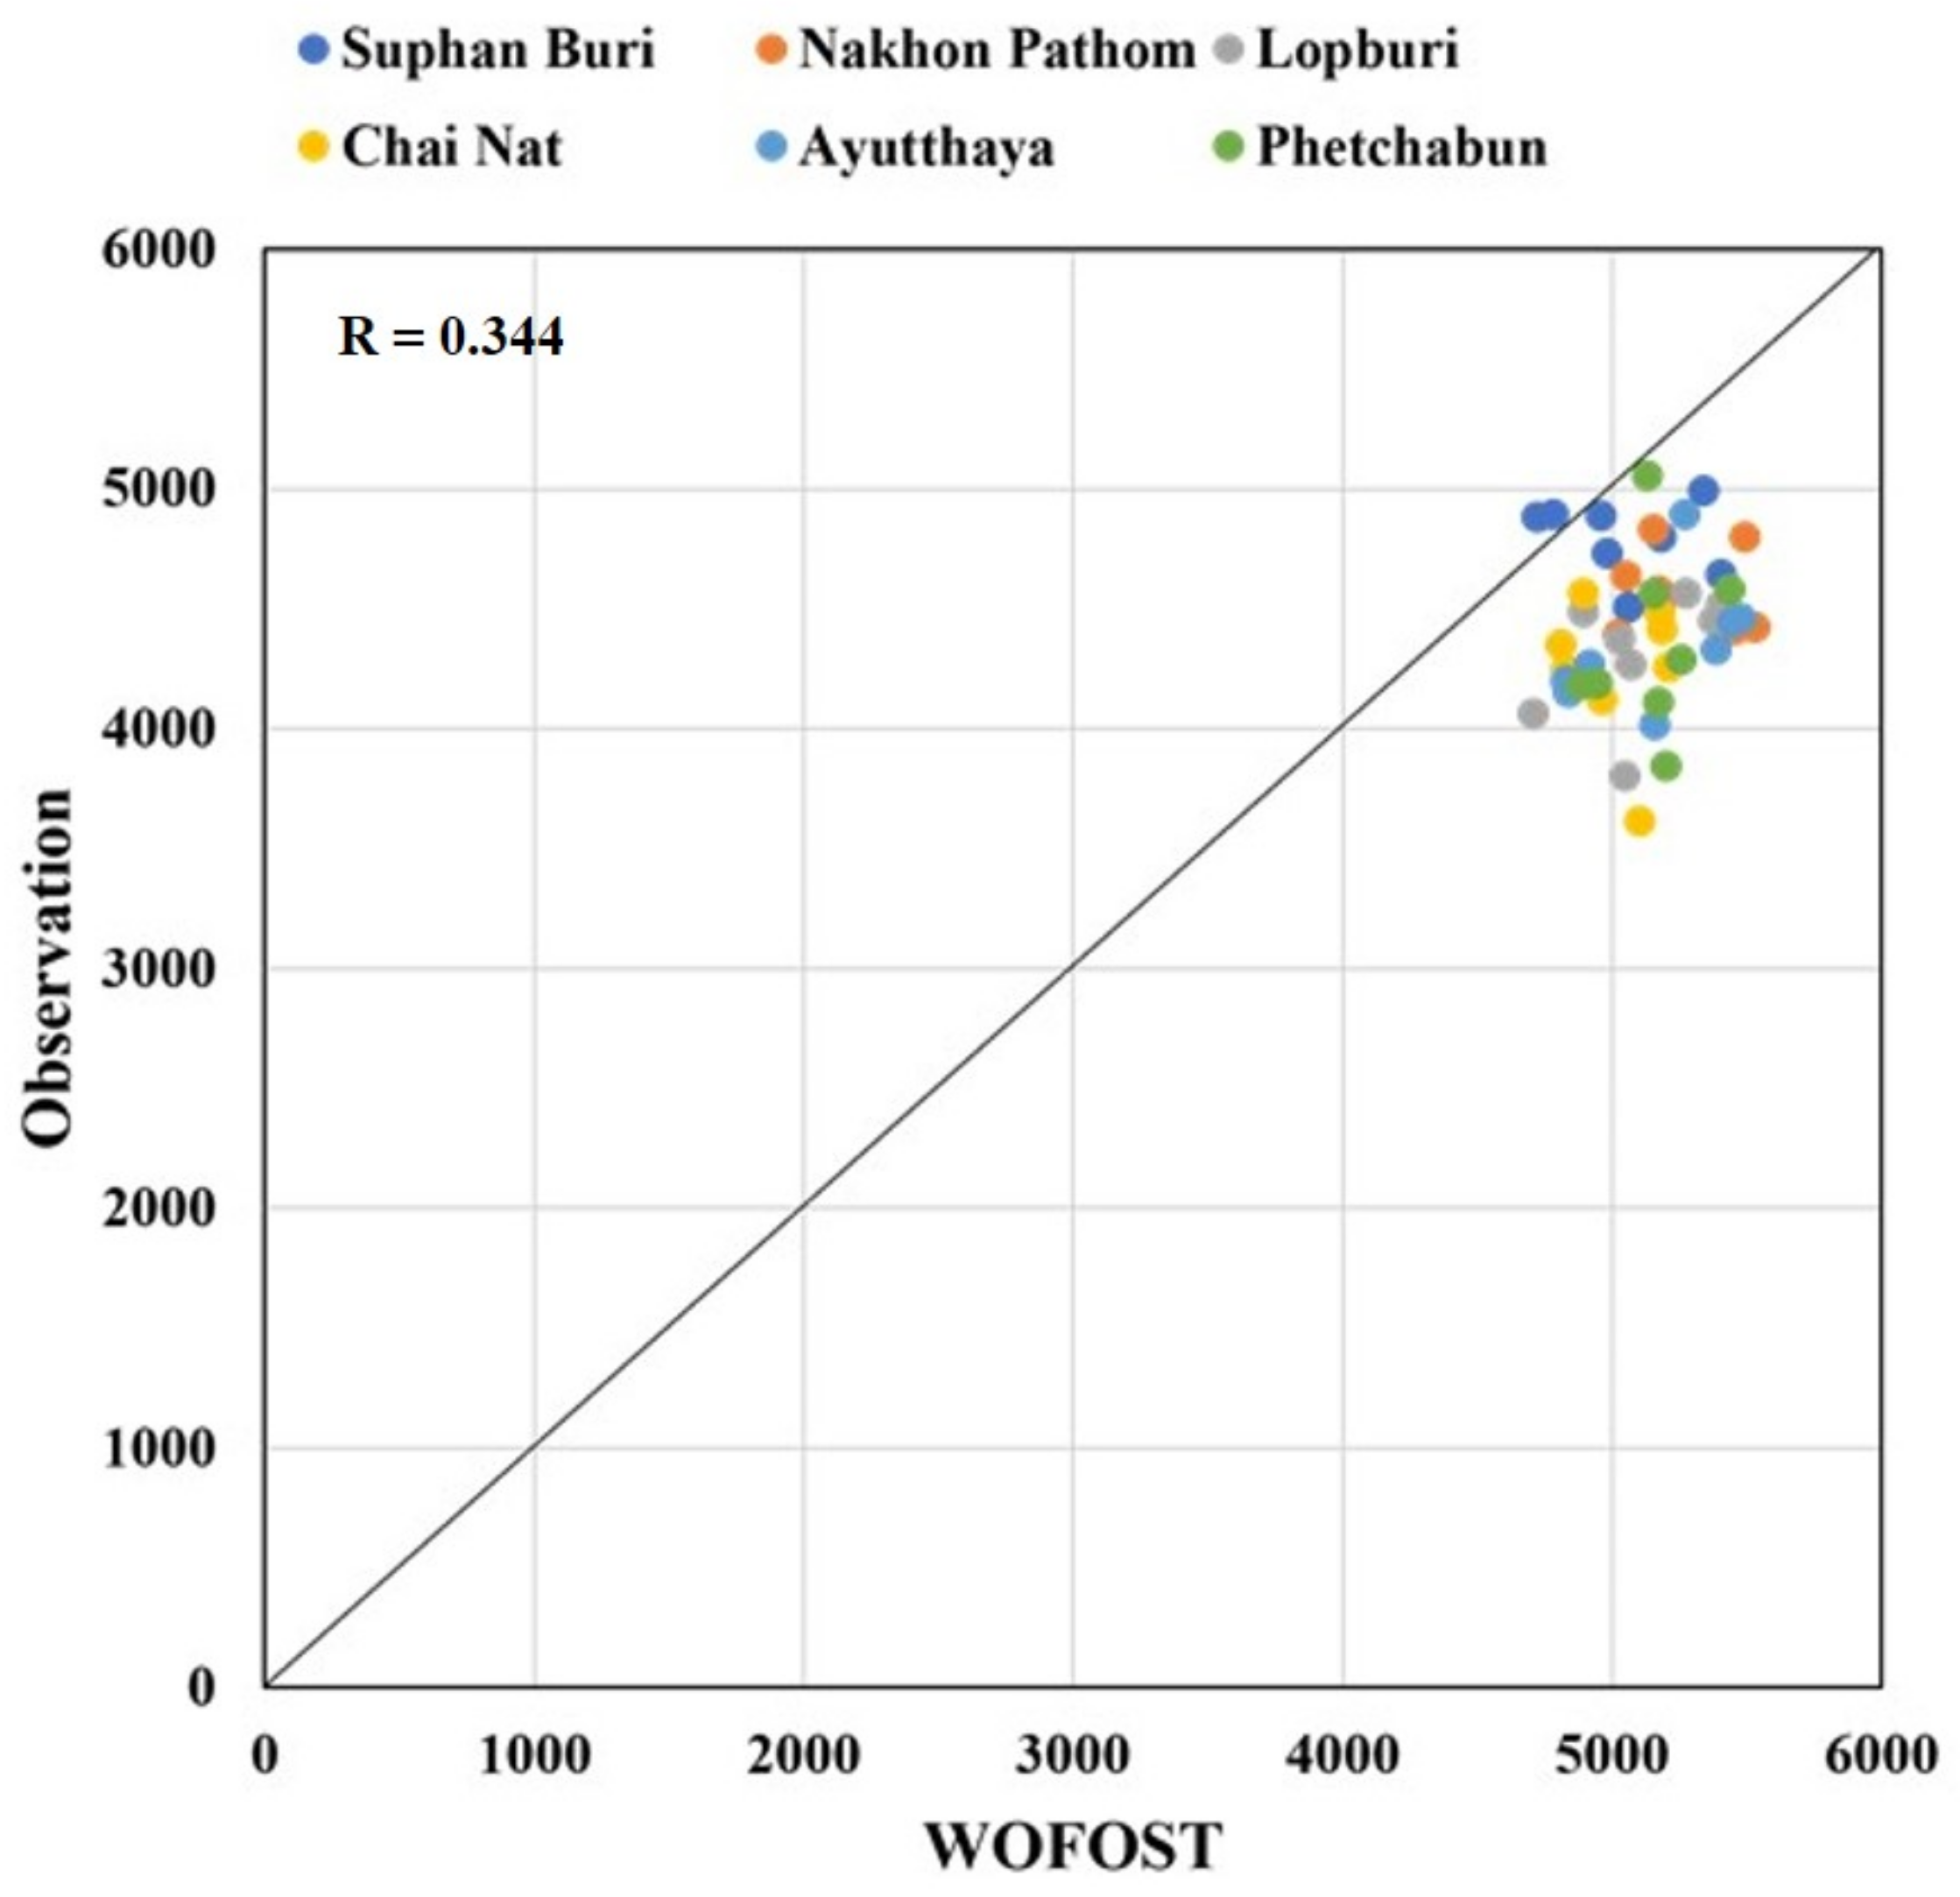
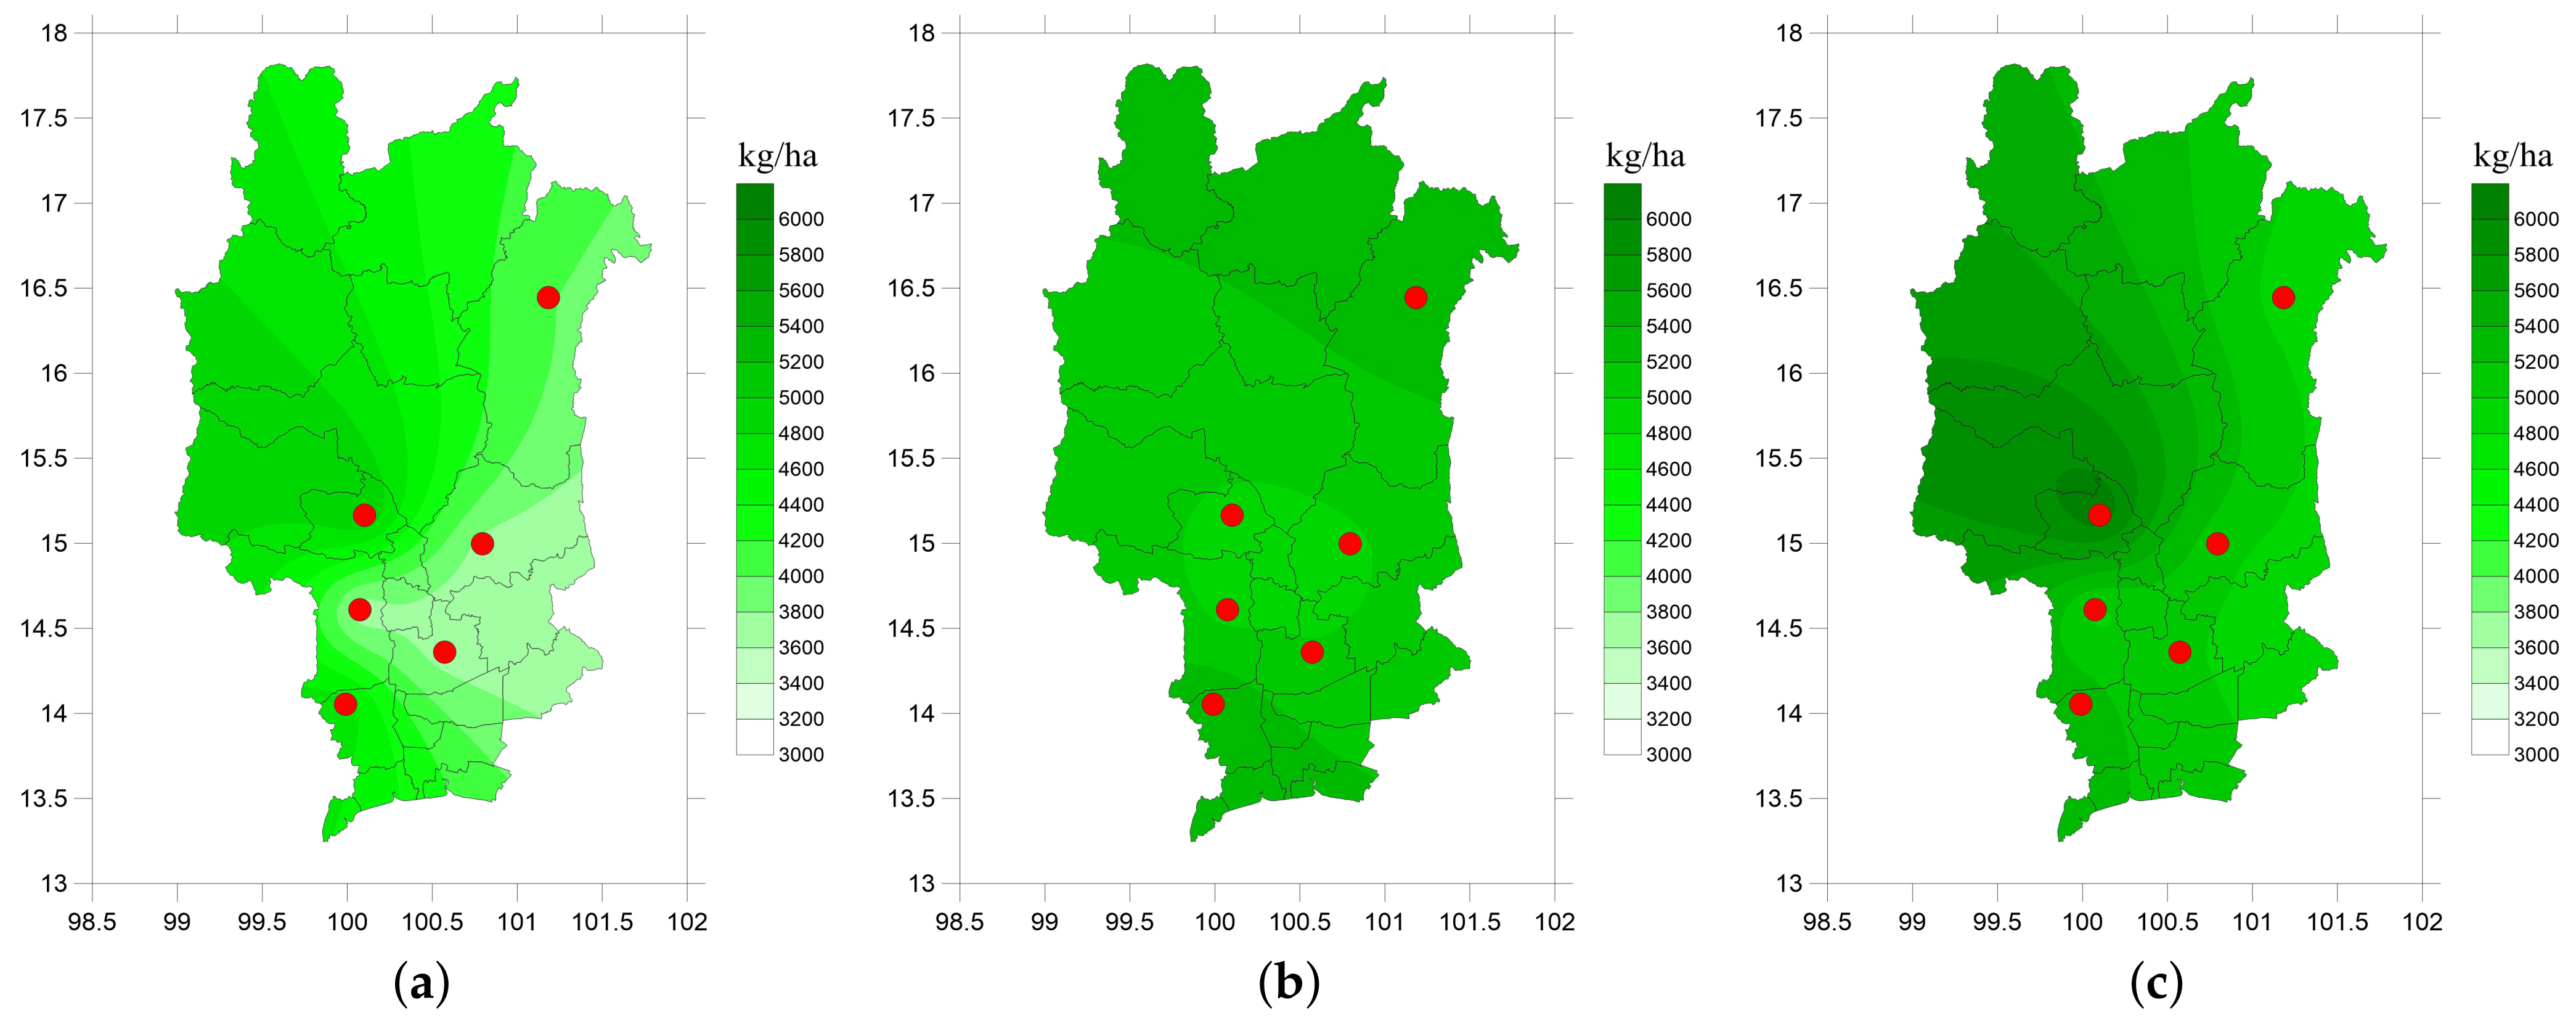
3. Results
4. Conclusions and Discussion
Author Contributions
Funding
Conflicts of Interest
Abbreviations
| APE | Absolute Percent Error |
| CRM | Coefficient of Residual Mass |
| ENSO | El Niño and Southern Oscillation |
| QUEFTS | Quantitative Evaluation of the Fertility of Tropical Soils |
| R | Correlation Coefficient |
| R | Coefficient of Determination |
| RMSE | Root Mean Square Error |
| SUCROS | Simple and Universal Crop growth Simulator |
| TAGP | Total Above-Ground Production |
| WOFOST | World Food Studies |
| WSO | Living Storage Organs |
| WST | Living Stems |
| WLV | Living Leaves |
References
- Zibaee, A. Rice: Importance and Future. Rice Res. 2013, 1, 1. [Google Scholar] [CrossRef] [Green Version]
- Gnanamanickam, S.S. Biological Control of Rice Diseases. Biol. Control Rice Dis. 2009, 8, 1–11. [Google Scholar]
- Zeigler, R.S.; Barclay, A. The Relevance of Rice. Rice 2008, 1, 3–10. [Google Scholar] [CrossRef] [Green Version]
- Sander, J.C.J.; Cheryl, H.P.; Andrew, D.M.; Ioannis, N.A.; Ian, F.; James, W.J.; John, M.A. Towards a new generation of agricultural system data, models and knowledge products: Information and communication technology. Agric. Syst. 2017, 155, 200–212. [Google Scholar]
- Verónica, S.R.; Francisco, R.M. From Smart Farming towards Agriculture 5.0: A Review on Crop Data Management. Agronomy 2020, 10, 207. [Google Scholar]
- Fermont, A.; Todd, B. Estimating Yield of Food Crops Grown by Smallholder Farmers: A Review in the Uganda Context. Int. Food Policy Res. Inst. 2011, 1, 68. [Google Scholar]
- Mukherjee, J.; Singh, L.; Singh, G.; Bal, S.K.; Singh, H.; Kaur, P. Comparative Evaluation of WOFOST and ORYZA2000 Models in Simulating Growth and Development of Rice (Oryza Sativa L.) in Punjab. J. Agrometeorol. 2011, 13, 86–91. [Google Scholar]
- Koide, N.; Robertson, A.W.; Ines, A.V.M.; Qian, J.H.; DeWitt, D.G.; Lucero, A. Prediction of Rice Production in the Philippines Using Seasonal Climate Forecasts. J. Appl. Meteorol. Climatol. 2013, 52, 552–569. [Google Scholar] [CrossRef] [Green Version]
- Putri, R.E.; Yahya, A.; Adam, N.M.; Aziz, S.A. Rice yield prediction model with respect to crop healthiness and soil fertility. Food Res. 2019, 3, 174–180. [Google Scholar]
- Vijayalata, V.; Devi, V.N.R.; Rohit, P.; Kiran, G.S.S.R. A Suggestive Model for Rice Yield Prediction and Ideal Meteorological Conditions During Crisis. Int. J. Sci. Technol. Res. 2019, 8, 1572–1576. [Google Scholar]
- Mardianto, M.; Tjahjono, E.; Rifada, M. Statistical modelling for prediction of rice production in indonesia using semiparametric regression based on three forms of Fourier series estimator. J. Eng. Appl. Sci. 2019, 14, 2763–2770. [Google Scholar]
- Guo, Y.; Xiang, H.; Li, Z.; Ma, F.; Du, C. Prediction of Rice Yield in East China Based on Climate and Agronomic Traits Data Using Artificial Neural Networks and Partial Least Squares Regression. Agronomy 2021, 11, 282. [Google Scholar] [CrossRef]
- Jin, M.; Liu, X.; Wu, L.; Liu, M. An improved assimilation method with stress factors incorporated in the WOFOST model for the efficient assessment of heavy metal stress levels in rice. Int. J. Appl. Earth Obs. Geoinf. 2015, 41, 118–129. [Google Scholar] [CrossRef]
- Eitzinger, J.; Trnka, M.; Hösch, J.; Žalud, Z.; Dubrovský, M. Comparison of CERES, WOFOST and SWAP models in simulating soil water content during growing season under different soil conditions. Ecol. Model. 2004, 171, 223–246. [Google Scholar] [CrossRef]
- Todorovic, M.; Albrizio, R.; Zivotic, L.; Saab, M.T.A.; Stöckle, C.; Steduto, P. Assessment of AquaCrop, CropSyst, and WOFOST models in the simulation of sunflower growth under different water regimes. Agronomy 2009, 101, 509–521. [Google Scholar] [CrossRef]
- Ma, Y.; Wang, S.; Zhang, L. Study on improvement of WOFOST against overwinter of wheat in North China. Chin. J. Agrometeorol. 2005, 26, 145–149. [Google Scholar]
- Supit, I.; Hooijper, A.A.; Diepen, V.C.A. System Description of WOFOST6.0 Crop Simulation Model Implemented in CGMS, Theory and Algorithms; Publications Office of the European Union: Luxembourg, 1994; pp. 1–144. [Google Scholar]
- Xie, W.X.; Yan, L.; Wang, G. Simulation and Validation of Rice Potential Growth Process in Zhejiang by Utilizing WOFOST Model. Zhongguo Shuidao Kexue 2006, 20, 319–323. [Google Scholar]
- Wu, D.; Ou, Y.; Zhao, X. The applicability research of WOFOST model in North China plain. Acta Phytoecol. Sin. 2003, 27, 594–602. [Google Scholar]
- Ma, S.; Pei, Z.; He, Y. Study on Simulation of Rice Yield with WOFOST in Heilongjiang Province. In Proceedings of the International Conference on Computer and Computing Technologies in Agriculture, Dongying, China, 19–21 October 2016. [Google Scholar]
- Biswas, R.; Banerjee, B.; Bhattacharyya, B. Impact of Temperature Increase on Performance of Kharif Rice at Kalyani, West Bengal Using WOFOST Model. J. Agrometeorol. 2018, 20, 28–30. [Google Scholar]
- Ratjen, A.M.; Kage, H. Forecasting yield via reference- and scenario calculations. Comput. Electron. Agric. 2015, 114, 212–220. [Google Scholar] [CrossRef]
- Jha, R.K.; Kalita, P.K.; Cooke, R.A.; Kumar, P.; Davidson, P.C.; Jat, R. Predicting the Water Requirement for Rice Production as Affected by Projected Climate Change in Bihar, India. Water 2020, 12, 3312. [Google Scholar] [CrossRef]
- Washio, K. The Prediction of Climate Change and Rice Production in Japan. Rice Res. 2013, 2, 1–3. [Google Scholar]
- Arunrat, N.; Pumijumnong, N. The Preliminary Study of Climate Change Impact on Rice Production and Economic in Thailand. Asian Soc. Sci. 2015, 11, 275–294. [Google Scholar] [CrossRef] [Green Version]
- Amnuaylojaroen, T.; Chanvichit, P.; Janta, R.; Surapipith, V. Projection of Rice and Maize Productions in Northern Thailand under Climate Change Scenario RCP8.5. Agriculture 2021, 11, 23. [Google Scholar] [CrossRef]
- TMD, Thai Meteorological Department, ENSO Phenomenon. Available online: https://www.tmd.go.th/info/info.php?FileID=19 (accessed on 10 October 2020).
- Jumpol, H. National Science and Technology Development Agency. Available online: http://nstda.or.th/rural/public/100%20articles-stkc/9.pdf (accessed on 10 February 2019).
- Rice Department. Suphan Buri 1. Available online: https://www.ricethailand.go.th/Rkb/varieties/index.php-file=content.php&id=76.htm (accessed on 4 December 2020).
- Rabbinge, R.; Wit, C.T. Systems, models and simulation. In Simulation and Systems Management in Crop Protection; Pudoc: Wageningen, The Netherlands, 1989; pp. 3–5. [Google Scholar]
- Wit, C.T. Philosophy and terminology. In On Systems Analysis and Simulation of Ecological Processes with Examples in CSMP and FORTRAN; Springer: Dordrecht, The Netherlands, 1993; pp. 3–9. [Google Scholar]
- Spitters, C.J.T.; Keulen, V.H.; Kraalingen, V.D.W.G. A simple and universal crop growth simulator: SUCROS87. In Simulation and Systems Management in Crop Protection; Pudoc: Wageningen, The Netherlands, 1989; pp. 147–181. [Google Scholar]
- Laar, V.H.H.; Goudriaan, J.; Keulen, V.H. Simulation of Crop Growth for Potential and Water-Limited Production Situations (As Applied to Spring Wheat); CABO-DLO, WAU-TPE: Wageningen, The Netherlands, 1992; pp. 1–72. [Google Scholar]
- Janssen, B.H.; Guiking, F.C.T.; Eijk, V.D.D.; Smaling, E.M.A.; Wolf, J.; Reuler, V.H. A system for quantitative evaluation of the fertility of tropical soils (QUEFTS). Geoderma 1990, 46, 299–318. [Google Scholar] [CrossRef] [Green Version]
- Smaling, E.M.A.; Janssen, B.H. Calibration of quefts, a model predicting nutrient uptake and yields from chemical soil fertility indices. Geoderma 1993, 59, 21–44. [Google Scholar] [CrossRef]
- Kropff, M.J.; Laar, V.H.H. Modeling Crop-Weed Interactions; International Rice Research Institute: Los Baños, Philippines, 1993; pp. 1–274. [Google Scholar]
- Gao, C.; Zhang, R.H. The roles of atmospheric wind and entrained water temperature (Te) in the second-year cooling of the 2010–12 La Niña event. Clim. Dyn. 2017, 48, 597–617. [Google Scholar] [CrossRef] [Green Version]


| No. | Describe | Unit | Year | Source |
|---|---|---|---|---|
| 1 | Maximum Air Temperature | C | 2011–2018 | Thailand Meteorological Department |
| 2 | Minimum Air Temperature | C | 2011–2018 | Thailand Meteorological Department |
| 3 | Early Morning Vapor Pressure | kPa | 2011–2018 | Thailand Meteorological Department |
| 4 | Mean Wind Speed at 2 m Above Ground | m s | 2011–2018 | Thailand Meteorological Department |
| 5 | Precipitation | mm d | 2011–2018 | Thailand Meteorological Department |
| 6 | Irradiation | kJ m d | 2011–2018 | Department of Alternative Energy |
| Development and Efficiency |
| Station | Root Mean | Absolute Percent | Coefficient of | C | A | B | R | R |
|---|---|---|---|---|---|---|---|---|
| Square Error | Error | Residual Mass | ||||||
| Suphan Buri | 397.117 | 6.991 | −0.055 | 0.282 | 0.028 | −0.183 | 0.750 | 0.563 |
| Nakhon Pathom | 731.626 | 15.150 | −0.150 | 0.266 | 0.030 | −0.348 | 0.770 | 0.592 |
| Lop Buri | 818.764 | 18.457 | −0.182 | 0.073 | 0.031 | −0.172 | 0.818 | 0.669 |
| Chai Nat | 835.593 | 18.605 | −0.180 | 0.253 | 0.029 | −0.066 | 0.747 | 0.558 |
| Ayutthaya | 856.984 | 19.049 | −0.188 | 0.588 | 0.026 | −0.365 | 0.764 | 0.583 |
| Phetchabun | 870.754 | 18.971 | −0.183 | 0.067 | 0.034 | −0.506 | 0.800 | 0.640 |
| Mean | 751.806 | 16.204 | −0.156 | − | − | − | 0.775 | 0.601 |
| Lag Time | Suphan Buri | Nakhon Pathom | Lopburi | Chai Nat | Ayutthaya | Phetchabun | Sum | p-Value |
|---|---|---|---|---|---|---|---|---|
| No Lag | 0.2474 | 0.2230 | 0.2731 | −0.5442 | −0.0704 | 0.3114 | 0.0816 | 0.5812 |
| Lag 1 | 0.2767 | 0.1251 | 0.3466 | −0.5343 | −0.0397 | 0.3170 | 0.0930 | 0.5297 |
| Lag 2 | 0.2227 | 0.2337 | 0.2538 | −0.7019 | −0.1245 | 0.1435 | 0.0259 | 0.8611 |
| Lag 3 | 0.0445 | 0.2632 | 0.0399 | −0.7803 | −0.2988 | −0.0203 | −0.1001 | 0.4983 |
| Lag 4 | −0.0490 | 0.0529 | −0.0100 | −0.5561 | −0.4174 | −0.1154 | −0.1631 | 0.2680 |
| Lag 5 | −0.3050 | −0.1462 | −0.2058 | −0.2770 | −0.6184 | −0.2826 | −0.2957 | 0.0413 |
| Lag 6 | −0.4505 | −0.3401 | −0.2718 | −0.0047 | −0.6448 | −0.3315 | −0.3389 | 0.0184 |
| Lag 7 | −0.5042 | −0.4449 | −0.2896 | 0.1927 | −0.5901 | −0.3704 | −0.3372 | 0.0191 |
| Lag 8 | −0.5959 | −0.3630 | −0.4019 | 0.1016 | −0.6825 | −0.4732 | −0.4016 | 0.0047 |
| Lag 9 | −0.5436 | −0.4027 | −0.3335 | 0.1778 | −0.6232 | −0.3870 | −0.3556 | 0.0131 |
Publisher’s Note: MDPI stays neutral with regard to jurisdictional claims in published maps and institutional affiliations. |
© 2021 by the authors. Licensee MDPI, Basel, Switzerland. This article is an open access article distributed under the terms and conditions of the Creative Commons Attribution (CC BY) license (https://creativecommons.org/licenses/by/4.0/).
Share and Cite
Hensawang, S.; Injan, S.; Varnakovida, P.; Humphries, U. Predicting Rice Production in Central Thailand Using the WOFOST Model with ENSO Impact. Math. Comput. Appl. 2021, 26, 72. https://doi.org/10.3390/mca26040072
Hensawang S, Injan S, Varnakovida P, Humphries U. Predicting Rice Production in Central Thailand Using the WOFOST Model with ENSO Impact. Mathematical and Computational Applications. 2021; 26(4):72. https://doi.org/10.3390/mca26040072
Chicago/Turabian StyleHensawang, Saruda, Sittisak Injan, Pariwate Varnakovida, and Usa Humphries. 2021. "Predicting Rice Production in Central Thailand Using the WOFOST Model with ENSO Impact" Mathematical and Computational Applications 26, no. 4: 72. https://doi.org/10.3390/mca26040072
APA StyleHensawang, S., Injan, S., Varnakovida, P., & Humphries, U. (2021). Predicting Rice Production in Central Thailand Using the WOFOST Model with ENSO Impact. Mathematical and Computational Applications, 26(4), 72. https://doi.org/10.3390/mca26040072