Article

A Hybrid Estimation of Distribution Algorithm for the Quay Crane Scheduling Problem

by
Ricardo Pérez-Rodríguez
Circuito Universitario, Faculty of Engineering, CONACYT—UAQ, Autonomous University of Queretaro, Cerro de las Campanas s/n, Santiago de Queretaro 76010, Mexico
Math. Comput. Appl. 2021, 26(3), 64; https://doi.org/10.3390/mca26030064
Submission received: 27 July 2021 / Revised: 5 September 2021 / Accepted: 7 September 2021 / Published: 10 September 2021
(This article belongs to the Special Issue Numerical and Evolutionary Optimization 2021)

Abstract

:
The aim of the quay crane scheduling problem (QCSP) is to identify the best sequence of discharging and loading operations for a set of quay cranes. This problem is solved with a new hybrid estimation of distribution algorithm (EDA). The approach is proposed to tackle the drawbacks of the EDAs, i.e., the lack of diversity of solutions and poor ability of exploitation. The hybridization approach, used in this investigation, uses a distance based ranking model and the moth-flame algorithm. The distance based ranking model is in charge of modelling the solution space distribution, through an exponential function, by measuring the distance between solutions; meanwhile, the heuristic moth-flame determines who would be the offspring, with a spiral function that identifies the new locations for the new solutions. Based on the results, the proposed scheme, called QCEDA, works to enhance the performance of those other EDAs that use complex probability models. The dispersion results of the QCEDA scheme are less than the other algorithms used in the comparison section. This means that the solutions found by the QCEDA are more concentrated around the best value than other algorithms, i.e., the average of the solutions of the QCEDA converges better than other approaches to the best found value. Finally, as a conclusion, the hybrid EDAs have a better performance, or equal in effectiveness, than the so called pure EDAs.

1. Introduction

1.1. Recent Research on Seaport Operations

Approximately 90% of products that are globally commercialized are transported by sea, and in one decade, the average capacity of cargo ships has doubled, with ports being the ones that allow the execution of exchanges. Seaports facilitate trading and make logistics costs more competitive. They allow the transportation of products without several checkpoints, making the process and the supply chain more efficient.
The geographic location of each seaport, combined with the quantity of active seaports, provides significant advantages in this industry for any economy.
Seaports are geographical areas and economic units of the specific place where the terminals may be found, the terminals are operating units of a seaport, which are actively able to provide modal interchange and seaport services.
The connectivity among seaports must be constantly improved to facilitate the movement of products by sea or land, and, within this connectivity, intermodal schemes must be defined to establish, for example, the transportation of products by rail or carrier.
The International Seaport System has been constantly modernized with a vision to improve logistics and multimodal connectivity, where the projects regarding seaport, road and rail infrastructures are more integrated in order to respond to the increasing demand of national and international trade. Currently, the capacity of seaports has been increased by millions of tons per year.
As was previously mentioned, seaports have been, are and shall be, a great entry gate to the different continents of the world. Supported by the great advantage of having access to the oceans, countries have an extensive growth potential regarding foreign trade; it is only a matter of continuously improving governmental management and support.
One of the greatest challenges of trading by sea is the existence of the international market, countries have reached the maximum uses of their seaports, the demand for infrastructure and comprehensive logistic service offered at lower costs is still increasing.
Additionally, trained staff are required to put into operation the resources acquired in an efficient and safe manner. Another significant challenge is environmental protection, for example, in the Caribbean Sea, a Mesoamerican Reef System was designed, which is a sensitive area for navigating and preventing pollution from ships.
There is still a gap to consider: cabotage routes must be reinforced and transport routes must be developed; however, maritime transport is encouraged every year, the development of the industry is increasing and governments are considering it as a significant matter.
Therefore, the role of international transportation, maritime shipping, and marine container terminals in the economic development of numerous countries has been widely studied using different approaches. Seaport problems continue to be attracted to developing new optimization techniques. Recently, important contributions have been published in order to improve the performance of seaport operations. A representative example is the study of [1]. This study details a tailored global optimization algorithm for deploying, scheduling, and sequencing heterogeneous vessels in a container liner shipping route. The key advantage is that the weekly dependent shipping demand is considered to incorporate fluctuations in the planning horizon. In addition, the authors consider the distinct fuel efficiencies, cost structures of the ships, and capacities. These conditions determine the number of containers transported, the bunker fuel consumption, and the operating cost of a shipping route. A mixed integer-programming model minimizes the total cost by considering, from a set of candidate ships, the optimal ships. In addition, the proposed model integrates the sequences, schedules, and sailing speeds of the shipping route.
Ref. [2] is a seaport study that considers emergent ship arrivals for building berth schedules. The authors propose an optimization procedure to schedule ships by reducing disturbances in the service and maximizing the number of emergent ships served. A case study illustrates the aforementioned optimization procedure. The proposed procedure provides key concerns to decision makers dealing with the berth scheduling issues of emergent ship arrivals.
Ref. [3] attends to real world situations, such as water depth and tide conditions, in seaport operations. An enriched particle swarm optimization procedure is depicted to solve the continuous berth allocation, quay crane assignment and quay crane scheduling problems. The authors incorporate, in the solution, safety operations between quay cranes. Their results are compared with the results of the exact solution and the basic particle swarm optimization procedure.
Ref. [4] concerns the increase in seaport operations in the last thirty years, and argues that berth scheduling can improve the throughput of marine container terminals. The authors detail an innovative evolutionary algorithm to minimize handling costs, waiting costs, and the late departure costs of the vessels that are to be served at a marine container terminal. The scheme of the authors relies on an augmented self adaptive parameter control strategy, which changes algorithmic parameters throughout the search process.
Another important example is the research of [5]. The author develops a novel memetic algorithm to help the marine container terminal operators to build proper schedules, and to tackle congestion issues caused by the increasing number of large size vessels. Although this study does not account for uncertainty in vessel arrivals, the proposed algorithm serves as an efficient planning tool for marine container terminal operators and assists with efficient the berth scheduling.

1.2. The Quay Crane Scheduling Problem

Based on the preliminary review, it is clear that the performance of seaport operations, for the international supply chain, continues to be highly important. Solving problems, such as the quay crane scheduling problem (QCSP), a combinatorial problem, contributes to improving the efficiency of any seaport. The QCSP is selected in this research due to its complex nature.
Quay cranes are very important resources at container terminals. They are used to load containers onto, and discharge containers from vessels at, the quayside of terminals. Quay cranes along the same berth operate on a common set of rails.
Jobs represent container unloading/loading work, and arise at specific locations along the quayside. The collection of jobs may represent work for a single ship, or multiple ships.
Normally, an optimization formulation for the QCSP considers reducing the makespan, i.e., the total completion time. Any proposed solution should consider scheduling operations restrictions, such as
-
A minimum distance being left between quay cranes to avoid boom collision.
-
Each quay crane should work when it will not be busy.
-
Like a traditional shop environment, precedence between operations may exist.
A mathematical formulation considers
  • p i the processing time of task i .
  • r k the release time of quay crane k .
  • t i j the travel time of a quay crane from the bay position of task i to the bay position of task j .
  • M a sufficient large constant.
  • Ω a set of all tasks.
  • Φ a set of ordered pairs of tasks between which there is a precedence relationship.
  • x i j k = 1 if task j immediately follows task i on quay crane k ; 0, otherwise. Tasks 0 and T will be considered the initial and final states of each quay crane, respectively. Thus, when task j is the first task of quay crane k , x 0 j k = 1 . In addition, when task j is the last of quay crane k ,   x j T k = 1 .
  • Q k the completion time of quay crane k .
  • C i the completion time of task i .
  • C m a x makespan.
Therefore, the QCSP can be formulated as follows
Minimize   i C i Ω
subject to
C i C m a x     k = 1 , , K
j Ω x 0 j k = 1     k = 1 , , K
i Ω x j T k = 1     k = 1 , , K
k i Ω x i j k = 1     j Ω
C i + t i j + p j C j M 1 x i j k     i , j Ω ,     k = 1 , , K
C i + p j C j     i , j Φ
C j + t j T k + Q k M 1 x j T k     i Ω ,   k = 1 , , K
r k + C j + t 0 j k + p j   M 1 x 0 j k     i Ω ,   k = 1 , , K
x i j k = 0   o r   1     i , j Ω ,   k = 1 , , K
Q k , C i 0     i Ω ,   k = 1 , , K
The objective function (1) minimizes the average waiting time. Constraint (2) determines the makespan, which corresponds to the completion time of all tasks. Constraints (3) and (4) define the first and the last tasks for each quay crane, respectively. Constraint (5) ensures that every task must be completed by exactly one crane. Constraints (6) and (7) determine the completion time for each task. Constraint (8) defines the completion time of each quay crane. Constraint (9) ensures that the first task of a crane is not started before the crane is ready. Finally, (10) and (11) define the domains of the decision variables.
The objective of our study is to identify the best schedule to minimize the quays’ overall average waiting time. The methodology used in this research details how a solution can be built by two decisions, i.e., operation scheduling and crane assignment.

1.3. Solving Combinatorial Problems through Evolutionary Algorithms

In a wide set of studies, evolutionary algorithms have been proposed to offer useful solutions for high scale optimization problems. The solutions are required in different engineering fields. Particularly, evolutionary algorithms are competitive in the combinatorial optimization field. Some relevant studies of evolutionary algorithms can be appreciated in the research of [6], for job shop operations and process integration. The authors use and apply the concept of interaction between different species to tackle the problem. This interaction is not considered in any traditional genetic algorithm. The study of [7] is representative of the evolutionary algorithms family for tackling job shop problems. In this applied case, an ant colony optimisation based approach is proposed to address flexible job shop scheduling with routing flexibility and setup times problems. Recent publications are found in [8]. This research group employs a genetic algorithm with the Pareto front technique. The approach is applied on a mail-order pharmacy system. Ref. [9] utilizes a bee colony method with the Pareto front technique for solving the single machine group-scheduling problem with sequence dependent setup times. Ref. [10] uses an enriched discrete particle swarm optimization method to solve a flexible job shop scheduling problem. Ref. [11] detail a bat based approach to tackle a dual flexible job shop scheduling problem. Moreover, recently, the use of hybrid evolutionary algorithms is remarkable. The aim is to offer more efficient methods, or better solutions, to those previously found. The work of [12] falls into this category for solving the vehicle routing problem. The author employs a genetic algorithm and local search. The research of [13] also utilizes a genetic technique with a variable neighborhood descent method to address flexible job shop scheduling problems. The study of [14] integrates a genetic algorithm with a neural network to improve container-loading sequences in seaports. The practical implementation of their algorithm is confirmed by using a simulation in the research. The work of [15] uses a genetic technique with a minimum cost flow network model to solve a dispatching problem for vehicles in a transshipment hub scenario. Their experiments show that the proposal is more effective than a neighborhood search algorithm. The research of [16] details an efficient parameter free greedy randomized adaptive search method, plus a variable neighborhood descent technique, to tackle a school bus routing problem with bus stop selection. The study of [17] proposes a genetic technique with a tabu search to address more than 200 flexible job shop scheduling open problems. Following the previous review, we can appreciate that there exist different types of evolutionary algorithms for solving different combinatorial problems.

1.4. Estimation of Distribution Algorithms

This article focuses on the use of estimation of distribution algorithms (EDAs) as a section of the classification of evolutionary algorithms. There exists a vast literature about EDAs. Studies, such as [18], designed for solving permutation flowshop scheduling problems. The research of [19] contributes guidelines for developing effective EDAs for single machine scheduling problems. Furthermore, the work of [20] proposes an EDA for solving lot-streaming flowshop problems with setup times. These investigations are robust in the solution of combinatorial problems using EDAs.
When using EDAs, as with other evolutionary algorithms, the main task is to produce a population of solutions through some generations. However, with EDAs, a probability model, i.e., a distribution, is built based on a set of solutions to the problem, to produce new solutions. Traditionally, the performance of EDAs lies in how efficient the probability distribution is. The probability distribution is built using the members of the population to obtain better solutions. It has been widely documented, in papers such as [21,22], that the probability model should consider the structure of a problem with more precision. The aim of EDAs is to consider high order interactions between the variables of the problem. Thus, complex probability models are employed to improve the efficiency of EDAs. Nonetheless, one of the drawback of EDAs is the lack of the diversity of the solutions and the poor ability of exploitation [22]. There is more than one way to counter the drawbacks of EDAs. Nevertheless, most studies suggest hybridization. In the literature review section, some of the studies are listed.
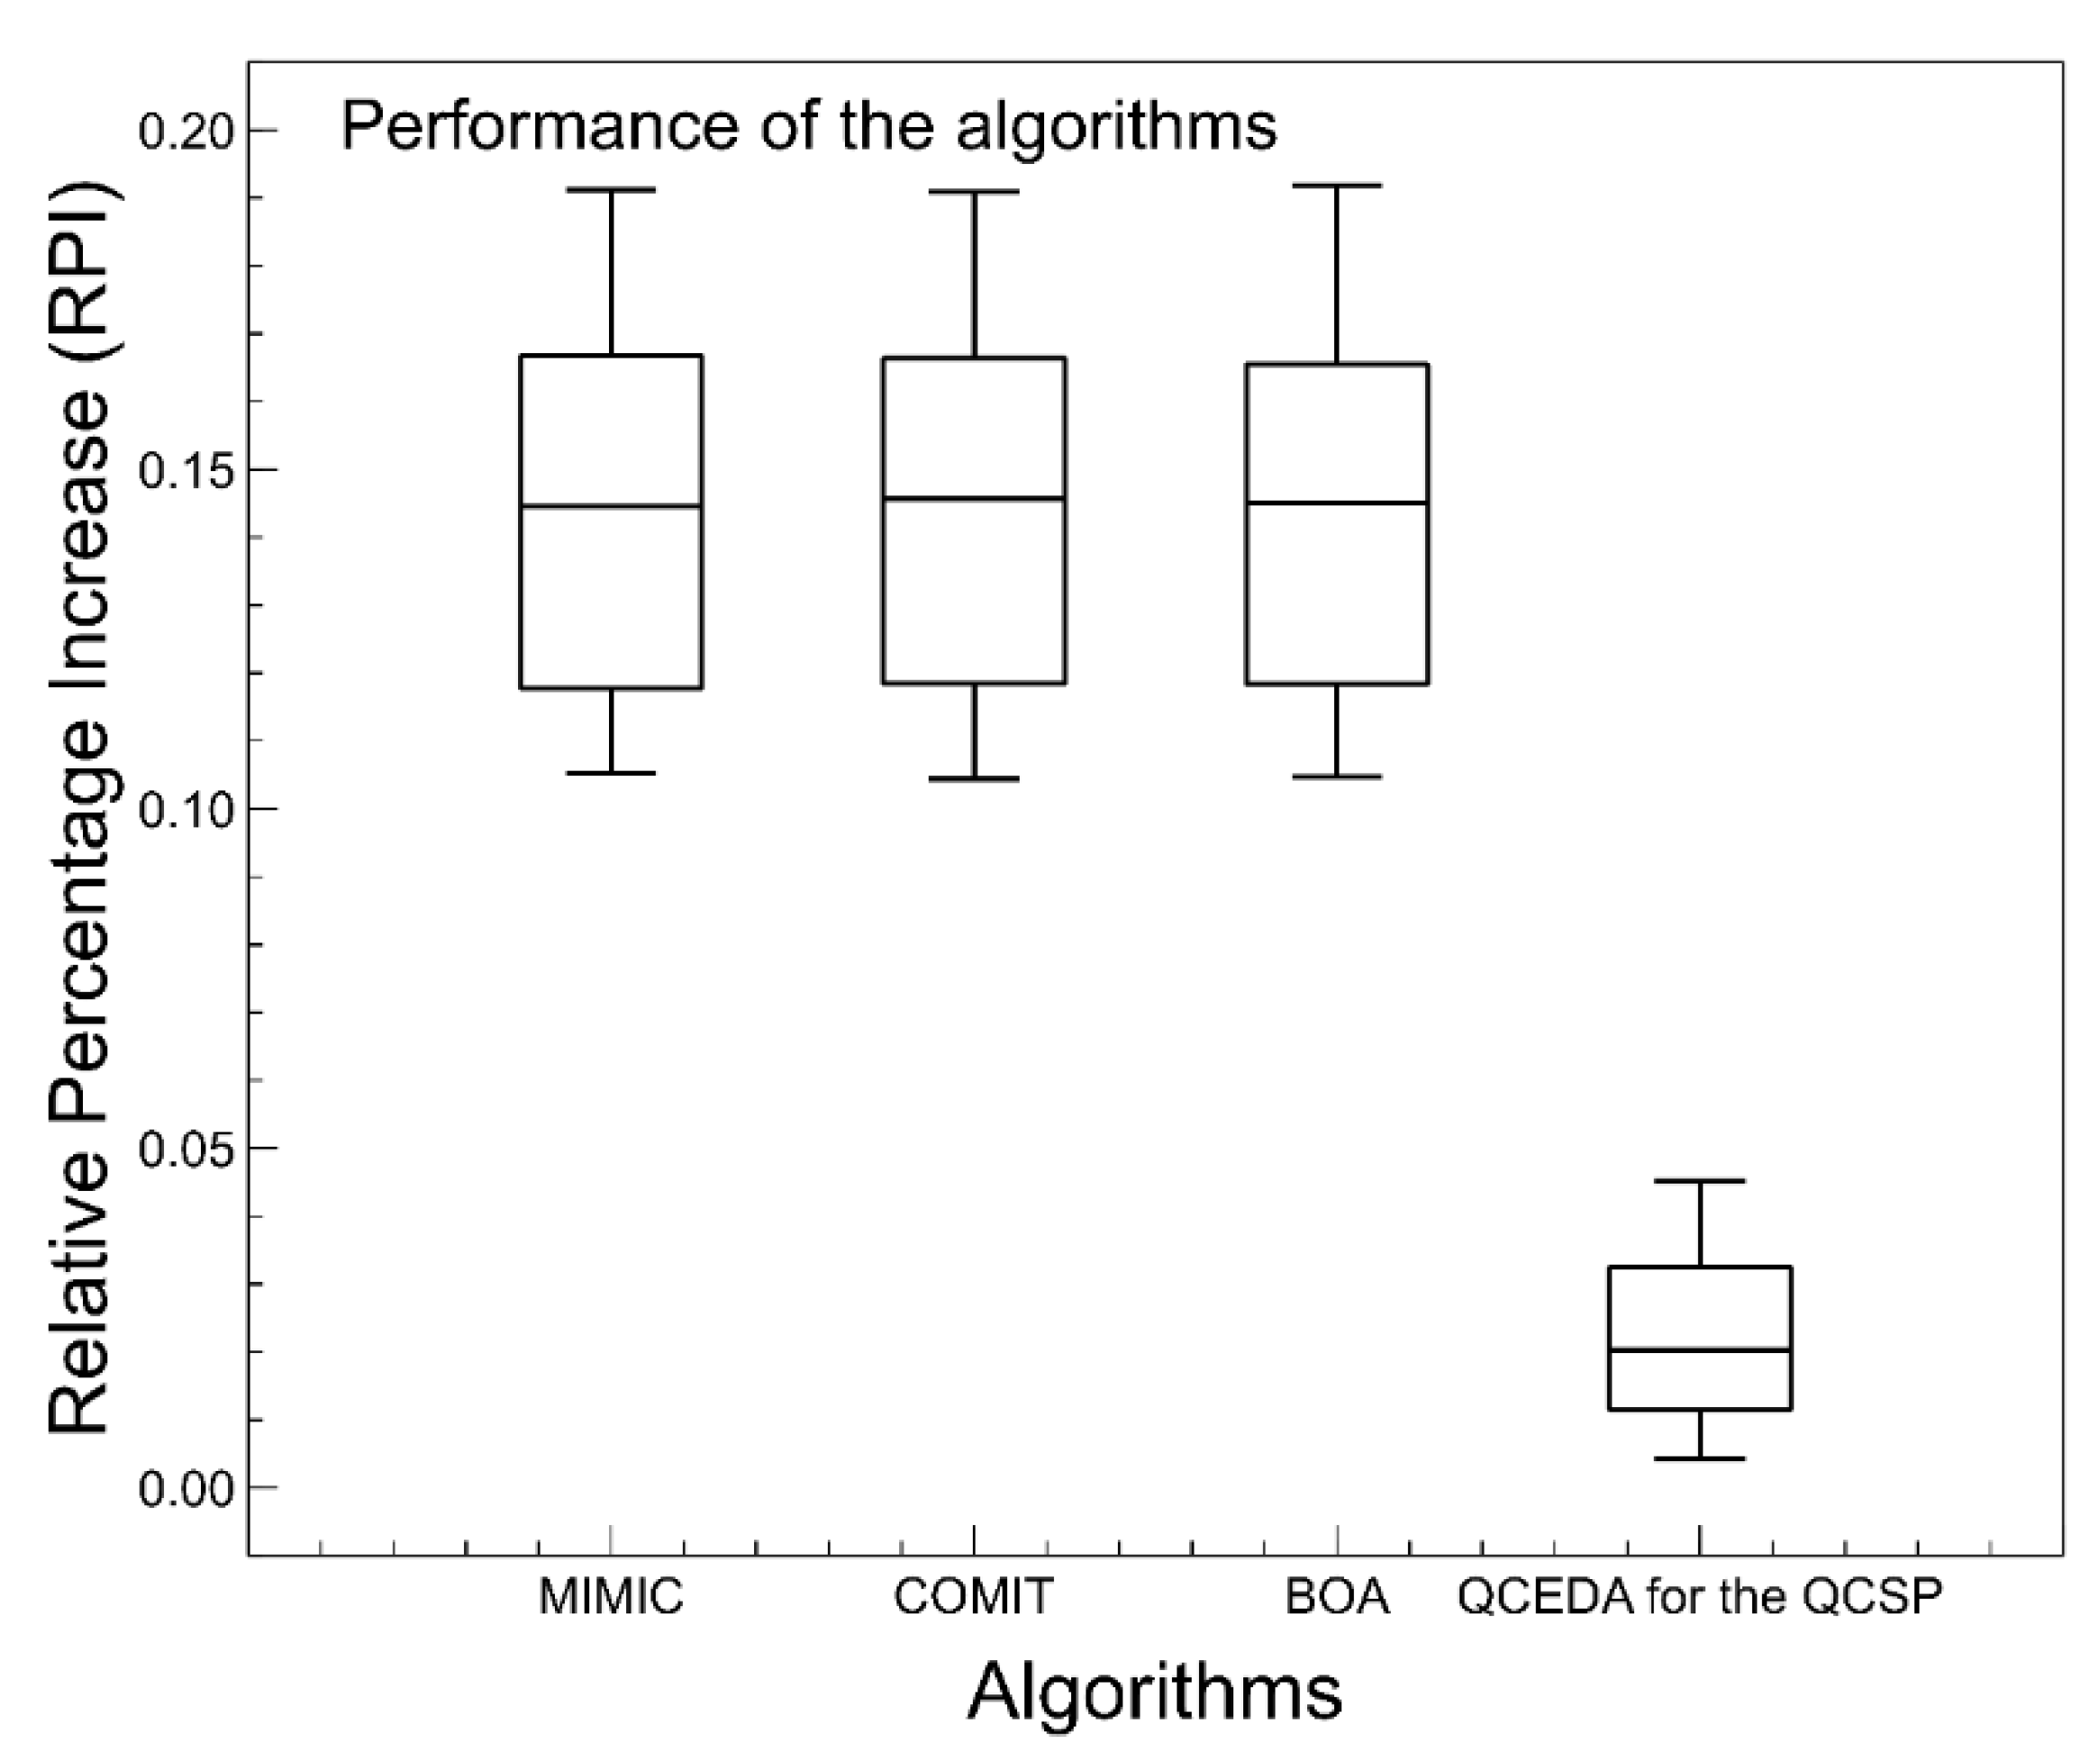
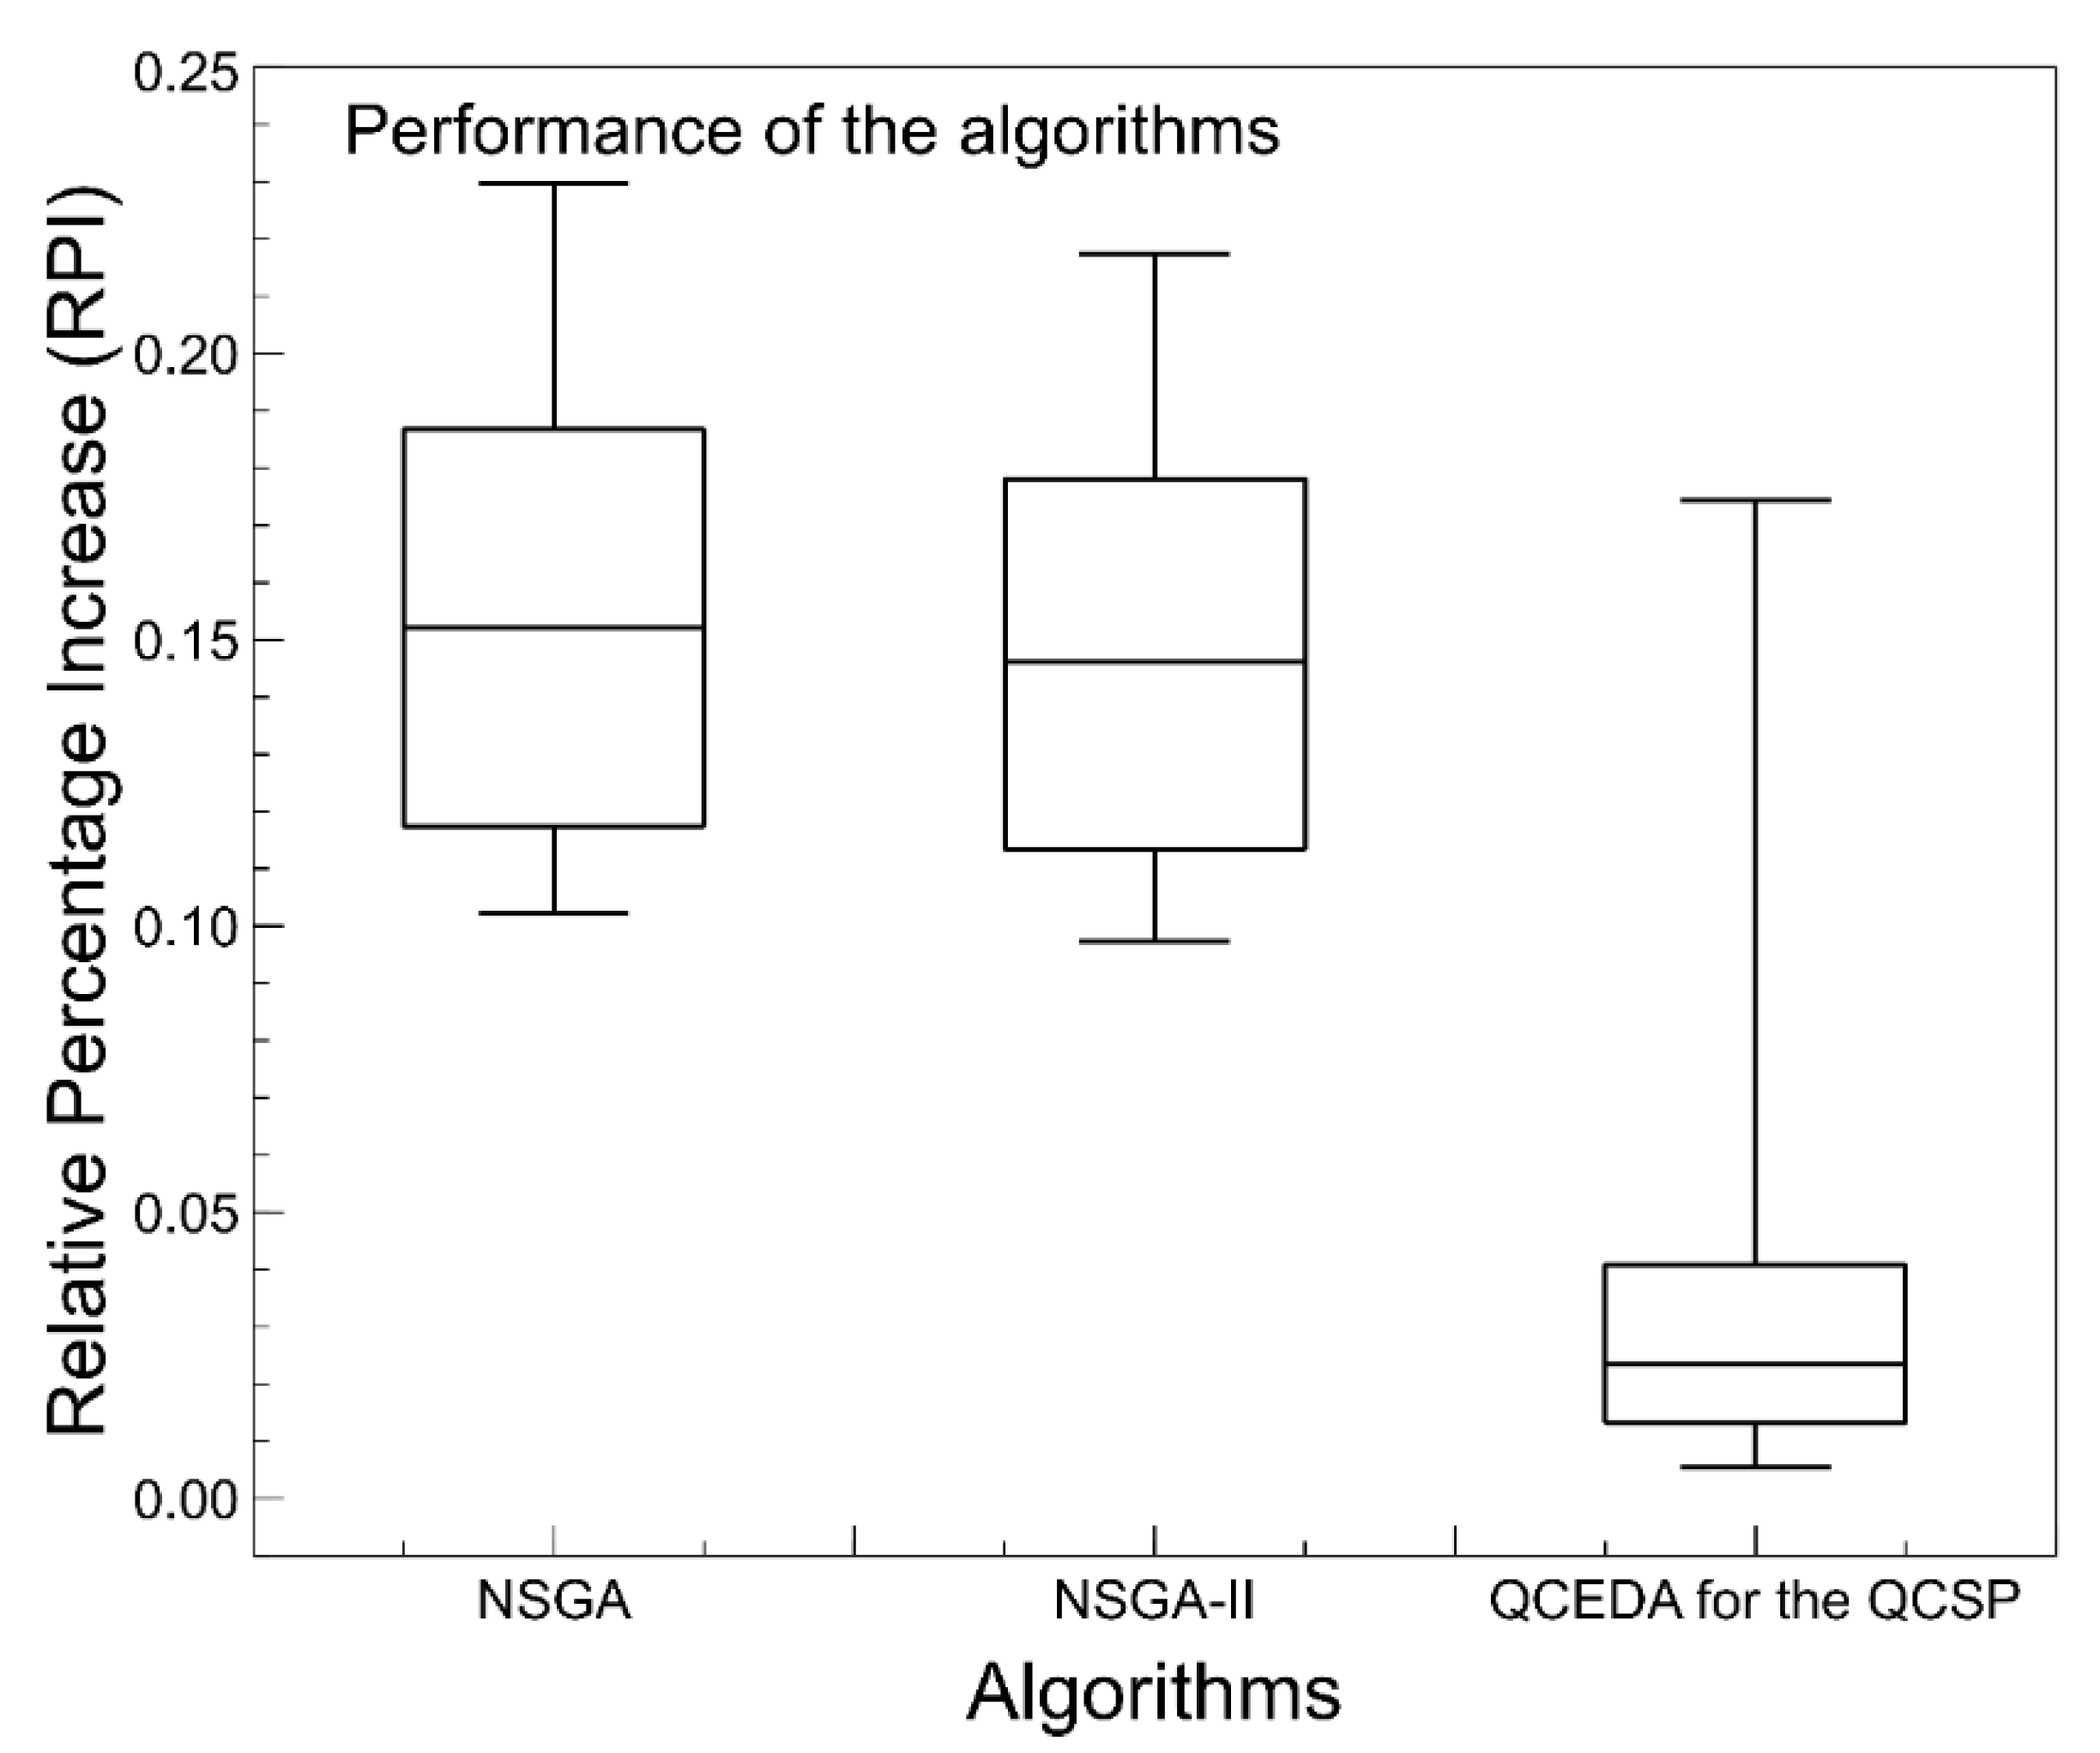
In this paper, we can visualize the importance of the effective estimation of the solution space distribution to build a competitive EDA. In addition, if we analyze the results shown in the corresponding results and comparison section, we are going to reach the conclusion that the hybridization of EDAs with other methods should practically always be considered in the design and development of such algorithms. According to the results of this research, hybridization is not only a reason for publication, it also avoids the necessity of requiring building complex probability models. If this occurs, the algorithm could be difficult to understand.
The main reason for performing this research was to determine what is most useful, i.e., the development of complex probability models or the hybridization of the EDA with other methods to obtain the same or better solutions. Most published articles, related to EDAs and to solve optimization problems, have a lack of diversity in the process of the generation of solutions. The aforementioned drawback can be tackled through the hybridization of an EDA and other methods. However, there exists a wide field of development to determine which methods are more suitable to obtain the better performance of an EDA. This research aims to use bioinspired techniques to help to reduce the deficiencies of an EDA. In addition, it is preferable that the methods used, in the hybridization process, should contain some well defined math expressions. This helps to understand how the solutions are generated. Therefore, the aim is to use new methods and to establish the search process of explicitly new solutions.
The hybridization approach used for this investigation considers a distance based ranking model coupled with a moth-flame algorithm, a novel nature inspired heuristic paradigm [23]. Therefore, the QCSP is solved by the proposed approach in order to show how hybridization helps to enhance the performance of the EDA. Distance based ranking models appear sparingly in the literature to tackle the drawback of the EDAs. There are few papers available about it. For example, Ref. [24] introduces an EDA based on a distance based ranking model for the flowshop scheduling problem. The distance based ranking model is used as a probability model in the permutations field.

1.5. The Proposed Hybrid Approach, a Brief Explanation

In this research, the members of the population are considered as rankings. Table 1 shows a ranking of five items or elements as an example.
In this sense, the members of the population are permutations of elements. A ranking defines a solution for the problem to solve. Table 2 depicts some rankings as flowshop-scheduling solutions, where each item represents a job, and then a processing sequence is executed according to each ranking.
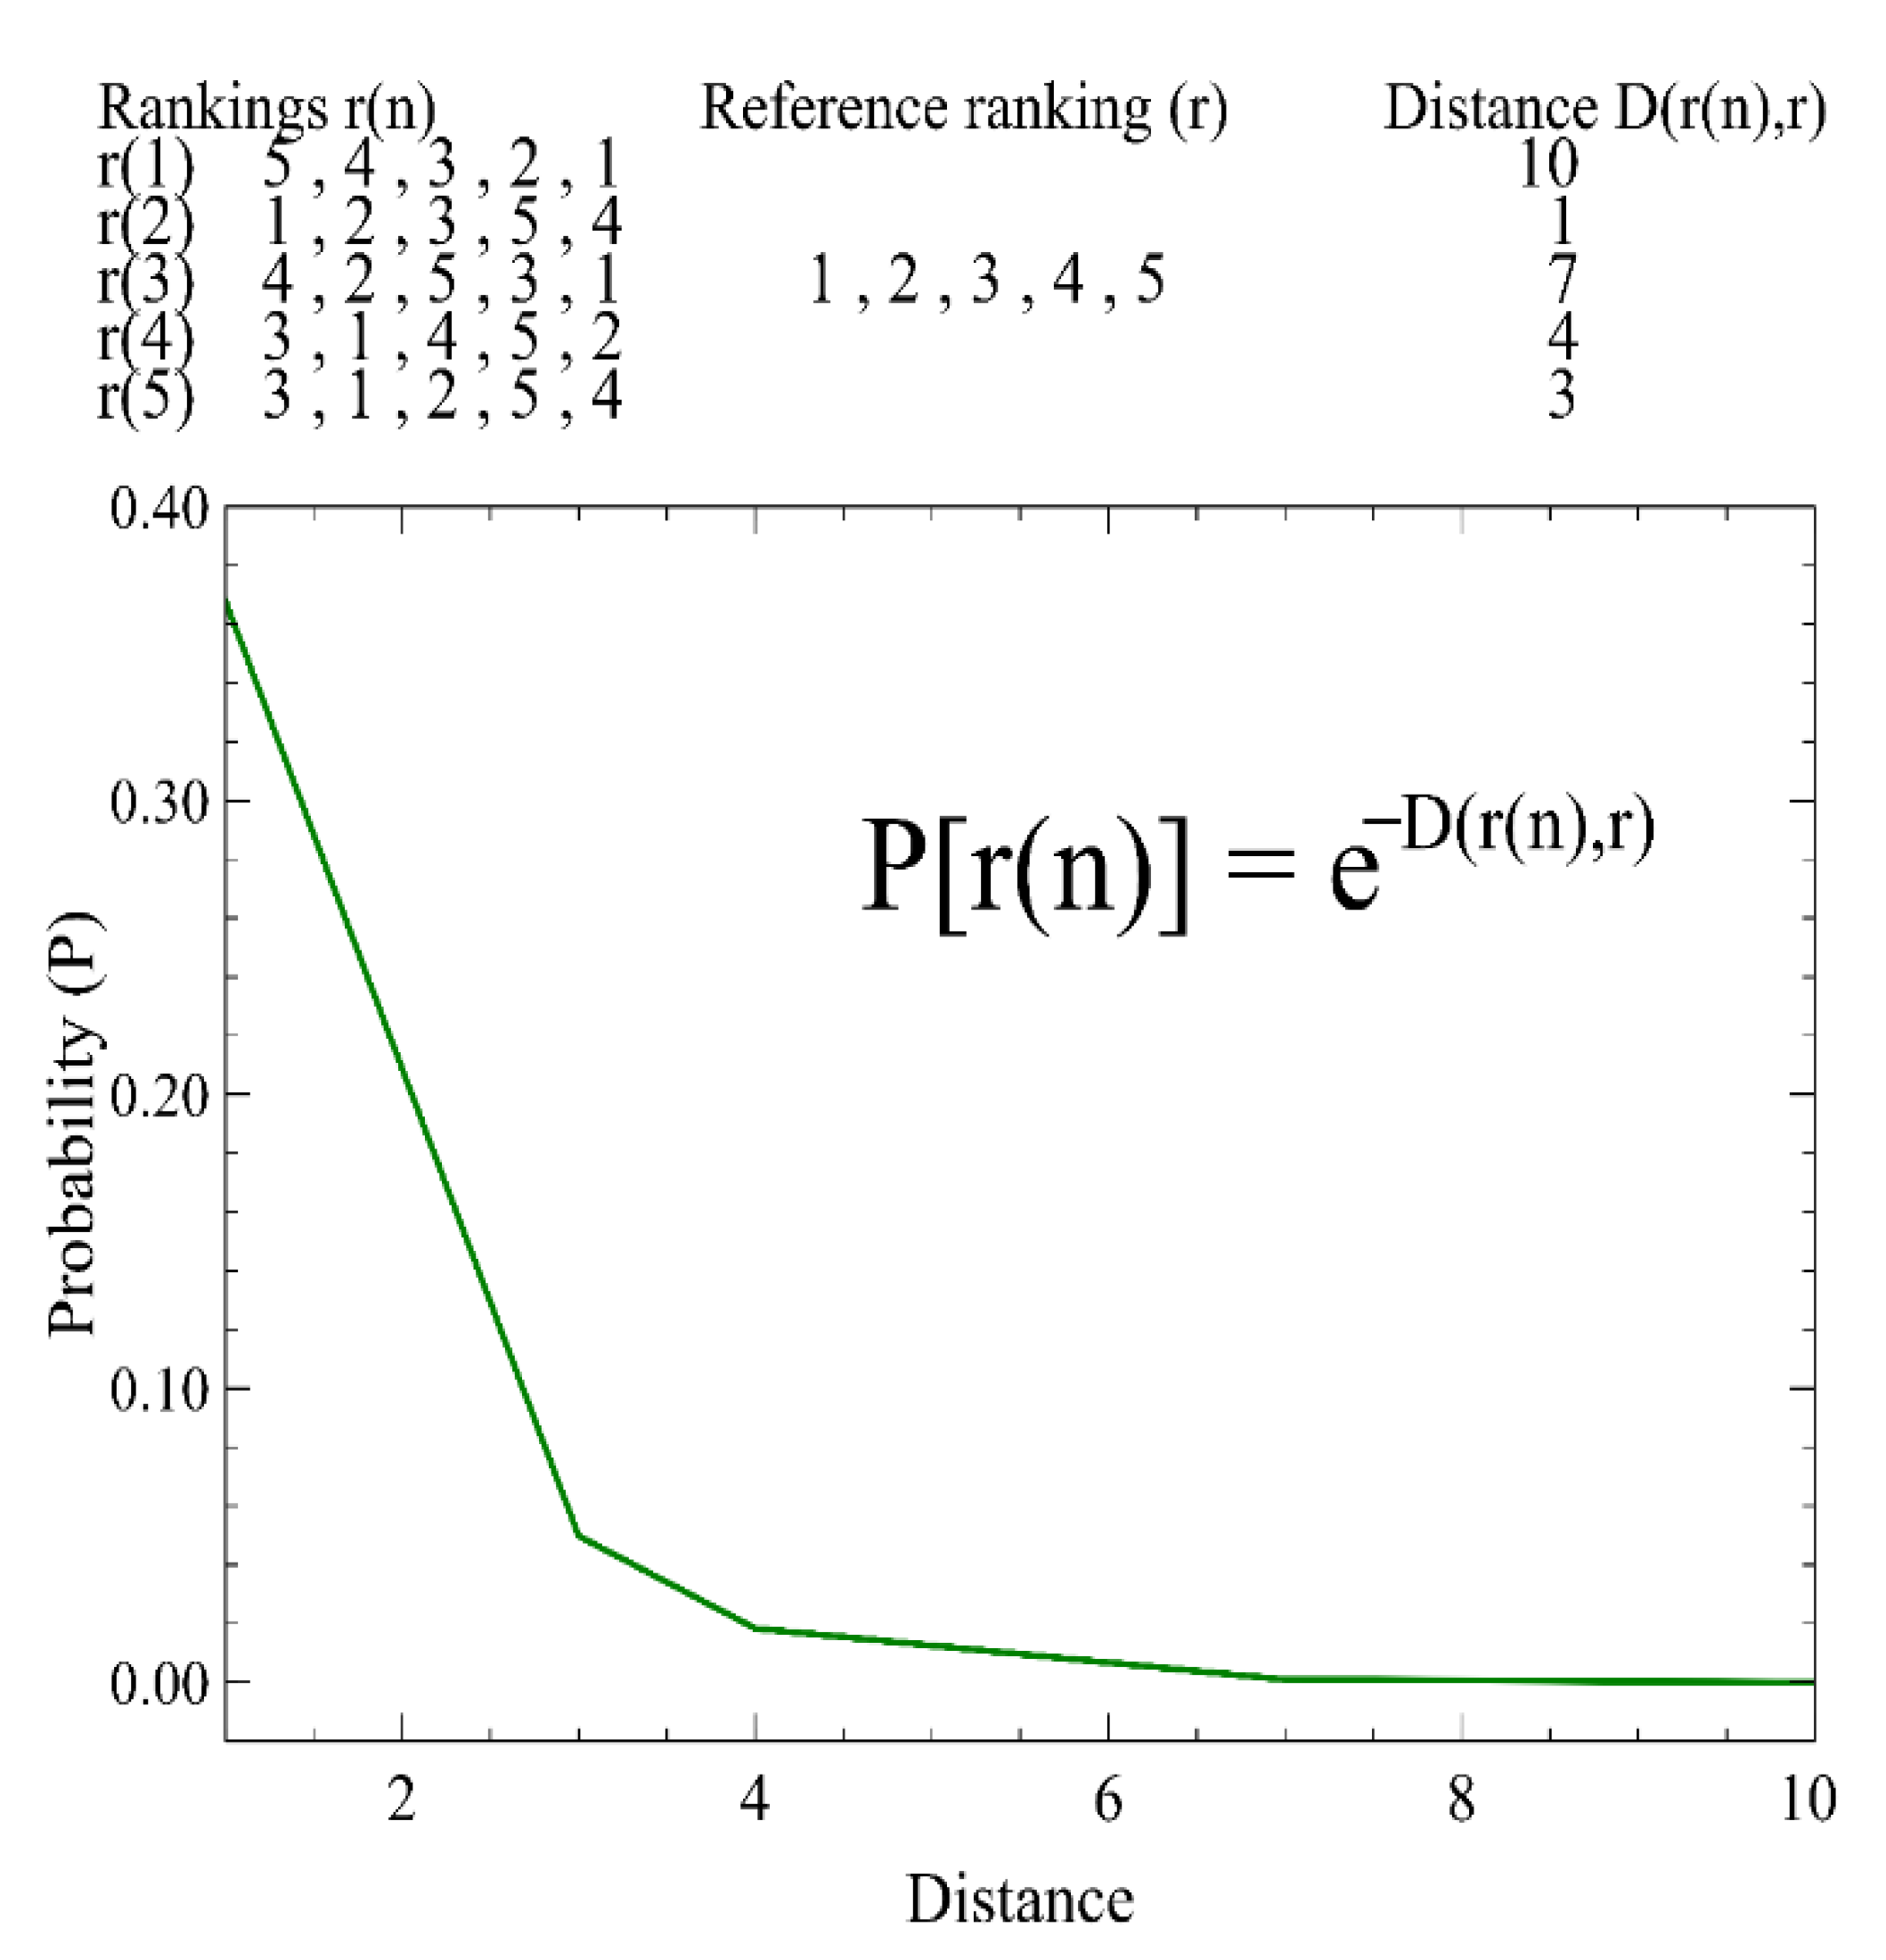
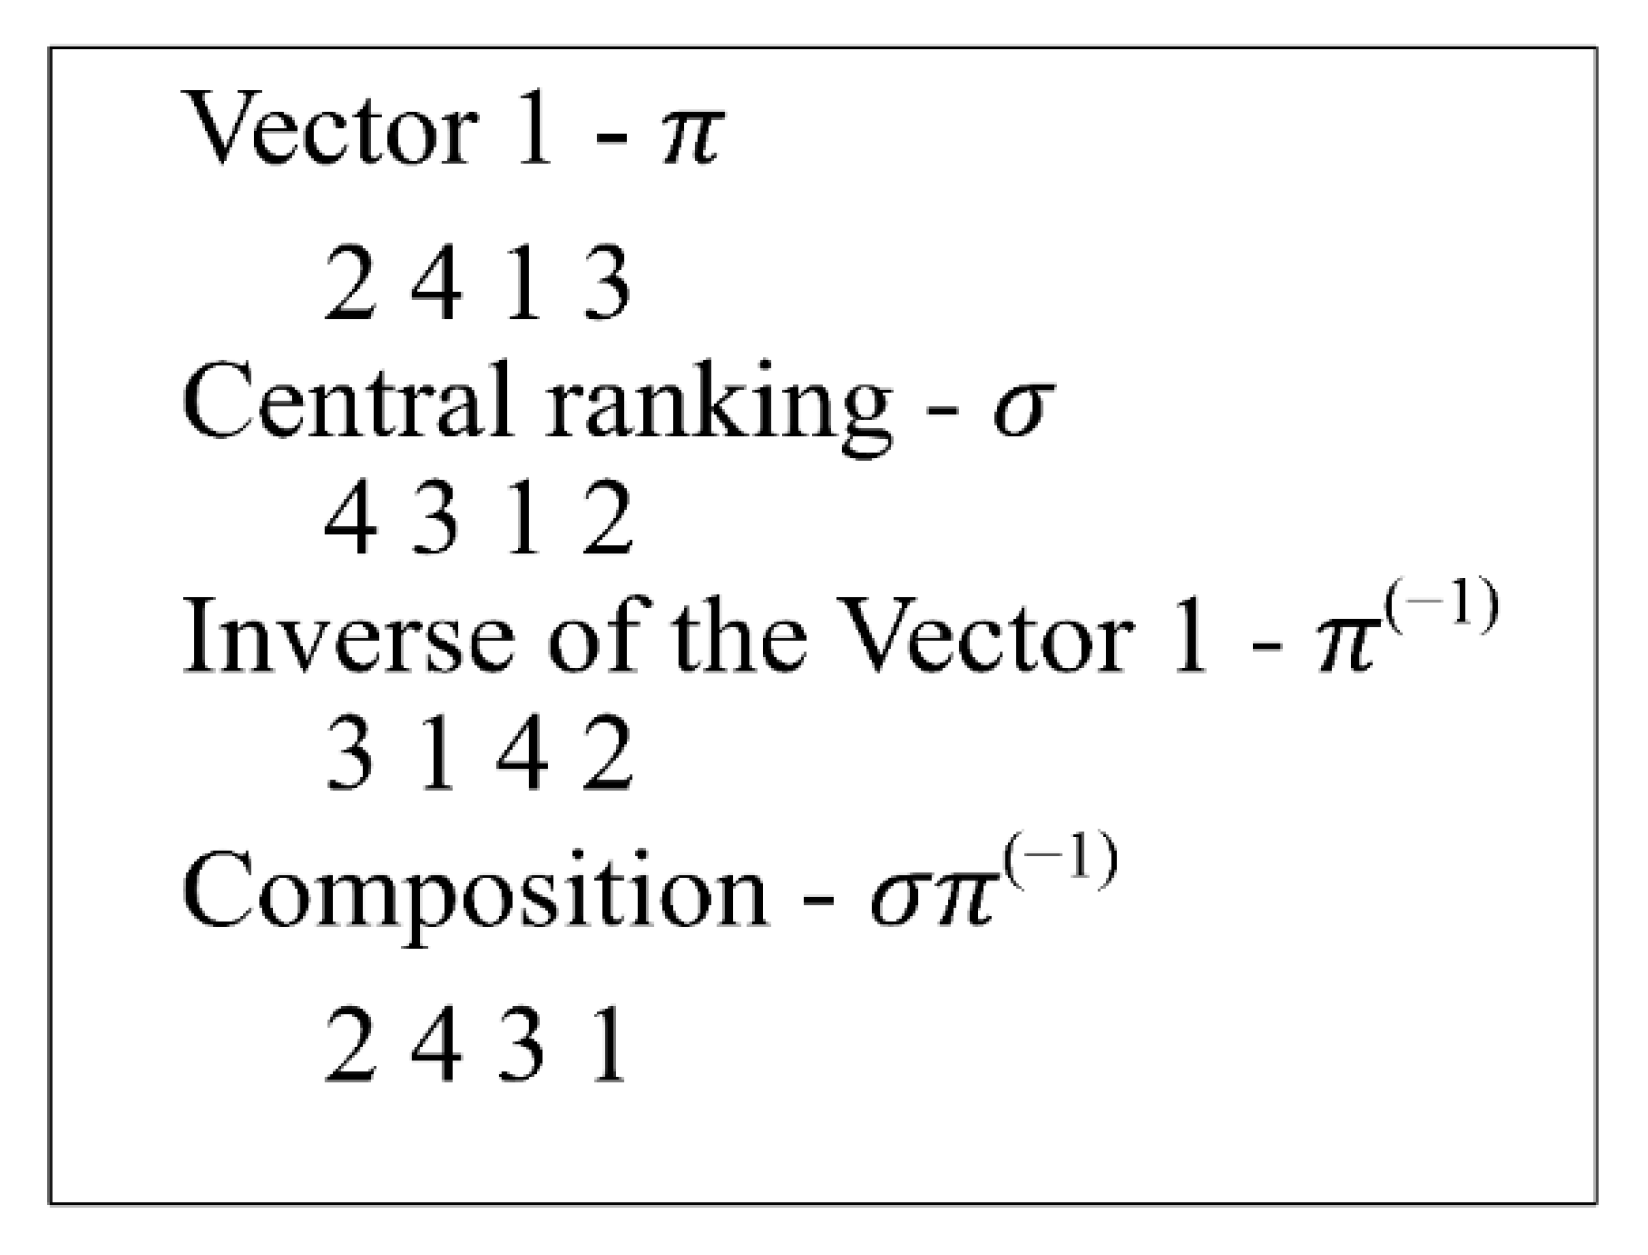
Then, a distance metric is computed between rankings, by the algebra of permutations. After that, a distribution probability is built, i.e., an exponential distribution. The aforementioned exponential distribution occupies, as an input parameter, the distance between each of the permutations and a reference permutation. A known distance based ranking model is the model of [25]. In general terms, it concerns assigning a probability to each permutation that declines exponentially based on its distance from a reference permutation. It is then said that such a permutation is more (or less) likely to be chosen as a good solution, according to the [25]’s model. Figure 1 illustrates such a distribution, with five rankings.
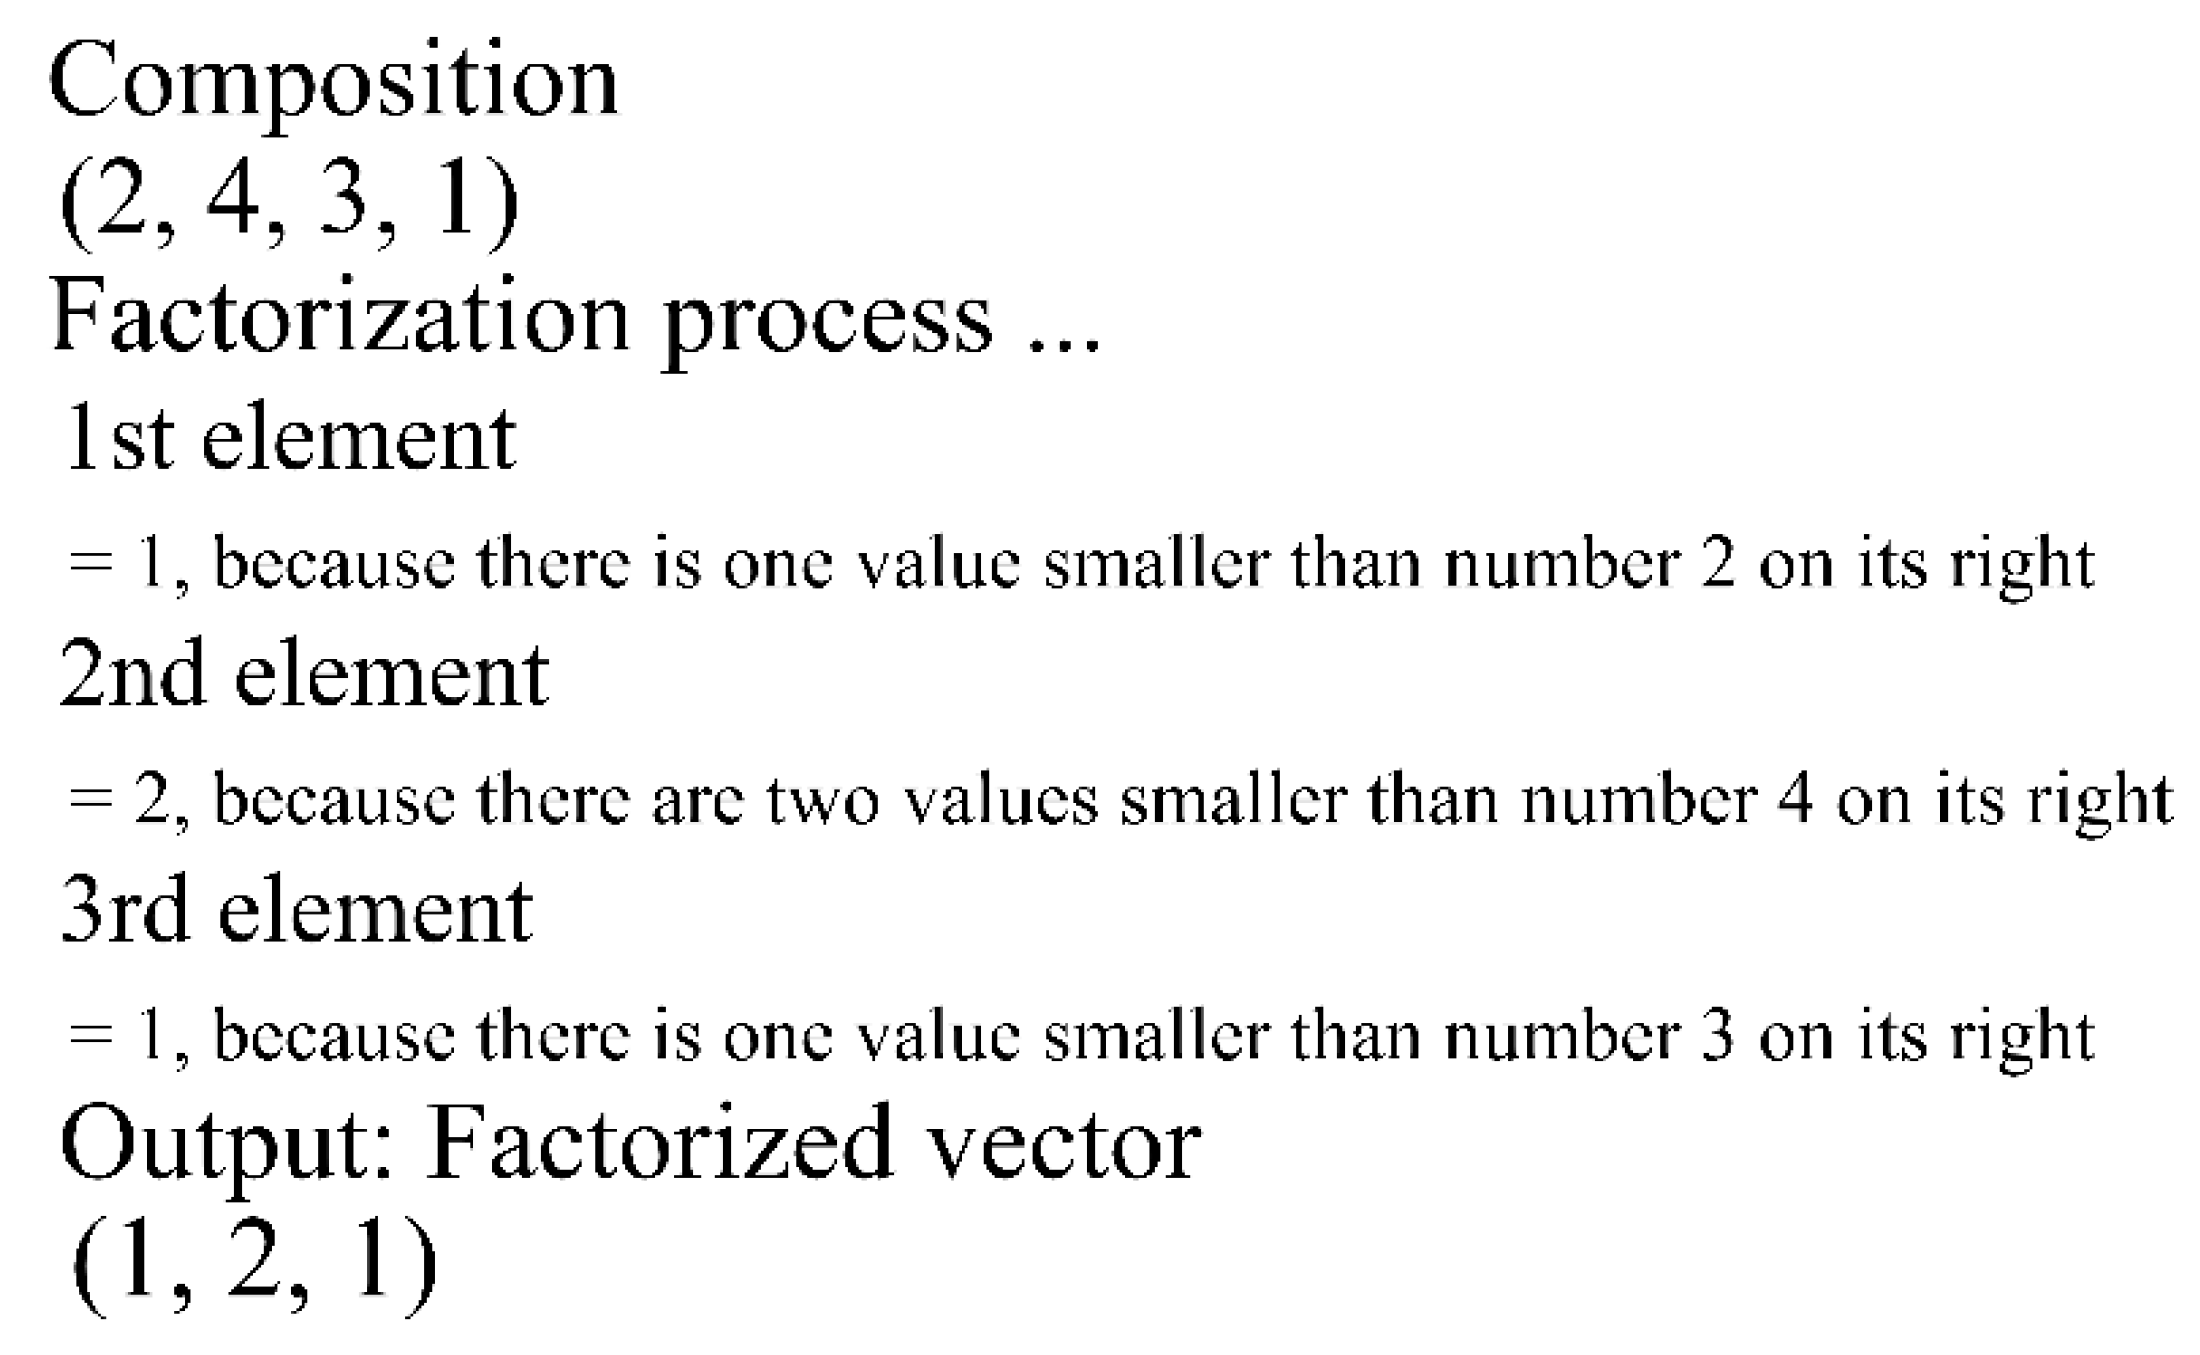
However, [25]’s model is not able to generate offspring by itself. The reason is because there can be many permutations with the same distance to the reference permutation. This causes confusion regarding which permutation is the offspring. It is solved by the factorization (decomposition) of the distance previously obtained. The factorization is computed by a procedure called GMD (the Generalized Mallows Model), proposed by [26,27]. Such authors propose how to factorize in n 1 elements, the distance between two rankings where n is the size of the rankings. With that factorization, it is possible to obtain the offspring. Table 3 details such factorization.
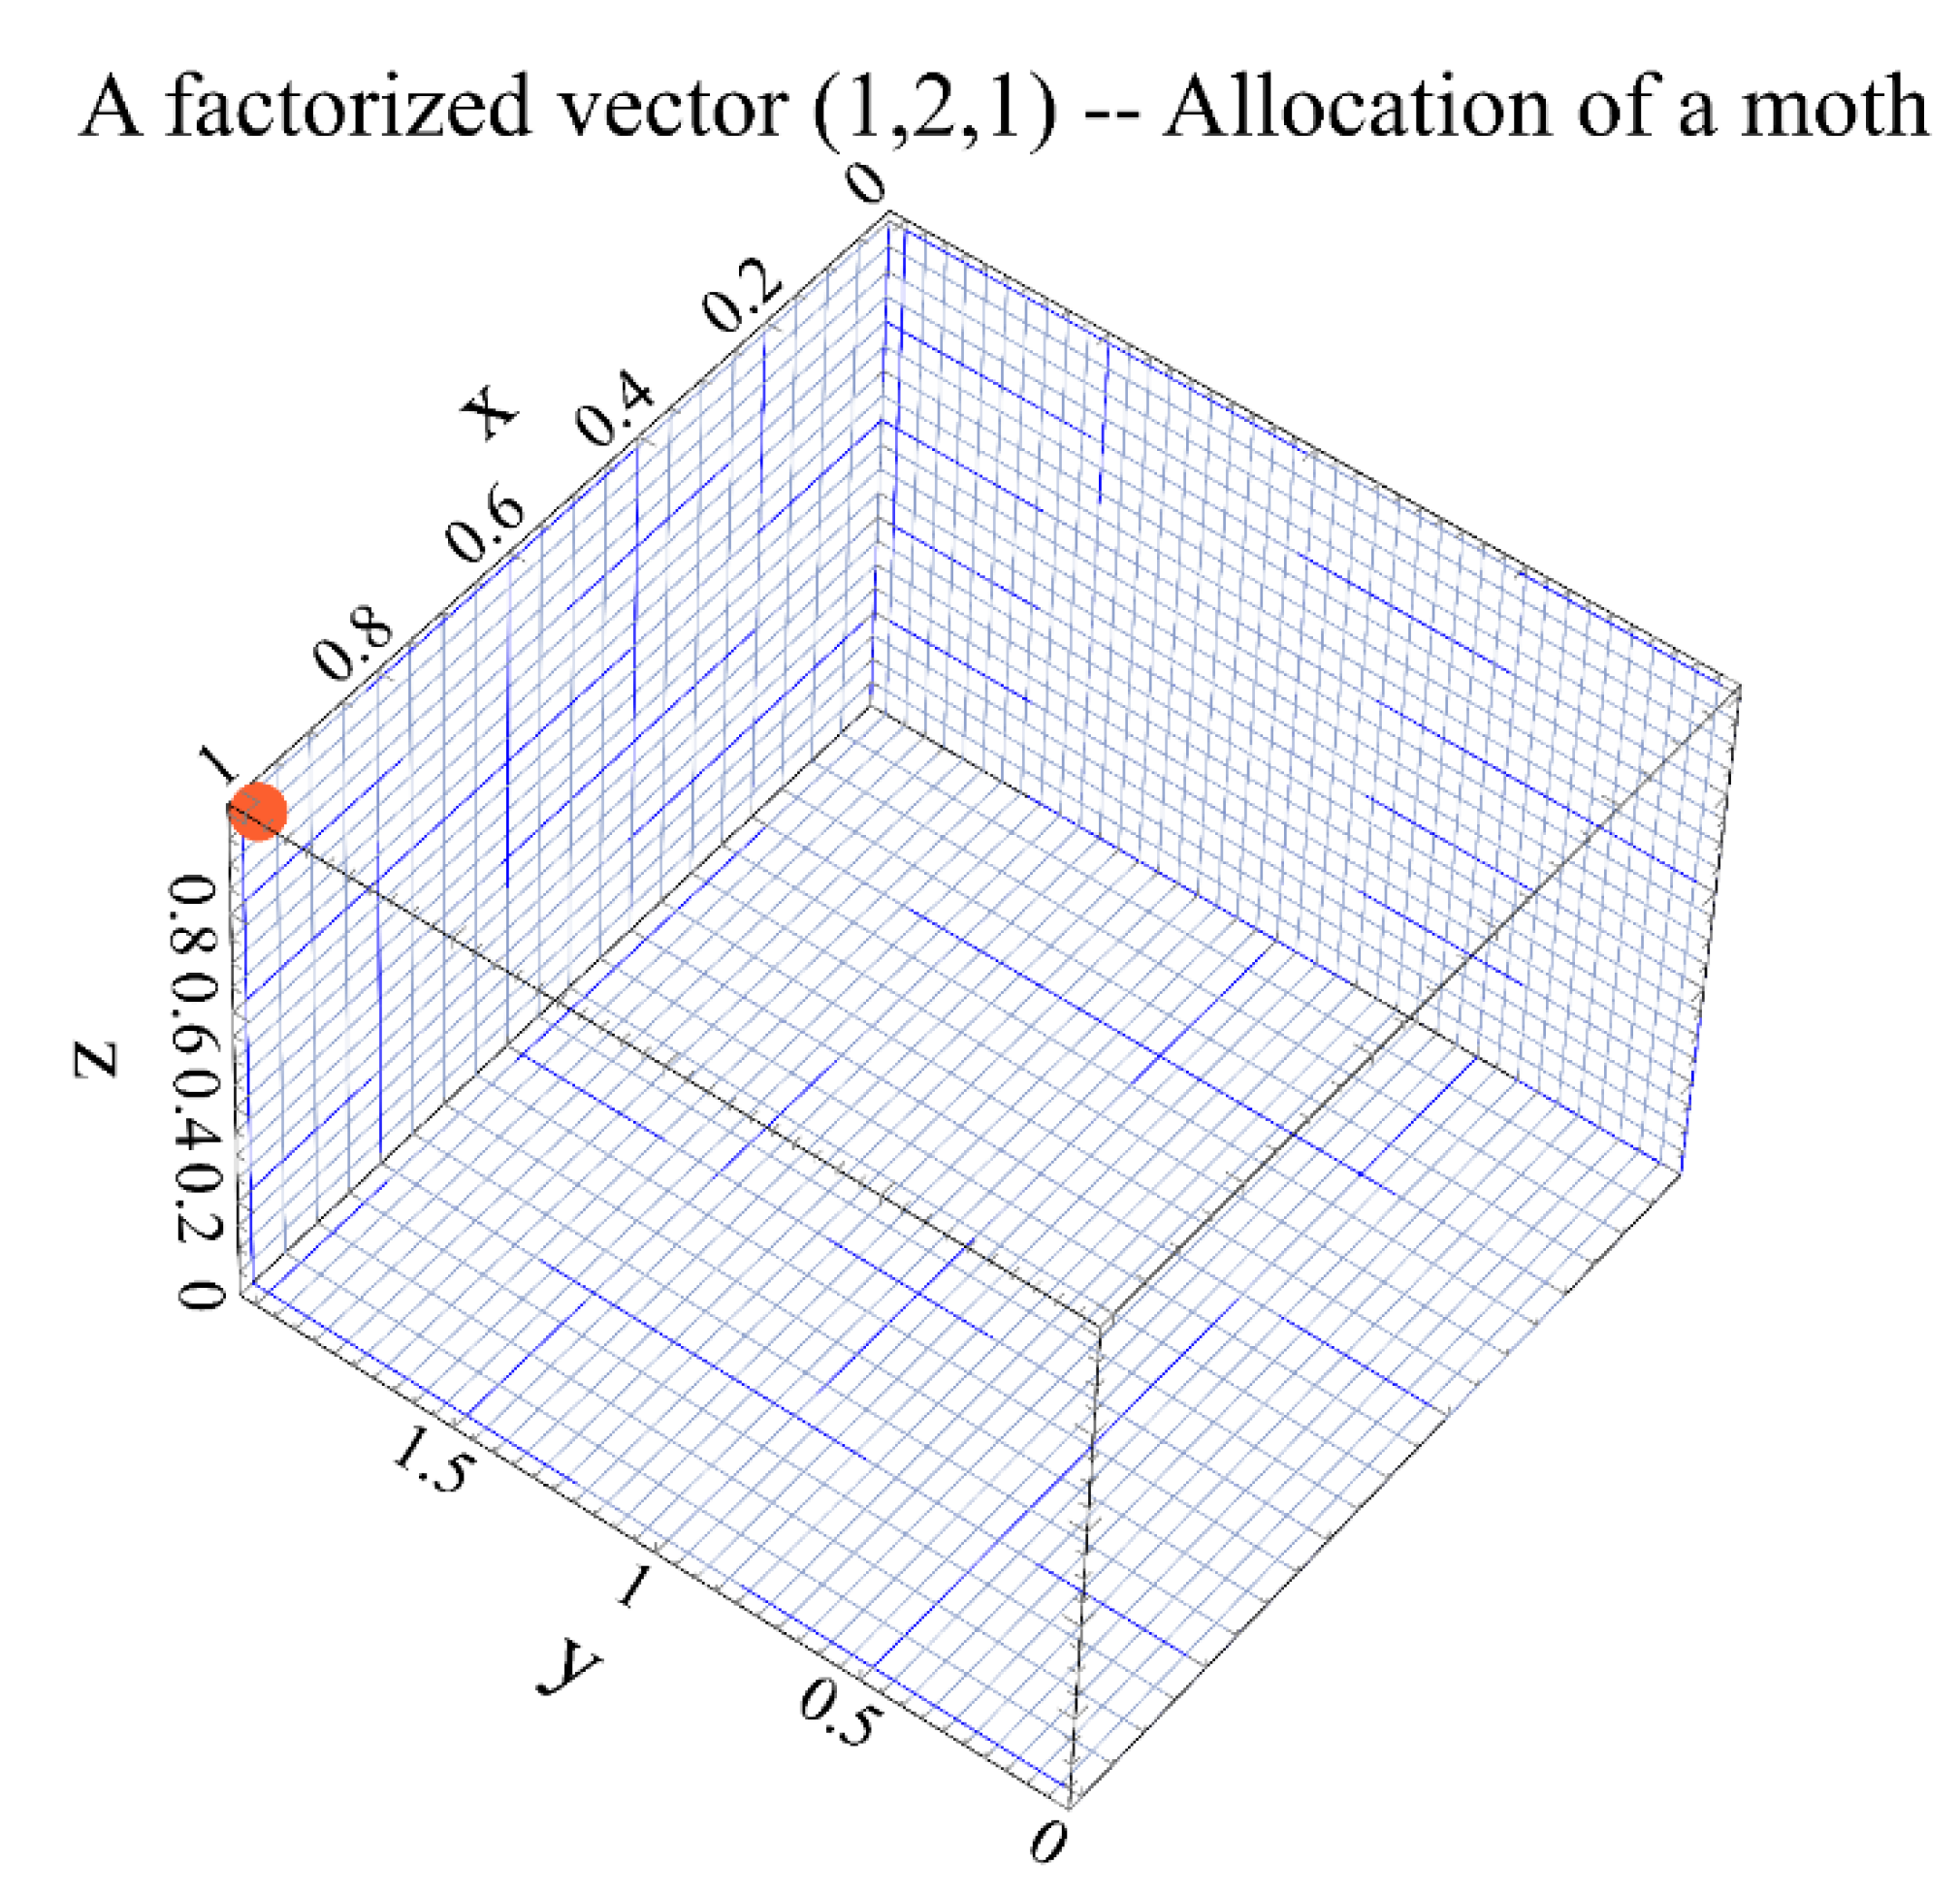
Then, such factorization (decomposition) serves as input parameter in the moth-flame heuristic to generate new offspring. Based on the results obtained in this study, it is more efficient to produce new and better offspring through such hybridization. The novelty of this study is to show how this hybridization is better than the direct use of a distance based ranking model.
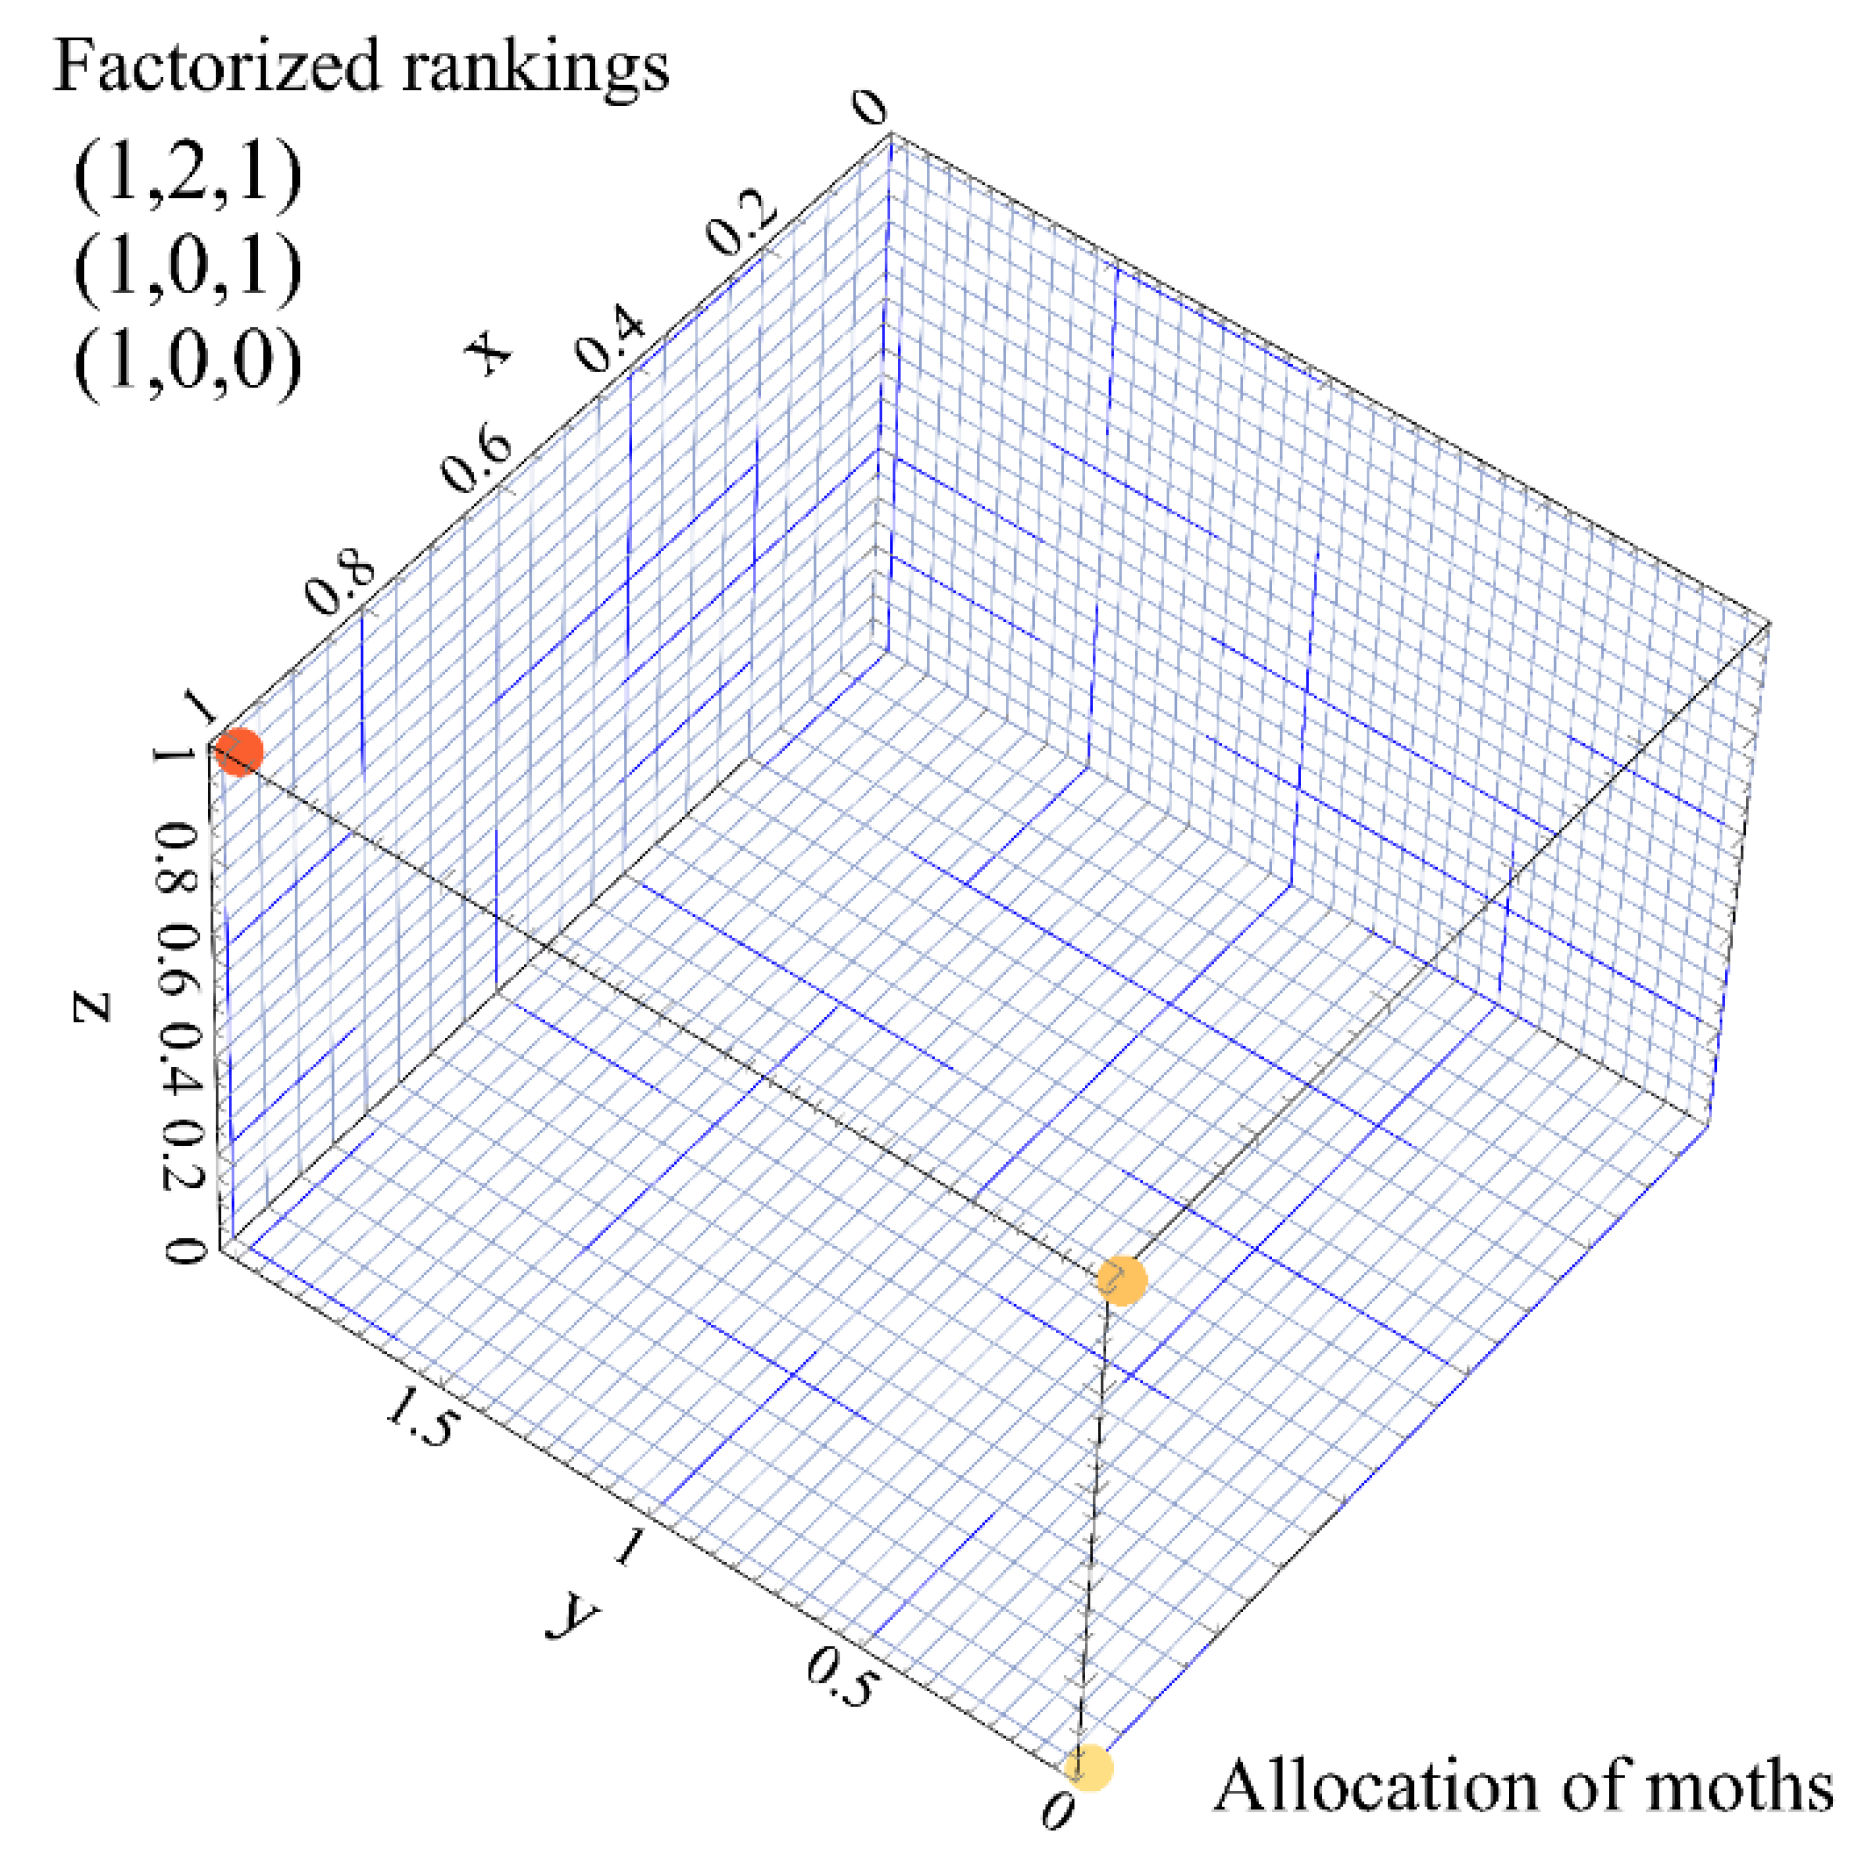
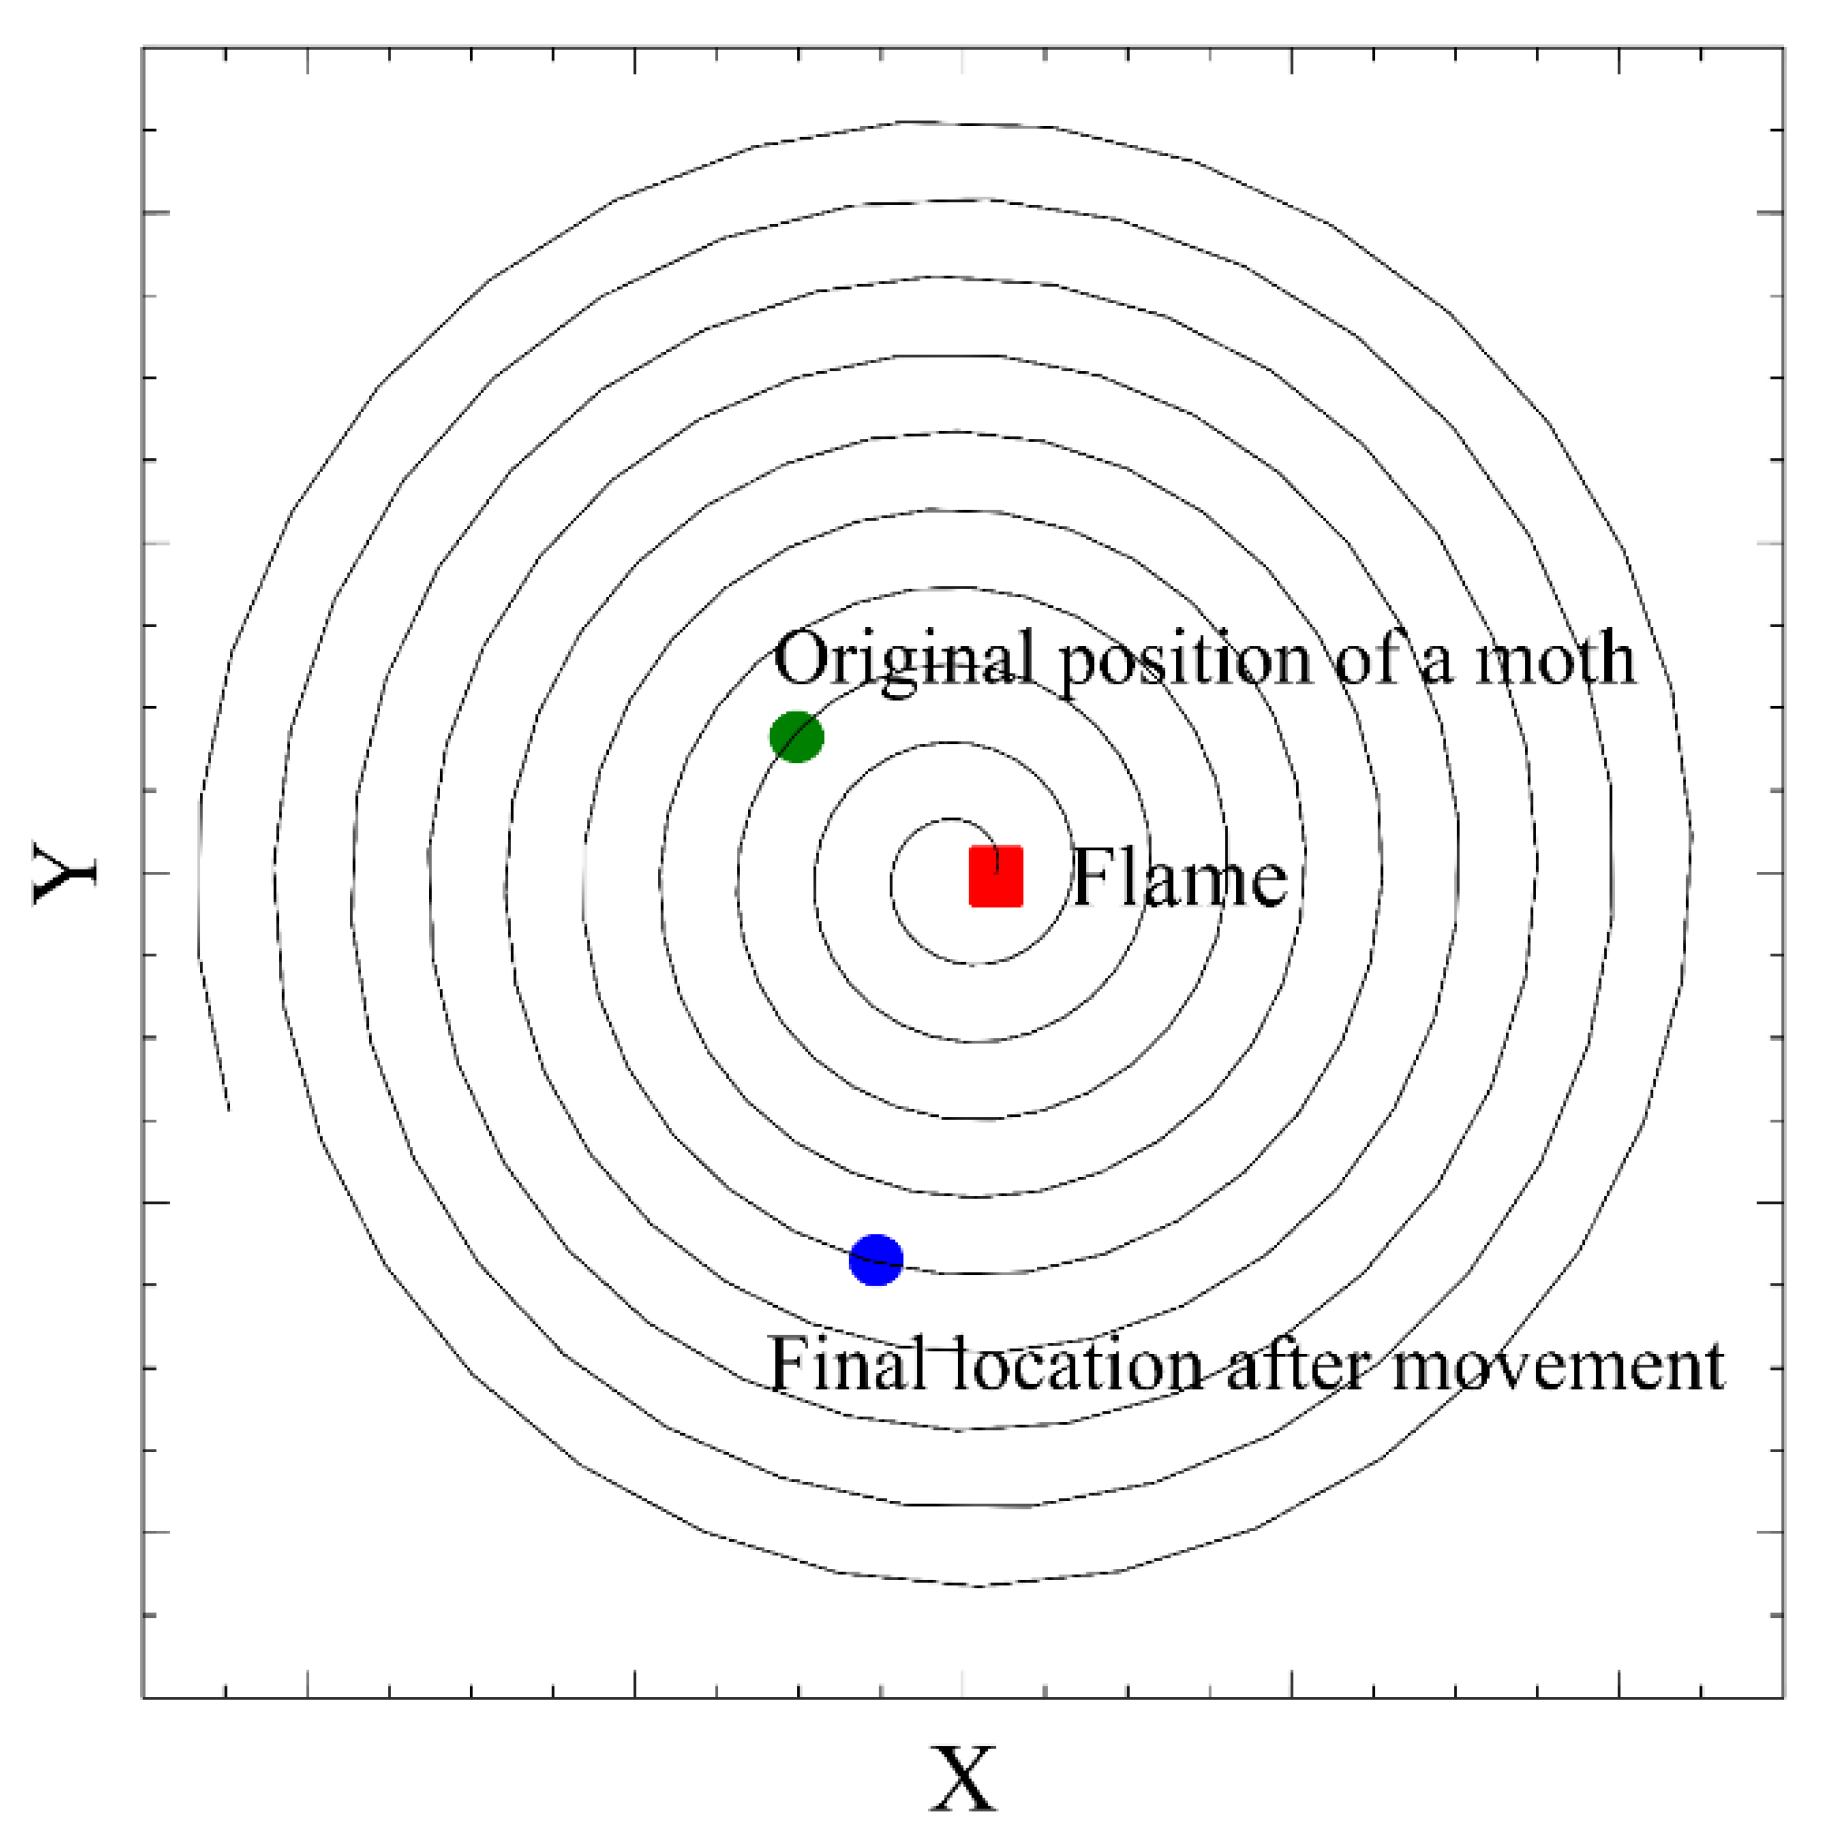
Roughly, the factorization (decomposition) obtained in the previous step is used to determine where a moth is located in the solution space. That is, the decomposition of the distance between rankings (permutations) is seen as a moth’s location coordinate in the feasible space of solutions. Figure 2 shows such factorized rankings, and the moths´ location coordinates.
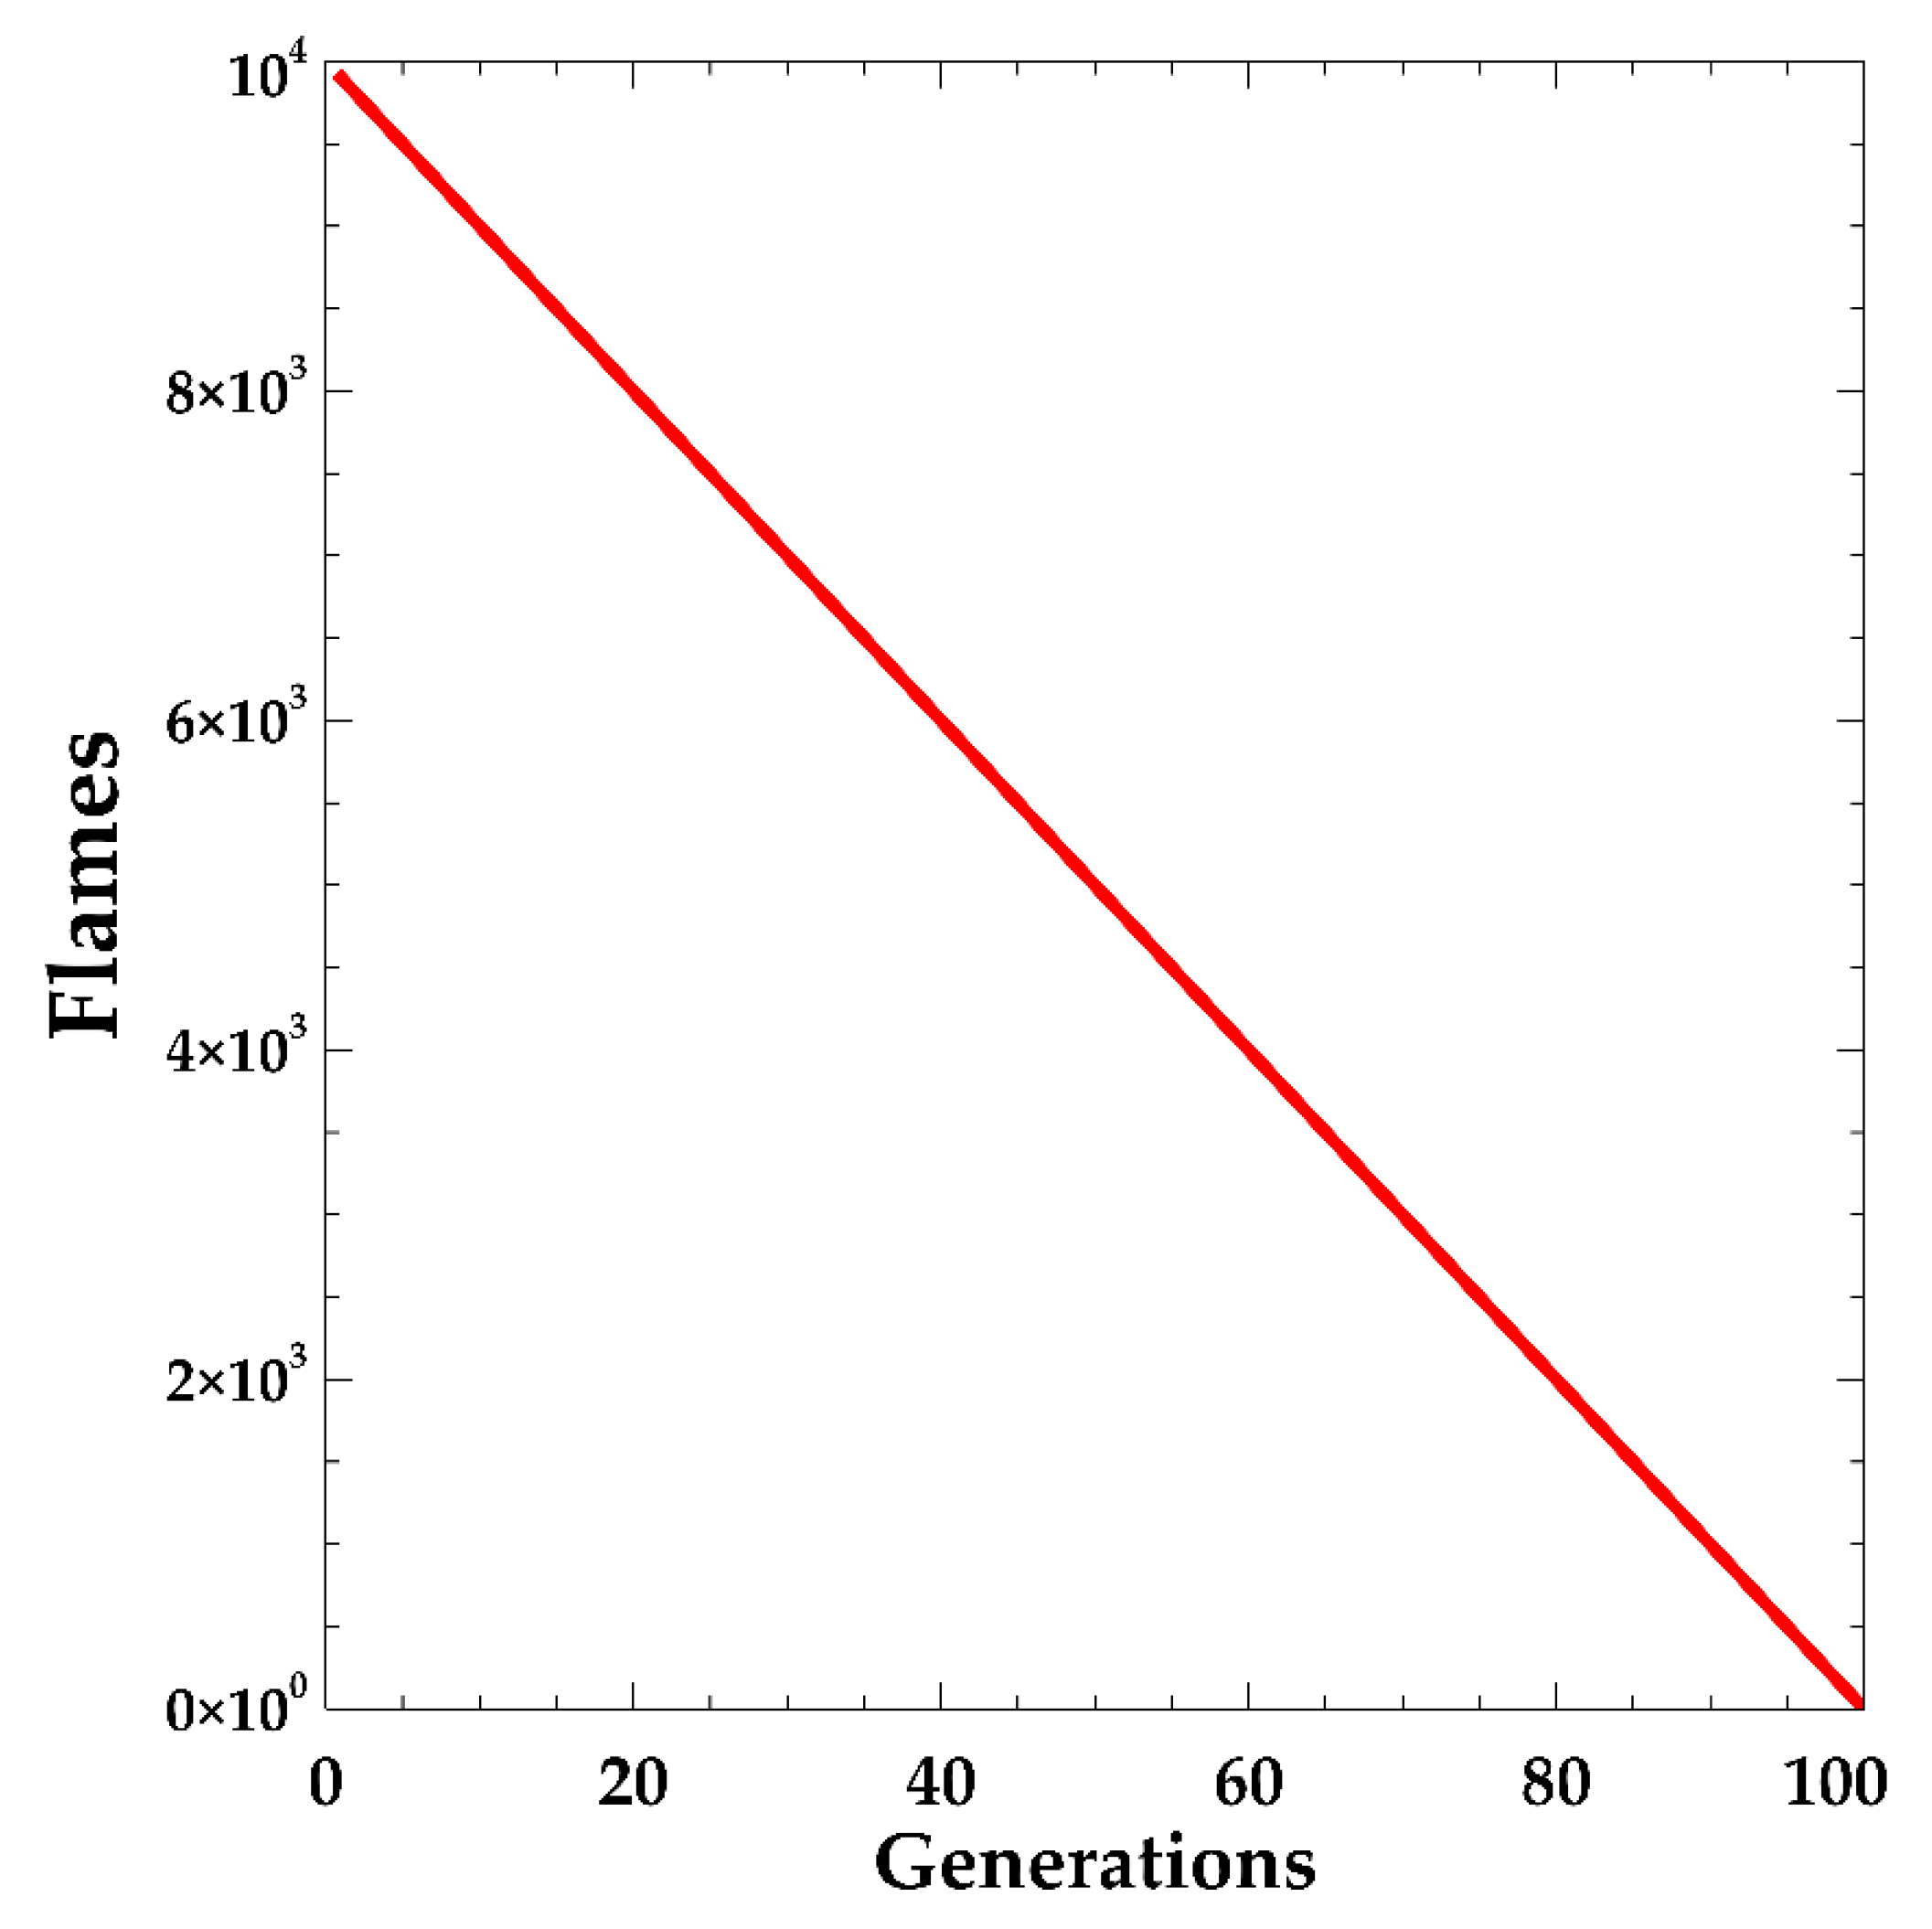
A moth is a search agent that moves in a feasible space, whereas a flame is located at the best position obtained so far [23]. A spiral-flying path, using a defined mathematical model, of moths around flames is the way to execute the movement of the moths to new locations. Thus, the GMD is in charge of modelling the solution space distribution; meanwhile the heuristic moth-flame is in charge of determining who would be the offspring. That is how this proposed algorithm works to enhance the results obtained from those algorithms that use complex probability models.
The rest of the paper is organized as follows. Section 2 reviews the literature of EDAs and different approaches to tackle the problem. 
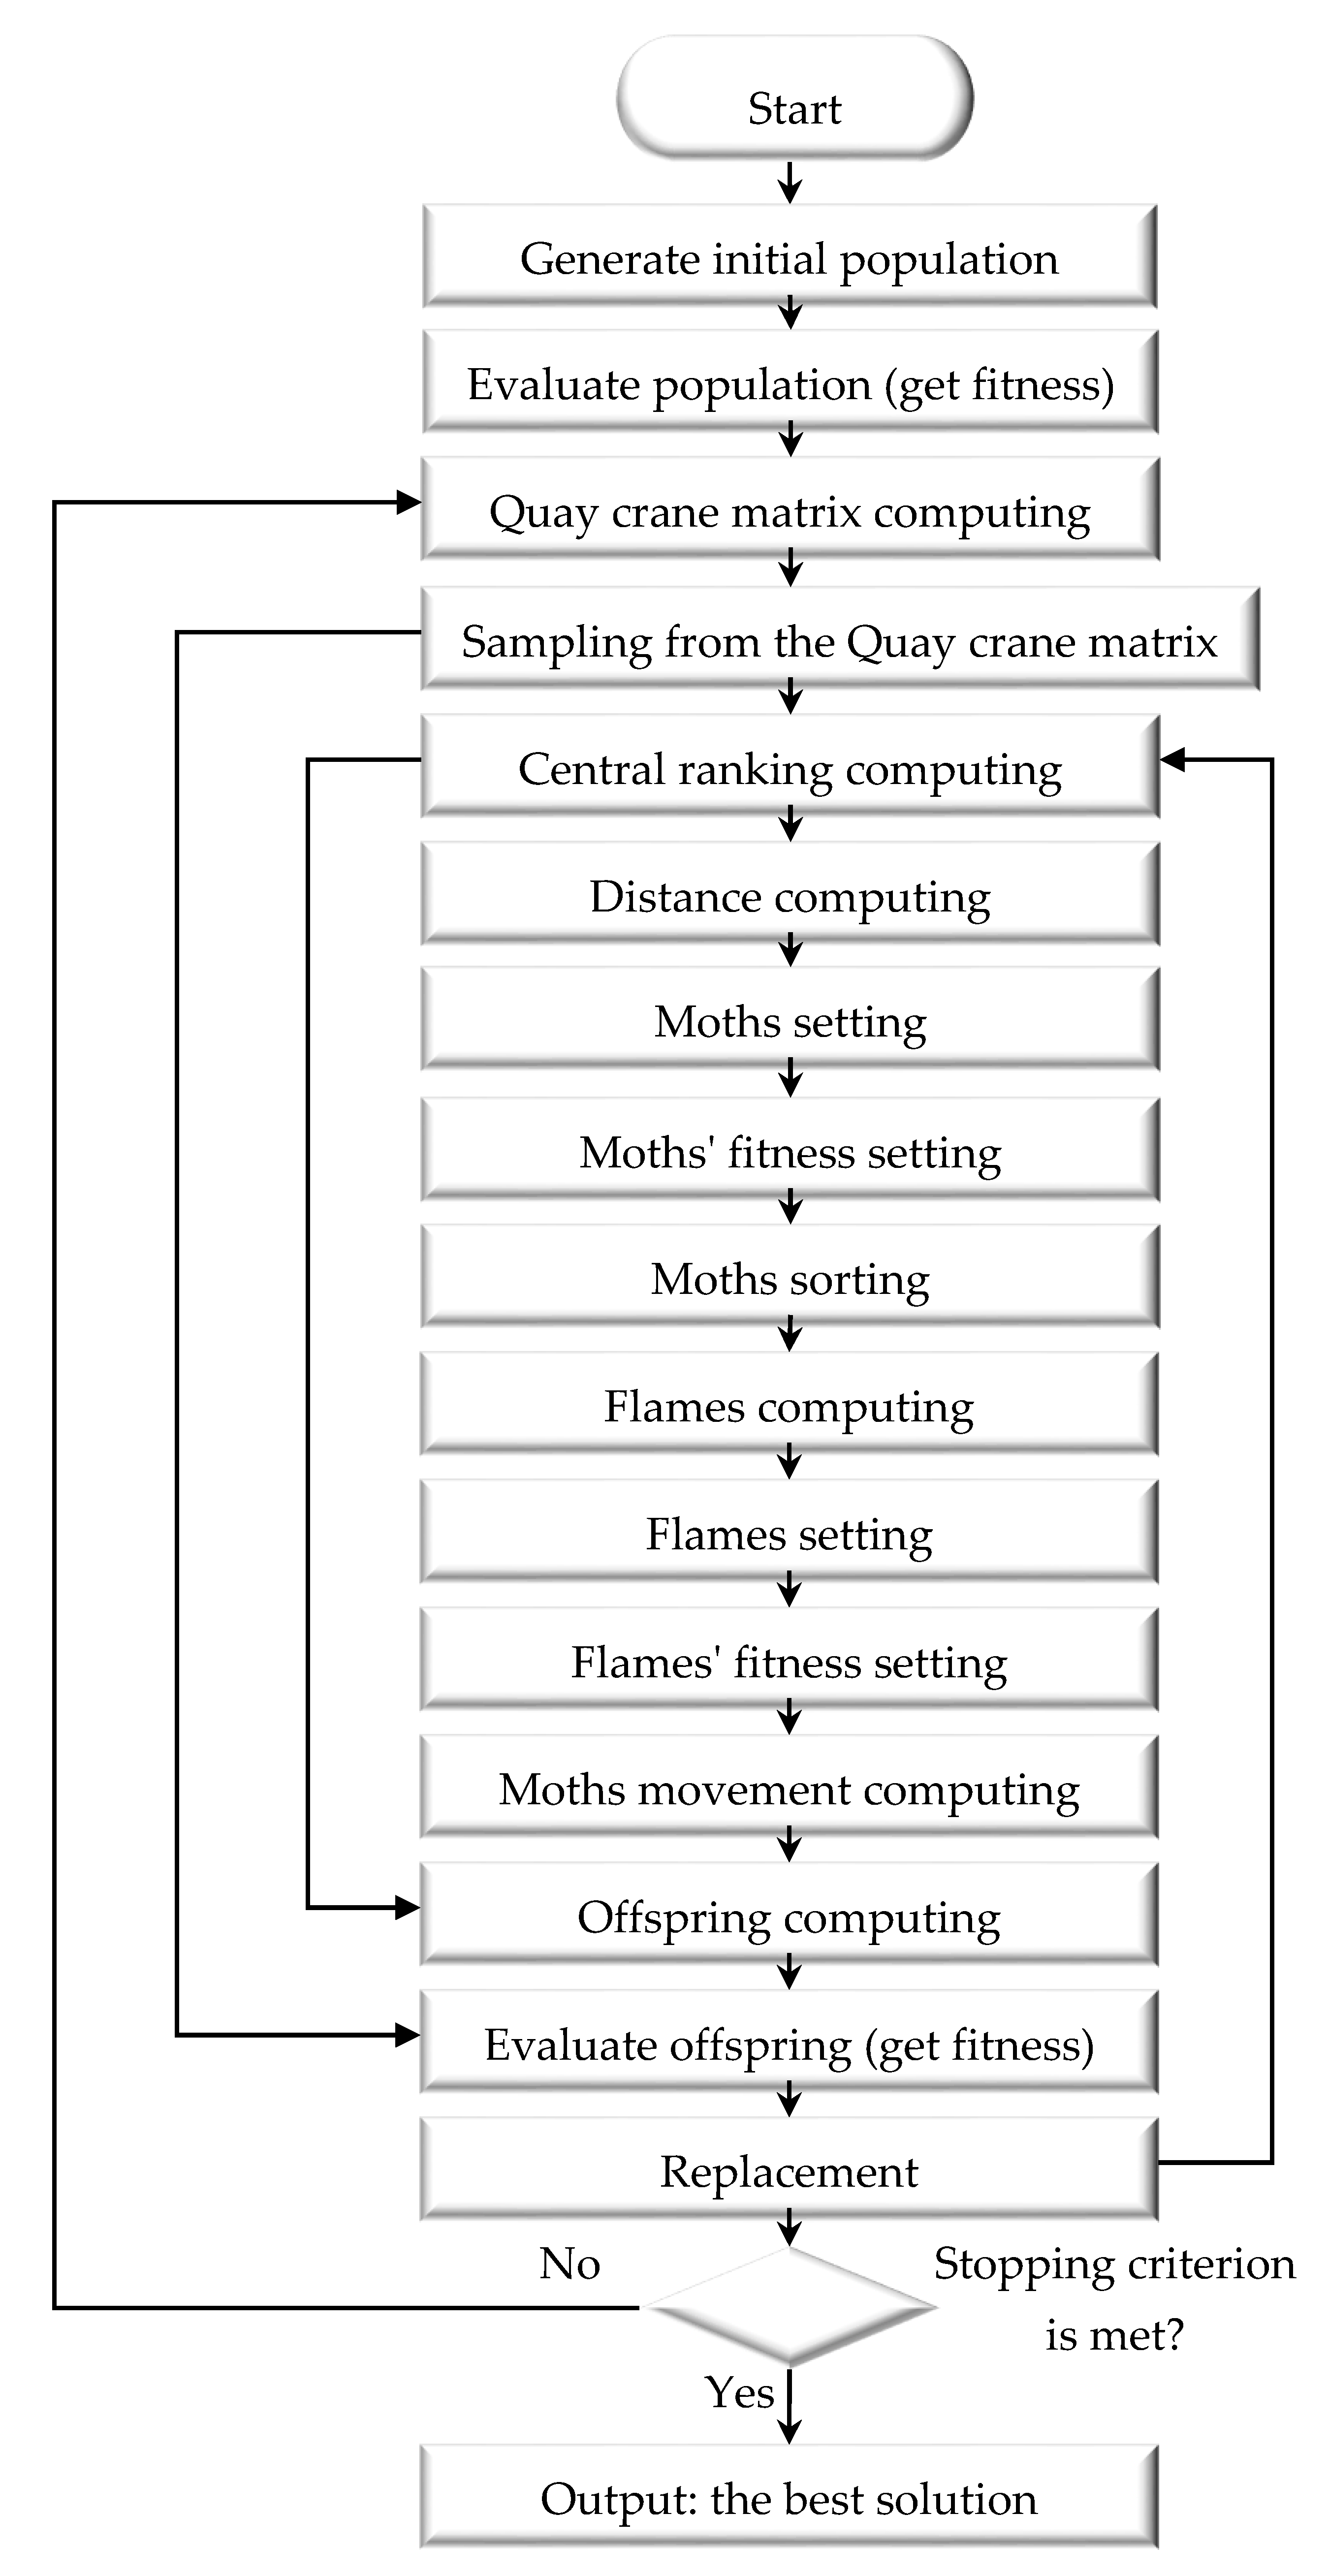
Section 3 presents the inspiration of this work and proposes the quay crane estimation of distribution algorithm, with the Mallows model and a moth-flame structure, called QCEDA. The experimental setup and results are provided in Section 4. Section 5 concludes the work and suggests several directions for future studies.

2. Literature Review

It is of particular interest to present current research of the use of EDAs to solve combinatorial problems. Thus, the first part of the literature review is focused in that direction.

2.1. Complex Problems, Complex Probability Models

An important direction in the development of EDAs focuses on building complex probability models. Such models consider high order interactions between the variables of a problem. The challenge, in this group of EDAs, is how well such interactions are estimated and how to produce better results. We can start with the case where there exists no interaction between variables. Algorithms such as the univariate marginal distribution algorithm (UMDA), detailed in [28], fall into this category. If there exists interaction between a pair of variables, an algorithm with a good performance is the mutual information maximization for input clustering (MIMIC), presented in [29]. If we try to model high order interactions between variables, probability models become more complex to understand and compute. Moreover, a large number of solutions might be required to estimate, in the best way, such interactions. Some important algorithms in this category are the combining optimizers with mutual information trees (COMIT), published by [30], and the Bayesian optimization algorithm (BOA) proposed by [31]; to mention these as the most frequent and cited.
The development of EDAs, which considers high order interactions between variables, does not finish here. Conversely, different combinations of complex probability models have been used for solving combinatorial problems, such as in [32]. The authors compute more than one complex model to address a flexible job shop scheduling problem.
Ref. [33] offer a clear revision of the use of the complex models used in EDAs to solve combinatorial problems. In such a revision, we can appreciate that the complexity of the probability model there exists when we estimate higher order interactions between variables.

2.2. The Hybridization Approach

As discussed in the introduction section, hybridization is an efficient way to counter the weakness of EDAs. Practically, hybrid EDAs include some improvement components. The support method used to improve the performance of EDAs differs between authors, but the most common are heuristics or other evolutionary algorithms. Some studies that use hybrid evolutionary algorithms to solve optimization problems are found in [34]. The author presents a hybrid genetic algorithm coupled with a gravitational search algorithm, called the GA-GSA algorithm, to optimize the metrics of a real industrial case, employing uncertain data. The application of the proposed algorithm can save manpower, budget, and time, and improve the metrics of the company. In addition, Ref. [35] presents a hybrid technique. It uses a particle based swarm method and a genetic algorithm, named PSO-GA, to tackle the constrained optimization problems. The particle based swarm method focuses on enhancing the solution vector, while the genetic technique is employed to modify the offspring. Furthermore, Ref. [36] proposes a hybrid gravitational search algorithm coupled with a genetic algorithm, labeled as the GSA-GA algorithm. The aforementioned algorithm is developed to solve nonlinear optimization problems, and it includes mixed variables. Similarly, each solution is generated through a gravitational search approach, and then each offspring is updated by the genetic technique.
Other studies try to integrate the concept of hybridization between evolutionary algorithms and EDAs. The most representative studies are found in [37]. The authors present a hybrid algorithm through genetics and the estimation of distribution algorithms. A key point is taking advantages from both procedures. The authors apply the hybrid EDA for solving synthetic optimizations problems and two real world cases. Ref. [38] uses an EDA with a 2-opt local search, in a hybridization phase, for addressing a quadratic assignment problem. Ref. [39] considers a permutation flowshop scheduling problem using a particle swarm optimization method with an EDA. Ref. [22] confronts a flexible job shop scheduling problem through the hybridization of an EDA and a local search approach to improve the exploitation process of the EDA. Ref. [40] proposes an EDA to tackle a stochastic resource constrained project-scheduling problem. The hybridization phase uses a permutation based local search. Ref. [41] presents a fuzzy logic based hybrid EDA for addressing distributed permutation flowshop scheduling problems with machine breakdown. The hybridization phase uses genetic variation operators to create offspring. The articles mentioned above are current and representative of this group of hybrid EDAs.

2.3. Distance Based Ranking Models

Another approach for the development of EDAs is to search and use already defined probability models for the permutations field. These models should be able to adapt themselves to the structure of the representation of the members of the population. The main goal is to model the solution space from another perspective. Examples include the EDAs proposed by [24], for a flowshop scheduling problem; Ref. [42], detailing the school bus routing problem with bus stop selection; Ref. [43], depicting a flexible job shop scheduling problem with process plan flexibility; and [44], illustrating the vehicle routing problem with time windows. For the aforementioned papers, an interaction estimation between variables is not required. A distance based ranking model is preferable; specifically, the GMD.

2.4. Quay Crane Scheduling, Recent Literature

Ref. [45] offers an exact and computationally fast solution technique to solve the QCSP. The technique combines a partitioning heuristic with a branch and price algorithm. Finally, a traveling salesman formulation is utilized to minimize crane repositioning movements.
Ref. [46] describes a mathematical model for the QCSP. The authors tackle the noncrossing constraints by addressing the structure of workload assignments. The proposed mathematical formulation is based on the logic based Benders decomposition.
Ref. [47] finds a compact mathematical formulation of the unidirectional cluster based quay crane scheduling problem that can be easily solved by a standard optimization solver.
Ref. [48] presents a revised optimization model for the scheduling of quay cranes and proposes a heuristic solution procedure. The authors propose a branch and bound algorithm, which searches a subset of above average quality schedules; meanwhile, the heuristic considers the impact of crane interference.
Ref. [49] details a genetic algorithm that it is built through a novel workload balancing heuristic, and the loading conditions of different quay cranes during the reassignment of task to quay crane are considered. The idea is modelled as a fuzzy logic controller to guide the mutation rate and mutation mechanism of the genetic algorithm. As a result, the proposed algorithm does not require any predefined mutation rate. Meanwhile, the genetic algorithm can more adequately reassign tasks to quay cranes according to the quay cranes’ loading conditions throughout the evolution.
Ref. [50] improves the efficiency of a genetic algorithm by (1) using an initial solution based on a heuristics rule, (2) using a new approach for defining chromosomes (i.e., solution representation) to reduce the number of decision variables, and (3) using new procedures for calculating tighter lower and upper bounds for the decision variables.
Ref. [51] tackles the issue of the interference among cranes by a modified genetic algorithm to deal with the QCSP.
Ref. [52] develops a two quay-crane schedule with noninterference constraints for the port container terminal of Narvik. First, a mathematical formulation of the problem is provided, and, then, a genetic algorithm approach is developed to obtain near optimal solutions.
It is clear, from this review, that the QCSP has been studied intensively in a recent stream of research. In addition, based on the current research, it is important to handle the correct treatment of crane interference constraints. In addition, there is still a gap to improve the performance of EDAs, and the hybridization approach continues to be a useful way to enhance EDAs. In addition, from the exposed review, it is of interest to know how much better hybrid EDAs can be, than other pure EDAs and recent algorithms.
The contributions of this article are
-
To propose a hybrid EDA, not only a reason for publication, this also avoids the necessity of requiring building complex probability models.
-
To determine what is most useful, i.e., the development of complex probability models or the hybridization of an EDA with other methods to obtain the same or better solutions.
-
As a reason for doing this research, there exists a wide field of development to determine which methods are more suitable to obtain the better performance of an EDA.
-
The research motivation is to show how bioinspired techniques help to reduce the deficiencies of an EDA.
-
Based on the results obtained in this study, it is more efficient to produce new and better offspring through such hybridization.

3. The QCEDA Approach

This section may be divided by subheadings. It should provide a concise and precise description of the experimental results, their interpretation, as well as the experimental conclusions that can be drawn.

3.1. Initial Population

A representation of solutions to the QCSP is detailed through the processing sequence of containers on the available quay cranes and the establishment of containers for the quay cranes.
For the processing sequence of containers, a first vector is proposed, i.e., the containers sequence vector. It has a length that equals the number of containers moving through the quay cranes. Thus, any vector of this type is simply a sequence of n containers.
An example is depicted in Table 4, with five containers indexed from 1 to 5.
Where container number three should be executed (moved) at the beginning, after that, container number one, container number four, and so on. Each element in the containers sequence vector shown above might be in any place on the representation, or as any permutation based solution, i.e., as any ranking.
As in other EDAs, the aforementioned representation is suitable for using in the set of combinatorial problems used in the comparison section. With this representation, for the solution vectors, the GMD can be directly applied in the distance-based ranking model phase. The initial population contains 1000 members. Each member has a length, n , where n is the number of elements in the permutation, i.e., containers. All this is in each generation. The number of members is a fixed parameter.
For the assignment of containers, a second vector is built, i.e., the quay crane assignment vector. It also has a length that equals the number of containers. Every element represents the selected quay crane for every container. An example is depicted in Table 5.
The first container, based on the containers sequence vector shown in Table 4 and labeled with (3), is moved by the crane labeled with the number two, according to the crane assignment solution vector. The second container, labeled with (1), is moved by the same crane, the third container, labeled with (4), is moved by the crane labeled with the number one, and so on.

3.2. Fitness

The average waiting time that is required to move all the tasks (containers) is the fitness for the QCSP in this research. The fitness is computed for each member of the population. Once the completion time for each task is obtained, all the times are accumulated and divided by the number of tasks to obtain the average waiting time, i.e., the fitness.
To ensure compliance with the quay crane constraints for each crane and avoid any collision between cranes, the Delmia-Quest® simulation language is preferred in this research. Delmia-Quest® avoids any collisions between cranes in each simulation run. A controller establishes the order of movements, in each simulation run, to satisfy the aforementioned constraints. Using the Delmia-Quest® simulation language, the main constraints related to the cranes are satisfied. Furthermore, considering Delmia-Quest®, the fitness is obtained directly from the simulation model and the QCEDA is in charge of modelling the solution space distribution.
For each solution, the corresponding values are obtained from the simulation model, built on Delmia Quest®. The main details of the simulation model are outlined below
-
A crane system is used to move containers through the ship.
-
The crane system is multidirectional.
-
Different cranes can service any container according to a predefined sequence.
-
Containers can receive service from different cranes based on the predefined sequence.
-
The movement of containers is only possible by cranes.
With all these features, the simulation model is able to integrate operation times and workflows. Finally, the fitness is used by the QCEDA to obtain the best solution at the end of execution.

3.3. Probability Model for the Quay Crane Assignment Vectors

A matrix, q , is built to describe the probability model for the quay crane assignment vectors. That is, each q i value in the matrix mentioned details the number of times the quay crane, i , is elected with a container. Again, the vectors depicted below are utilized to create a probability matrix, q , for the first position in the sequences, i.e., q i . In this example, six vectors (as a population), with a length that equals five containers, are shown in Table 6.
New quay crane assignment vectors are constructed as follows: in each position on the new individual, the quay crane i is elected by the cumulative probability of q i . Each q i cumulative value considers the opportunity of the quay crane, i , be elected for the place, j , in the offspring.
Firstly, a random value should be generated in every place on the offspring. Then, every random value is interpolated in the cumulative probability of q i , to identify which quay crane should be selected. Figure 3 depicts an illustration of this process.
Therefore, the offspring, i.e., the new quay crane assignment vectors, are sampled according the cumulative probability of q i .

3.4. Probability Model for the Task Sequence Vectors

3.4.1. The Distance Based Ranking Model Phase

  • Central ranking computing
With all members of the population, i.e., the task sequence vectors, the central (reference) permutation is computed. The central permutation is a parameter inside of the GMD process. In this research, the procedure based on [53] is used to compute the reference permutation. Firstly, the mean for each position, considering the members of the population, is computed. Secondly, the smallest mean, from the all the positions, is identified and the smallest element of the reference permutation is assigned in the smallest mean position, identified previously. This continues when the second smallest mean, from all the positions, is identified and the second smallest element of the reference permutation is assigned in the second smallest mean position identified previously, and so on until the procedure finishes. This procedure is widely used to define a consensus of the all rankings. Figure 4 presents a simple example with seven vectors of length five, the corresponding means and the result, i.e., the central permutation.
With the consensus ranking (central permutation), it is possible to compute the distance between each member of the population and the consensus ranking. The procedure defined by [26,27] compute the distance. Firstly, the composition (product) between the inverse of each permutation and the consensus ranking should be computed. Figure 5 details an example of the composition mentioned between two vectors with length four.
For further details, the reader is referred to the algebra of permutations literature. With the composition previously detailed, it is possible to decompose in n 1 items, i.e., to factorize such composition (see Figure 6).

3.4.2. The Moth-Flame Phase

  • Initialization of moths in the feasible space
The factorization obtained in the previous step now represent coordinates where a moth is located in an initial search phase. Then, there are M members, i.e., M solution vectors, in the initial population and M moths for the moth-flame phase. Figure 7 shows an allocation of a moth. Based on this idea, the members of the population each contain n elements, and the moth-flame phase uses n 1 elements for each moth. Therefore, the search space is stablished in dimension R n 1 .
  • Fitness of the moths
In this study, the fitness, obtained for each individual, is the same fitness for every moth in the moth-flame phase.
  • Moths sorting
The population of moths is sorted in descending order, according to the fitness.
  • Flames amount computing
The equation published in the work of [23] is used to determine the number of flames in each generation. The equation is below
number   of   flames = round N   -   l   ·   N   -   1 T
where l is the current generation, N is the maximum number of flames, and T expresses the maximum number of generations. The number of flames gradually decreases when Equation (12) is implemented. This permits the right exploration and exploitation of solutions [23]. Figure 8 shows how the number of flames gradually decreases when the number of generations increases.
  • Flames setting
The coordinates of the moths, already sorted, are considered to determine the locations of the flames. Table 7 shows an example in R 3 , with three flames and nine moths.
  • Flames’ fitness setting
The fitness for the flames is initialized with the fitness of the corresponding moth.
  • Moth-flame assignment
Before generating offspring, i.e., the movements of the moths in the search space, each moth should move only with respect to a specific flame. That is, each moth should be assigned to a specific flame in each generation. Table 8 depicts an example in R 3 , with three flames and nine moths.
  • Moth movement
Each moth achieves a new location in the search space by the logarithmic function defined in [23].
Spiral   function = D i   ·   e bt   ·   cos 2 π t + F j
where D i indicates the distance between the i-th moth and the j-th flame, i.e., D i = M i F j , b is a value that depicts the shape of the function, t is a random value between [–1, 1]. Figure 9 depicts an example, in R 2 , for a moth after computation of the spiral movement.

3.4.3. Offspring Computing

The new locations of the moths are used as the representation of the distance between permutations. That is, now the new coordinates of the moths represent the decomposition (factorization) of the distance between permutations. That is how, in this research, both approaches hybridize to improve the performance of the proposed algorithm.
The way that the distances between permutations return to the original dimension, i.e., n , is used in the algorithm of [54]. Through some steps, explained with an example below, the research of these authors offers the possibility of finding the permutation that corresponds to each offspring.
Pseudocode 1. [54]’s Procedure Example
n   number   of   positions   permutation   length
Let   a   sample   moth   location   vector   V = 2 ,   0 ,   1
therefore   n : = 4
insert   n   in   0     Inverse   permutation   vector = ( 4 , __, __, __)
for j ≔ n − 1 to 1
insert   j : = 3   in   V 3 · 1     Inverse   permutation   vector = 4 ,   3 ,   _ _ ,   _ _ ,
insert   j : = 2   in   V 2 · 0     Inverse   permutation   vector = 2 ,   4 ,   3 ,   _ _ ,
insert   j : = 1   in   V 1 · 2     Inverse   permutation   vector = ( 2 ,   4 ,   1 ,   3 )
According to the sample moth location vector shown above, the corresponding inverse permutation vector is (2, 4, 1, 3). Finally, each permutation vector is obtained by inverting and composing the consensus ranking. An inverse permutation exists when every number and the number of the place that it occupies are exchanged. Thus, the inverse of the inverse permutation vector is (3, 1, 4, 2). If we take as the central ranking (1, 2, 3, 4) as example, then, the composition of the previous result with the central ranking is (3, 1, 4, 2) as the final vector.

3.5. Replacement

The offspring should be evaluated to obtain their fitness. Finally, the replacement process used in this study is a binary tournament between the parents and the offspring.
All the stages of the proposed algorithm have been defined. The loop is performed going back to step–quay crane matrix computing. In addition, the central ranking should be updated with the new population after the replacement process. All of this is within a number of the generations. In this research, 100 generations were used. This is a fixed parameter. Then, the QCEDA framework is provided below
Pseudocode 2. QCEDA Framework
D 0     Generate   M   individuals
t : = 1
Do
    FitD t 1   Evaluate   individuals   fitness
    q t 1   q   matrix   computing   from   D t 1
    Dq t   Sampling   from   q t 1
    σ 0   Central   ranking   computing   from   D t 1
    K t 1   Distance   computing   from   D t 1   and   σ 0  
    M t 1   Set   moths   from   K t 1  
    FitM t 1   Set   fitness   from   FitD t 1  
    M t 1   Sorting   moths
    f   Flames   computing
    F t 1   Set   flames   from   M t 1
    FitF t 1   Set   fitness   from   FitM t 1  
    M t   Moth   movement   computing   genotype
    Ds t   Offspring   computing   from   M t  
    FitD t   Evaluate   individuals   from   Ds t   and   Dq t
    D t   Replacement   by   binary   tournament
    t : = t + 1
Until   stopping   criterion   is   met
Additionally, a flow chart is detailed in Figure 10 to illustrate the overall process.

4. Results and Comparison

4.1. Comparison with Standard Benchmarking Datasets

The set of instances of [55] are utilized in the comparison between different EDAs. The input data (instances) were already generated by [55], and these instances are available online. Ninety instances were used in the comparison. The comparison mentioned helps to determine the importance of hybridization for the performance of the proposed EDA. All the details of the instances are depicted below.
Basics of the Input Data
Headings present general information, such as
   The safety margin between the quay cranes is two ship bays
   The travel time of a QC between two adjacent bays is one
The body of the instance includes
   The number of containers (tasks)
   The starting position of each quay crane
   The problem number
   For each task
    The location of the task,
    The type of the task, i.e., deck or hold
    The time required to perform the task
    The type of operation, i.e., loading or discharging
All the trails were performed in a Lenovo™ ideapad 330, AMD A9-9425 Radeon R5, 3.10 GHz, 8 GB of RAM, Windows® 10 for 64 bits. C++ language is preferred to make all the comparisons. A total of 30 trials were run for all the dataset. The relative percentage increase (RPI) details how to compare the performance of the algorithms. This is the metric used for comparison in this research.
RPI ( c i ) = ( c i   -   c + ) / c +
where c i is the average wait time executed in the ith replication, and c + is the best average wait time found for each instance used in this study. The reason to utilize the RPI is to compare two quantities while taking into account the “sizes” of the things being compared. The comparison is expressed as a ratio and is a unitless number. By multiplying these ratios by 100, they can be expressed as percentages [56].
The performance of the QCEDA, through the experimental results, is presented in Table 9. The results of the QCEDA scheme are concentrated between [0, 0.03], over the best result found for all the instances. Therefore, the QCEDA is an outstanding technique to address the quay crane scheduling problem.

4.2. Comparison with Pure EDAs

The EDAs considered in the comparison are the MIMIC, the COMIT and the BOA. These EDAs are considered as pure EDAs. These EDAs utilize complex probability models and their performance is based on such models. Finally, the QCEDA, the proposed approach, is a hybrid EDA.
The experimental results distribution, for each interval, is shown in Table 10. The QCEDA results are comparatively concentrated, in the range of [0, 0.03], whereas the other algorithms results are concentrated in the range of [0.06, or more].
Figure 11 indicates the results obtained by the algorithms for the QCSP. Through box and whisper charts, the dispersion of the values obtained, for the RPI, is appreciated. As the complexity of the probability model increases in the pure EDAs, the results improve. However, the QCEDA scheme outperforms all the previous results. The dispersion results of the QCEDA scheme is less than the other algorithms after all the trails were run, i.e., no matter how many times we run the instances, the performance of the QCEDA achieved the best value more times than the other algorithms. This means that the solutions found by the QCEDA are more concentrated around the best value than those by the other algorithms.

4.3. Comparison with Multi-Objective Algorithms

The QCEDA is evaluated against other multi-objective algorithms to enhance its novelty. Two benchmark algorithms are used in the comparative, the algorithm from [57], named NSGA, and from [58], named NSGA-II. These algorithms are well known in the literature related to the multi-objective approach. The code of these algorithms is available in the Kanpur genetic algorithms laboratory web. For the multi-objective approach, two antagonistic objectives are analyzed: the average waiting time and the makespan. This means that both fitnesses are computed for each solution. The objectives were utilized as input parameters for finding the area obtained from the nondominated solutions, located in the first layer of the Pareto-front, i.e., the best Pareto-front from each algorithm. This is the new dependent variable for the experiment. All the details are depicted below.
The Best Pareto-Front Process
Generate initial population
t ≔ 1
Do
For each member of population
   Get the average waiting time
   Get the makespan
Identify the nondominated solutions from the initial population
Compute the area from the nondominated solutions from the initial population
Continue with the rest of the QCEDA steps to get offspring
For each offspring
   Get the average waiting time
   Get the makespan
Identify the nondominated solutions from the offspring
Compute the area from the nondominated solutions from the offspring
Save the best Pareto-front area between parents and offspring
t ≔ t + 1
Until (stopping criterion is met)
Then, the RPI is adapted to use the same Equation (14), where c * is the best area found by any of the algorithm configurations, and c i is the area obtained from the best Pareto-front obtained in the i-th replication by a given algorithm configuration.
Although the probability model, the GMD proposed, has been competitive for finding suitable offspring, the best Pareto-front contributes to enhance the results when the nondominated solutions are coupled with the GMD process.
The experimental results distribution is depicted in Table 11. From the table, it is possible to identify that the overall results of the QCEDA approach are competitive. Based on the results, the QCEDA approach can efficiently find the closest solutions to the best solution, 2008 times in the first interval, whereas the other algorithms results are far from this amount.
In addition, the Pareto-fronts obtained from each algorithm are shown at the bottom of the Table 11, for the instance k13.
Figure 12 includes the performances of the NSGA, the NSGA-II, and the QCEDA schemes. The QCEDA is efficient to find the best solutions. The dispersion of the QCEDA is almost the same as the other algorithms. However, the solutions found by the QCEDA are more concentrated around the best value than other algorithms, i.e., the average of the solutions of the QCEDA converge better than other approaches to the best-found value.

4.4. Comparison with Recent Algorithms

Four current schemes are used against the QCEDA. The [51] algorithm, the [50] algorithm, the [52] algorithm, and the [49] algorithm. The author has implemented all the recent evolutionary algorithms used in the comparison section. The implementation was made by following the indications of the respective papers, and the objective function is the same for all the comparison process, i.e., the average waiting time.
The experimental results distribution is detailed in Table 12. From the table, it is possible to identify that the overall results of the QCEDA scheme is, again, competitive. According to the results, the QCEDA algorithm can efficiently find the closest solutions to the optimal, more times in the range of [0, 0.03], than any another algorithm used in the comparison.
Although there are no optimal results reported in the literature regarding the average waiting time, it is possible to show the optimality gap for the makespan. These results are provided in the bottom of the Table 12 for the all instances used in the comparison.
Figure 13 depicts the results of the algorithms. All the results were outperformed by the QCEDA. Again, the dispersion of the QCEDA is less than other algorithms (between 0.01 and 0.05); this means that the solutions found by the QCEDA are more concentrated around the best value than other algorithms, i.e., the average of solutions of the QCEDA converges better than other approaches to the best found value. Furthermore, based on the results, it is possible to justify the proposal of a hybrid EDA, not only as a reason for publication; it also avoids the necessity of requiring building complex probability models. In addition, results help to determine what is most useful, i.e., the development of complex probability models or the hybridization of an EDA with other methods to obtain the same or better solutions. This justifies the reason for performing this research; there exists a wide field of development to determine which methods are more suitable to obtain the better performance of an EDA. Based on the results obtained in this study, it is more efficient to produce new and better offspring through such hybridization.

4.5. Computational Cost Results

Finally, Figure 14 details the computational cost results of the QCEDA scheme. As we can see, it is competitive with the other algorithms used in the comparison.

4.6. Convergence Patterns

Figure 15 presents the convergence patterns of the QCEDA scheme.

5. Discussion, Conclusions and Future Research

The contributions of this article are
-
To propose a hybrid EDA, not only a reason for publication; this also avoids the necessity of requiring building complex probability models.
-
To determine what is most useful, i.e., the development of complex probability models or the hybridization of an EDA with other methods to obtain the same or better solutions.
-
As a reason for doing this research, there exists a wide field of development to determine which methods are more suitable to obtain a better performance of the EDA.
-
The research motivation is to show how the bioinspired techniques help to reduce the deficiencies of an EDA.
-
Based on the results obtained in this study, it is more efficient to produce new and better offspring through such hybridization.
Based on the results detailed above, it is possible to conclude that the hybrid EDAs have a better performance, or equal in effectiveness, than the pure EDAs. It can be established that, for combinatorial problems, the estimation of the high order interactions can be omitted if developing a competitive algorithm is the objective. The proposed hybridization, with the Mallows—Moth-flame approach, is more useful to obtain the same or better solutions. The dispersion results of the QCEDA scheme is always less than the other algorithms used in the comparison section. This means that the solutions found by the QCEDA are more concentrated around the best value than other algorithms, i.e., the average of the solutions of the QCEDA converge better to the best found value than other approaches.
Furthermore, based on the results, a viable alternative to build better hybrid EDAs is to use already defined probability models for the permutations field. In this research, the proposed model is able to adapt itself to the structure of the representation of the members of the population. The main goal is achieved, i.e., to model the solution space from another perspective. The Mallows distribution falls in this approach, but there could be more distributions for this purpose.
Disadvantages of the proposed scheme
-
The main disadvantage of the proposed QCEDA is to learn and program different procedures to obtain the distance, and factorization of distance, between solutions using a permutation based representation.
-
Only the nondominated solutions located in the first layer of the Pareto-front are used in this research to make comparisons between algorithms. Other metrics should be considered in order to show the weaknesses and/or drawbacks of the proposed scheme.
As future research.
-
New and more comparisons should be considered, using the QCEDA, in future work.
-
Other combinatorial problems should be considered.
-
In addition, a substitution for the Mallows distribution and/or to hybridize with other methods, should be considered to enhance the proposed scheme.
-
Furthermore, diversity mechanisms should be considered to improve the proposed scheme.
-
Finally, the application of the proposed scheme should consider the solution of real world problems in future work.
-
The QCEDA should attend to more and different restrictions.

Funding

This research received no external funding.

Data Availability Statement

The datasets used and/or analyzed during the current study are available from the corresponding author on reasonable request.

Acknowledgments

Special thanks to all the reviewers.

Conflicts of Interest

The authors declare no conflict of interest. The funders had no role in the design of the study; in the collection, analyses, or interpretation of data; in the writing of the manuscript or in the decision to publish the results.

References

  1. Wang, Y.; Wang, S. Deploying, scheduling, and sequencing heterogeneous vessels in a liner container shipping route. Transp. Res. Part E Logist. Transp. Rev. 2021, 151, 102365. [Google Scholar] [CrossRef]
  2. Al-Refaie, A.; Abedalqader, H. Optimal berth scheduling and sequencing under unexpected events. J. Oper. Res. Soc. 2020, 1–15. [Google Scholar] [CrossRef]
  3. Malekahmadi, A.; Alinaghian, M.; Hejazi, S.R.; Saidipour, M.A.A. Integrated continuous berth allocation and quay crane assignment and scheduling problem with time-dependent physical constraints in container terminals. Comput. Ind. Eng. 2020, 147, 106672. [Google Scholar] [CrossRef]
  4. Kavoosi, M.; Dulebenets, M.A.; Abioye, O.F.; Pasha, J.; Wang, H.; Chi, H. An augmented self-adaptive parameter control in evolutionary computation: A case study for the berth scheduling problem. Adv. Eng. Inform. 2019, 42, 100972. [Google Scholar] [CrossRef]
  5. Dulebenets, M.A. A novel memetic algorithm with a deterministic parameter control for efficient berth scheduling at marine container terminals. Marit. Bus. Rev. 2017, 2, 302–330. [Google Scholar] [CrossRef] [Green Version]
  6. Kim, Y.; Park, K.; Ko, J. A symbiotic evolutionary algorithm for the integration of process planning and job shop scheduling. Comput. Oper. Res. 2003, 30, 1151–1171. [Google Scholar] [CrossRef]
  7. Rossi, A.; Dini, G. Flexible job-shop scheduling with routing flexibility and separable setup times using ant colony optimisation method. Robot. Comput.-Integr. Manuf. 2007, 23, 503–516. [Google Scholar] [CrossRef]
  8. Dauod, H.; Li, D.; Yoon, S.; Srihari, K. Multi-objective optimization of the order scheduling problem in mail-order pharmacy automation systems. Int. J. Adv. Manuf. Technol. 2016. [Google Scholar] [CrossRef]
  9. Yue, L.; Guan, Z.; Saif, U.; Zhang, F.; Wang, H. Hybrid Pareto artificial bee colony algorithm for multi objective single machine group scheduling problem with sequence dependent setup times and learning effects. Springerplus 2016, 5. [Google Scholar] [CrossRef] [Green Version]
  10. Huang, S.; Tian, N.; Wang, Y.; Ji, Z. Multi objective flexible job shop scheduling problem using modified discrete particle swarm optimization. Springerplus 2016, 5. [Google Scholar] [CrossRef] [Green Version]
  11. Xu, H.; Bao, Z.; Zhang, T. Solving dual flexible job-shop scheduling problem using a Bat Algorithm. Adv. Prod. Eng. Manag. 2017, 12, 5–16. [Google Scholar] [CrossRef] [Green Version]
  12. Prins, C. A simple and effective evolutionary algorithm for the vehicle routing problem. Comput. Oper. Res. 2004, 31, 1985–2002. [Google Scholar] [CrossRef]
  13. Gao, J.; Sun, L.; Gen, M. A hybrid genetic and variable neighborhood descent algorithm for flexible job shop scheduling problems. Comput. Oper. Res. 2008, 35, 2892–2907. [Google Scholar] [CrossRef]
  14. Zeng, Q.; Yang, Z. Integrating simulation and optimization to schedule loading operations in container terminals. Comput. Oper. Res. 2009, 36, 1935–1944. [Google Scholar] [CrossRef]
  15. Lee, L.; Chew, E.; Tan, K.; Wang, Y. Vehicle dispatching algorithms for container transshipment hubs. OR Spectr. 2010, 32, 663–685. [Google Scholar] [CrossRef]
  16. Schittekat, P.; Kinable, J.; Sörensen, K.; Sevaux, M.; Spieksma, F. A metaheuristic for the school bus routing problem with bus stop selection. Eur. J. Oper. Res. 2013, 229, 518–528. [Google Scholar] [CrossRef]
  17. Li, X.; Gao, L. An effective hybrid genetic algorithm and tabu search for flexible jobshop scheduling problem. Int. J. Prod. Econ. 2016, 174, 93–110. [Google Scholar] [CrossRef]
  18. Jarboui, B.; Eddaly, M.; Siarry, P. An estimation of distribution algorithm for minimizing the total flowtime in permutation flowshop scheduling problems. Comput. Oper. Res. 2009, 36, 2638–2646. [Google Scholar] [CrossRef]
  19. Chen, S.; Chen, M.; Chang, P.; Zhang, Q.; Chen, Y. Guidelines for developing effective Estimation of Distribution Algorithms in solving simple machine scheduling problems. Expert Syst. Appl. 2010, 37, 6441–6451. [Google Scholar] [CrossRef]
  20. Pan, Q.; Ruiz, R. An estimation of distribution algorithm for lot-streaming flow shop problems with setup times. Omega 2012, 40, 166–180. [Google Scholar] [CrossRef] [Green Version]
  21. Chen, Y.; Chen, M.; Chang, P.; Chen, S. Extended artificial chromosomes genetic algorithm for permutation flowshop scheduling problems. Comput. Ind. Eng. 2012, 62, 536–545. [Google Scholar] [CrossRef]
  22. Wang, L.; Wang, S.; Xu, Y.; Zhou, G.; Liu, M. A bi-population based estimation of distribution algorithm for the flexible job-shop scheduling problem. Comput. Ind. Eng. 2012, 62, 917–926. [Google Scholar] [CrossRef]
  23. Mirjalili, S. Moth-flame optimization algorithm: A novel nature-inspired heuristic paradigm. Knowl.-Based Syst. 2015, 89, 228–249. [Google Scholar] [CrossRef]
  24. Ceberio, J.; Irurozki, E.; Mendiburu, A.; Lozano, J. A Distance-Based Ranking Model Estimation of Distribution Algorithm for the Flowshop Scheduling Problem. IEEE Trans. Evol. Comput. 2014, 18, 286–300. [Google Scholar] [CrossRef]
  25. Mallows, C. Nonnull ranking models. Biometrika 1957, 44, 114–130. [Google Scholar] [CrossRef]
  26. Fligner, M.; Verducci, J. Distance based ranking models. J. R. Stat. Soc. 1986, 48, 359–369. [Google Scholar] [CrossRef]
  27. Fligner, M.; Verducci, J. Multistage ranking models. J. Am. Stat. Assoc. 1988, 83, 892–901. [Google Scholar] [CrossRef]
  28. Mühlenbein, H. The equation for response to selection and its use for prediction. Evol. Comput. 1997, 5, 303–346. [Google Scholar] [CrossRef] [PubMed]
  29. De Bonet, J.; Isbell, C.; Viola, P. MIMIC: Finding Optima by Estimation Probability Densities. In Proceedings of the 1997 Conference on Advances in Neural Information Processing Systems, Denver, CO, USA, 2–6 December 1997; pp. 424–430. [Google Scholar]
  30. Baluja, S.; Davies, S. Using Optimal Dependency-Trees for Combinatorial Optimization: Learning the Structure of the Search Space. In Proceedings of the Fourteenth International Conference on Machine Learning, San Francisco, CA, USA, 8–12 July 1997; Fisher, D., Ed.; pp. 30–38. [Google Scholar]
  31. Pelikan, M.; Goldberg, D.; Cantú-Paz, E. Linkage Problem, Distribution Estimation, and Bayesian Networks; The University of Illinois, Genetic Algorithm Laboratory: Urbana-Champaign, IL, USA, 1998. [Google Scholar]
  32. Pérez-Rodríguez, R.; Jöns, S.; Hernández-Aguirre, A.; Ochoa, C. Simulation optimization for a flexible jobshop scheduling problem using an estimation of distribution algorithm. Int. J. Adv. Manuf. Technol. 2014, 3–21. [Google Scholar] [CrossRef]
  33. Ceberio, J.; Irurozki, E.; Mendiburu, A.; Lozano, J. A review on estimation of distribution algorithms in permutation-based combinatorial optimization problems. Prog. Artif. Intell. 2012, 1, 103–117. [Google Scholar] [CrossRef]
  34. Garg, H. A hybrid GA-GSA algorithm for optimizing the performance of an industrial system by utilizing uncertain data. In Handbook of Research on Artificial Intelligence Techniques and Algorithms; Vasant, P., Ed.; IGI Global: Hershey, PA, USA, 2014. [Google Scholar] [CrossRef] [Green Version]
  35. Garg, H. A hybrid PSO-GA algorithm for constrained optimization problems. Appl. Math. Comput. 2016, 274, 292–305. [Google Scholar] [CrossRef]
  36. Garg, H. A hybrid GSA-GA algorithm for constrained optimization problems. Inf. Sci. 2019, 478, 499–523. [Google Scholar] [CrossRef]
  37. Peña, J.; Robles, V.; Larrañaga, P.; Herves, V.; Rosales, F.; Pérez, M. GA-EDA: Hybrid Evolutionary Algorithm Using Genetic and Estimation of Distribution Algorithms. In IEA/AIE 2004, LNAI 3029; Orchard, R., Yang, C., Ali, M., Eds.; Springer: Berlin/Heidelberg, Germany, 2004; pp. 361–371. [Google Scholar]
  38. Zhang, Q.; Sun, J.; Tsang, E.; Ford, J. Estimation of distribution algorithm with 2-opt local search for the quadratic assignment problem. Stud. Fuzziness Soft Comput. 2006, 192, 281–292. [Google Scholar]
  39. Liu, H.; Gao, L.; Pan, Q. A hybrid particle swarm optimization with estimation of distribution algorithm for solving permutation flowshop scheduling problem. Expert Syst. Appl. 2011, 38, 4348–4360. [Google Scholar] [CrossRef]
  40. Fang, C.; Kolisch, R.; Wang, L.; Mu, C. An estimation of distribution algorithm and new computational results for the stochastic resource-constrained project scheduling problem. Flex. Serv. Manuf. J. 2015. [Google Scholar] [CrossRef]
  41. Wang, K.; Huang, Y.; Qin, H. A fuzzy logic-based hybrid estimation of distribution algorithm for distributed permutation flowshop scheduling problems under machine breakdown. J. Oper. Res. Soc. 2016, 67, 68–82. [Google Scholar] [CrossRef]
  42. Pérez-Rodríguez, R.; Hernández-Aguirre, A.; Cruz, I. An estimation of distribution algorithm coupled with the generalized Mallows distribution for a school bus routing problem with bus stop selection. Rev. Iberoam. Autom. E Inform. Ind. 2017, 14, 288–298. [Google Scholar] [CrossRef] [Green Version]
  43. Pérez-Rodríguez, R.; Hernández-Aguirre, A. A hybrid estimation of distribution algorithm for flexible job-shop scheduling problems with process plan flexibility. Appl. Intell. 2018. [Google Scholar] [CrossRef]
  44. Pérez-Rodríguez, R.; Hernández-Aguirre, A. A hybrid estimation of distribution algorithm for the vehicle routing problem with time windows. Comput. Ind. Eng. 2019, 130, 75–96. [Google Scholar] [CrossRef]
  45. Abou Kasm, O.; Diabat, A. The quay crane scheduling problem with non-crossing and safety clearance constraints: An exact solution approach. Comput. Oper. Res. 2019, 107, 189–199. [Google Scholar] [CrossRef]
  46. Sun, D.; Tang, L.; Baldacci, R. A benders decomposition-based framework for solving quay crane scheduling problems. Eur. J. Oper. Res. 2019, 273, 504–515. [Google Scholar] [CrossRef]
  47. Chen, J.H.; Lee, D.H.; Goh, M. An effective mathematical formulation for the unidirectional cluster-based quay crane scheduling problem. Eur. J. Oper. Res. 2014, 232, 198–208. [Google Scholar] [CrossRef]
  48. Bierwirth, C.; Meisel, F. A fast heuristic for quay crane scheduling with interference constraints. J. Sched. 2009, 12, 345–360. [Google Scholar] [CrossRef]
  49. Chung, S.-H.; Chan, T.-S. A workload balancing genetic algorithm for the quay crane scheduling problem. Int. J. Prod. Res. 2013, 51, 4820–4834. [Google Scholar] [CrossRef]
  50. Kaveshgar, N.; Huynh, N.; Rahimian, S.-K. An efficient genetic algorithm for solving the quay crane scheduling problem. Expert Syst. Appl. 2012, 39, 13108–13117. [Google Scholar] [CrossRef]
  51. Chung, S.-H.; Choy, K.-L. A modified genetic algorithm for quay crane scheduling operations. Expert Syst. Appl. 2012, 39, 4213–4221. [Google Scholar] [CrossRef]
  52. Wang, Y.; Chen, Y.; Wang, K. A case study of genetic algorithms for quay crane scheduling. In Opportunities and Challenges for Next-Generation Applied Intelligence; Chien, B., Hong, T., Eds.; Studies in Computational Intelligence; Springer: Berlin/Heidelberg, Germany, 2009; p. 214. [Google Scholar]
  53. Borda, J. Memoire sur les elections au scrutin. Histoire de l’Academie Royale des Science 1781, 102, 657–665. [Google Scholar]
  54. Meilă, M.; Phadnis, K.; Patterson, A.; Bilmes, J. Consensus ranking under the exponential model. arXiv 2007, arXiv:1206.5265. [Google Scholar]
  55. Kim, K.; Park, Y. A crane scheduling method for port container terminals. Eur. J. Oper. Res. 2004, 156, 752–768. [Google Scholar] [CrossRef]
  56. Törnqvist, L.; Vartia, P.; Vartia, Y. How Should Relative Changes Be Measured? Am. Stat. 1985, 39, 43–46. [Google Scholar] [CrossRef]
  57. Srinivas, N.; Deb, K. Muiltiobjective optimization using nondominated sorting in genetic algorithms. Evol. Comput. 1994, 2, 221–248. [Google Scholar] [CrossRef]
  58. Deb, K.; Pratap, A.; Agarwal, S.; Meyarivan, T. A fast and elitist multiobjective genetic algorithm: NSGA-II. IEEE Trans. Evol. Comput. 2002, 6, 182–197. [Google Scholar] [CrossRef] [Green Version]
Figure 1. Exponential distribution using a distance between rankings.
Mca 26 00064 g001
Figure 2. Relation between factorized rankings and the moths’ location coordinates.
Mca 26 00064 g002
Figure 3. Sampling example.
Mca 26 00064 g003
Figure 4. Central ranking computing example.
Mca 26 00064 g004
Figure 5. Composition between permutations.
Mca 26 00064 g005
Figure 6. Factorization of the distance between permutations.
Mca 26 00064 g006
Figure 7. A moth allocation in the space.
Mca 26 00064 g007
Figure 8. Flames amount computing.
Mca 26 00064 g008
Figure 9. An example of the use the spiral function.
Mca 26 00064 g009
Figure 10. The core of the QCEDA approach.
Mca 26 00064 g010
Figure 11. Comparative results for the QCSP.
Mca 26 00064 g011
Figure 12. Performance of the multi-objective algorithms.
Mca 26 00064 g012
Figure 13. Comparative results.
Mca 26 00064 g013
Figure 14. Computational cost results.
Mca 26 00064 g014
Figure 15. Convergence patterns.
Mca 26 00064 g015
Table 1. A ranking example.
Rank1st2nd3rd4th5th
ElementΠΒαµ
Table 2. Rankings for the flowshop as an example.
Processing Sequence1st2nd3rd4th5th
Rank 1 J 5 J 3 J 1 J 4 J 2
Rank 2 J 5 J 1 J 4 J 3 J 2
Rank 3 J 3 J 1 J 2 J 4 J 5
Table 3. Factorization of the distance between rankings.
RankingsReference RankingDistanceFactorization Based on Fligner & Verducci [26]
4, 2, 5, 3, 11, 2, 3, 4, 57[3, 1, 2, 1]
5, 4, 1, 2, 37[4, 3, 0, 0]
Table 4. A task sequence vector example.
Ranking1st2nd3rd4th5th
Task(container)31425
Table 5. A quay crane assignment vector.
Ranking1st2nd3rd4th5th
Quay crane22113
Table 6. Quay crane assignment vectors.
Ranking1st2nd3rd4th5th
V 1 22113
V 2 32111
V 3 12221
V 4 31332
V 5 22122
V 6 23233
q 1 matrix
Quay crane p X 1 = x
11/6
23/6
32/6
Table 7. Flames allocation example.
FlamesFlame CoordinatesSorted MothsMoth Coordinates
1(0, 0, 1)1(0, 0, 1) *
2(3, 1, 0)2(3, 1, 0) *
3(2, 1, 2)3(2, 1, 2) *
4(0, 1, 0)
5(1, 1, 1)
6(3, 0, 0)
7(2, 2, 0)
8(2, 3, 0)
9(1, 0, 0)
* the best moths.
Table 8. Moth-flame assignment example.
MothsFlame
11
21
31
42
52
62
73
83
93
Table 9. Performance of the QCEDA using [55]’s instances.
Intervals
LayoutsTrials[0, 0.03)[0.03, 0.06)[0.06, or more)
902700193371354
71%26%3%
Table 10. Distribution of the results between pure EDAs and the QCEDA approach.
Intervals
Algorithms[0, 0.03)[0.03, 0.06)[0.06, or more)
MIMIC002700
COMIT002700
BOA002700
QCEDA for the QCSP193371354
Table 11. Distribution of the results between multi-objective algorithms and the QCEDA approach.
Intervals
Algorithms[0, 0.03)[0.03, 0.06)[0.06, or more)
NSGA160213029
NSGA-II159253026
QCEDA for the QCSP2008791411
Mca 26 00064 i001
Table 12. Distribution of the results between recent algorithms and the QCEDA approach.
Intervals
Algorithms[0, 0.03)[0.03, 0.06)[0.06, or more)
Chung & Choy [51]002700
Kaveshgar et al. [50]002700
Wang et al. [52]002700
Chung & Chan [49]002700
QCEDA for the QCSP155552490
Optimality Gap
Chung & Choy [51]Kaveshgar et al. [50]Wang et al. [52]Chung & Chan [49]QCEDA for the QCSP
2.73%2.68%2.76%2.63%2.48%
Publisher’s Note: MDPI stays neutral with regard to jurisdictional claims in published maps and institutional affiliations.

