Article

A Resolved Simulation Approach to Investigate the Separation Behavior in Solid Bowl Centrifuges Using Material Functions

1
Institute of Mechanical Process Engineering and Mechanics, Karlsruhe Institute of Technology, Straße am Forum 8, 76131 Karlsruhe, Germany
2
BASF SE, Carl-Bosch-Strasse 38, 67056 Ludwigshafen am Rhein, Germany
*
Author to whom correspondence should be addressed.
Separations 2022, 9(9), 248; https://doi.org/10.3390/separations9090248
Submission received: 20 July 2022 / Revised: 24 August 2022 / Accepted: 30 August 2022 / Published: 6 September 2022
(This article belongs to the Special Issue Research on Separation Performance of Separator)

Abstract

:
The separation of finely dispersed particles from liquids is a basic operation in mechanical process engineering. On an industrial scale, continuously operating decanter centrifuges are often used, whose separation principle is based on the density difference between the solid and the liquid phase due to high g-forces acting on both phases. The design of centrifuges is based on the experience on the individual manufacturer or simplified black box models, which only consider a stationary state. Neither the physical behavior of the separation process nor the sediment formation and its transport is considered. In this work, a computationally-efficient approach is proposed to simulate the separation process in decanter centrifuges. Thereby, the open-source computation software OpenFOAM was used to simulate the multiphase flow within the centrifuge. Sedimentation, consolidation of the sediment, and its transport are described by material functions which are derived from experiments. The interactions between the particles and the fluid are considered by locally defined viscosity functions. This work shows that the simulation method is suitable for describing the solid-liquid separation in a simplified test geometry of a decanter centrifuge. In addition, the influence of the rheological behavior on the flow in the test geometry can be observed for the first time.

1. Introduction

The separation of finely dispersed particles from liquids is a basic operation in mechanical process engineering. Various apparatuses serve for a wide variety of tasks such as clarification, classification, thickening, flotation, sorting or mechanical dewatering. For the separation of finely dispersed particles, centrifuges are used. The choice of a centrifuge and its individual design depends on its separation task and its integration into the process chain. Due to the centrifuge design, the direct observation of the flow behavior and transport processes within this apparatus is not possible. For this reason, the design is based on the experience of the manufacturer in combination with simplified black box models. The properties of the disperse and continuous phases as well as the interactions between the particles and the liquid have a significant influence on the separation process. However, neither the physical behavior of the separation process nor the sediment formation and its transport are taken into account for the design of the apparatus.
To enable a sustainable and more efficient use of the employed resources, several methods and calculation approaches already exist to improve the design of decanter centrifuges. Centrifuges are dimensioned by a simplified analytical approach, the Σ -theory [1]. This approach relies on the assumption that a particle settles with no influence from other particles in a resting fluid. In this case, the settling velocity can be described by the Stokes settling velocity [2]. Kynch [3] assumes that the settling velocity of the particles depends on the local particle concentration and formulates a mathematical model for calculating the separation process starting from the conservation of mass for solid and liquid phases under the influence of an external force. In addition, the work shows that there is a transition point between slurry and sediment at which an abrupt change in material behavior occurs. Based on this, the literature contains many models that describe the sedimentation hindrance as a function of the particle concentration [4,5] and the sediment built-up of finely dispersed particles within the saturated sediment as a function of the compression resistance due to permanent particle-particle contacts [6]. An extension of Kynch’s theory [3] to the separation process of flocculated systems in discontinuous centrifugation has been given by Garrido et al. [7] as well as Stickland et al. [8]. As critical solid volume fraction, the gel point has been introduced as a further material-specific parameter, which marks the transition from slurry to sediment.
Based on the determination of the residence time behavior in the decanter centrifuge, Gleiß and Nirschl [9] developed a dynamic model for the cylindrical part of the decanter. The compartment approach connects the material functions of sedimentation and consolidation derived from experiments with the residence time behavior in the decanter centrifuge. Thereby, it has been assumed that the entire liquid pond is flowed through. Menesklou et al. [10] added the conical part to this model. In addition to sedimentation and consolidation, the flow in the apparatus has a decisive influence on the separation efficiency. Complex flow motion may overlap sedimentation and consolidation [11]. The flow conditions in decanter centrifuges and thus the shape of the sediment are difficult to study due to the complex geometry. Investigations of the flow pattern in decanter centrifuges were carried out by coloring the liquid and in transparent plastic apparatuses at low centrifugal accelerations [11,12,13,14]. The entire liquid pond was flowed through, with the upper part of the current flowing in the direction of the weir and backflows observed in the lower part. Tamborrino et al. [15] developed a model to predict energy consumption and energy savings for a decanter centrifuge to control the olive oil process. The coupling of fluid dynamic as well as mechanical equations serves to identify the relevant parameters for the separation process. The model provides the basis for an adaptive control approach of decanter centrifuges. Bai et al. [16] have also developed a model to describe the separation process in decanter centrifuges that takes into account the flow pattern described by Madsen [14] in the apparatus.
Increasing computing power enables the study of separation processes and the flow behavior in centrifuges by means of CFD. Breitling et al. [17] have studied the flow conditions within a disc gap within the disc stack centrifuge. For this purpose, they compared the use of different turbulence models with the assumption of a laminar flow. The sediment formation was not considered. While particles separated under laminar flow conditions were not whirled up anymore, the separation behavior worsens strongly under turbulent flow conditions. Zink et al. [18] show that instabilities outside the disc stack significantly influence the volume flow rate in the individual disc gaps. Furthermore, the flow was less evenly distributed over the disc stack with an increasing number of discs. In a study investigating the transient flow in a tube centrifuge at a centrifugal acceleration of up to 38,500 g, Konrath et al. [19] show that the flow conditions strongly depend on the set operating parameters and influence not only the cut size and the fine fraction but also the sharpness of classification. Romani Fernandez et al. [20,21] simulate the multiphase flow in a solid bowl centrifuges and the sediment formation in a solid bowl centrifuge. They use a CFD-DEM approach, which allows a detailed study of particle movement and sediment formation, which were performed with the software Fluent. The disadvantage of this method was the high computational effort with increasing particle numbers, which was the reason that solely a maximum of 64,000 particles were simulated. Zhu et al. [22] investigated the effects of the fluid flow conditions on the solid volume fraction in decanter centrifuges by means of a steady-state flow calculation with the Eulerian-Eulerian method. The conical part was assumed to be a step-shaped channel. It was found that the solid volume concentrations at the outlet were unexpectedly high, up to 85%. Based on a numerical simulation analysis performed using Fluent software, Kang et al., [23]. propose a multiparameter optimization to improve the separation performance of decanter centrifuges using a genetic algorithm. The multiphase system was modeled using the Euler two-phase model. Higher separation performance was obtained without a gap between the bowl and the screw, and the presence of windows in the screw resulted in lower residence time of the clarified phase. The generic algorithm showed that the bowl speed and volumetric flow rate had the greatest influence on separation performance and energy consumption. Hammerich et al. [24,25,26] were the first to resolve sediment transport in a tubular centrifuge using CFD simulations. His simulation model takes into account sedimentation, sediment formation and the rheological behavior depending on the solid volume fraction. Therefore, the authors have developed a method to measure the flow behavior of liquid-saturated sediments. The interactions between the solid phase and the fluid were modeled with the kinematic viscosity. A distribution algorithm was used for the transport of the particles, for which a structured, homogeneous mesh was required.
The present study focuses on a simulation approach to simulate the separation process and the interaction with the local flow in solid bowl centrifuges. The complex design prevents the direct observation of the separation process in the apparatus. In addition, superposition of the separation by the flow and interactions between sediment and flow occur. This study introduces a new solver that allows the performance of long-term simulations of the separation process at the machine level. Based on work by Bürger and Concha [27], the flux density function has been implemented in CFD to represent the sedimentation behavior and the consolidation behavior. The material functions themselves have been derived from simple laboratory experiments. In this way, the material functions represent the interactions between disperse and continuous phases and their influence on the separation process. After the methodological Section 2, Section 3 shows the comparison between simulation model and results from literature as well as the comparison with the material functions derived from the experiments. Finally, the approach has been applied to a rotating test geometry.

2. Method

Centrifuges enable the separation of dispersed multiphase systems. Due to the high bowl speed, the acceleration force is many times higher than in earth’s gravity field. Accordingly, the separation velocity between the continuous liquid phase and the dispersed solid phase increases due to their density difference. There are three important interactions and physical processes which take place in solid bowl centrifuges: Sedimentation, consolidation and sediment transport. The flow conditions within the centrifuge determine whether or not a particle is separated. The particle movement results primarily from the settling velocity of the particles and the transport due to the flow. The separated particles form the sediment which has fundamentally different material properties than the slurry: Permanent particle-particle contacts allow the transfer of shear and normal stress within the sediment. The structure of the sediment depends on the interactions between the particles and the properties of the dispersed phase. In compressible sediments, the solids volume fraction is a function of the compression resistance (consolidation) and the time. The materials investigated in this work did not show any measurable time dependence, consequently the time was not taken into account as an additional parameter. The material properties and process conditions also influence the flow behavior of the sediment, which varies between the behavior of a pure liquid and a pure solid [28]. For example, liquid-saturated sediments have a yield point in contrast to the slurry. The flow behavior of sediments significantly affects the process behavior. In decanter centrifuges, the sediment is transported by the differential movement of the screw towards the cone, where it is lifted over the liquid level and finally discharged. A critical issue is the transportability of the sediment, which depends on its characteristics. In disc stack centrifuges, the slurry flows through a disc package. Due to the centrifugal force, the particles sediment against the underside of the disc above and flow into the solids holding space. The volume flow rate within the individual disc gaps varies, causing the residence time of the slurry to fluctuate, which has a significant effect on the separation efficiency [18].

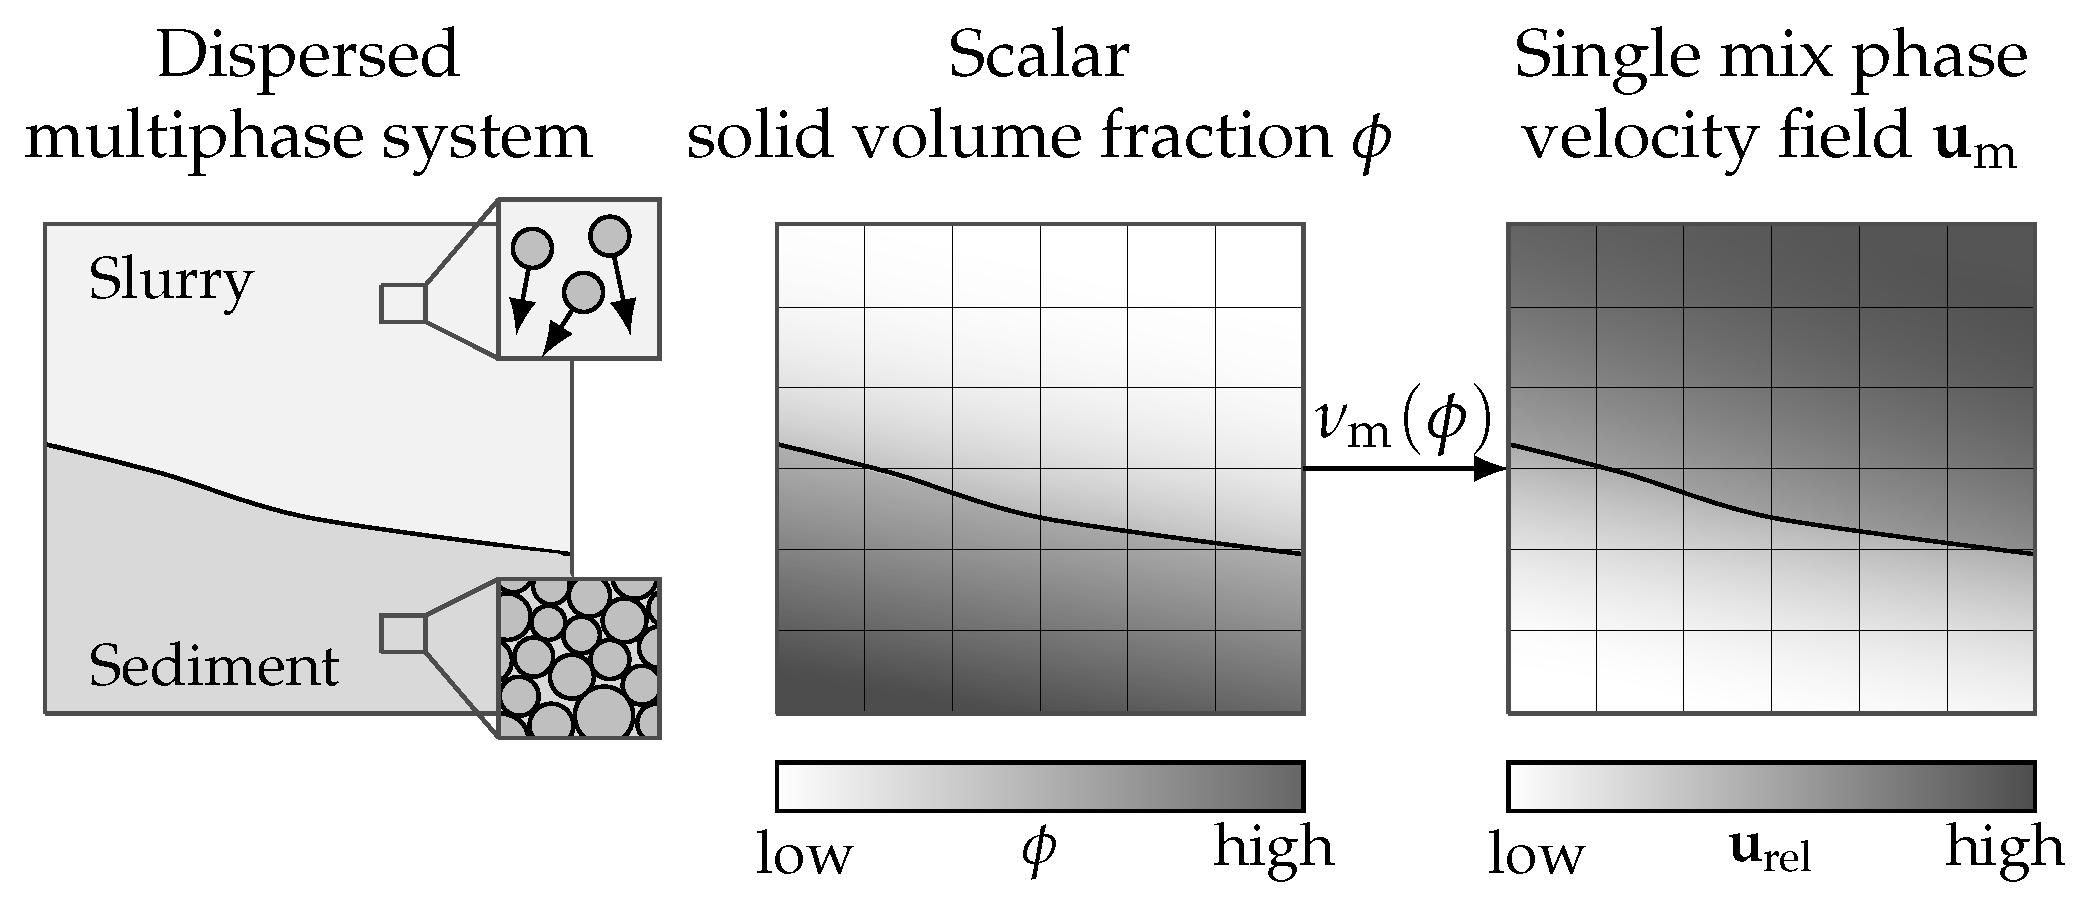
2.1. General Approach

The simulation approach adapts the basic concept of the drift-flux-model [29,30] and the Fast-Eulerian-Approach of Ferry and Balachander [31]. The key assumption related to the drift-flux model was that the dynamics of two phases can be expressed by one equation for the mixed phase. The use of the drift-flux model is appropriate for cases where the motions of two phases are strongly coupled. The Fast-Eulerian-Approach describes the motion of solutes in fluid flows via a volume-averaged transport equation. The physical behavior has been described using simplifications. Hammerich [25] has successfully applied this method to flow simulation in tubular centrifuges by arranging the solid fraction in the tubular centrifuge via a distribution algorithm. The sorting was based on a structured grid with equally sized cubic grid cells. The basis of this approach was the description of the sedimentation and consolidation behavior via the flux density function analogous to Bürger and Concha [27]. Solid particles and fluid are approached as a single mixed phase which is shown in Figure 1 similar to Hammerich [32].
Solving the Navier–Stokes equations for the mixed phase results in the velocity field u mix ( x , t ) , where x is the spatial position and t is the time. The dispersed phase does not directly affect the Navier–Stokes equations. Instead, model equations describe the flow behavior of slurry and sediment by means of the kinematic viscosity of the mixed phase. These model equations describe all the essential interactions between the particulate and liquid phase. As a result, there was no need to extend the Navier–Stokes equations with source terms to take into account the impulse transfer between the phases. Instead, solely one additional partial differential equation was solved, which led to a lower time requirement compared to the classical Eulerian-Eulerian approach. The mathematical description of the disperse phase was not based on the calculation of individual particle trajectories, but rather on the solid volume fraction:
ϕ = V p V m
the solids volume fraction ϕ describes the volume fraction of the particles V p in relation to the total volume of the mixture V m . The transport of the scalar is described by the flux density function [3,7]. The method was implemented in the open source software OpenFOAM (v1912, OpenCFD Ltd., Bracknell, United Kingdom) and was based on the solver pimpleFoam. The following assumptions were made:
  • The gas phase was neglected.
  • The approach was limited to the transport of an average particle size whereby the particles were of the same shape and density.
  • Both the particles and the liquid were incompressible.
  • There was no mass transfer between the components.
  • The settling velocity in the apparatus as well as consolidation and sediment transport depend only on the solids volume fraction. Thereby, the influence of the disperse phase and continuous phase and their interactions are modeled by material functions.
  • Wall effects were not taken into account.

2.2. Transport of Solid Phase

The transport of the solid phase was performed using the solid volume fraction ϕ of the particles. The partial differential equation (Equation (2)) was based on the unified model equation which is proposed by Garrido et al. [7]:
ϕ t + ϕ u mix + f b k ( ϕ ) r ω 2 g g r ω 2 k e r = D ( ϕ ) ϕ
and considers the description of solid-liquid interaction during sedimentation and centrifugation. A detailed description of the mathematical theory of sedimentation-consolidation processes has been given by Bürger [33]. The material behavior of the mixture was modeled by the flux density function f b k ( ϕ ) which solely depends on the solid volume fraction ϕ . In the centrifugal field, the g-force C = ω 2 r g affects the particles, whereby g is the gravity acceleration, r is the distance to the axis of rotation and ω is the angular velocity. The vectors k and e r are unit vectors: k is parallel to the rotation axis and e r is orthogonal to k and acts in the direction of the centrifugal force. The remaining parameter is the diffusion coefficient D ( ϕ ) .
The flux density function is defined as the product of solid volume fraction and the particle’s settling velocity u p .
f b k ( ϕ ) = ϕ u p
The settling velocity of one single, spherical particle u p , St with the diameter d p can be calculated according to the approach of Stokes [2] as:
u p , St = ρ p ρ l 18 η l d p 2 g
However, this approach applies solely to low particle Reynolds numbers ( Re p < 0.25 ). The parameters ρ P and ρ L describe the density of the solid and the liquid phase, η L is the dynamic viscosity of the liquid. According to Michaels and Bolger [5], the settling velocity of higher concentrated suspensions can be described as
u p = u p , St · 1 ϕ ϕ max n .
This approach was based on the Kynch theorem [3] and extends the approach of Richardson and Zaki [4] by adding the maximum solid volume fraction of the slurry ϕ max and the empirical parameter n.
The diffusion coefficient includes the compression resistance σ e ( ϕ ) and the flux density function f b k ( ϕ ) .
D ( ϕ ) = f b k ( ϕ ) σ e ( ϕ ) ρ p ρ l g ϕ ϕ corr
At the transition between slurry and sediment, there is a sudden change in material characteristics and consequently in flow conditions. While the diffusion coefficient within the sediment is more or equal to zero, the one in the slurry corresponds to zero. To mathematically distinguish between slurry and sediment, we define the correlation factor ϕ corr which depends on the critical solid volume fraction, the gel point. For stability reasons, ϕ corr was described by a sigmoid function.
ϕ corr = 1 2 1 erf λ 2 1 ϕ ϕ gel ϕ ϕ gel
If ϕ < ϕ gel the mixture is present as slurry and ϕ corr = 0 . If ϕ > ϕ gel the mixture forms a sediment and ϕ corr = 1 . The higher the parameter λ , the steeper the transition between slurry and sediment. The consolidation of the sediment depends on the properties of the disperse phase. Landman et al. [34] describe the consolidation behavior by a power approach and links the compression resistance
σ e ( ϕ ) = p 1 ϕ ϕ gel 1 p 2
with the solid volume fraction. The parameters p 1 and p 2 are empirical values.

2.3. Rheological Behavior

The rheological behavior has a significant influence on the separation process in centrifuges. Describing the rheological behavior in CFD, the dynamic viscosity is the presenting parameter and is defined as the ratio of the shear stress τ and the strain rate γ ˙ .
η = τ γ ˙
Since it was not possible to calculate the flow behavior based on the individual components of the mixture, the viscosity of the mixture was calculated as a function of the solid volume fraction. For modeling the viscosity of the slurry, Quemada’s approach [35] was used. He relates the viscosity of the slurry to the viscosity of the pure liquid and the ratio between the solid volume fraction and the maximum packing density. Effects such as shear thinning or shear thickening and any yield point that may occur are neglected.
η slurry = η l 1 1 ϕ ϕ max 2
Above the gel point, the flow behavior changes abruptly. Sediments show a complex flow behavior and have a yield locus resulting from the superposition of Coulomb friction at the particle contacts and viscous friction within the fluid [36,37]. Previous work on tubular centrifuge simulations [24] demonstrate that the sediment flow behavior can be described by a Herschel–Bulkley fluid.
τ sed = τ 0 + K γ ˙ n rheo
The model describes the flow behavior of the sediment respectively the shear stress τ sed by three parameters: the consistency K, the flow index n rheo and the yield locus τ 0 . All parameters may depend on the solids volume fraction and consequently on the consolidation of the sediment. Since the flow behavior of slurry and sediment differs strongly, the flow behavior of the mixture were described using the correlation factor ϕ corr . Furthermore, the kinematic viscosity ν
ν = η ρ
was used instead of the dynamic viscosity η because the presented solver was based on the Navier–Stokes equations for incompressible fluid flow. Consequently, the kinematic viscosity ν m consists proportionally of Equation (10) for the slurry as well as Equations (9) and (11) for the sediment
ν m = 1 ϕ corr η l ρ l 1 1 ϕ ϕ max 2 + ϕ corr 1 ρ m τ 0 + K γ ˙ n rheo γ ˙
and takes into account the different densities due to the different solid volume fractions.

3. Results and Discussion

A first verification of the mass transfer equation was carried out using the simplified case of pure batch sedimentation in the centrifugal field. This means that the liquid is at rest ( u mix = 0 ) and solely the disperse phase is moving. On the one hand, the simulation method was compared with the work by Bürger and Concha [27], and on the other hand, a comparison was made with our own measurement results. Based on this, the study shows the applicability of the methodology to complex geometries, such as in this case a rotating decanter screw.

3.1. Comparison with Literature

The approach of Bürger and Concha [27] for discontinuous centrifugation represents a widely used and thus validated model and serves as a validation of the developed simulation approach. Figure 2 shows the comparison between their model and the simulation approach. As product serves aqueous flocculated calcium carbonate with a density of 2700 kg m−3. The material functions correspond to Equations (3) and (5). In their work, Bürger and Concha [27] describe the consolidation behavior using Green’s power approach [38]. In the present case, the parameters were converted into the fitting parameters for the Landman approach (Equation (8)) [34]. The related parameters of the material functions as well as the material characteristics are listed in Table 1.
The inner and outer radius of the cuvette are r i = 0.06   m and r o = 0.3   m . The flow domain was discretized with 1300 cells in radial direction. The solids volume fraction at the beginning was 0.07. The values along the boundary of the simulation domain were defined as zero gradient or homogeneous Neumann condition for the solids volume fraction and set to zero (Dirichlet) for the flux density function. For the comparison, two different centrifugal accelerations, Z = 1000 g (center) and Z = 10,000 g (right) were simulated. The simulation time for Z = 1000 g was 7 s , and that for Z = 10,000 g was 0.7   s . The shown time intervals are Δ t = 1   s for Z = 1000 g and Δ t = 0.1   s for Z = 10,000 g. The comparison of the two models shows a good agreement for the time course of the sedimentation and the sediment formation. It can be seen that three zones are formed: In the upper part of the cuvette the liquid is clear, and no particles are present here ( ϕ = 0 ). A phase boundary marks the abrupt transition between the clarified fluid and the slurry which consists of liquid and particles ( 0 < ϕ < ϕ gel ). The solid particles accumulate at the bottom of the cuvette and form the sediment ( ϕ > ϕ gel ). Minor deviations with regard to consolidation are due to the choice of a different consolidation model. The transition between slurry and sediment is also characterized by an abrupt phase boundary. The three phases are additionally illustrated by the picture of the cuvette at time t = 3   s with a centrifugal acceleration of Z = 1000 g shown on the left in Figure 2. In summary, the validation shows that the presented approach is suitable for simulating solid-liquid separation due to acting centrifugal force in batch operation.

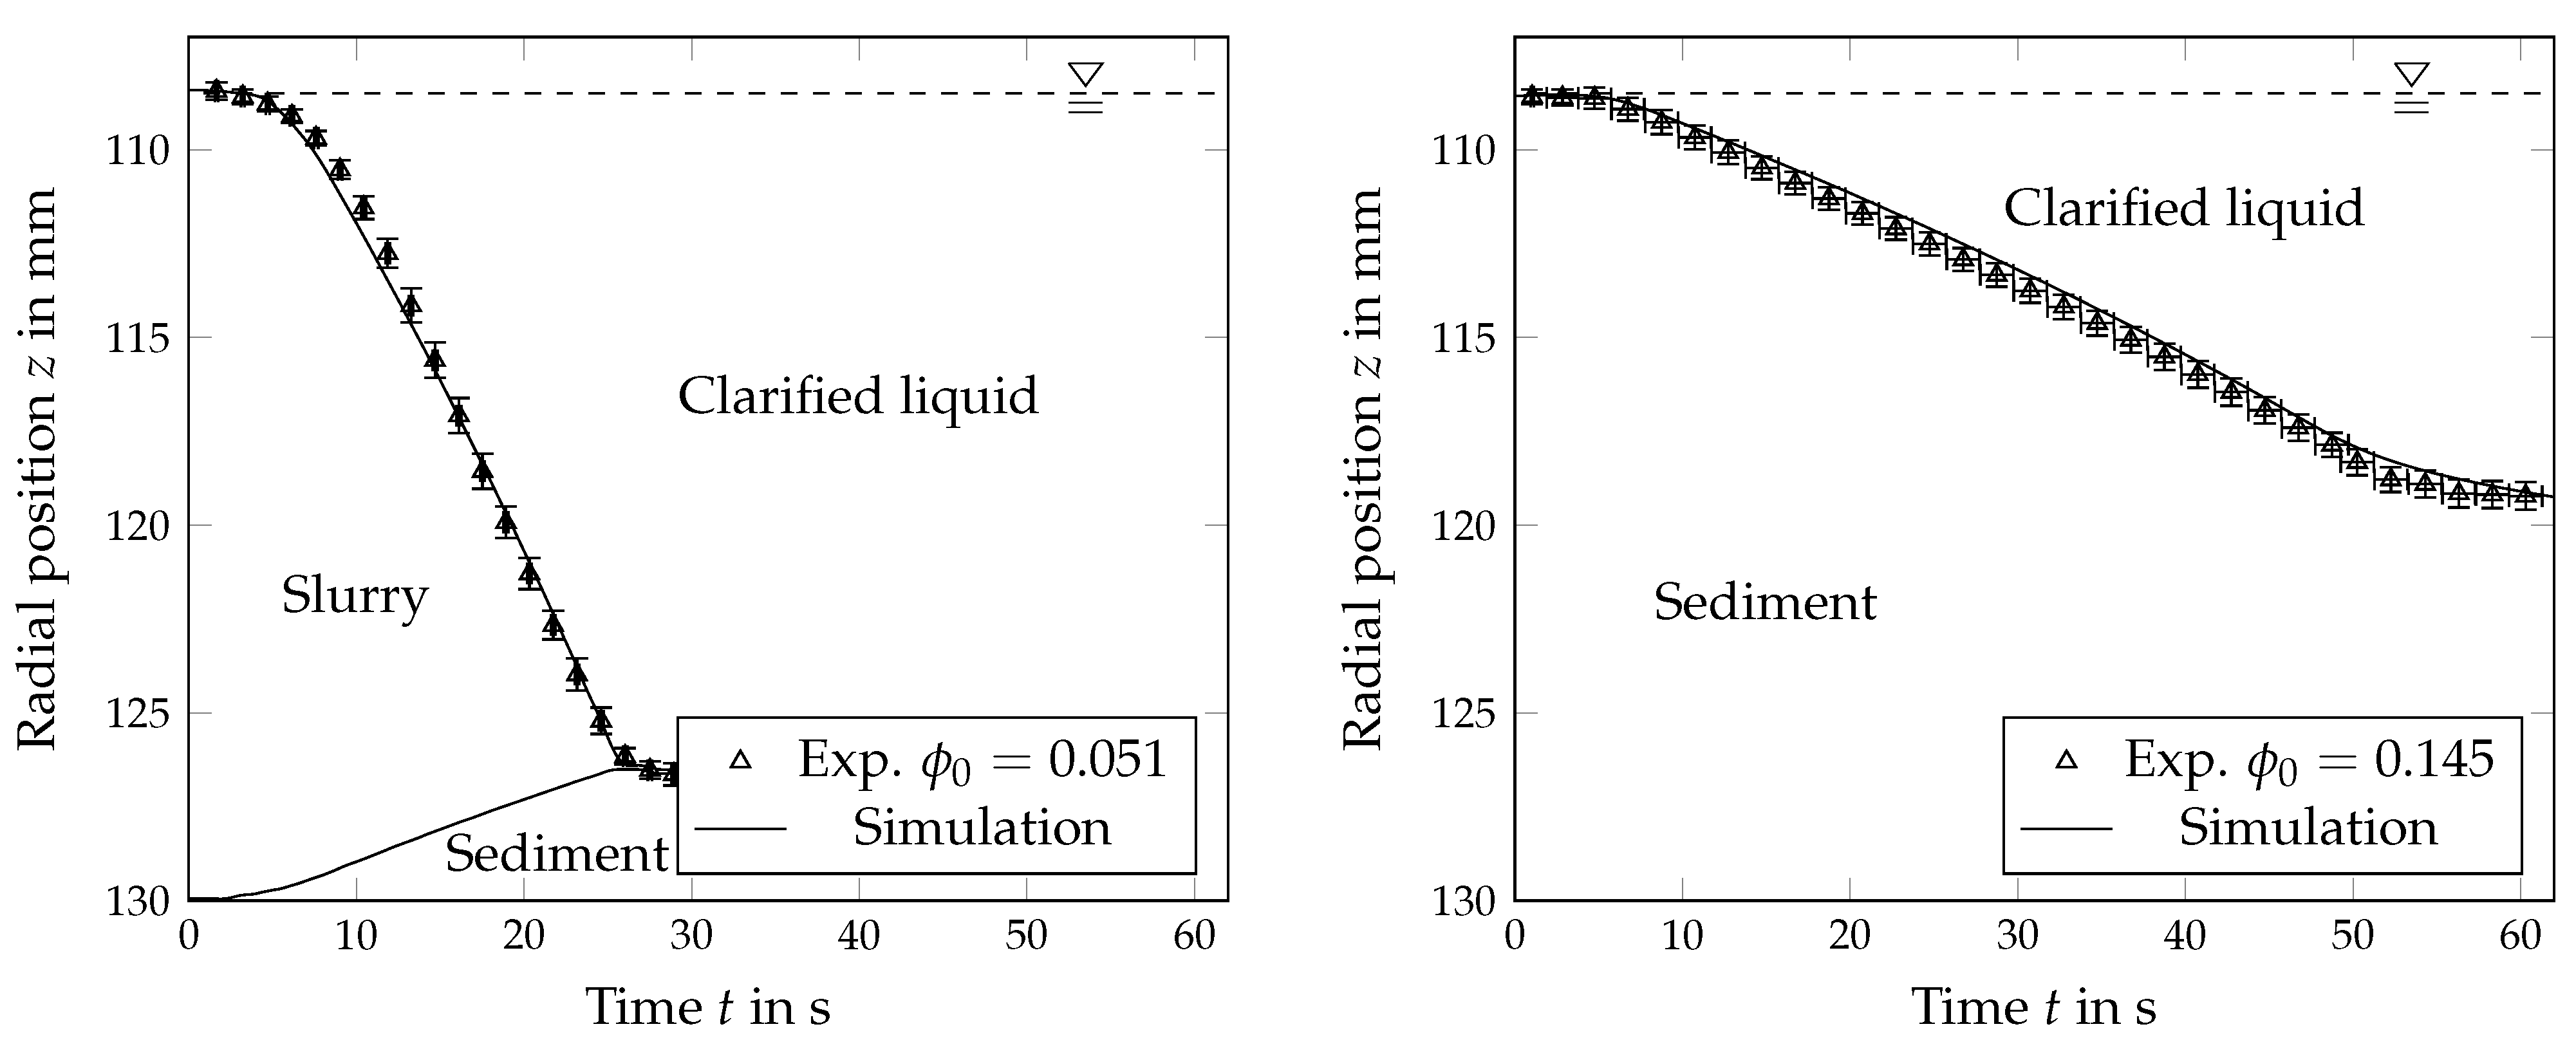
3.2. Comparison with Experiments

The simulation’s accuracy depends on the quality of the determined material functions. This section briefly explains the experimental measurement procedures for material characterization. Finally, the results are compared with the simulation method.

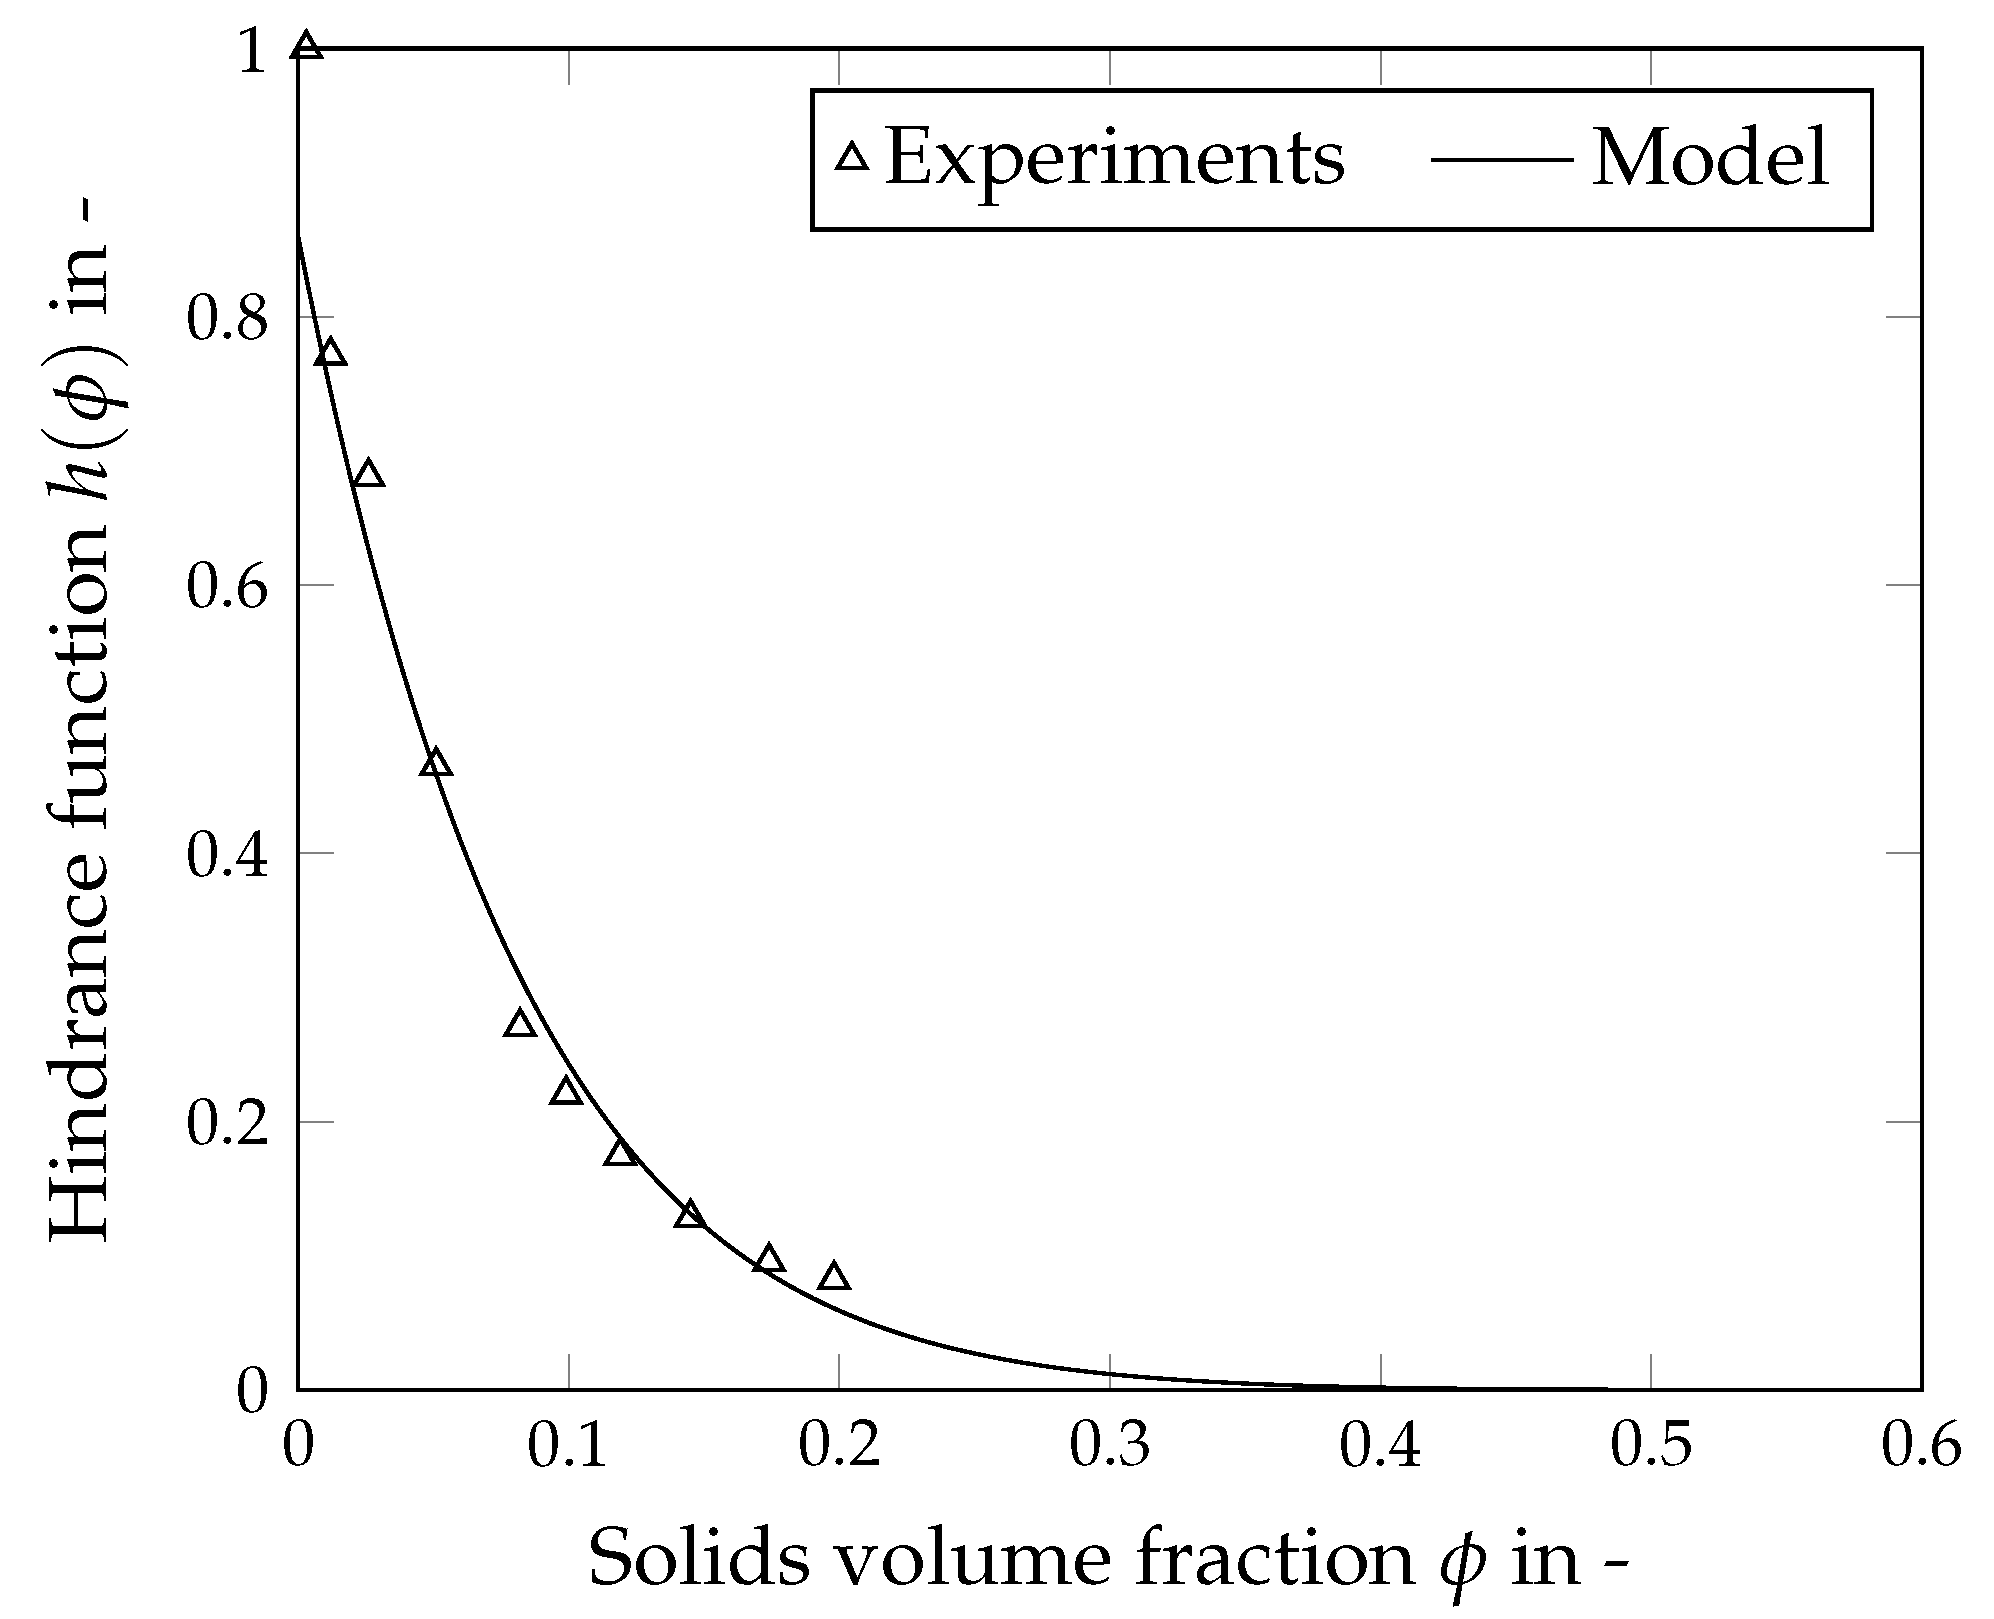
3.2.1. Hindrance Function

The hindrance function (Equation (5)) allows predicting the influence of the solids volume fraction on the sedimentation behavior and was determined by varying the solids volume fraction of the slurry using an analytical centrifuge (LUMiSizer, LUM GmbH, Berlin, Germany). To measure the settling velocity, samples of the dilution series are filled into cuvettes. During centrifugation, monochromatic light of constant wavelength illuminates the samples over their entire length. CCD-detectors on the opposite side record the transmission profiles of the light at defined time intervals. The change in transmission allows the calculation of the settling velocity of the particles in the sample. A more detailed description of the measuring principle was given by Lerche [39]. The advantage of the direct measurement and evaluation of the settling velocity is that the influence of both the disperse phase (e.g., particle size, particle shape, density), the continuous phase (e.g., density, viscosity) and their interactions are taken into account.
Figure 3 shows the measured hindrance function and its fit. To obtain the sedimentation hindrance, a pre-factor was added.
u p = u p , St · n 1 1 ϕ ϕ max n 2 h ( ϕ )
The maximum solid volume fraction ϕ max was assumed to be 1. The empirical parameters n 1 and n 2 take the values n 1 = 0.86 and n 2 = 12 . The algorithm calculates the flux density function analogously to Equation (3).

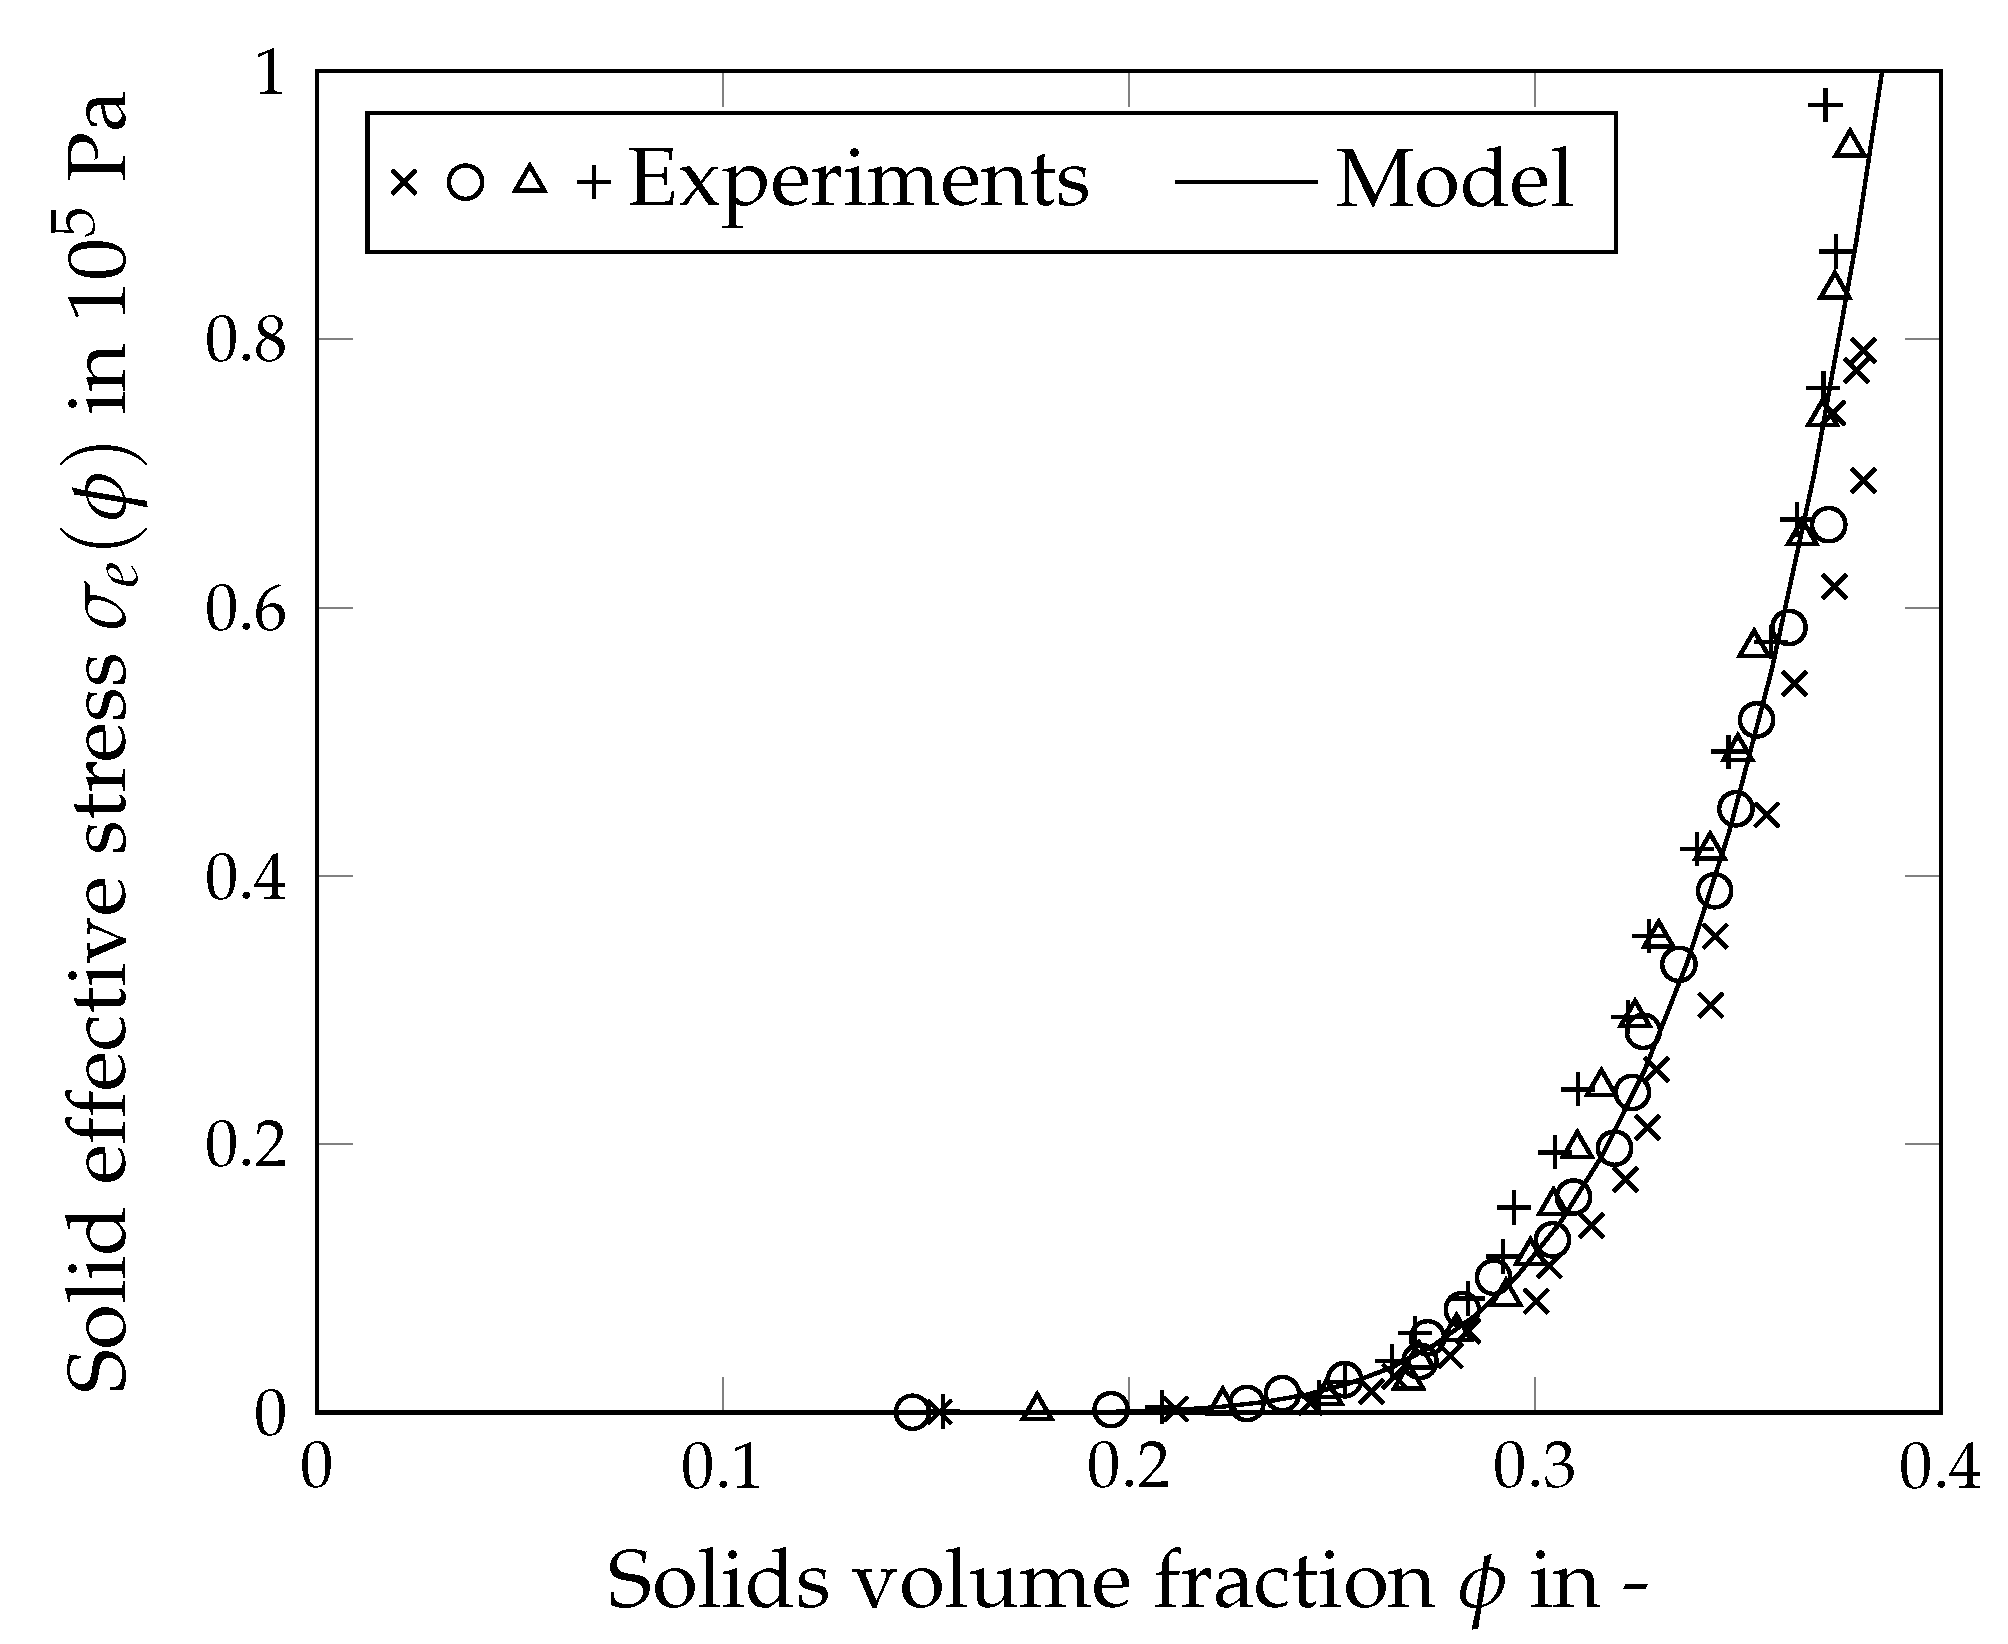
3.2.2. Consolidation Function

In addition to the sedimentation behavior, sediment formation is an important parameter for designing centrifuges. The sediment shows incompressible or compressible behavior depending on the properties of the dispersed phase such as particle size or shape. The characterization was carried out by cake experiments according to Reinach [40]. In this method, the slurry was centrifuged in a beaker centrifuge. The cake builds up on a movable base that can be turned axially out of the sedimentation insert. This makes it possible to remove layer by layer of the cake and determine the solids volume fraction of each layer as a function of the cake height. Reinach [40] gives a formula that allows the determination of the compression resistance for the sediment. The idea was that the sediment was in a state of equilibrium. In addition to centrifugal force and buoyancy force, the layer above presses on the considered layer and the layer itself transmits forces to the layer below. The cross-sectional area A of the sediment is constant, hence the respective pressures are summed up instead of the forces. The pressure of the layer’s particle network or its compression resistance was then calculated as follows:
σ e , i = ω 2 · ρ p ρ l ρ p A · j = 1 i 1 r j Δ m p , j + r i Δ m p , i 2
the variable r stands for the radial position starting from the axis of rotation of the beaker centrifuge, Δ m p is the solids mass of the respective layer. The index j marks the layer above the considered layer i. Figure 4 presents the results obtained from the laboratory experiments according to Reinach [40]. The measuring points follow the model of Landman [34], Equation (8). For the kaolin used, the fitting parameters take the values p 1 = 600 Pa and p 2 = 5 . In addition, the solid volume fraction was related to the gel point which lies at ϕ gel = 0.14 . The determination of the fit parameters and the gel point ensues iteratively.
The gel point must be lower than the solids volume fraction in the top sediment layer and lies at a theoretical consolidation of 0 Pa . The equilibrium batch settling method from Stickland [41] confirmed the gel point.

3.2.3. Findings

Analogous to the work of Bürger and Concha [27], the validation was carried out by simulating the cuvette in the centrifugal field. For this purpose, the results of the simulation were compared with the time course of the phase boundary between clarified liquid and slurry as well as between sediment and slurry from the experiment. The geometry was generated with the OpenFOAM utility blockmesh. In the radial direction, the sedimentation cuvette has 120 cells. Since the sedimentation time in the centrifugal field was very short and the start-up process to the target rotation speed takes almost 9 s . Then the speed was approximately constant. The start-up process was taken into account in the simulation (Figure 5).
Figure 6 shows the simulation results for the sedimentation of a slurry and the compaction of a sediment. The radial position of the sample in the centrifuge is plotted against time. For the slurry with a solid volume fraction of ϕ 0 = 0.051 , the start-up process of the centrifuge can be seen in the non-linear course of the phase boundary. The position of the phase boundary is more progressed at the beginning of the simulation compared to the measuring points, which results from the fact that the centrifugal acceleration is higher than the actual centrifugal acceleration. In comparison with Figure 5, which shows the start-up process of the centrifuge, exactly this phenomenon is recognizable. The fit for the start-up process gives a slightly higher value for the rotational speed. In the time interval between 8 and 10 s, however, the centrifugal acceleration is underestimated. As a result, sedimentation proceeds more slowly than in reality. With a solids volume fraction of ϕ 0 = 0.145 > ϕ gel the compaction of a sediment can also be seen. Again, the model reproduces the phase boundary between clear phase and sediment well. Overall, the material functions developed experimentally represent the measuring results well and the solid-liquid separation via batch centrifugation can be reproduced by simulation. In summary, the experiments presented are suitable for describing material behavior by simple material functions.

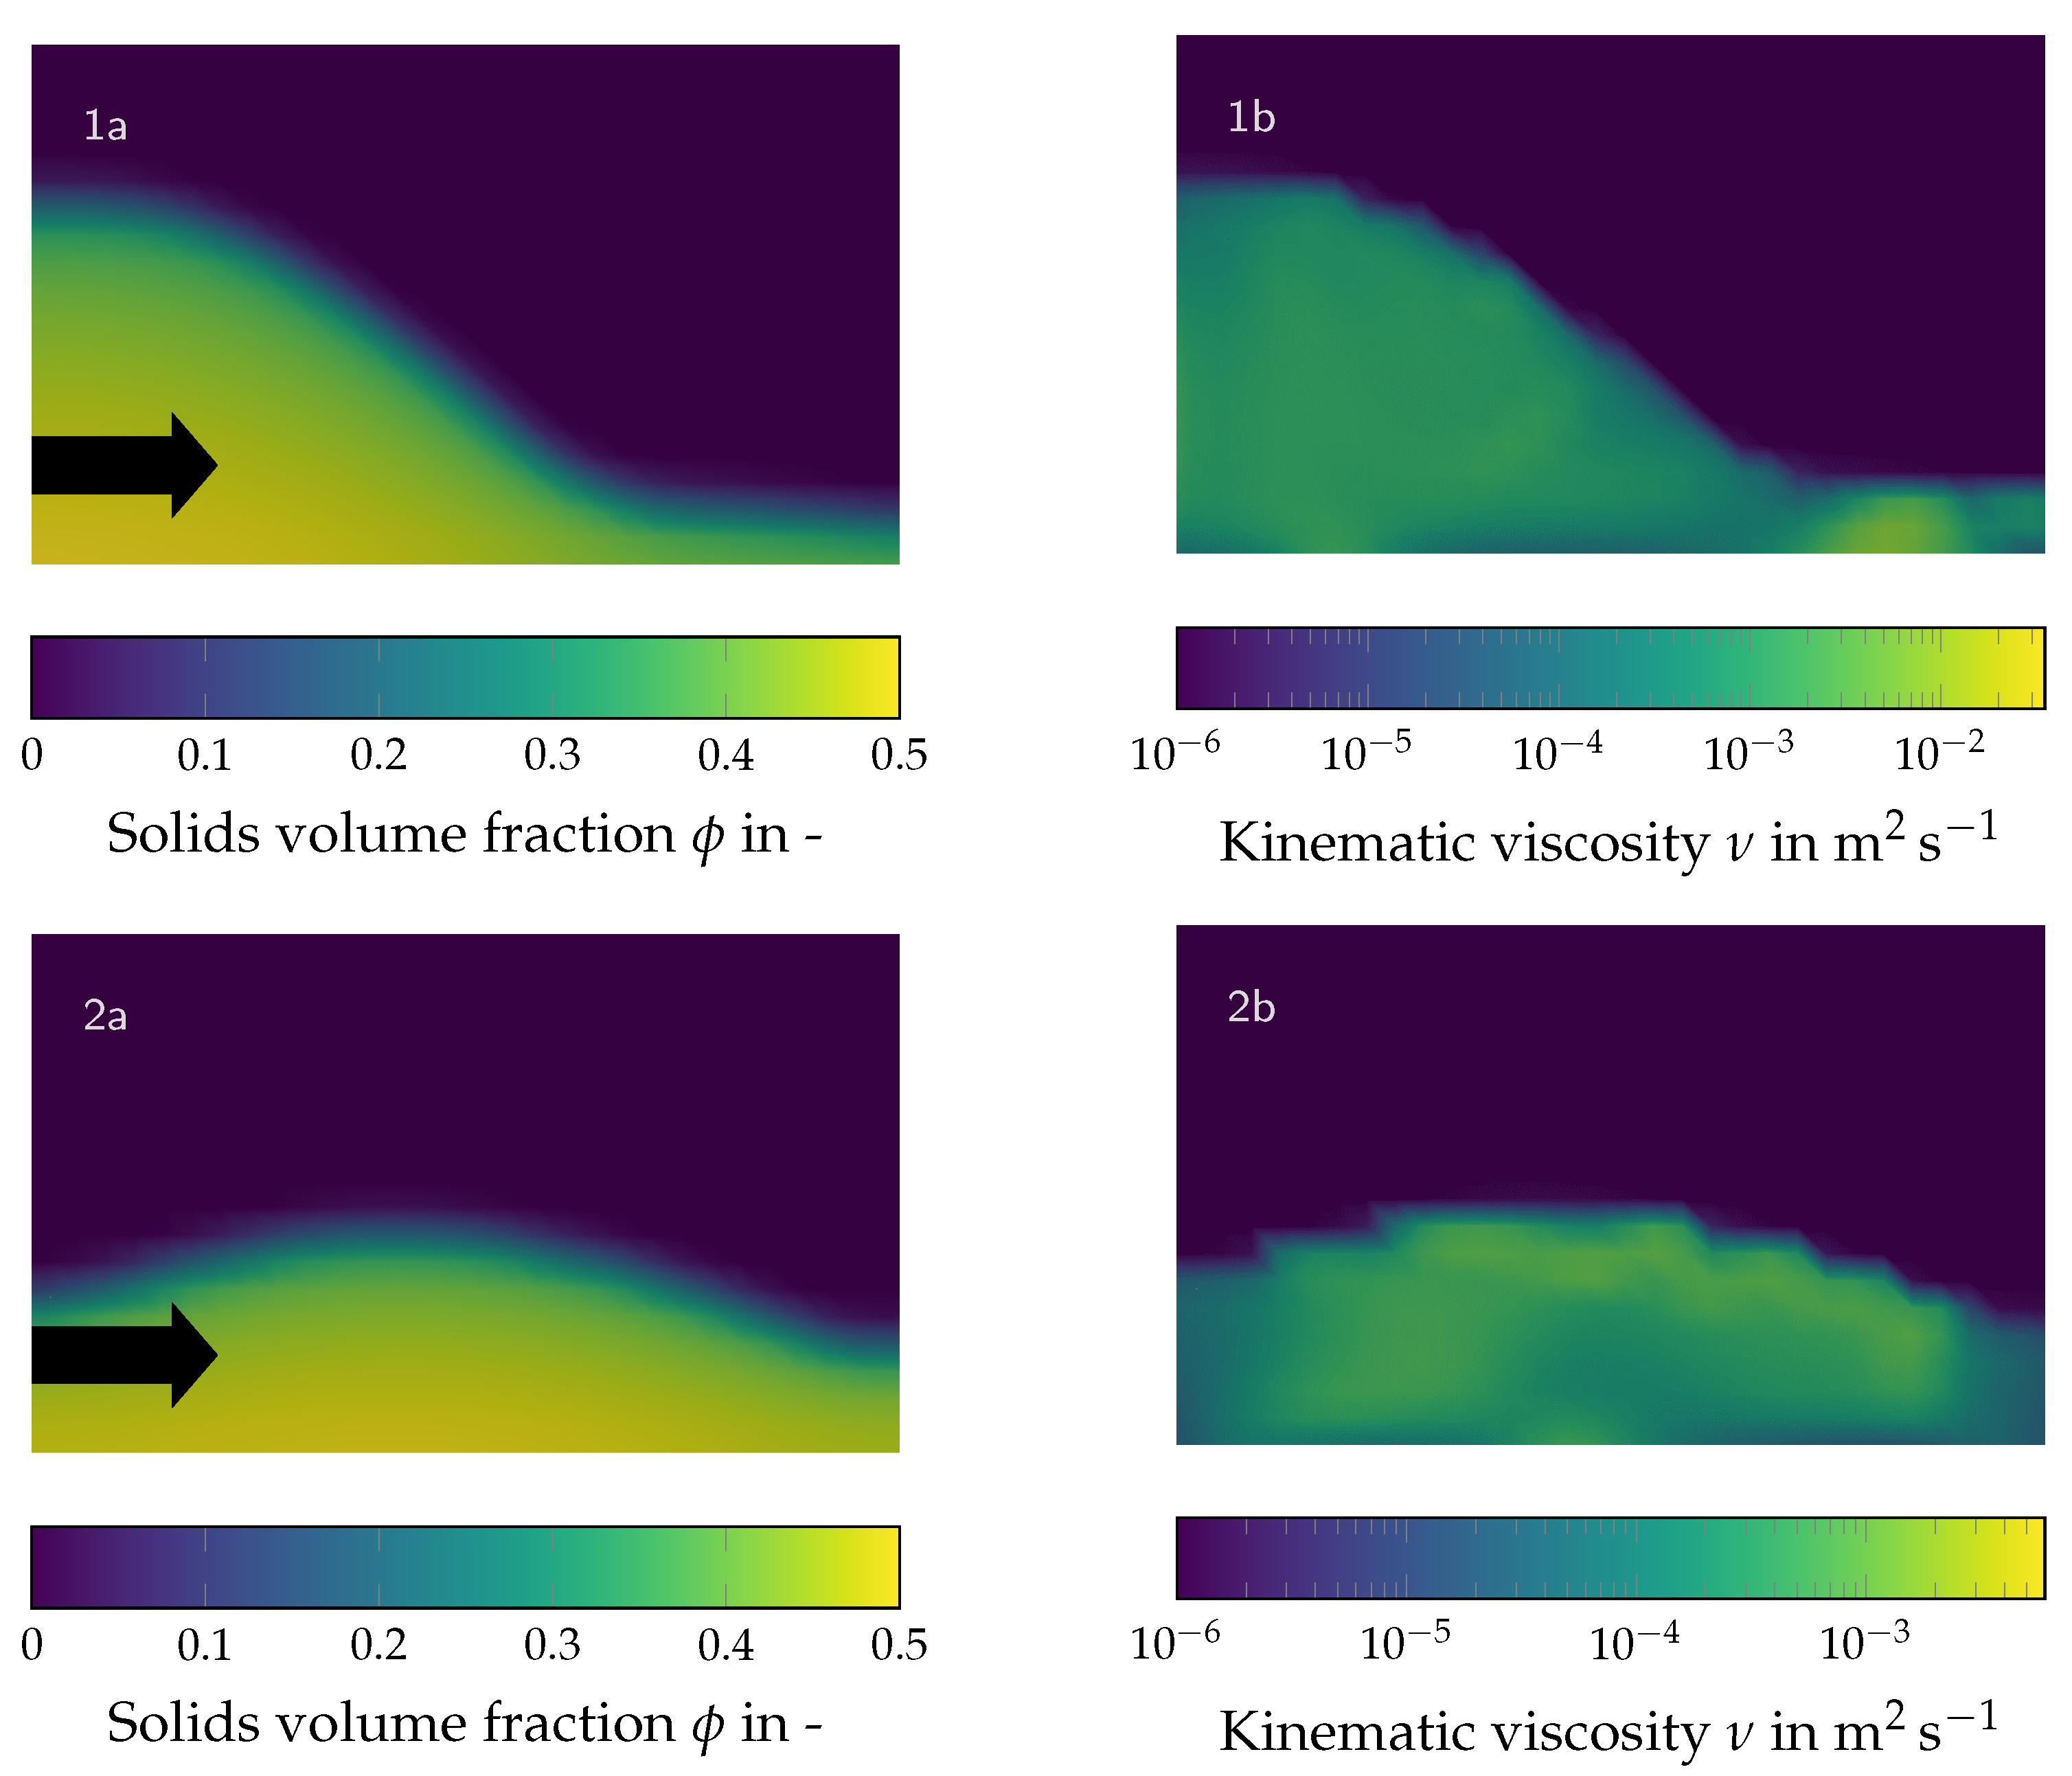
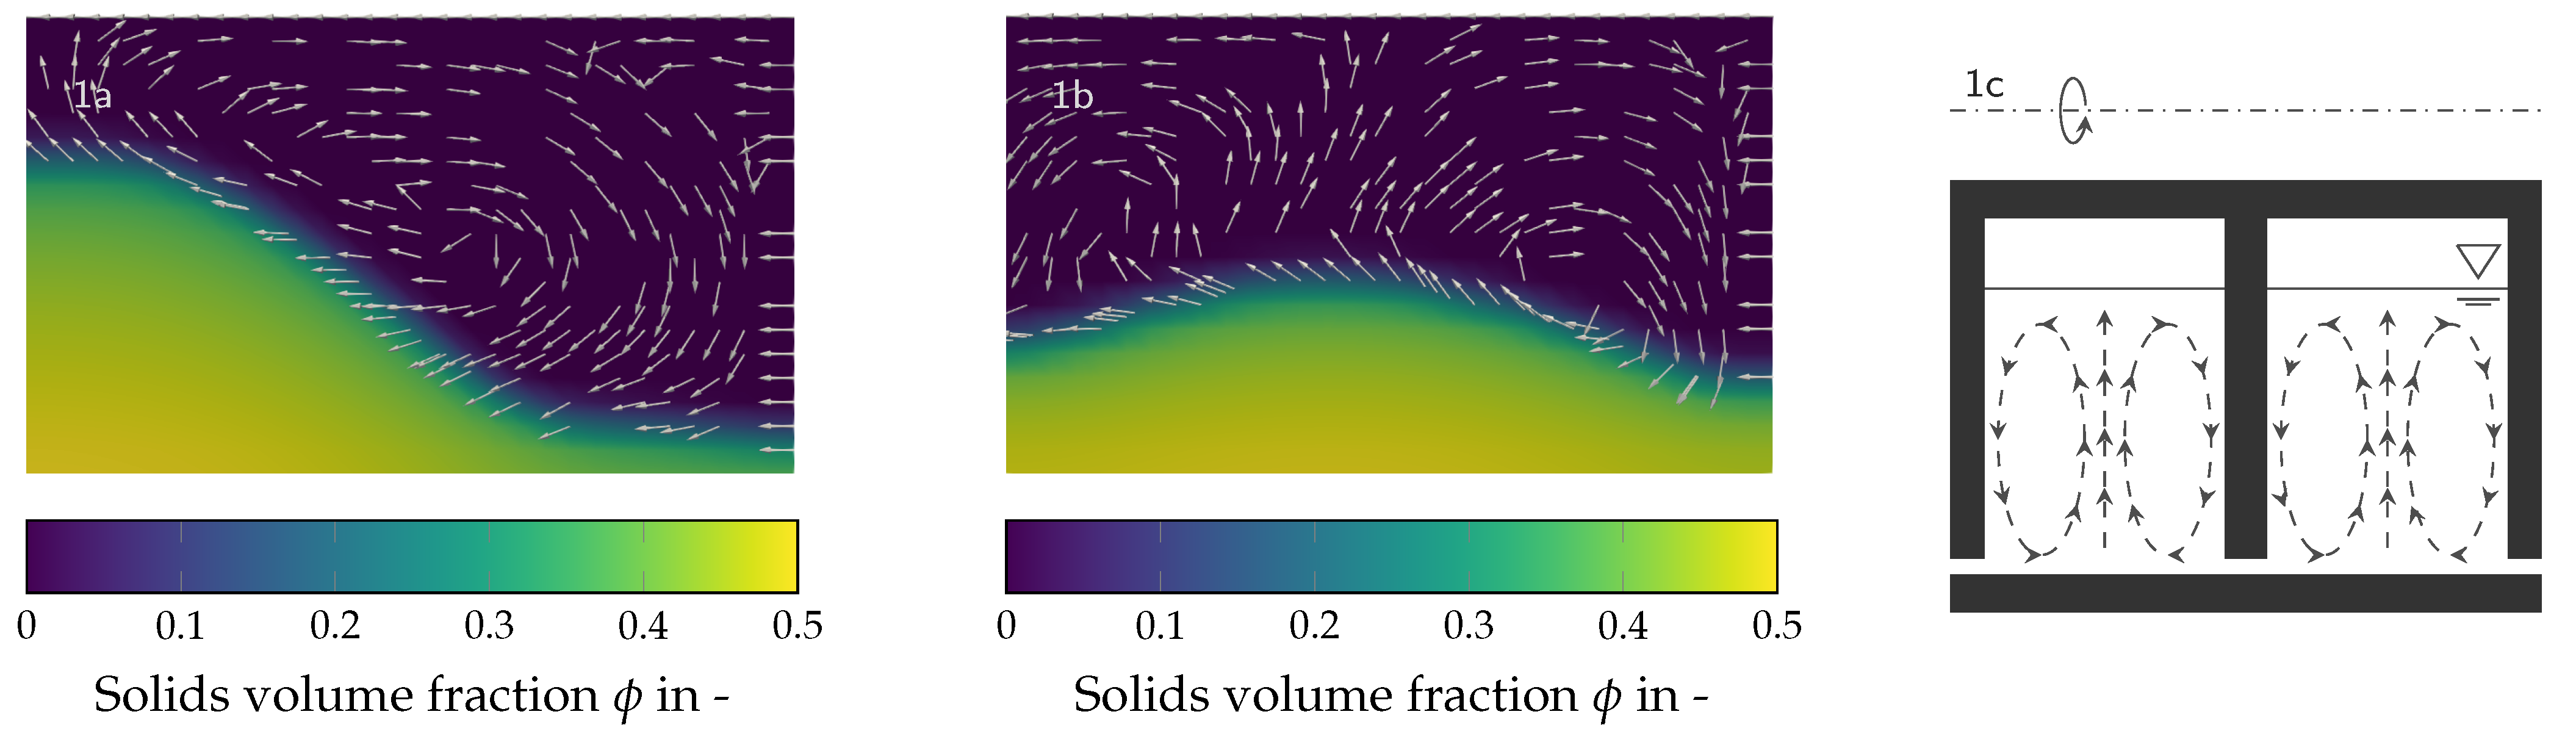
3.3. Transfer of the Methodology to Rotating Decanter Screw Element

Decanter centrifuges are fully continuous centrifuges that are suitable for separating very different materials and serve a very wide range of applications (thickening, clarification, dewatering, classification, etc.). It is possible to handle large quantities of slurry whereby the slurry can be highly diluted or concentrated. The simplified case of a counter current decanter centrifuge consists of two turns of a single-pitch helix, which is illustrated in Figure 7. In decanter centrifuges, the slurry flows into the apparatus through a feed pipe and enters the separation chamber at the transition between the cylindrical and conical part. The particles settle on the bowl wall and form the sediment, which is transported up the cone and out of the apparatus by the differential movement of the screw. In the opposite direction, the clarified liquid flows out of the apparatus via an overflow weir. A critical point for the separation process is the rheological behavior of slurry and sediment. The transport behavior of the sediment is one of the decisive factors regarding the suitability and design of the decanter centrifuge for the separation process. On the one hand, a high yield point can result in such high torque of the screw that the process has to be interrupted. Highly flowable materials, on the other hand, tend to flow back into the cylindrical part of the apparatus. This is one of the reasons why baffle discs are often used in the industry. Thereby, the flow behavior of the sediment depends both on the machine data such as the screw pitch, the liquid level or the differential speed and the material characteristics such as density and viscosity. A low differential speed can enable the transport of sediments with a low yield point. In contrast, a high differential speed causes higher shearing of the sediment, which leads to disturbances concerning to the transport behavior of highly flowable sediments. For this reason, experience has shown that pasty, sludge-like products are transported at very low differential speeds [11]. In the following, the suitability of the solver with regard to mapping different flow characteristics of the sediment will be investigated. The investigation was based on a simplified test case.

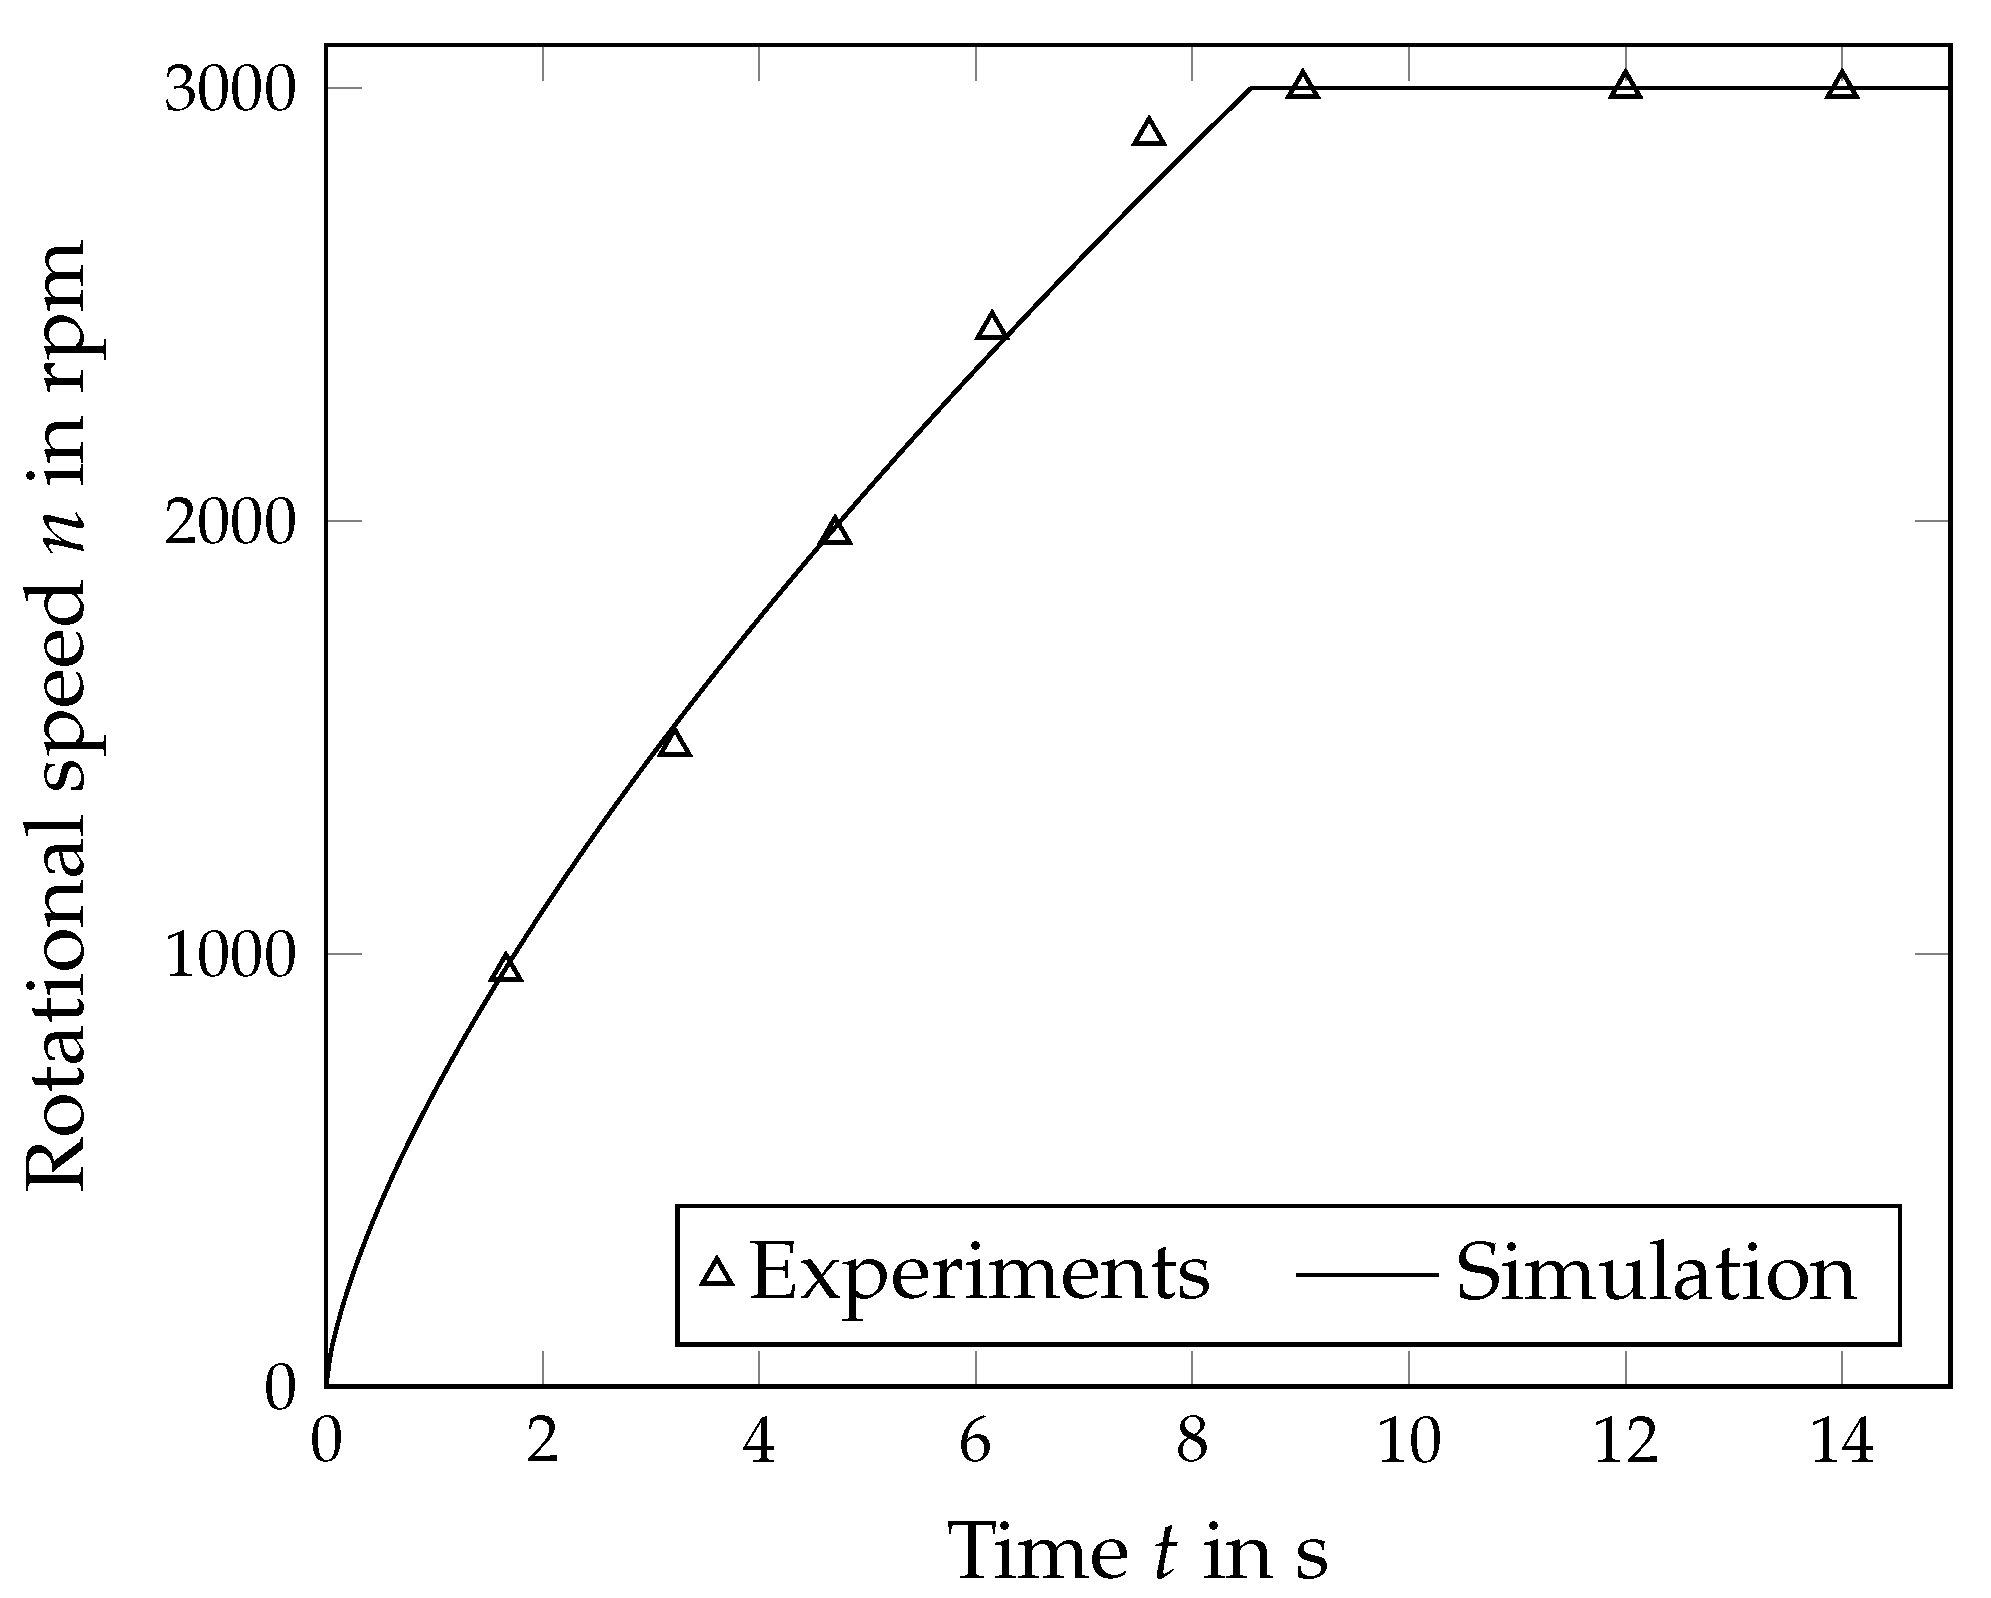
3.3.1. Geometry and Parameters

The geometry of the simplified case was based on the type MD-80 by the manufacturer Lemitec GmbH (Berlin, Germany). The outer radius of the bowl is 40 m m . The distance between the screw flights is 25 m m and the pond depth is 15 m m . The mesh consists of about 300,000 cells in the form of structured hexahedra. The gap between the tip of the screw flight and the bowl was not resolved. The simplified test case was a cyclic case, which means, that everything flowing out through the patch outAmi enters the flow domain again through the patch inAmi. The investigated geometry has neither an inlet nor an outlet. The flow in the decanter centrifuges was assumed as the rotation of a rigid body. The differential speed between screw and bowl was resolved using the dynamic mesh. For velocity, the adhesion condition was valid on the walls. The Neumann boundary condition applied to the pressure and the solids volume fraction at the walls. The presented evaluation was carried out on a slice plane cutting through the test geometry, which is highlighted in blue in Figure 7. The particle system was a limestone with a density of ρ s = 2700 kg m−3 and a mean particle size of x 50 , 3 = 4 × 10⁻⁵ m. The continuous phase was water with a density ρ l = 1000 kg m−3 and dynamic viscosity of η l = 1 mPa s. The material functions can be taken from Table 2. At the beginning of the simulation, the particles were homogeneously distributed in the test case, and the solids volume fraction was ϕ 0 = 0.07 . Both the influence of a sediment with and of a sediment without a yield point on the sediment shape and flow in the screw channel were investigated. Therefore, the parameters of the rheological model were varied. In the first case, the sediment was assumed to behave like a Bingham plastic. Thereby, the yield point was τ = 1 Pa , the consistency was k = 0.001  m2 s−1 and n rheo = 1 . The second case had no yield point. The description of the relative viscosity of the slurry follows the relationship between viscosity and solids concentration (Equation (10)) according to Quemada [35]. The parameters were freely chosen.

3.3.2. Sediment Formation and Flow Conditions

The rheological behavior of the sediment influences the shape of the sediment and its transportability. A significant influencing variable is the yield point. A low yield point may cause insufficient sediment transport up the cone and out of the decanter centrifuge. That is why nowadays decanter centrifuges are equipped with a baffle disc that prevents the sediment from flowing back into the cylindrical part of the centrifuge. In turn, a high yield point can mean that the sediment is not transportable. Figure 8 shows the two materials investigated with the test geometry. Material 1 has a yield point, while material 2 has no yield point which is a theoretical extreme case. The particles are completely separated in both cases. First, we take a look on the sediment with yield point: The screw transport leads to a pushing of the cake into a triangular to trapezoidal shape (1a). The solids volume fraction increases towards the bowl wall and the pushing screw flight. The maximum solids volume fraction due to the compressible behavior of the liquid saturated sediment was ϕ = 0.51 . Knowledge of the sediment thickness in the cylindrical part of the decanter centrifuge is important, as it can have a strong influence on clarification, transportability and consequently on the resulting torque. In the center, the kinematic viscosity is shown (1b). The viscosity in the sediment was up to four orders of magnitude greater than that of the clarified liquid phase. In the model, the solids volume fraction and the flow velocity were coupled via the viscosity of the mixed phase whereby the sediment was modeled as Bingham plastic. If we take a look on the sediment without yield point, we find that the sediment was evenly distributed on the bowl wall, being slightly accumulated in the center of the screw channel (2a). The viscosity corresponds to the solids volume fraction. The clarified liquid represents water, the sediment has a relatively higher viscosity (2b).
The differential speed as well as the rheological characteristics of the sediment cause the flow behavior and thus the shape of the sediment. Figure 9 shows the flow profile from the point of view of the co-moving observer. For this purpose, the sliding speed of the screw was subtracted. Both the flow through the apparatus in the x-direction and the feed of the fluid by the screw movement are thus hidden. Solely the flow acting locally on the sediment can be seen. If the sediment has a yield point (1a) and accumulates at the screw flank, the overflowing liquid forms a vortex which presses the sediment into its shape. In contrast, if the sediment has no yield point (1b), the overflowing clear phase forms two ring vortices. The sediment is pressed against the bowl wall and accumulates in the center of the screw flight. Stahl [11] has already theoretically discussed the influence of the differential speed on the flow: An excessively high differential screw speed can have a disruptive effect on the separation process in the apparatus. If it is assumed that the pitch of the screw approaches zero, the screw turns into individual discs that are separated from each other. The screw behaves like a radial flow impeller (e.g., Rushton turbine). He describes the resulting flow as a symmetrical stationary flow with two oppositely rotating vortices (Figure 9(1c)). The investigated product system shows exactly this behavior. Instead of an excessively high differential speed, however, the sediment has no yield point, which is equivalent to the limiting case described by Stahl [11].

4. Conclusions and Outlook

The developed method enables to investigate the fluid motion of separation processes in solid bowl centrifuges (batch, tubular and decanter centrifuges). The solver was integrated into the open source software package OpenFOAM and is an extension of the standard solver pimpleFoam. The basis of the algorithm is the consideration of disperse and continuous phase as a mixture. The flow of the mixed phase was calculated by the Navier–Stokes equations. Concurrently, a separate transport equation of the dispersed phase describes the sedimentation relative to the flow of the mixed phase, the sediment formation and its consolidation. The influence of the solids volume fraction on the flow conditions takes place via the rheological behavior of the mixed phase. The flow behavior of the slurry was described by Quemada’s approach. In contrast, the sediment has a yield point and was treated as a Bingham plastic. In addition to the influence of the disperse phase on the flow, the approach allows the visualization of the sediment transport of deposited particles due to sediment flow. The level of detail regarding sediment flow still offers a lot of potential, depending on the field of application. By default, the description of a complex flow behavior in numerical flow simulations is done by a Herschel-Bulkley-fluid. However, the Newtonian shear stress approach solely allows to model the stress state above the yield point. To represent a sediment at rest, it is therefore necessary to calculate the applied shear stresses in addition to the shear rate. Shear-thinning or shear-thickening flow behavior due to the particulate phase as well as wall effects and wall gliding were also not mapped here but may be considered by adjusting the rheological model. The interactions between sediment and flow represented by the flow behavior of the mixed phase provide a sufficient level of detail of the separation process and the flow in the apparatus. This paper shows that data from the literature can be reproduced and that the laboratory experiments are suitable for deriving material functions and thus for reproducing the sedimentation and consolidation behavior in batch operation. Furthermore, the paper shows that the solver can be applied to complex geometries such as the screw in a decanter centrifuge. In future work, this approach will be transferred to other solid bowl centrifuges such as decanter and disc stack centrifuges. The medium-term goal is to derive information on the process characteristics of the separation process from the flow simulations and thus to support process design and optimization.

Author Contributions

Conceptualization, H.K.B.; methodology, H.K.B. and M.G.; validation, H.K.B.; formal analysis, H.K.B.; investigation, H.K.B.; software, H.K.B. and S.H.; visualization, H.K.B.; writing—original draft preparation, H.K.B.; writing—review and editing, H.K.B., S.H., H.K., M.G. and H.N.; resources, H.N.; supervision, H.N.; project administration, H.K.B., H.K. and S.H. All authors have read and agreed to the published version of the manuscript.

Funding

This research was funded by BASF SE.

Institutional Review Board Statement

Not applicable.

Informed Consent Statement

Not applicable.

Data Availability Statement

Not applicable.

Acknowledgments

The authors would like to thank all students and colleagues who have contributed to the successful completion of this work. Furthermore, they acknowledge support by the state of Baden-Württemberg through bwHPC and by the KIT-Publication Fund of the Karlsruhe Institute of Technology.

Conflicts of Interest

The authors declare that they have no known competing financial interests or personal relationships that could have appeared to influence the work reported in this paper.

References

  1. Ambler, C. The evaluation of centrifuge performance. Chem. Eng. Prog. 1952, 48, 150–158. [Google Scholar]
  2. Stokes, G.G. On the effect of internal friction of fluids on the motion of pendulums. Trans. Camb. Philos. Soc. 1851, 9, 8–106. [Google Scholar]
  3. Kynch, G.J. A theory of sedimentation. Trans. Faraday Soc. 1951, 48, 166–176. [Google Scholar] [CrossRef]
  4. Richardson, J.F.; Zaki, W.N. The sedimentation of a suspension of uniform spheres under conditions of viscous flow. Chem. Eng. Sci. 1954, 3, 65–73. [Google Scholar] [CrossRef]
  5. Michaels, A.S.; Bolger, J.C. Settling rates and sediment volumes of flucculated Kaolin suspensions. Ind. Eng. Chem. Fundam. 1961, 1, 24–33. [Google Scholar] [CrossRef]
  6. Buscall, R.; White, L.R. The consolidation of concentrated suspensions-Part 1-The theory of sedimentation. J. Chem. Soc. Faraday Trans. Phys. Chem. Condens. Phases 1987, 83, 873–891. [Google Scholar] [CrossRef]
  7. Garrido, P.; Concha, F.; Bürger, R. Settling velocities of particulate systems: 14. Unified model of sedimentation, centrifugation and filtration of flocculated suspensions. Int. J. Miner. Process. 2003, 72, 57–74. [Google Scholar] [CrossRef]
  8. Stickland, A.D.; White, L.R.; Scales, P.J. Modeling of solid-bowl batch centrifugation of flocculated suspensions. Am. Inst. Chem. Eng. J. (AIChE) 2006, 52, 1351–1362. [Google Scholar] [CrossRef]
  9. Gleiß, M.; Nirschl, H. Dynamic simulation of mechanical fluid separation in solid bowl centrifuges. In Dynamic Flowsheet Simulation of Solids Processes; Heinrich, S., Ed.; Springer Nature Switzerland AG: Cham, Switzerland, 2020; pp. 237–268. [Google Scholar]
  10. Menesklou, P.; Nirschl, H.; Gleiß, M. Dewatering of finely dispersed calcium carbonate-water slurries in decanter centrifuges: About modelling of a dynamic simulation tool. Sep. Purif. Technol. 2020, 251, 117287. [Google Scholar] [CrossRef]
  11. Stahl, W.H. Fest-Flüssig-Trennung. 2, Industrie-Zentrifugen; Maschinen-& Verfahrenstechnik, DrM Press: Männedorf, Switzerland, 2004. (In German) [Google Scholar]
  12. Bass, E. Strömungen im fliehkraftfeld. I. Period. Polytech. Eng. Maschinen Und Bauwes. 1959, 3, 321–340. (In German) [Google Scholar]
  13. Faust, T. and Gösele W. Untersuchungen zur klärwirkung von dekantierzentrifugen. Chem. Ing. Tech. 1985, 8, 698–699. (In German) [Google Scholar] [CrossRef]
  14. Madsen, B. Flow and sedimentation in decanter centrifuge. Int. Chem. Eng. Symp. Ser. 1993, 7, 263–266. [Google Scholar]
  15. Tamborrino, A.; Perone, C.; Catalano, F.; Squeo, G.; Caponio, F. and Bianchi, B. Modelling Energy Consumption and Energy-Saving in High-Quality Olive Oil Decanter Centrifuge: Numerical Study and Experimental Validation. Energies 2019, 12, 2592. [Google Scholar] [CrossRef]
  16. Bai, C.; Park, H.; Wang, L. Modelling solid-liquid separation and particle size classification in decanter centrifuges. Sep. Purif. Technol. 2021, 8, 118408. [Google Scholar] [CrossRef]
  17. Breitling, M.; Janoske, U.; Piesche, M. Numerische Simulationen transienter und turbulenter Strömungen–Abscheideverhalten in tellerseparatoren. Chem. Ing. Tech. 2003, 75, 184–188. (In German) [Google Scholar] [CrossRef]
  18. Zink, A.; Piesche, M.; Trautmann, P.; Durst, M. Numerical and Experimental Investigations of a Disc Stack Centrifuge Used as an Oil Mist Separator for Automotive Applications. In Proceedings of the SAE 2004 World Congress & Exhibition, Detroit, MI, USA, 8–11 March 2004. [Google Scholar]
  19. Konrath, M.; Brenner, A.-K.; Dillner, E.; Nirschl, H. Centrifugal classification of ultrafine particles: Influence of suspension properties and operating parameters on classification sharpness. Sep. Purif. Technol. 2015, 156, 61–70. [Google Scholar] [CrossRef]
  20. Fernández, X.R.; Nirschl, H. Multiphase CFD simulation of a solid bowl centrifuge. Chem. Eng. Technol. 2009, 32, 719–725. [Google Scholar] [CrossRef]
  21. Fernández, X.R.; Nirschl, H. Simulation of particles and sediment behaviour in centrifugal field by coupling CFD and DEM. Chem. Eng. Sci. 2013, 94, 7–19. [Google Scholar] [CrossRef]
  22. Zhu, G.; Tan, W.; Yu, Y.; Liu, L. Experimental and numerical study of the solid concentration distribution in a horizontal screw decanter centrifuge. Ind. Eng. Chem. Res. 2013, 52, 17249–17256. [Google Scholar] [CrossRef]
  23. Kang, X.; Cai, L.; Li, Y.; Gao, X.; Bai, G. Investigation on the Separation Performance and Multiparameter Optimization of Decanter Centrifuges. Processes 2022, 10, 1284. [Google Scholar] [CrossRef]
  24. Hammerich, S.; Gleiß, M.; Kespe, M.; Nirschl, H. An efficient numerical approach for transient simulation of multiphase flow behavior in centrifuges. Chem. Eng. Technol. 2017, 41, 44–50. [Google Scholar] [CrossRef]
  25. Hammerich, S.; Gleiß, M.; Stickland, A.D.; Nirschl, H. A computationally-efficient method for modelling the transient consolidation behavior of saturated compressive particulate networks. Sep. Purif. Technol. 2019, 220, 222–230. [Google Scholar] [CrossRef]
  26. Hammerich, S.; Stickland, A.D.; Radel, B.; Gleiß, M.; Nirschl, H. Modified shear cell for characterization of the rheological behavior of particulate networks under compression. Particuology 2020, 51, 1–9. [Google Scholar] [CrossRef]
  27. Bürger, R.; Concha, F. Settling velocities of particulate systems: 12. Batch centrifugation of flocculated suspensions. Int. J. Miner. Process. 2001, 63, 115–145. [Google Scholar] [CrossRef]
  28. Schulze, D. Powders and Bulk Solids–Behavior, Characterization, Storage and Flow; Springer: Berlin/Heidelberg, Germany, 2008. [Google Scholar]
  29. Wallis, G. Novak Zuber and the drift flux model. Multiph. Sci. Technol. 2013, 25, 107–112. [Google Scholar] [CrossRef]
  30. Zuber, N.; Findlay, J.A. Average volumetric concentration in two-phase flow systems. J. Heat Transf. 1965, 87, 453–468. [Google Scholar] [CrossRef]
  31. Ferry, J.; Balachandar, S. A fast Eulerian method for disperse two-phase flow. Int. J. Multiph. Flow 2001, 27, 1199–1226. [Google Scholar] [CrossRef]
  32. Hammerich, S. Numerische Simulation des Fest-Flüssig-Trennprozesses in Vollmantelzentrifugen (German). Ph.D. Thesis, Karlsruhe Institute of Technology, Karlsruhe, Germany, 2020. [Google Scholar]
  33. Bürger, R. Phenomenological foundation and mathematical theory of sedimentation–Consolidation processes. Chem. Eng. J. 2000, 80, 177–188. [Google Scholar] [CrossRef]
  34. Landmann, K.A.; White, L.R.; Lee, R.; Eberl, M. Pressure filtration of flocculated suspensions. AIChE J. 1995, 41, 1687–1700. [Google Scholar] [CrossRef]
  35. Quemada, D. Rheology of concentrated disperse systems and minimum energy dissipation principle. Rheol. Acta 1977, 16, 82–94. [Google Scholar] [CrossRef]
  36. Erk, A. Rheologische Eigenschaften Feindisperser Suspensionen in Filtern und Zentrifugen. Ph.D. Thesis, University of Karlsruhe (TH), Karlsruhe, Germany, 2006. (In German). [Google Scholar]
  37. Mladenchev, T. Rheologische Eigenschaften Feindisperser Suspensionen in Filtern und Zentrifugen (German). Ph.D. Thesis, Otto von Guericke University Magdeburg, Magdeburg, Germany, 2007. [Google Scholar]
  38. Green, M.D.; Eberl, M.; Landman, K.A. Compressive yield stress of flocculated suspensions: Determination via experiment. Am. Inst. Chem. Eng. J. (AIChE) 1996, 42, 2308–2318. [Google Scholar] [CrossRef]
  39. Lerche, D. Dispersion stability and particle characterization by sedimentation kinetics in a centrifugal field. J. Dispers. Sci. Technol. 2002, 23, 699–709. [Google Scholar] [CrossRef]
  40. Reinach, H. Gleichgewicht und Kinetik der Pressentfeuchtung im Zentrifugalfeld einer Becherzentrifuge und in einer Stempelpresse, Dargestellt an eiNem Stark Kompressiblem Schlamm. Ph.D. Thesis, University of Karlsruhe (TH), Karlsruhe, Germany, 1992. (In German). [Google Scholar]
  41. Stickland, A.D. Solid-Liquid Separation in the Water and Wastewater Industries. Ph.D. Thesis, University of Melbourne, Melbourne, Australia, 2005. [Google Scholar]
Figure 1. Schematic representation of the transport equation of the dispersed phase and its influence on the flow conditions based on Hammerich [32]: The two-phase system consisting of particles and liquid has been described as an incompressible mixed phase. The solids volume fraction allows the division of the simulation geometry into two different regions, slurry and sediment. Both differ in terms of their rheological behavior, which is taken into account via the viscosity.
Separations 09 00248 g001
Figure 2. Comparison of simulation results of the developed simulation model for discontinuous centrifugation of a rectangular cuvette (exemplarily shown (left)) with data from Bürger and Concha [27] for an initial concentration of ϕ0 = 0.07 and two centrifugal accelerations Z = 1000 g (center) and Z = 10,000 g (right). The various shades of gray mark the sedimentation at different times: The darker the shade of gray, the more progressed the sedimentation. The y-axis shows the transitions between clear phase, slurry and sediment using the horizontal lines. Below the gel point the horizontal line corresponds to the transition between clear phase and slurry, above the gel point the horizontal line marks the transition to sediment.
Separations 09 00248 g002
Figure 3. Hindrance function of Kaolin: The experimental results and the fitting (model) used for the simulation to describe the hindrance settling function in dependence of the solids volume fraction.
Separations 09 00248 g003
Figure 4. Compression resistance function: The experimental results and the adjustment (model) used for the simulation to describe the compression resistance in the sediment for the equilibrium state as a function of the solids volume fraction.
Separations 09 00248 g004
Figure 5. Start-up process of the centrifugation.
Separations 09 00248 g005
Figure 6. Comparison between experiment and simulation of the centrifugation process in a cuvette. The sedimentation of a slurry (ϕ0 = 0.051 < ϕgel) is shown on the left. The compression of a sediment (ϕ0 = 0.145 > ϕgel) is shown on the right.
Separations 09 00248 g006
Figure 7. Simplified geometry of a decanter centrifuge and the used mesh. The geometry is a segment of the cylindrical part of the apparatus. The mesh is structured. The area highlighted in blue marks the position of the evaluation.
Separations 09 00248 g007
Figure 8. Characterization of a sediment with (1) and without (2) yield point in the screw channel: sediment distribution (a), kinematic viscosity (b). The evaluation was performed on the cut surface marked in blue in Figure 7. The screw flights are located on the right and left. The arrow indicates the direction of push due to the relative speed of the screw.
Separations 09 00248 g008
Figure 9. Velocity distribution without sliding feed of the screw: sediment with yield point (1a), sediment without yield point (1b), theoretical consideration of the disc stirrer effect within the screw channel (1c) according to Stahl [11]. The evaluation was performed on the cut surface marked in blue in Figure 7.
Separations 09 00248 g009
Table 1. Material characteristics and process conditions concerning the investigation of Bürger and Concha [27].
Material Properties
Density difference Δ ρ 1700 kg m−3
Gel point ϕ gel 0.07
Material Functions
Stokes settling velocity u p , St 1 × 10⁻⁴ m s−1
Settling exponent n RZ 5
Consolidation parameter p 1 900 Pa
Consolidation parameter p 2 7
Table 2. Material characteristics and process conditions of the simulation.
Material Properties
Density of the liquid ρ l 1000 kg m−3
Dynamic viscosity of the liquid η l 1 mPa s
Density of the solids ρ s 2700 kg m −3
Mean particle size x 50 , 3 4 × 10⁻⁵ m
Material Functions
Gel point ϕ gel 0.22
Settling exponent n RZ 4.65
Consolidation parameter p 1 700 Pa
Consolidation parameter p 2 7
Process Conditions
Initial solids volume fraction ϕ 0 0.07
Rotational speed n2000 rpm
Differential speed Δ n 10 rpm
Publisher’s Note: MDPI stays neutral with regard to jurisdictional claims in published maps and institutional affiliations.

