Article

Quality Evaluation of Crude and Salt-Processed Cuscutae Semen through Qualitative and Quantitative Analysis of Multiple Components Using HPLC Combined with Chemometrics

1
Key Laboratory of State Administration of Traditional Chinese Medicine for Standardization of Chinese Medicine Processing, Nanjing University of Chinese Medicine, Nanjing 210046, China
2
Pharmacy School, Jiangsu Ocean University, Lianyungang 222005, China
3
Qinghai Xinda Biological Technology Co., Ltd., Xining 810100, China
*
Authors to whom correspondence should be addressed.
These authors contributed equally to this work.
Separations 2022, 9(9), 231; https://doi.org/10.3390/separations9090231
Submission received: 4 July 2022 / Revised: 18 August 2022 / Accepted: 22 August 2022 / Published: 30 August 2022

Abstract

:
Cuscutae Semen (CS; Chinese common name “Tusizi”) is one of the most common traditional herbal medicines used to treat liver and kidney diseases in China. Although it is most commonly used as a processed product, little progress has been made on the quality control of CS and salt-processed Cuscutae Semen (PCS). The purpose of this study was to establish a comprehensive strategy integrating chromatographic analysis and chemometric methods for quality evaluation and discrimination of CS and PCS. An accurate and reliable HPLC method was established for the simultaneous quantification of 12 analyte compounds in CS and PCS. The results showed that this method exhibited desirable sensitivity, precision, stability, and repeatability. Multivariate chemometric methods were applied to analyze the obtained HPLC fingerprints, including hierarchical cluster analysis (HCA), principle component analysis (PCA), and partial least squares discriminant analysis (PLS-DA). The results indicated that CS and PCS samples showed a clear classification of the two groups, and three chemical markers with great contributions to the differentiation were screened out. Collectively, the chemometrics combined with the quantitative analysis based on HPLC fingerprint results indicated that salt processing may change the contents and types of components in Cuscutae Semen.

1. Introduction

The processing procedures of traditional Chinese medicines (TCMs) play an important role in their clinical applications. However, little progress has been made on the quality control of crude and processed products. Traditional processing methods include steaming with water, wine, or vinegar; cooking with black bean juice or herbal liquids; and stir-frying with oil, salt water, or sand. For many herbs used as TCMs, it is necessary to reduce their toxicities and side effects, but retain their pharmacological effects, before clinical application. Hence, in order to guarantee the safety and effectiveness of these medicines, it is essential to control and regulate the quality of crude and processed products.
Cuscutae Semen (CS; “Tusizi” in Chinese), the dried seed of Cuscuta australis R.Br. or Cuscuta chinensis Lam., is a well-known traditional Chinese medicinal herb used for regulating the body’s endocrine system, nourishing the liver and kidney, improving eyesight, and preventing miscarriage [1,2]. It has also been reported to have antioxidative, osteoblastogenic, and immunomodulatory activities, as well as playing an active role in alleviating chronic prostatitis [3,4,5]. The processing of CS has a long history and a variety of excipients such as rice wine and salt solutions may be used in the processes. Among these, salt-processing is the most widely used processing method, whereby CS is stir-fried in a salt solution, as documented in the 2020 edition of the Chinese pharmacopoeia [6]. In recent pharmacological studies, salt-processed CS showed significant improvement in enhancing levels of testosterone and antioxidant effects [7]. Thus, in clinical practice, it is necessary to discriminate crude Cuscutae Semen from salt-processed Cuscutae Semen (PCS).
There are many kinds of active components in CS, including flavonoids, chlorogenic acids, polysaccharides, alkaloids, and other components [8,9], with flavonoids and phenolic compounds being the predominant bioactive constituents [10]. The main flavonoids, including kaempferol, quercetin, hyperoside, and astragalin, play an important role in the medicine’s pharmacological processes. It has been reported that hyperoside and kaempferol are the active components in CS responsible for its osteogenic effect [11]. Other research has indicated that chlorogenic acids are the main active components in CS responsible for anti-inflammatory and antioxidant effects [12]. In the context of traditional Chinese medicines, qualitative and quantitative analysis of components holds a certain significance in relation to quality control. In recent years, chemical studies on CS have mainly focused on qualitative analysis of its major components through the adoption of different analytical methods, such as HPLC, UPLC-Q-TOF/MS, and so on [13,14], but discrimination studies between CS and PCS have been rarely reported.
Currently, the chromatographic fingerprint technique is regarded as a useful method to control the quality of TCMs, because this technique emphasizes the systemic characterization and evaluation of the stability of the components [15]. Due to the complex multivariate datasets associated with the complicated compositions of TCMs, minor differences between very similar chromatograms might be missed. Moreover, chemometric approaches are increasingly being viewed as valuable complements to HPLC practices, because a large number of variables can be simultaneously controlled to achieve the expected separations. Accordingly, the combination of chromatographic analysis and chemometrics may be an effective approach for differentiating crude and processed TCMs [16,17].
In the present study, HPLC fingerprints of the CS and PCS were compared, and the fingerprint datasets were submitted for classification using several chemometric methods, such as similarity analysis (SA), principle component analysis (PCA), hierarchical cluster analysis (HCA), and partial least squares discriminant analysis (PLS-DA). Furthermore, the contents of the 12 markers were simultaneously determined to maintain the quality control of CS and PCS. The present study can provide a scientific foundation to deeply elucidate the mechanism of salt-processing of CS, thus providing new directions for future research on its pharmacological activities. In addition, the proposed method could be a helpful tool for revealing the differences between raw and processed TCMs.

2. Materials and Methods

2.1. Chemicals and Reagents

Methanol and acetonitrile of HPLC grade were sourced from Tedia Company Inc. (Fairfield, OH, USA), while formic acid of HPLC grade was sourced from Merck (Darmstadt, Germany). Ultrapure water was obtained through filtration using a Milli-Q water purification system (Bedford, MA, USA). Neochlorogenic acid (5-CQA), chlorogenic acid (3-CQA), cryptochlorogenic acid (4-CQA), caffeic acid, hyperoside, isoquercitrin, isochlorogenic acid B (3,4-DiCQA), astragalin, isochlorogenic acid C (4,5-DiCQA), quercetin, kaempferol, and isorhamnetin were provided by the Chengdu Pusi Biologic Technology Co., Ltd. (Chengdu, China). Their purity was greater than 98%. The structures of the twelve bioactive components are shown in Figure 1.

2.2. Preparation of Salt-Processed Cuscutae Semen

Twenty-one batches of Cuscutae Semen samples (No. S1–S21, Table 1) were collected from pharmaceutical corporations in China and botanically identified by Professor Chen Jianwei at Nanjing University of Chinese Medicine, Nanjing, China. The samples were immediately dried at 60 °C for 24 h and then ground into powders at 60 mesh and stored in a desiccator. To obtain PCS, the CS was thoroughly mixed with salt water (20%, w/w), fried over a gentle heat until it became totally dry, and allowed to cool. Salt was added at a ratio of 2 kg for each 100 kg of the crude drug [18].

2.3. Sample Preparation and Standard Solutions

Each batch of CS and PCS samples (0.5 g) was accurately weighed and extracted with 20 mL 80% methanol (v/v) under ultrasonication over a duration of 60 min. The extracted solutions were transferred into 25 mL volumetric flasks, which were filled up to the mark with the same solvent. The mixtures were centrifuged at 13,000 rpm for 5 min and further filtered through a 0.45 μm filter membrane for qualitative and quantitative analysis. The mixed standard solution was prepared by mixing the individual stock solutions and diluted using methanol to a final concentration of 86.0 μg/mL 5-CQA, 223.0 μg/mL 3-CQA, 81.6 μg/mL 4-CQA, 90.3 μg/mL caffeic acid, 244.0 μg/mL hyperoside, 86.5 μg/mL isoquercitrin, 86.5 μg/mL 3,4-DiCQA, 607.0 μg/mL astragalin, 81.5 μg/mL 4,5-DiCQA, 81.2 μg/mL quercetin, 244.0 μg/mL kaempferol, and 104.0 μg/mL isorhamnetin. All the solutions were then stored at 4 °C for further HPLC analysis.

2.4. Chromatographic Fingerprinting Conditions and Quantitative Analysis

HPLC separation was performed using a Shimadzu HPLC system (Shimadzu, Kyoto, Japan) equipped with a PDA detector. The separation was carried out on a YMC-Pack ODS-C18 column (250 mm × 4.6 mm, 5 µm). The mobile phase consisted of solvent A (0.1% formic acid in water, v/v) and solvent B (ACN). The optimized HPLC elution procedure was conducted as follows: 0–2 min, 5% B; 2–10 min, 5–15% B; 10–30 min, 15–18% B; 30–32 min, 18% B; 32–52 min, 18–45% B; 52–60 min, 45–5% B. The column temperature, flow rate, injection volume, and detection wavelength were set to 30 °C, 1.0 mL/min, 10 µL, and 328 nm, respectively. The external standard method was adopted for the quantitative analysis of potential active components. The mixed standard stock solution was diluted using methanol to obtain a series of working solutions of appropriate concentrations. By taking the peak area (Y) as the ordinate and the concentrations of the reference standards (X, μg/mL) as the abscissa, standard curves were drawn and used to calculate the contents of the active components.

2.5. Method Validation

The HPLC chromatography fingerprint methodology was validated by evaluating its precision, reproducibility, and stability. S1 was randomly selected as the test object. The established HPLC quantitative method was verified by evaluating its linearity, precision, accuracy, stability, repeatability, LOD, and LOQ. Mixed standard solutions were diluted to obtain three different concentration levels to establish calibration curves. The precision of the method was tested by injecting a mixed standard solution six times a day. The reproducibility of the method was evaluated by repeated injections of six independent samples. These samples were injected three times at 0, 3, 6, 12, and 24 h to verify the stability of the quantitative method. LOQ and LOD were determined and evaluated while S/N was found to be greater than or equal to 10 and 3, respectively. The accuracy of the method was evaluated based on the recovery rate of the three solutions with different concentration levels.

2.6. Data Analysis

Multivariate statistical analysis was performed to establish the variability of crude and salt-processed Cuscutae Semen samples. All peaks in the chromatograms were integrated and analyzed for SA using the Similarity Evaluation System for Chromatographic Fingerprint of Traditional Chinese Medicine software (Version 2012A, Chinese Pharmacopoeia Commission, Beijing, China). The generated dataset was standardized based on the Z-score and then exported to SIMCA 14.1 (Umetrics AB, Umea, Sweden) for multivariate analysis, including HCA, PCA, and orthogonal partial least squares discriminate analysis (OPLS-DA).

3. Results and Discussion

3.1. Optimization of Chromatographic Conditions

Mobile phases, namely methanol–water, acetonitrile–water, methanol–acid aqueous solution, and acetonitrile–acid aqueous solution, were examined and compared to determine the one with optimal chromatographic behavior. It was found that the acetonitrile–acid aqueous solution had better performance than the others. Moreover, different kinds of acid aqueous solutions (formic acid, acetic acid, and phosphoric acid) were also compared, and it was ascertained that formic acid produced the best performance in improving the shape and resolution of peaks. Lastly, different concentrations of formic acid (0.05%, 0.1%, and 0.5%) were compared, and the data indicated that the optimal condition was acetonitrile–0.1% formic acid aqueous solution (Figure 2).

3.2. Method Validation

The HPLC fingerprint methodology was validated by evaluating its precision, reproducibility, and stability in the form of the relative standard deviation (RSD) of the relative peak area (RPA) of 14 common peaks. The results showed that the precision of the RSDs of the RPA was less than 3.66%, indicating that the instrument had good precision. The reproducibility of the RSDs of the RPA was in the range of 0–3.00%, suggesting that the chromatographic fingerprint method had good repeatability. The stability of the RSDs of the RPA was less than 2.90%, demonstrating that the sample solution was stable within a time frame of 24 h.
The linearity, LODs, and LOQs of the HPLC assays for quantitative determination of 12 analytes are summarized in Table 2. The data indicate a good relationship between concentrations and peak areas of the analytes within the test ranges (r ≥ 0.9990). The LODs and LOQs of all analytes were 0.41 μg/mL and 3.04 μg/mL, respectively. The overall RSDs of precision and repeatability for the analytes were less than 3.66% and 4.40%, respectively. The established methods also showed acceptable accuracy, with a spike recovery of 91.70–105.20% for all analytes. In terms of stability, the RSDs of the peak areas for all analytes detected within 24 h were lower than 4.00%. Overall, the results indicated that the established methods were linear, sensitive, precise, accurate, and stable enough for quantification of the 12 bioactive components in the CS and PCS samples.

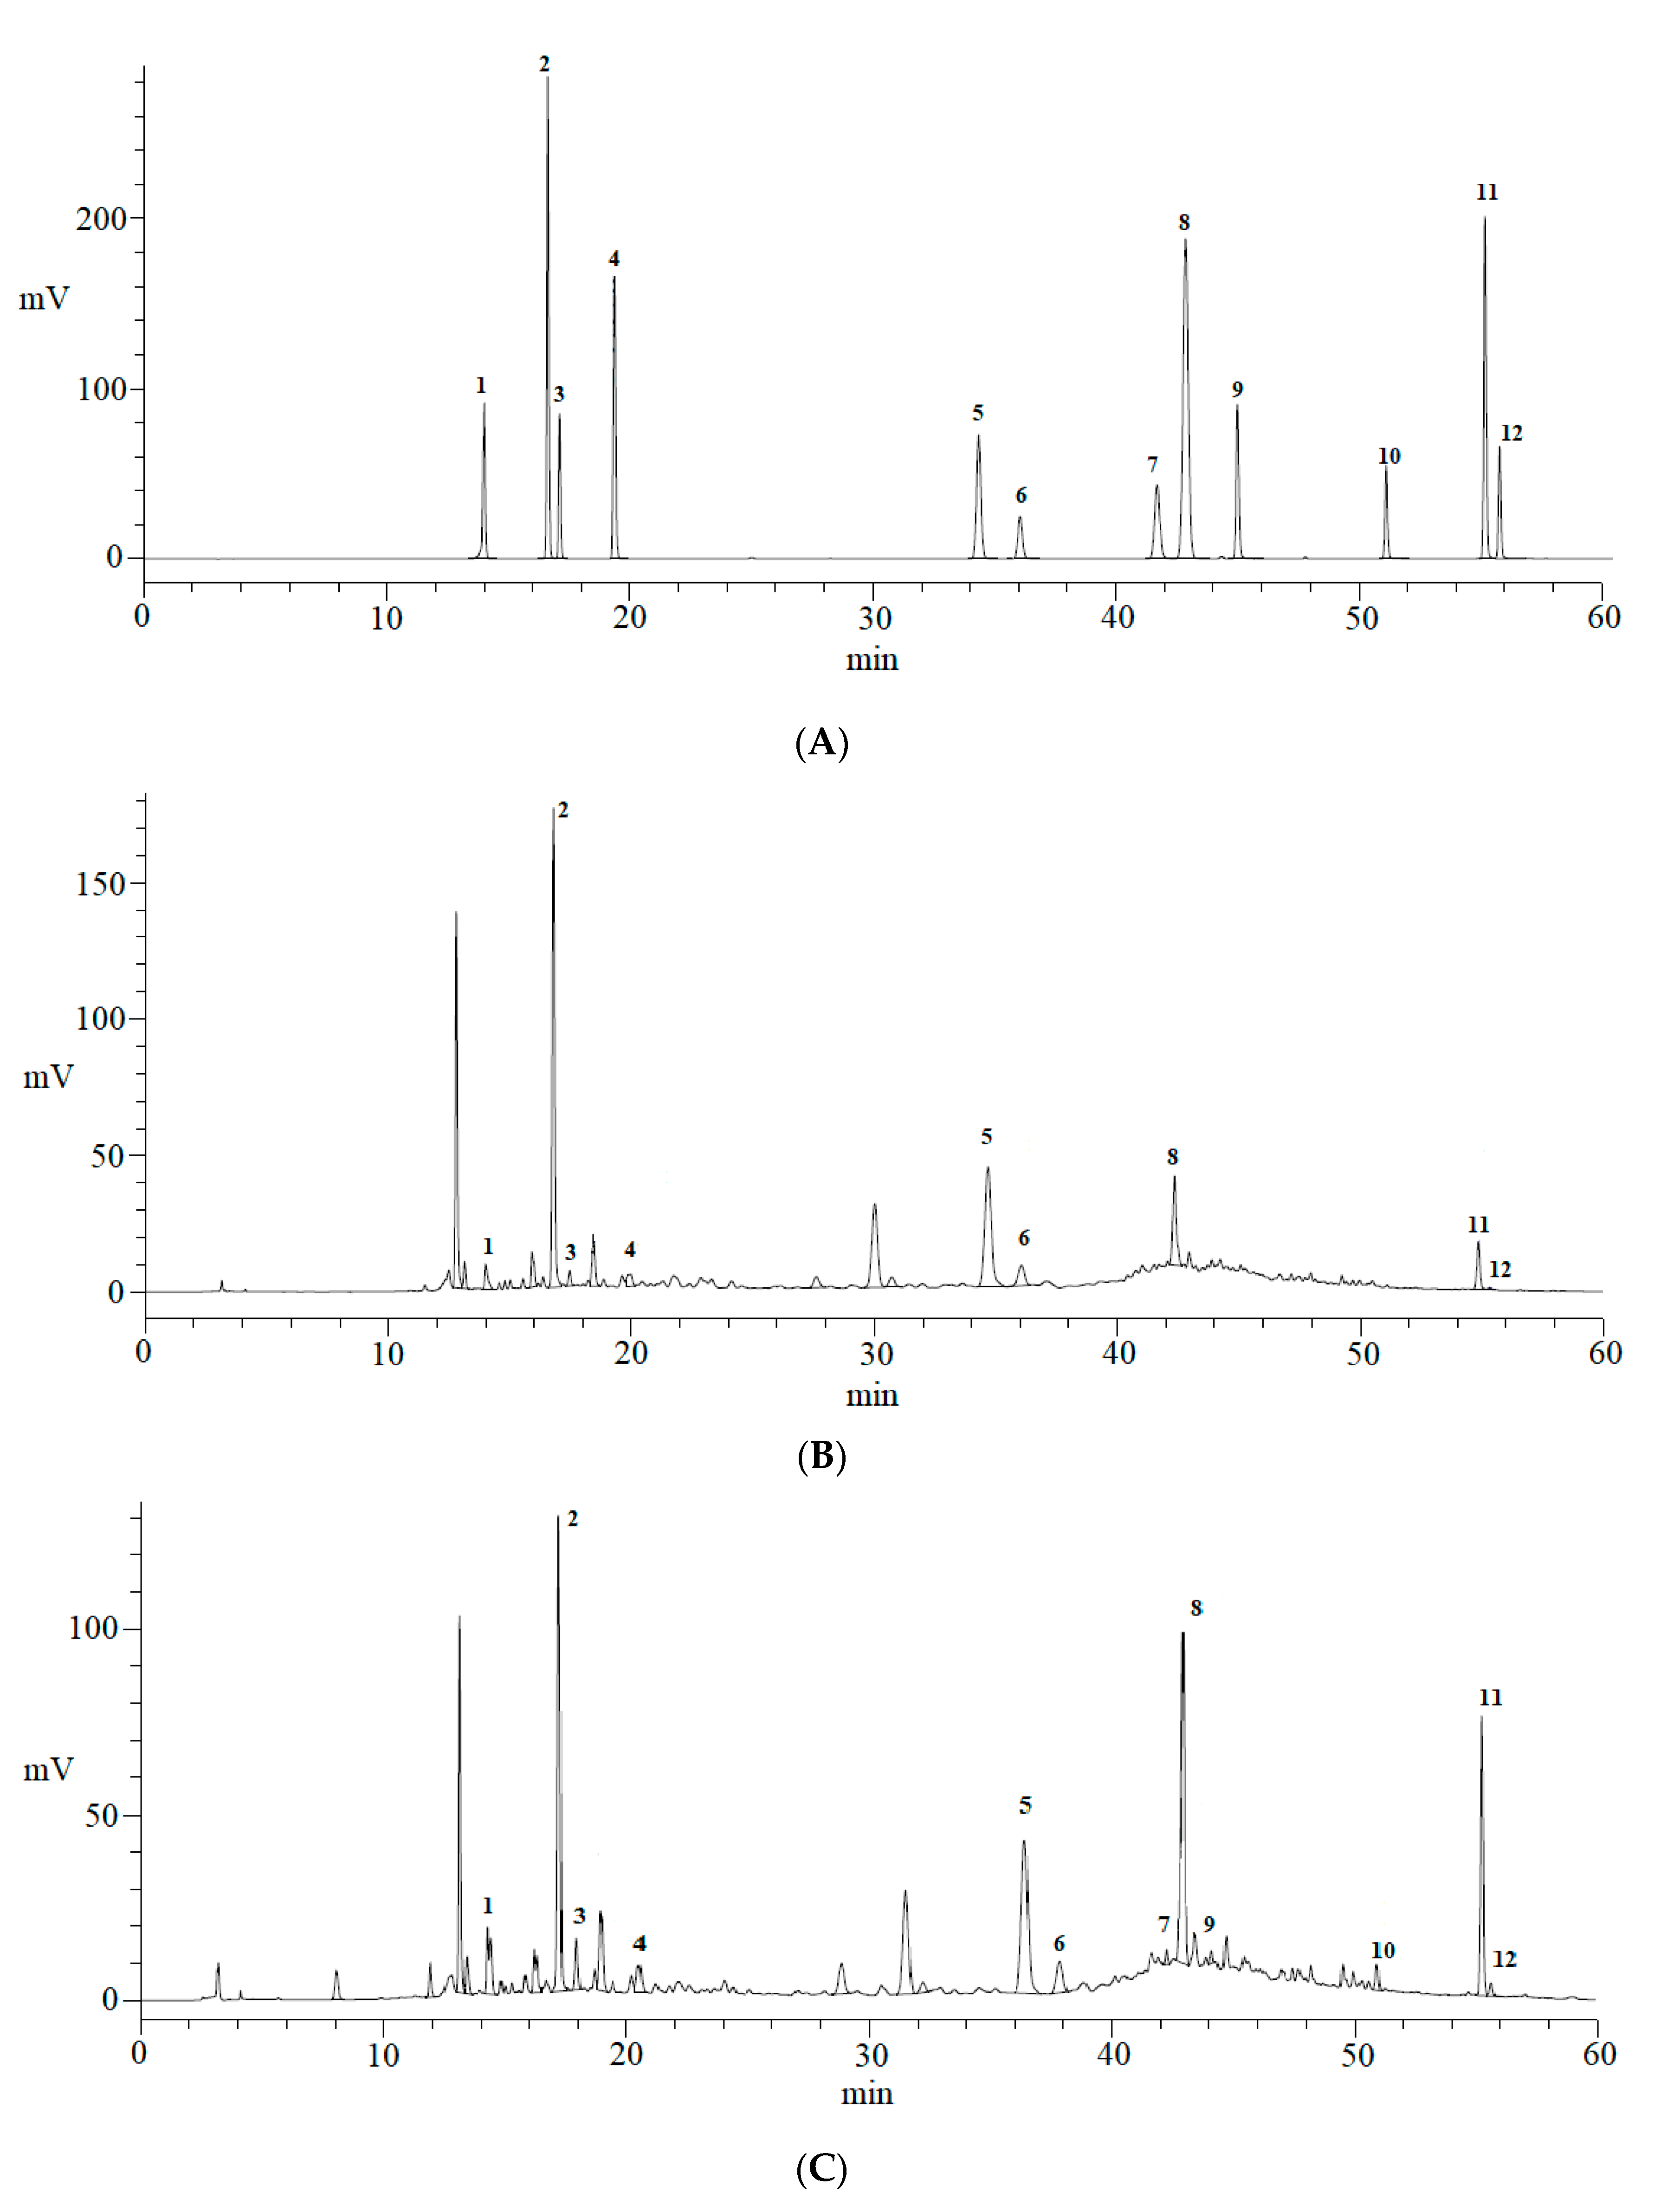
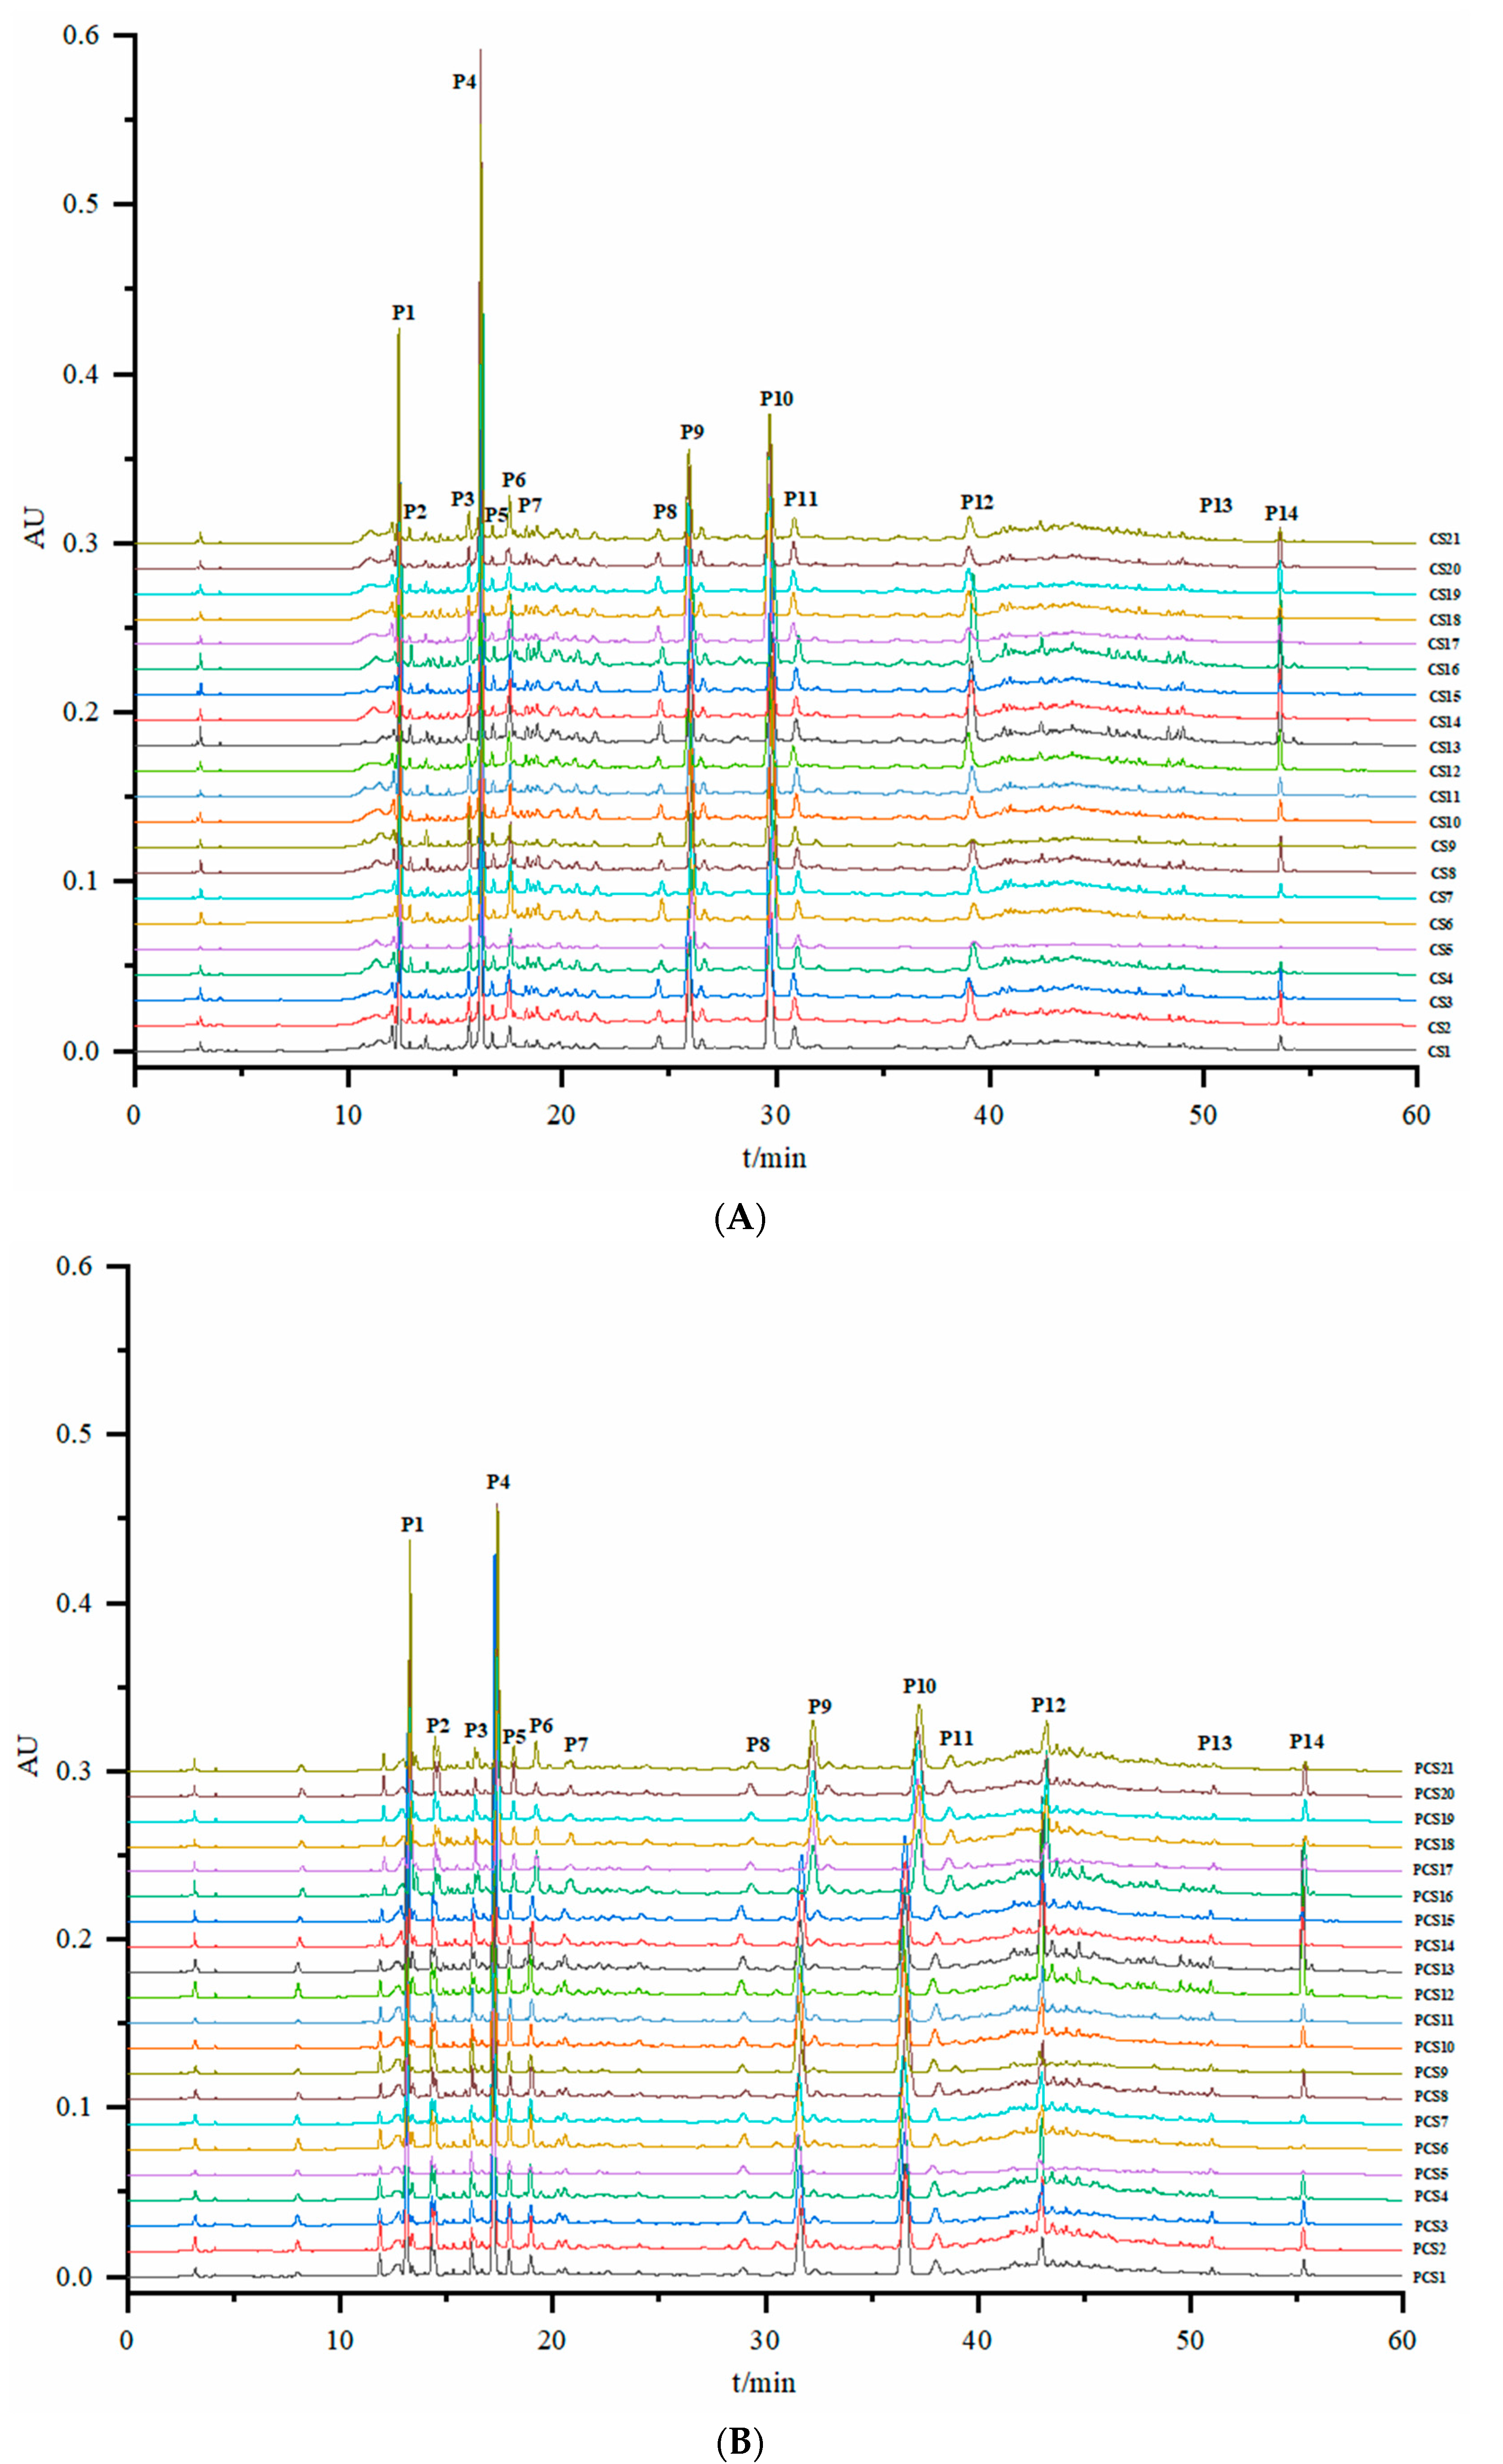
3.3. Establishment and Similarity Evaluation of the HPLC Fingerprints of CS and PCS

By taking S1 as the reference, 14 common peaks (P1–P14) were detected in the 21 batches of CS and PCS samples, which indicated that the main active components in the CS and PCS samples were the same. The chromatographic fingerprints of CS and PCS samples are shown in Figure 3. As can be seen in the figure, the areas of the peaks P1, P4, P9, and P10 in the samples were relatively large, demonstrating that the components corresponding to these four peaks accounted for a large proportion of the main active components in the CS and PCS samples. Nevertheless, there were significant differences in the contents of similar components in different batches. The chromatographic fingerprint data of the 21 batches of the CS and PCS samples were exported to the Similarity Evaluation System for Chromatographic Fingerprint of Traditional Chinese Medicine (Version, 2012A, Chinese Pharmacopoeia Commission, Beijing, China), with the areas of the 14 common peaks as the basic parameters, to evaluate the similarity of CS and PCS samples. By taking S1 as a reference, the similarity of samples in different batches was found to be mostly above 0.9, which is relatively high, indicating that it was impossible to distinguish samples in different batches based on only their fingerprints.

3.4. Quantitative Analysis of the 12 Components in CS and PCS Samples

The newly developed and validated HPLC method was adopted to quantify the 12 analytes in the 21 batches of CS and PCS samples, and the quantification results are summarized in Table 3. It was found that the total contents of the detected analytes in the CS samples were significantly different. The lowest content of the detected analytes was 6.09 ± 0.01 mg/g (S5), and the highest content was 12.91 ± 0.01 mg/g (S11), which is 2.12 times higher. In order to extensively compare the differences between the CS and PCS samples, the average contents of the 12 analytes were calculated. The results showed that chlorogenic acid, hyperoside, and isoquercitrin components decreased significantly upon processing, whereas neochlorogenic acid, cryptochlorogenic acid, and quercetin components increased markedly. Isochlorogenic acid B was not detected in the CS samples but it was significantly increased in the PCS samples. The other components showed no obvious change. These findings could be explained by the fact that flavonol glucosides suffered from cleavage of the glycosidic bond during the thermal process. For chlorogenic acids, the heating process may lead to the conversion of these compounds. By comparing various literary sources, this study represents an initial efforts regarding the content comparison of 12 Cuscutae Semen components before and after salt processing, which is helpful to better understand the mechanism of salt processing [9,13].

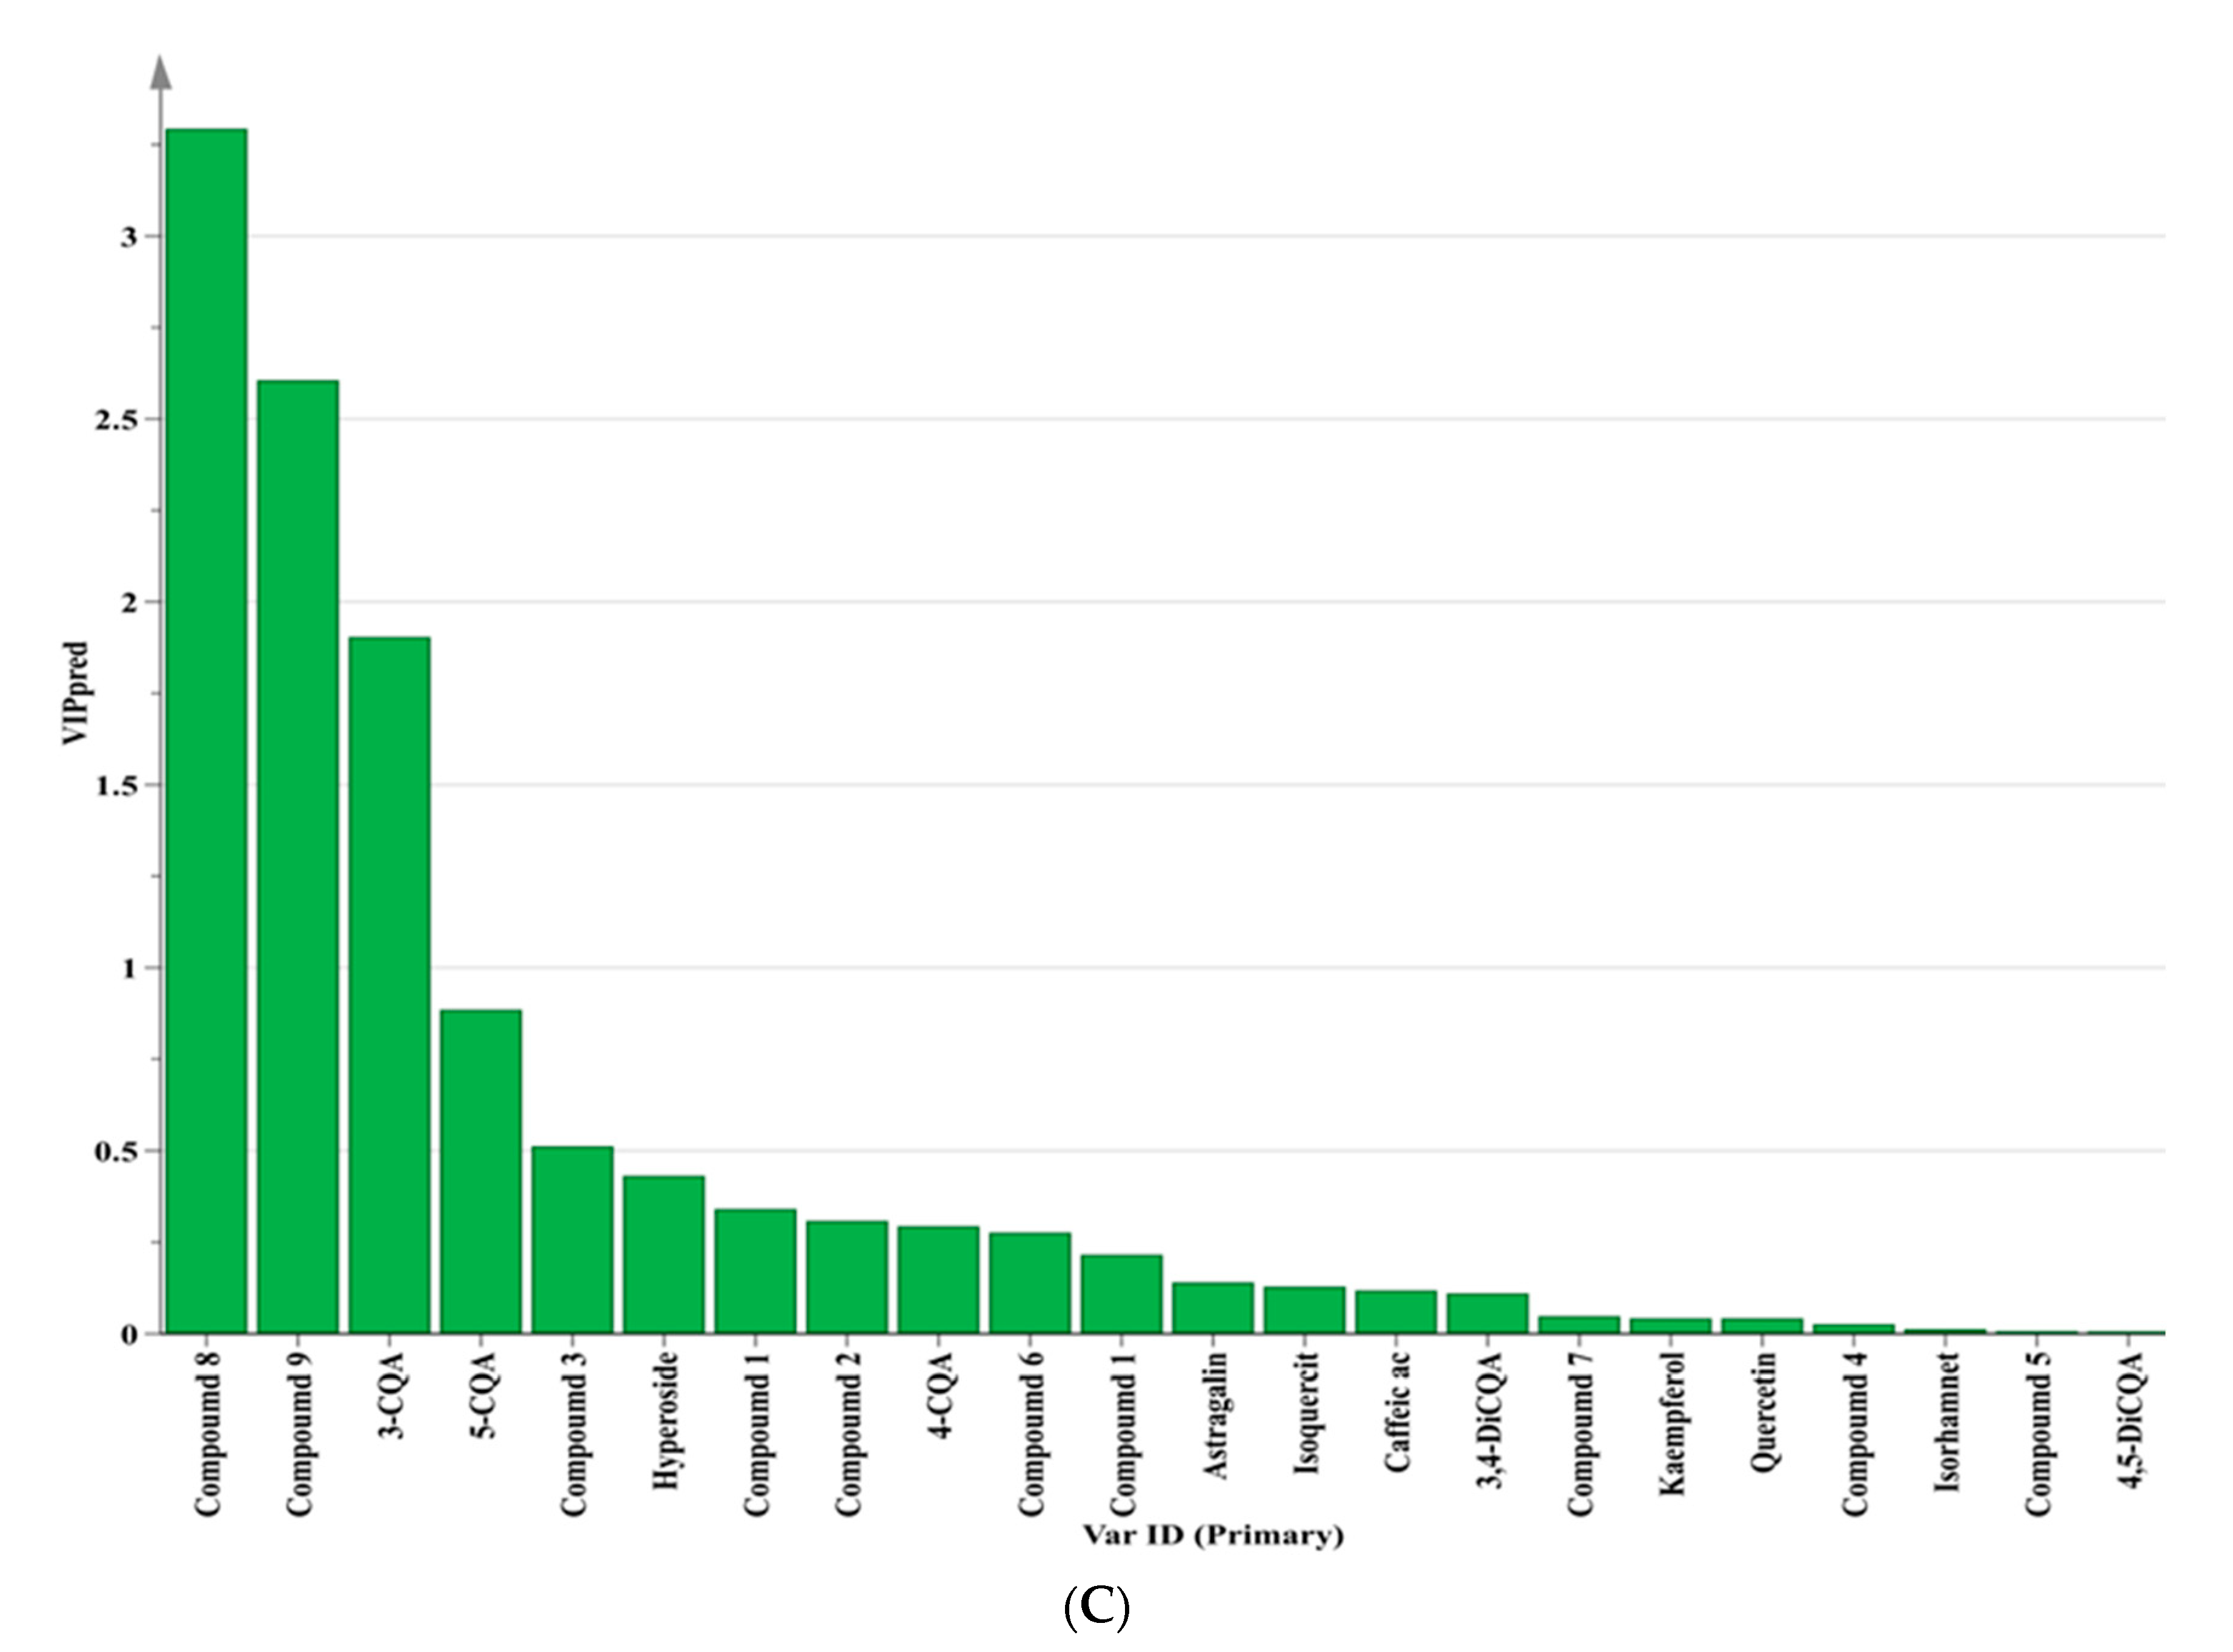
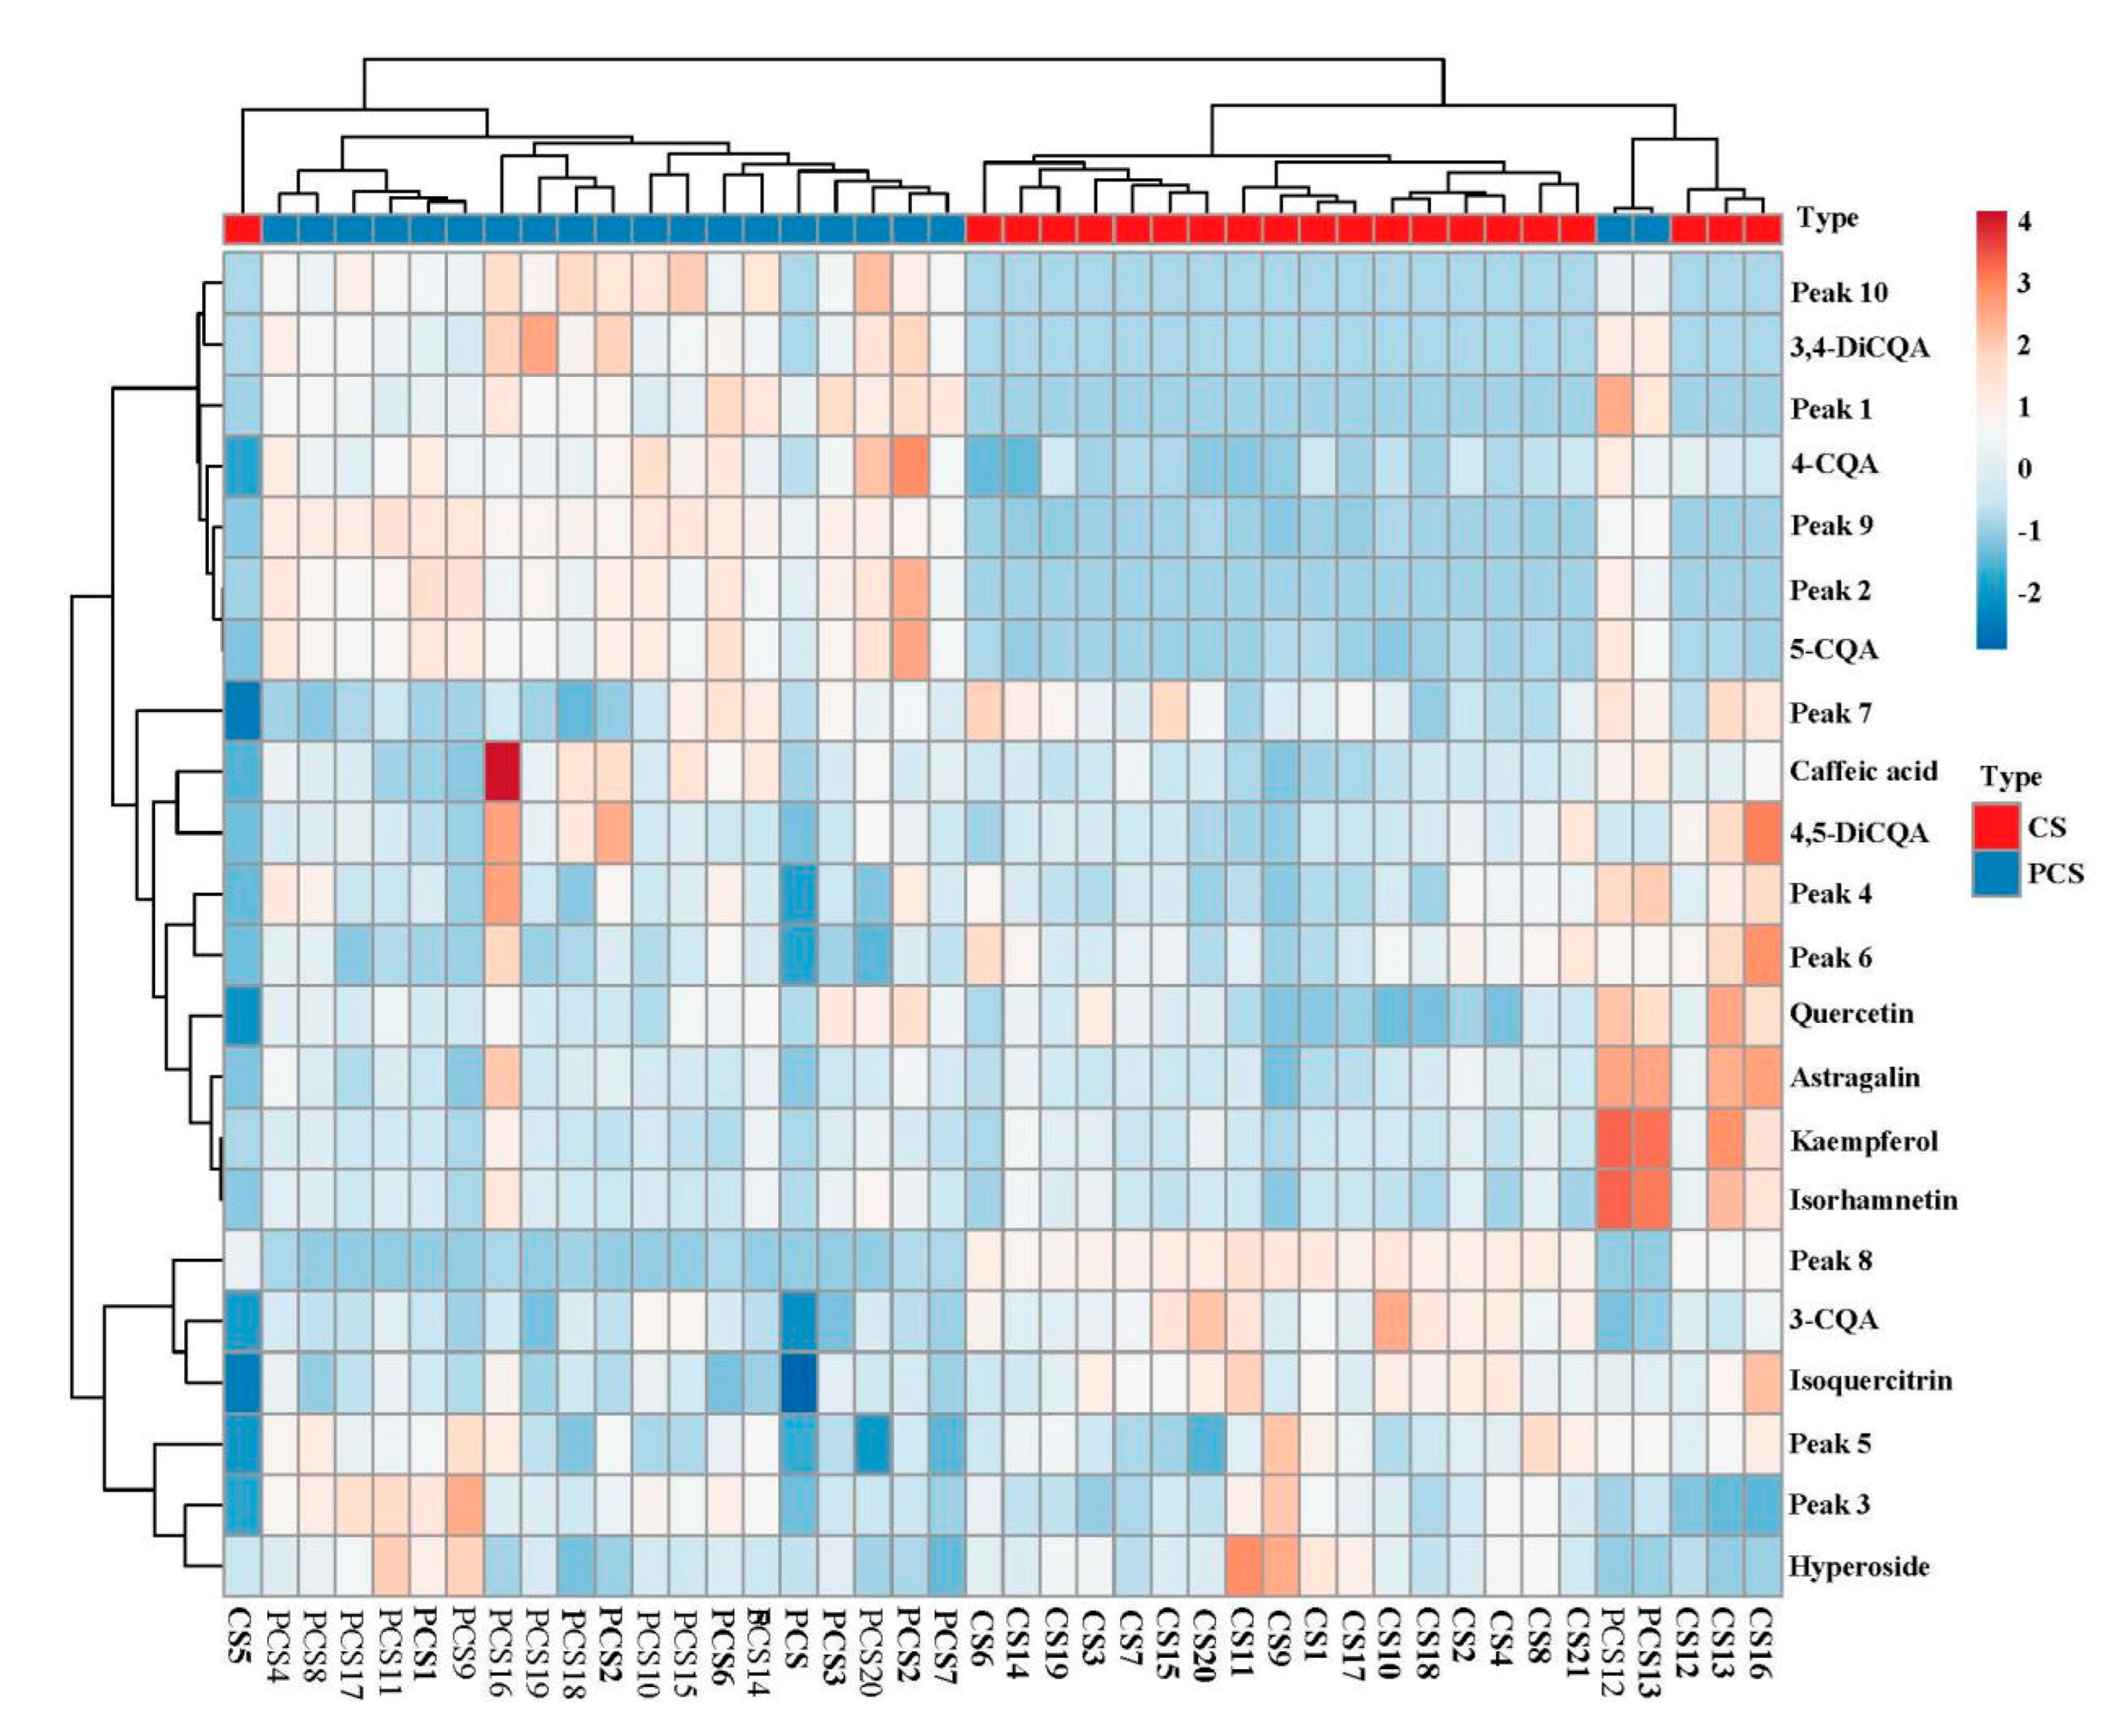
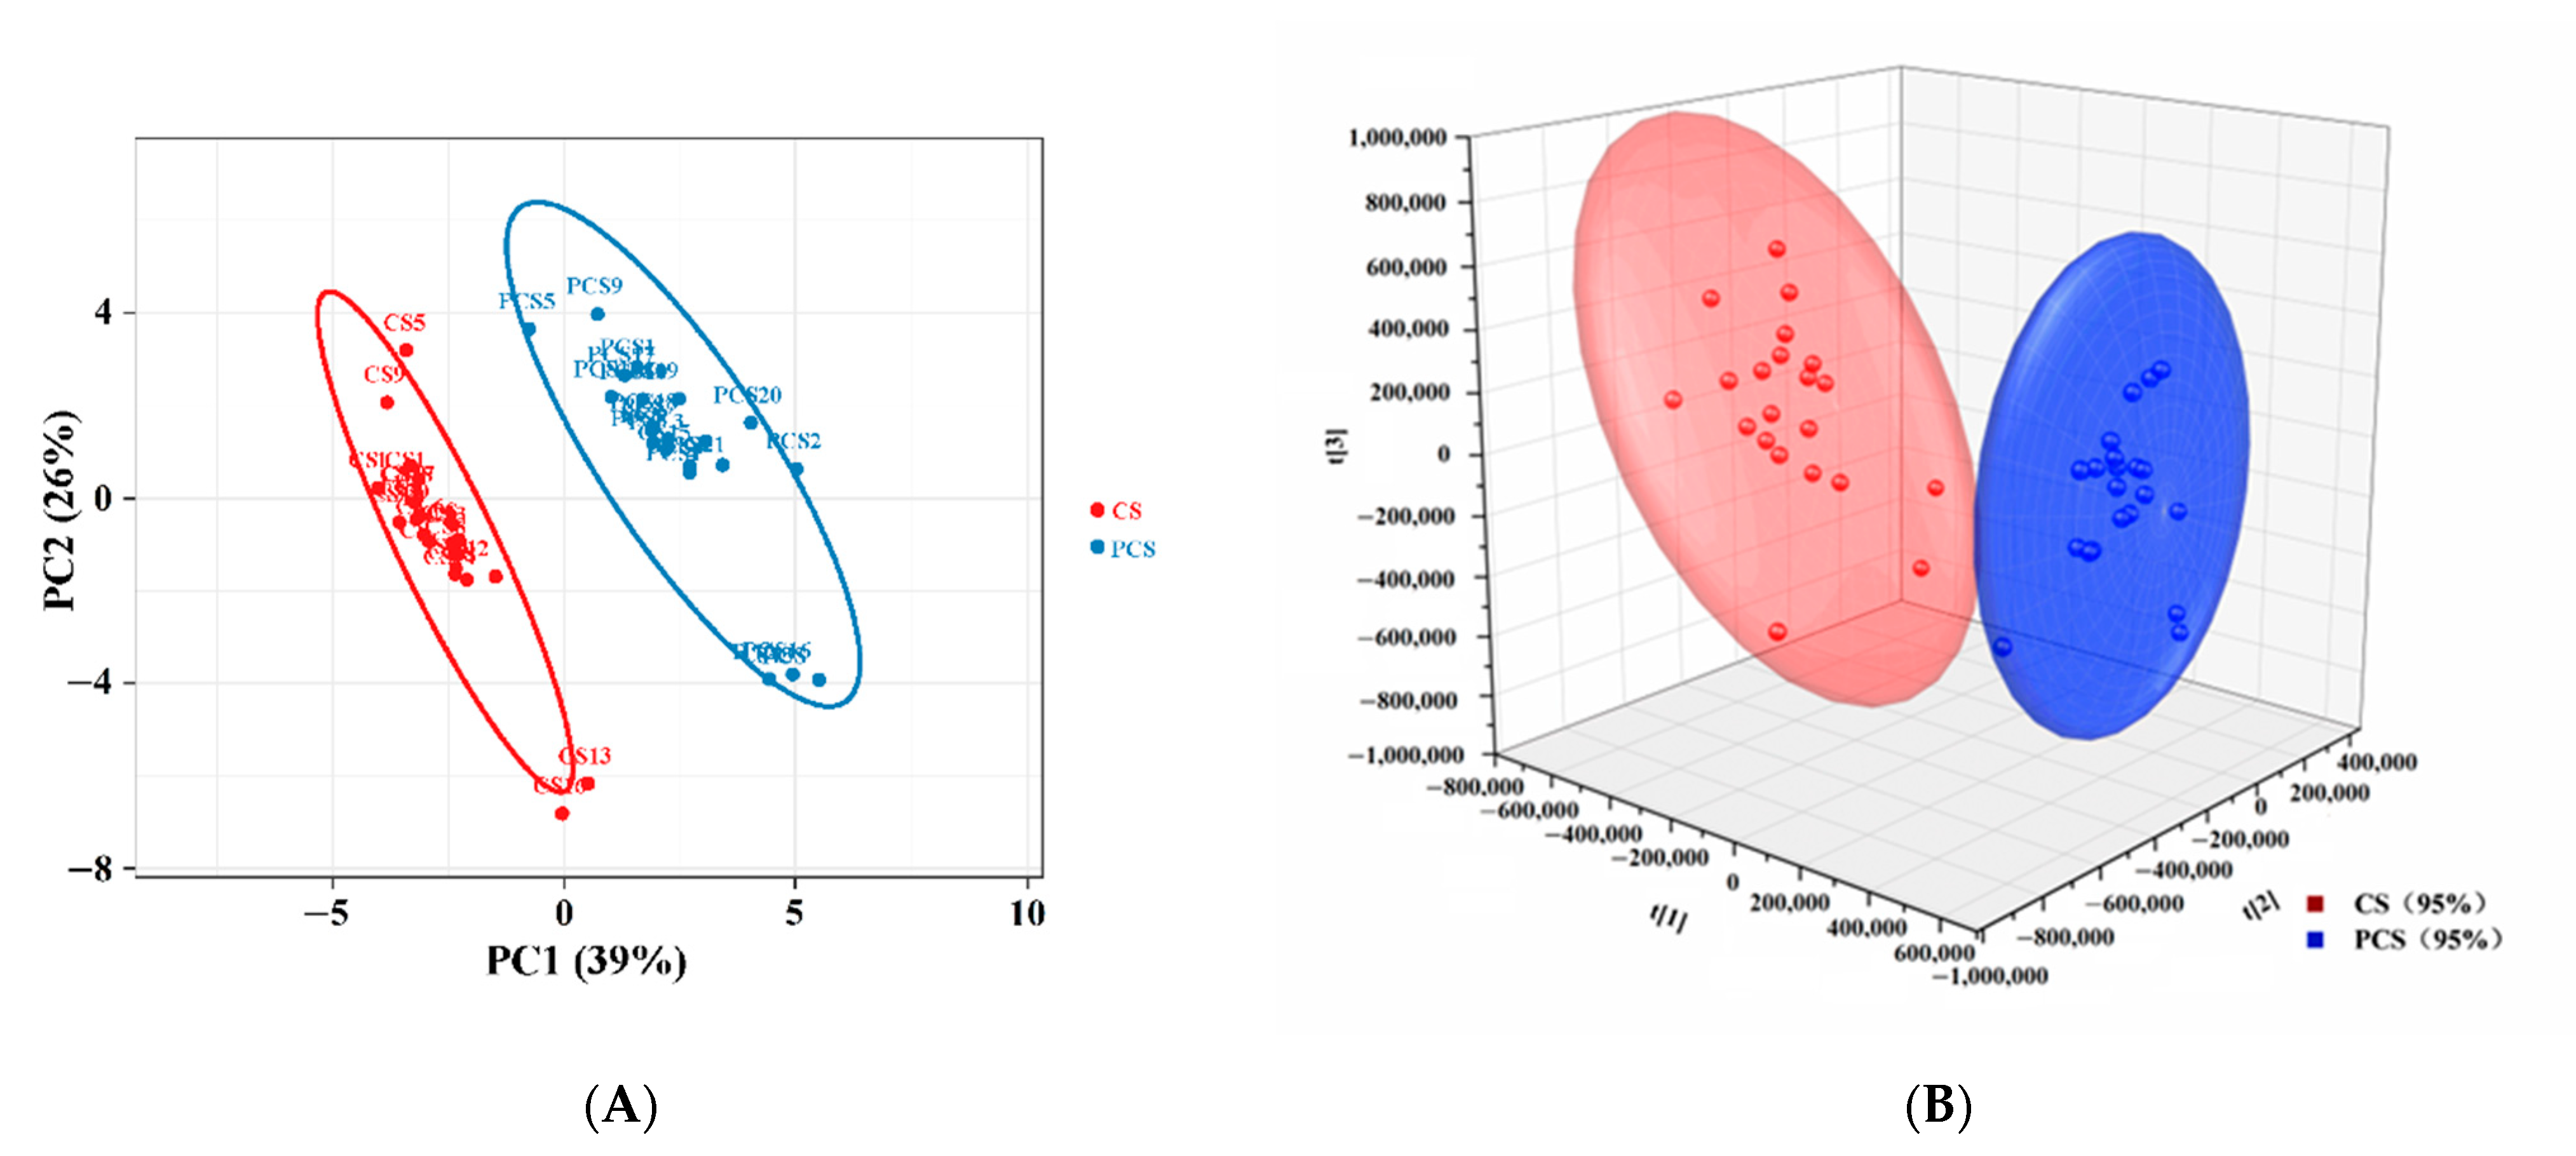
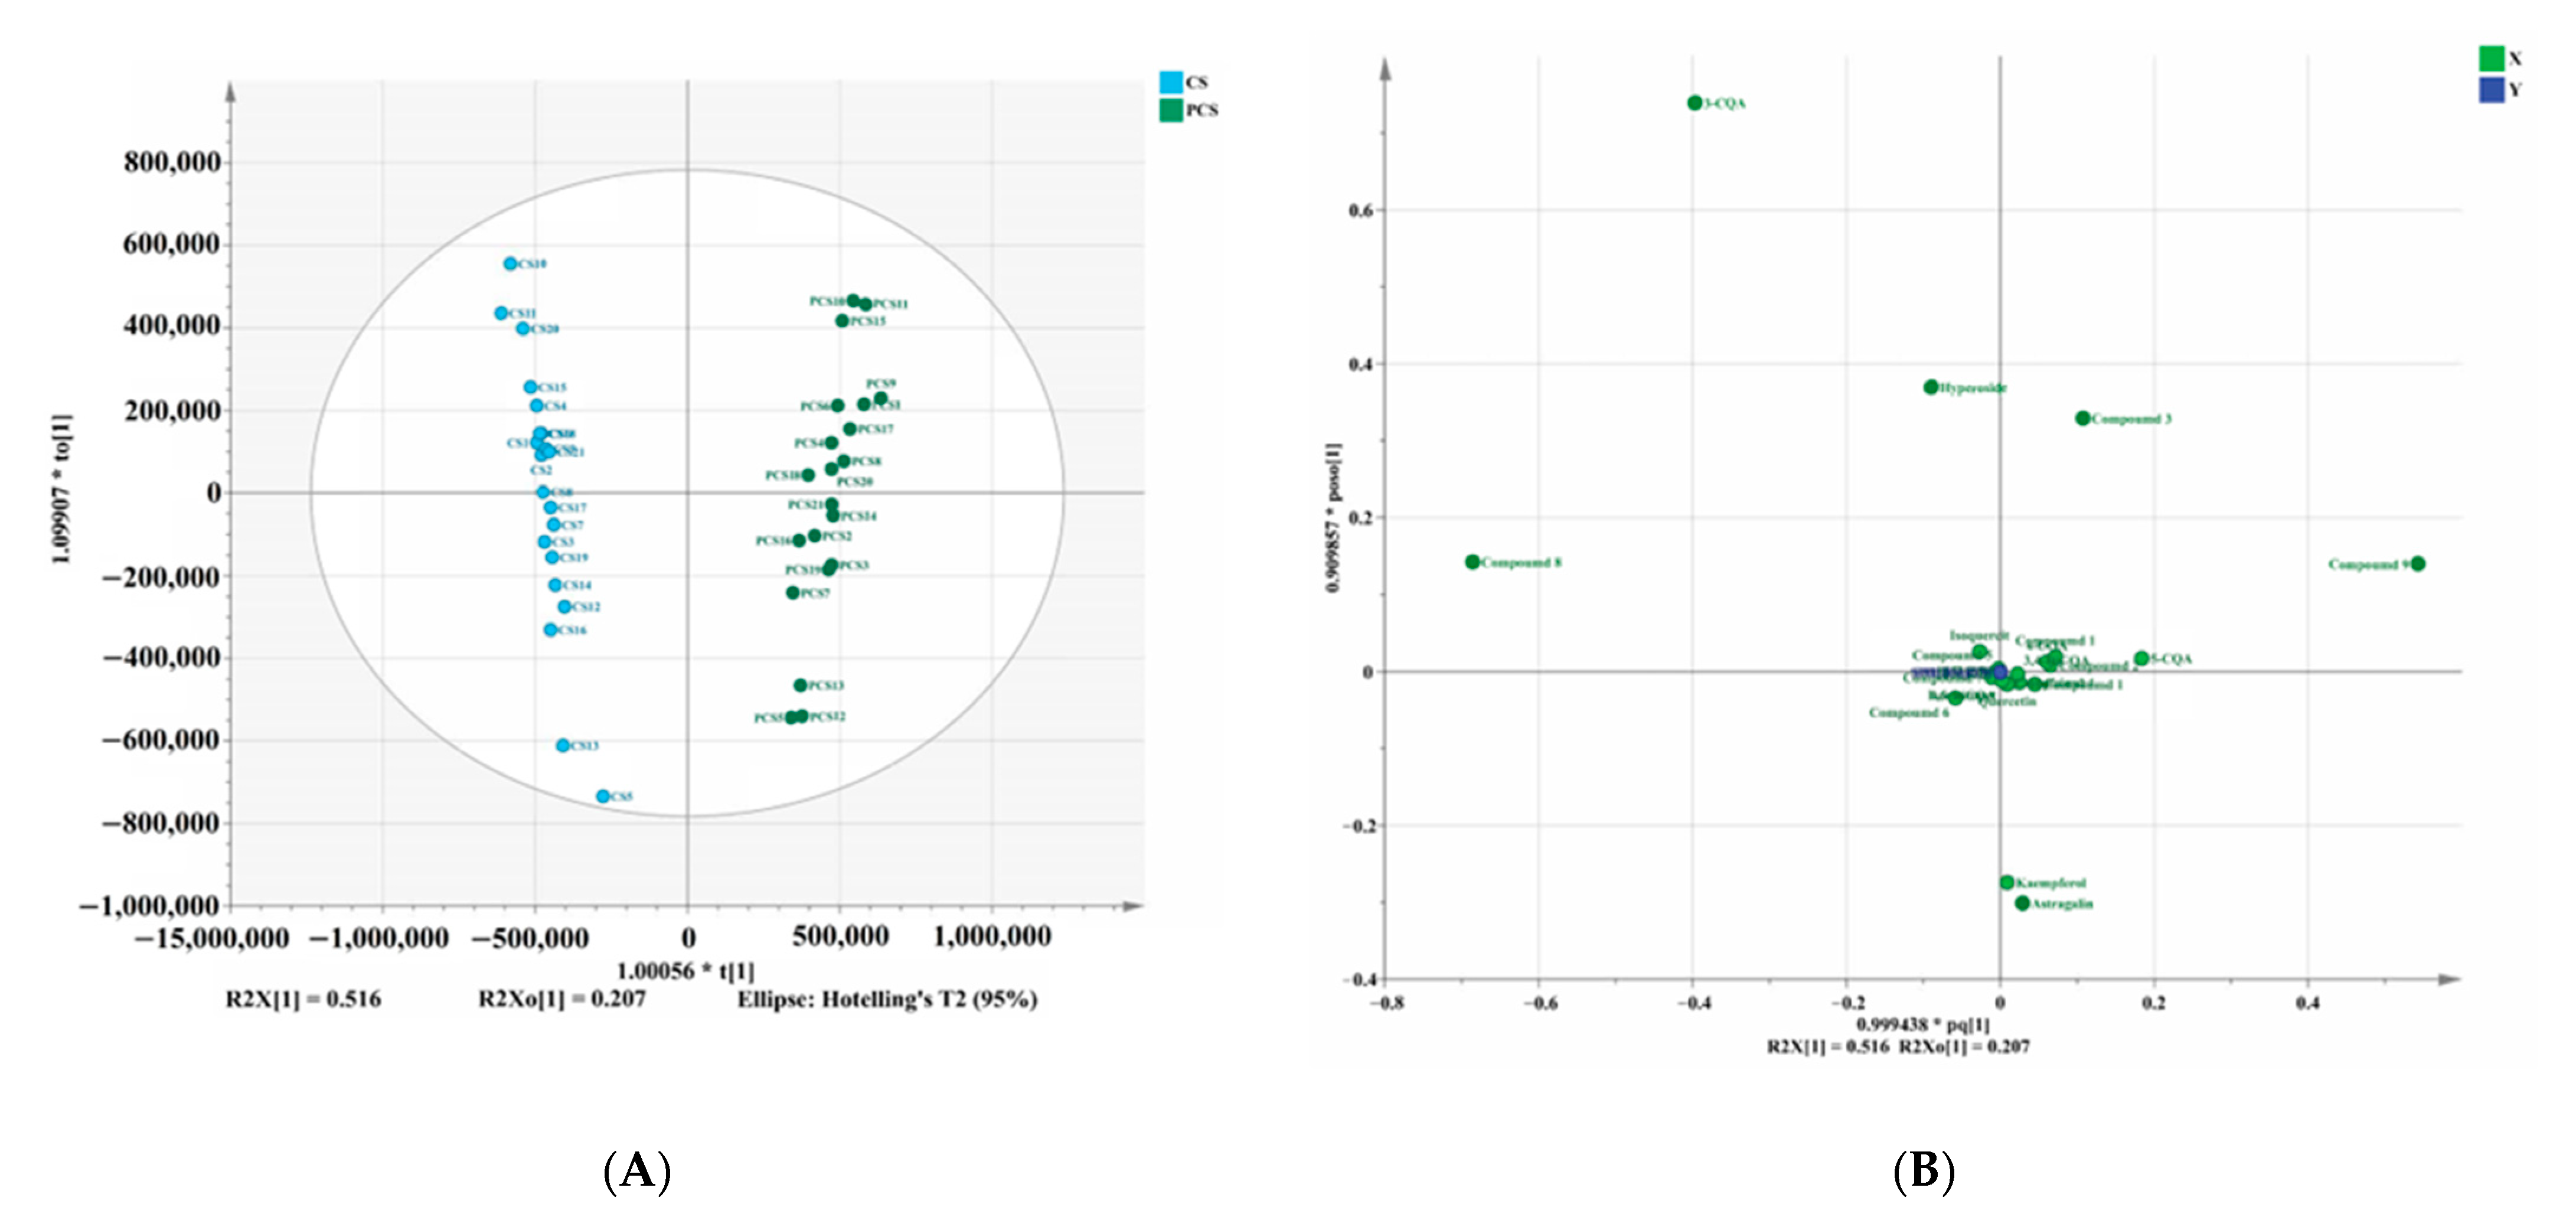
3.5. Chemometric Approaches

To further visualize the relationship and discriminate between CS and PCS samples, the quantitative data were imported into SIMCA-P 14.1 software to perform PCA and PLS-DA. Each variable in the HPLC data matrix refers to an HPLC chromatographic peak (22 components in CS or PCS) that was identified across 21 different CS samples and 21 PCS samples. The retention times and accurate peak area of each variable were used to determine their identities. Data were normalized to unit vector length, mean-centered, and Pareto scaled (i.e., scaled by the square root of the standard deviation) prior to the analyses. Principal component analysis (PCA), an unsupervised method, was adopted for the dimensionality reduction of multivariate data to describe the significant data variance with a few principal components (PCs) [19]. The values of the established PCA model fit parameters R2X (cum) and Q2 (cum) were 0.944 and 0.687, respectively, which indicated that the model is robust. In the score plot, different processing procedures occupy a different region. On the basis of eigenvalues >1, four principal components accounting for 91.9% of the total variance were considered significant. As shown in Figure 4A, the first two principal components were used to cumulatively explain 65% (PC1, 39%; PC2, 26%) of the total variation in the samples. It was observed that the CS samples formed a close group, whereas the PCS samples clustered together. During the PCA analysis, it was also noted that a small number of samples were distributed outside the core of the clusters. For example, samples CS5, CS13, and CS16 were outliers of the CS group, while PCS5, PCS13, and PCS16 represented outliers of the PCS group. In truth, these samples displayed lower chromatographic similarity (relative to the reference chromatogram) compared to other samples in the same group. The 3D score scatter plot (Figure 4B) also exhibited good fitness (Q2[1] (cum) 0.33, Q2[2] (cum) 0.176, Q2[3] (cum) 0.13) and predictability (R2X[1] (cum) 0.39, R2X[2] (cum) 0.26, R2X[2] (cum) 0.293) [20]. All the observations fell within the Hotelling’s T2 (0.95) ellipse. All samples were clearly classified into two groups, which indicated obvious differences in their chemical compositions.
However, the PCA approach only provided limited results and an insubstantial understanding of the chemical relationships among the samples. Therefore, the partial least squares discrimination analysis (PLS-DA), a supervised pattern recognition method, was applied [21]. The fitted OPLS-DA model exhibited good fitness (Q2 (cum) 0.968) and predictability (R2X (cum) 0.723). All the observations fell within the Hotelling’s T2 (0.95) ellipse. First, the raw and processed products could be distinguished well in the score scatter plot (Figure 5A), which means that processing plays an important role in the change of CS. Moreover, the samples of CS clusters were in a small region after being processed with salt, which illustrates that processing can make samples more stable. The loading scatter plot (Figure 5B) displays the relationship between the X variables and the Y variables for the first predictive component and the first Y-orthogonal component. Analysis of the PLS-DS loading scatter plot revealed that 3-CQA, compound 8, and compound 9 were the major discriminators accounting for specimens’ segregation. Variable importance in projection (VIP), a weighted sum of squares of the PLS loadings, was adopted to further characterize the samples. The metabolites with VIP values greater than 1.0 were considered more relevant among the different samples. In the VIP plot (Figure 5C), three components, namely 3-CQA, compound 8, and compound 9, were perceived to be the most relevant of the 22 chromatographic peaks. Furthermore, we will use liquid chromatography–mass spectrometry technology to identify unknown compounds 8 and 9 in future work. On the whole, it was evident that CS and PCS samples were clearly clustered into two groups, meaning the processing procedures caused changes in the composition and/or contents of components in the CS sample.
Hierarchical cluster analysis (HCA) was performed to explore the relationships and differences between the CS and PCS samples and their components. The top 22 components with the highest significance were selected by conducting a t-test and served as potential markers. The 42 samples were categorized based on different measurement indicators by employing Ward’s method with the Euclidean distance [22]. The heatmap with a dendrogram is presented in Figure 6. All the samples were classified into two main clusters. Cluster I mainly consisted of crude CS samples, while Cluster II mainly consisted of PCS samples. The results indicate that the proposed processing method might have a larger influence on the chemical profile of CS than geographical origin. During the process of salt roasting of traditional Chinese medicines, the main process parameters determining the change of components are heating temperature and time [23]. Based on this finding, it is important and necessary to control processing conditions such as heating temperature and time [24,25].

4. Conclusions

In the present study, a simple, accurate, and reliable method was developed to evaluate the quality of both crude and salt-processed Cuscutae Semen samples by adopting a chromatographic fingerprint method and simultaneous determination of twelve bioactive components. A total of 14 characteristic fingerprint peaks were analyzed to assess the similarities among 42 samples, and it was ascertained that there were obvious differences in similarity values among the CS and PCS samples. Twelve components were analyzed simultaneously in terms of their linearity, precision, repeatability, and accuracy over an analysis time of 60 min. PCA, PLS-DA, and HCA approaches were adopted to distinguish crude Cuscutae Semen samples from salt-processed Cuscutae Semen samples based on chromatographic data obtained using HPLC techniques. The proposed approach not only puts forward more specific quality standards for crude and salt-processed Cuscutae Semen samples, but also proffers a generally applicable method for determining the discriminatory quality control markers for TCMs and related processed products. In the future, we will continue to study the changes of specific components before and after the salt processing of Cuscutae Semen. Furthermore, we will also evaluate the main differential components through pharmacological methods, thereby further clarifying the mechanism of salt processing of Cuscutae Semen.

Author Contributions

Y.S., C.-L.X.: Validation, formal analysis, methodology, writing—original draft preparation, investigation. Y.-J.Z.: Formal analysis, methodology, data curation, visualization. Y.-W.T.: Conceptualization, methodology, writing—review and editing, supervision. X.L., X.G.: Writing—original draft preparation, investigation, data curation, visualization. Y.S., K.-M.Q.: Formal analysis, writing—original draft preparation, statistical analysis. K.-M.Q., W.-D.L.: Methodology, sample collection, investigation, visualization. All authors have read and agreed to the published version of the manuscript.

Funding

This research was supported by National Nature Science Foundation of China (No. 81773902, 81973484), Major Projects of Natural Science Foundation of Jiangsu Higher Education Institutions (No. 21KJA360005) and a Project Funded by the Priority Academic Program Development of Jiangsu Higher Education Institutions (PAPD).

Institutional Review Board Statement

Not applicable.

Informed Consent Statement

Not applicable.

Data Availability Statement

The data presented in this study are available on request from the corresponding author.

Conflicts of Interest

The authors declare no conflict of interest.

References

  1. Yang, S.; Xu, X.; Xu, H.; Xu, S.; Lin, Q.; Jia, Z.; Han, T.; Zhang, H.; Zhang, Y.; Liu, H.; et al. Purification, characterization and biological effect of reversing the kidney-yang deficiency of polysaccharides from Semen cuscutae. Carbohyd. Polym. 2017, 175, 249–256. [Google Scholar] [CrossRef] [PubMed]
  2. Lin, M.K.; Yu, Y.L.; Chen, K.C.; Chang, W.T.; Lee, M.S.; Yang, M.J.; Cheng, H.C.; Liu, C.H.; Chen, D.; Chu, C.L. Kaempferol from Semen cuscutae attenuates the immune function of dendritic cells. Immunobiology 2011, 216, 1103–1109. [Google Scholar] [CrossRef] [PubMed]
  3. Yang, J.; Wang, Y.; Bao, Y.; Guo, J. The total flavones from Semen cuscutae reverse the reduction of testosterone level and the expression of androgen receptor gene in kidney-yang deficient mice. J. Ethnopharmacol. 2008, 119, 166–171. [Google Scholar] [CrossRef]
  4. Wang, J.; Li, X.; Gao, L. Study on extraction process of tannins from Semen cuscutae and their anti-papilloma activity. Afr. J. Tradit. Complement. Altern. Med. 2013, 10, 469–474. [Google Scholar] [CrossRef] [PubMed]
  5. Kim, E.Y.; Kim, E.K.; Lee, H.S.; Sohn, Y.; Soh, Y.; Jung, H.S.; Sohn, N.W. Protective effects of Cuscutae semen against dimethylnitrosamine-induced acute liver injury in Sprague-Dawley rats. Biol. Pharm. Bull. 2007, 30, 1427–1431. [Google Scholar] [CrossRef] [PubMed]
  6. Yang, S.; Xu, H.; Zhao, B.; Li, S.; Li, T.; Xu, X.; Zhang, T.; Lin, R.; Li, J.; Li, X. The difference of chemical components and biological activities of the crude products and the salt-processed product from Semen cuscutae. Evid.-Based Compl. Alt. Med. 2016, 2016, 8656740. [Google Scholar] [CrossRef] [PubMed]
  7. Yang, L.; Chen, Q.; Wang, F.; Zhang, G. Antiosteoporotic compounds from seeds of Cuscuta chinensis. J. Ethnopharmacol. 2011, 135, 553–560. [Google Scholar] [CrossRef]
  8. Zhang, Y.; Xiong, H.; Xu, X.; Xue, X.; Liu, M.; Xu, S.; Liu, H.; Gao, Y.; Zhang, H.; Li, X. Compounds identification in Semen Cuscutae by ultra-high-performance liquid chromatography (UPLCs) coupled to electrospray ionization mass spectrometry. Molecules 2018, 23, 1199. [Google Scholar] [CrossRef]
  9. Zhang, W.; Fu, Z.T.; Xie, Y.; Duan, Z.W.; Wang, Y.; Fan, R.H. High resolution UPLC-MS/MS method for simultaneous separation and determination of six flavonoids from Semen cuscutae extract in rat plasma: Application to comparative pharmacokinetic studies in normal and kidney-deficient rats. Nat. Prod. Res. 2020, 34, 1446–1451. [Google Scholar] [CrossRef] [PubMed]
  10. Gao, F.; Zhou, C.; Qiu, W.; Wu, H.; Li, J.; Peng, J.; Qiu, M.; Liang, C.; Gao, J.; Luo, S. Total flavonoids from Semen cuscutae target MMP9 and promote invasion of EVT cells via Notch/AKT/MAPK signaling pathways. Sci. Rep. 2018, 8, 17342. [Google Scholar] [CrossRef] [Green Version]
  11. Kang, S.Y.; Jung, H.W.; Lee, M.Y.; Lee, H.W.; Chae, S.W.; Park, Y.K. Effect of the semen extract of Cuscuta chinensis on inflammatory responses in LPS-stimulated BV-2 microglia. Chin. J. Nat. Med. 2014, 12, 573–581. [Google Scholar] [CrossRef]
  12. Han, S.X.; Yao, H.L.; Li, Y.Y.; Wang, T.S. Protective effects of Cuscuta chinensis lam. extract on myocardial ischemia/reperfusion injury in rats. Chin. Pharm. Bull. 2011, 27, 533–536. [Google Scholar]
  13. Ye, M.; Li, Y.; Yan, Y.N.; Liu, H.W.; Ji, X.H. Determination of flavonoids in Semen cuscutae by RP-HPLC. J. Pharm. Biomed. Anal. 2002, 28, 621–628. [Google Scholar] [CrossRef]
  14. Ye, M.; Yan, Y.; Guo, D.A. Characterization of phenolic compounds in the Chinese herbal drug Tu-Si-Zi by liquid chromatography coupled to electrospray ionization mass spectrometry. Rapid Commun. Mass Spectrom. 2005, 19, 1469–1484. [Google Scholar] [CrossRef] [PubMed]
  15. Fantoukh, O.I.; Wang, Y.-H.; Parveen, A.; Hawwal, M.F.; Ali, Z.; Al-Hamoud, G.A.; Chittiboyina, A.G.; Joubert, E.; Viljoen, A.; Khan, I.A. Chemical fingerprinting profile and targeted quantitative analysis of phenolic compounds from Rooibos Tea (Aspalathus linearis) and dietary supplements using UHPLC-PDA-MS. Separations 2022, 9, 159. [Google Scholar] [CrossRef]
  16. Shi, Y.; Zhan, Y.; Shi, D.; Ji, J.; Qin, K. Quantitative and chemical fingerprint analysis for the quality evaluation of Fructus arctii by HPLC coupled with hierarchical clustering analysis. Lat. Am. J. Pharm. 2019, 38, 643–650. [Google Scholar]
  17. Zhou, X.; Tang, L.; Wu, H.; Zhou, G.; Wang, T.; Kou, Z.; Li, S.; Wang, Z. Chemometric analyses for the characterization of raw and processed seeds of Descurainia sophia (L.) based on HPLC fingerprints. J. Pharm. Biomed. Anal. 2015, 111, 1–6. [Google Scholar]
  18. Yang, B.; Hu, J.; Zhu, X.; Zhuang, Y.; Yin, F.; Qin, K.; Cai, B. Qualitative analysis of multiple compounds in raw and prepared Semen cassiae coupled with multiple statistical strategies. J. Sep. Sci. 2017, 40, 4718–4729. [Google Scholar]
  19. Donnapee, S.; Li, J.; Yang, X.; Ge, A.H.; Donkor, P.O.; Gao, X.M.; Chang, Y.X. Cuscuta chinensis Lam.: A systematic review on ethnopharmacology, phytochemistry and pharmacology of an important traditional herbal medicine. J. Ethnopharmacol. 2014, 157, 292–308. [Google Scholar] [CrossRef]
  20. Stpnik, K.; Kukula-Koch, W. In silico studies on triterpenoid saponins permeation through the blood-brain barrier combined with postmortem research on the brain tissues of mice affected by astragaloside IV administration. Int. J. Mol. Sci. 2020, 21, 2534. [Google Scholar] [CrossRef]
  21. Hamazaki, Y.; Kato, M.; Karasawa, K. Methylnigakinone content determination and geographical origin discrimination for P. quassioides via fluorescence fingerprint and principal component analyses. J. Pharm. Biomed. Anal. 2022, 219, 114932. [Google Scholar] [CrossRef] [PubMed]
  22. Cao, X.; Sun, L.; Li, D.; You, G.; Wang, M.; Ren, X. Quality evaluation of Phellodendri Chinensis Cortex by fingerprint-chemical pattern recognition. Molecules 2018, 23, 2307. [Google Scholar] [CrossRef] [PubMed]
  23. Ji, D.; Su, X.; Huang, Z.; Su, L.; Li, L.; Lu, T. Analysis of chemical variations between crude and salt-processed anemarrhenae rhizoma using ultra-high-performance liquid chromatography-mass spectrometry methods. Molecules 2017, 23, 23. [Google Scholar] [CrossRef] [PubMed]
  24. Oshima, R.; Kotani, A.; Kuroda, M.; Yamamoto, K.; Mimaki, Y.; Hakamata, H. Discrimination of Schisandrae Chinensis Fructus and Schisandrae Sphenantherae Fructus based on fingerprint profiles of hydrophilic components by high-performance liquid chromatography with ultraviolet detection. J. Nat. Med. 2018, 72, 399–408. [Google Scholar] [CrossRef]
  25. Wu, X.; Wang, S.; Lu, J.; Jing, Y.; Li, M.; Cao, J.; Bian, B.; Hu, C. Seeing the unseen of Chinese herbal medicine processing (Paozhi): Advances in new perspectives. Chin. Med. 2018, 13, 4–12. [Google Scholar] [CrossRef]
Figure 1. Structures of the bioactive components 112 in Cuscutae Semen. 1, neochlorogenic acid; 2, chlorogenic acid; 3, cryptochlorogenic acid; 4, caffeic acid; 5, hyperoside; 6, isoquercitrin; 7, isochlorogenic acid B; 8, astragalin; 9, isochlorogenic acid C; 10, quercetin; 11, kaempferol; 12, isorhamnetin.
Separations 09 00231 g001
Figure 2. The HPLC fingerprints of the mixed standard substance (A), CS (B), and PCS samples (C).
Separations 09 00231 g002
Figure 3. The chromatographic fingerprints of the 21 batches of CS (A) and PCS (B) samples.
Separations 09 00231 g003
Figure 4. The score scatter plot (PCA) (A) and three-dimensional score scatter plot (PCA) (B) drawings of 21 batches of CS and PCS samples.
Separations 09 00231 g004
Figure 5. The score scatter plot (PLS-DA) (A), loading scatter plot (PLS-DA) (B), and VIP plot (PLS-DA) (C) of CS and PCS samples.
Separations 09 00231 g005aSeparations 09 00231 g005b
Figure 6. The HCA heatmap and clustering results.
Separations 09 00231 g006
Table 1. Details of samples of Cuscutae Semen.
No.OriginBatch Number
S1Inner Mongolia20,210,301
S2Inner Mongolia20,201,201
S3Liaoning201,101
S4Ningxia20,121,001
S5Gansu20,210,524
S6Inner Mongolia210,301
S7Ningxia20,210,514
S8Inner Mongolia200,726
S9Inner Mongolia210,103
S10Heibei200,901
S11Shandong201,222
S12Yunnan20,210,606
S13Henan202,009
S14Guangxi202,007
S15Inner Mongolia200,915
S16Hebei202,106
S17Jiangsu202,008
S18Anhui20,210,610
S19Ningxia202,010
S20Inner Mongolia200,401
S21Shandong210,200,181
Table 2. Calibration curve equations, linear ranges, LODs, and LOQs of the bioactive components.
No.AnalyteCalibration Curve EquationrLinear Range
(mg/mL)
LOD
(μg/mL)
LOQ
(μg/mL)
15-CQAY = 24,908,773X − 24501.00000.0002~0.08600.210.43
23-CQAY = 25,509,829X + 15,0860.99900.0006~0.22380.561.12
34-CQAY = 20,357,556X − 14901.00000.0002~0.08160.200.41
4caffeic acidY = 47,472,731X + 17,0070.99940.0002~0.09030.230.45
5hyperosideY = 13,723,924X + 13,3260.99940.0006~0.24420.611.22
6isoquercitrinY = 13,711,789X + 34500.99960.0002~0.08650.220.43
73,4-DiCQAY = 30,307,263X − 23,5280.99980.0002~0.08650.220.43
8astragalinY = 17,030,336X + 45,9860.99940.0015~0.60791.523.04
94,5-DiCQAY = 33,839,153X − 13,6370.99910.0002~0.08150.200.41
10quercetinY = 17,558,745X + 18500.99950.0002~0.08120.200.41
11kaempferolY = 21,261,390X + 12,6820.99940.0006~0.24480.611.22
12isorhamnetinY = 16,630,604X + 57040.99940.0003~0.10440.260.52
Table 3. The contents of the 12 components in the 21 batches of CS and PCS samples (mg/g).
No.Samples123456789101112Total
S1CS0.12 ± 0.003.41 ± 0.000.19 ± 0.000.04 ± 0.005.49 ± 0.010.72 ± 0.00ND0.36 ± 0.000.05 ± 0.000.07 ± 0.000.14 ± 0.00DUL10.59 ± 0.01
PCS0.58 ± 0.042.55 ± 0.110.35 ± 0.030.03 ± 0.004.91 ± 0.130.59 ± 0.010.06 ± 0.000.49 ± 0.000.05 ± 0.010.11 ± 0.010.21 ± 0.01DUL9.93 ± 0.18
S2CS0.11 ± 0.003.79 ± 0.000.20 ± 0.000.05 ± 0.004.17 ± 0.000.77 ± 0.00ND1.15 ± 0.000.08 ± 0.000.08 ± 0.000.35 ± 0.000.03 ± 0.0010.78 ± 0.01
PCS0.72 ± 0.112.60 ± 0.210.46 ± 0.070.06 ± 0.003.44 ± 0.170.60 ± 0.020.10 ± 0.011.09 ± 0.040.07 ± 0.000.16 ± 0.040.30 ± 0.010.03 ± 0.009.63 ± 0.01
S3CS0.09 ± 0.003.17 ± 0.010.14 ± 0.000.05 ± 0.004.72 ± 0.010.75 ± 0.00ND0.52 ± 0.000.06 ± 0.000.17 ± 0.000.34 ± 0.000.03 ± 0.0010.04 ± 0.01
PCS0.45 ± 0.032.22 ± 0.150.29 ± 0.020.06 ± 0.004.01 ± 0.210.62 ± 0.010.07 ± 0.000.55 ± 0.010.05 ± 0.000.17 ± 0.010.30 ± 0.020.03 ± 0.008.82 ± 0.25
S4CS0.09 ± 0.003.76 ± 0.010.16 ± 0.000.06 ± 0.004.77 ± 0.000.77 ± 0.00ND0.83 ± 0.000.07 ± 0.000.06 ± 0.000.09 ± 0.00DUL10.66 ± 0.00
PCS0.54 ± 0.002.77 ± 0.060.33 ± 0.000.07 ± 0.004.09 ± 0.070.65 ± 0.010.08 ± 0.001.15 ± 0.080.07 ± 0.010.12 ± 0.000.29 ± 0.03DUL10.16 ± 0.17
S5CS0.03 ± 0.001.76 ± 0.010.05 ± 0.00DUL3.81 ± 0.010.42 ± 0.00NDDULDUL0.02 ± 0.00DULND6.09 ± 0.01
PCS0.24 ± 0.011.52 ± 0.050.16 ± 0.000.03 ± 0.003.53 ± 0.060.35 ± 0.01DULDUL0.02 ± 0.000.08 ± 0.00DULDUL5.93 ± 0.07
S6CS0.11 ± 0.003.67 ± 0.020.09 ± 0.000.05 ± 0.004.39 ± 0.010.60 ± 0.01ND0.40 ± 0.000.04 ± 0.000.09 ± 0.01DULND9.44 ± 0.03
PCS0.57 ± 0.052.84 ± 0.050.33 ± 0.020.09 ± 0.003.97 ± 0.030.50 ± 0.010.08 ± 0.000.56 ± 0.000.05 ± 0.000.13 ± 0.01DULDUL9.12 ± 0.04
S7CS0.08 ± 0.013.36 ± 0.010.15 ± 0.000.08 ± 0.003.66 ± 0.000.72 ± 0.00ND0.72 ± 0.000.06 ± 0.000.13 ± 0.000.11 ± 0.00DUL9.07 ± 0.03
PCS0.35 ± 0.072.44 ± 0.170.25 ± 0.040.07 ± 0.013.00 ± 0.110.54 ± 0.020.07 ± 0.000.71 ± 0.050.05 ± 0.000.12 ± 0.010.13 ± 0.02DUL7.73 ± 0.18
S8CS0.11 ± 0.013.30 ± 0.010.15 ± 0.020.06 ± 0.004.86 ± 0.010.67 ± 0.00ND0.79 ± 0.000.06 ± 0.030.11 ± 0.000.38 ± 0.000.03 ± 0.0010.52 ± 0.06
PCS0.37 ± 0.052.62 ± 0.120.22 ± 0.030.07 ± 0.004.33 ± 0.230.56 ± 0.040.07 ± 0.000.76 ± 0.050.06 ± 0.010.11 ± 0.010.34 ± 0.02DUL9.51 ± 0.32
S9CS0.11 ± 0.012.98 ± 0.020.12 ± 0.000.03 ± 0.006.45 ± 0.010.60 ± 0.03NDDUL0.03 ± 0.000.07 ± 0.00DULND10.39 ± 0.07
PCS0.48 ± 0.022.32 ± 0.100.25 ± 0.010.03 ± 0.015.75 ± 0.180.55 ± 0.020.05 ± 0.00DUL0.03 ± 0.000.10 ± 0.01DULDUL9.56 ± 0.19
S10CS0.05 ± 0.004.70 ± 0.040.13 ± 0.040.04 ± 0.014.38 ± 0.000.76 ± 0.00ND0.56 ± 0.000.05 ± 0.000.06 ± 0.000.21 ± 0.00DUL10.94 ± 0.08
PCS0.46 ± 0.043.42 ± 0.050.36 ± 0.030.05 ± 0.013.81 ± 0.110.63 ± 0.020.07 ± 0.000.66 ± 0.040.06 ± 0.000.08 ± 0.010.26 ± 0.02DUL9.86 ± 0.20
S11CS0.08 ± 0.004.00 ± 0.000.12 ± 0.000.04 ± 0.006.78 ± 0.000.83 ± 0.00ND0.77 ± 0.000.04 ± 0.000.09 ± 0.000.16 ± 0.00DUL12.91 ± 0.01
PCS0.41 ± 0.013.05 ± 0.090.28 ± 0.010.04 ± 0.015.83 ± 0.150.64 ± 0.010.07 ± 0.000.76 ± 0.030.06 ± 0.010.13 ± 0.010.19 ± 0.01DUL11.46 ± 0.14
S12CS0.10 ± 0.003.06 ± 0.010.22 ± 0.000.07 ± 0.003.69 ± 0.010.66 ± 0.00ND1.08 ± 0.000.10 ± 0.000.12 ± 0.000.44 ± 0.000.04 ± 0.009.58 ± 0.01
PCS0.47 ± 0.062.24 ± 0.320.30 ± 0.030.09 ± 0.013.28 ± 0.260.60 ± 0.030.08 ± 0.012.00 ± 0.840.05 ± 0.000.17 ± 0.051.21 ± 0.670.08 ± 0.0310.57 ± 1.41
S13CS0.10 ± 0.012.67 ± 0.010.20 ± 0.000.07 ± 0.003.36 ± 0.010.72 ± 0.00ND2.52 ± 0.000.13 ± 0.000.24 ± 0.001.51 ± 0.000.09 ± 0.0011.61 ± 0.01
PCS0.42 ± 0.012.33 ± 0.120.26 ± 0.010.09 ± 0.023.32 ± 0.060.61 ± 0.040.08 ± 0.012.07 ± 0.830.06 ± 0.010.17 ± 0.041.24 ± 0.660.09 ± 0.0310.74 ± 1.55
S14CS0.07 ± 0.013.09 ± 0.010.09 ± 0.000.06 ± 0.004.21 ± 0.020.62 ± 0.00ND1.06 ± 0.000.06 ± 0.000.14 ± 0.010.55 ± 0.000.04 ± 0.009.99 ± 0.05
PCS0.37 ± 0.012.51 ± 0.030.25 ± 0.010.11 ± 0.003.69 ± 0.080.52 ± 0.020.07 ± 0.000.95 ± 0.050.05 ± 0.010.14 ± 0.010.46 ± 0.040.03 ± 0.009.15 ± 0.11
S15CS0.08 ± 0.004.08 ± 0.020.17 ± 0.020.05 ± 0.004.22 ± 0.000.71 ± 0.00ND0.59 ± 0.000.06 ± 0.000.12 ± 0.000.13 ± 0.00DUL10.21 ± 0.04
PCS0.40 ± 0.033.38 ± 0.070.32 ± 0.020.11 ± 0.003.70 ± 0.030.60 ± 0.010.07 ± 0.000.67 ± 0.020.06 ± 0.010.15 ± 0.000.13 ± 0.01DUL9.59 ± 0.05
S16CS0.09 ± 0.013.28 ± 0.010.19 ± 0.000.09 ± 0.003.43 ± 0.010.87 ± 0.01ND2.67 ± 0.000.19 ± 0.000.19 ± 0.000.95 ± 0.000.06 ± 0.0012.01 ± 0.03
PCS0.39 ± 0.022.70 ± 0.050.26 ± 0.010.21 ± 0.003.28 ± 0.090.71 ± 0.030.10 ± 0.012.21 ± 0.020.16 ± 0.010.13 ± 0.010.72 ± 0.020.06 ± 0.0010.93 ± 0.16
S17CS0.08 ± 0.003.16 ± 0.000.14 ± 0.000.04 ± 0.005.11 ± 0.000.65 ± 0.00ND0.40 ± 0.000.05 ± 0.000.08 ± 0.000.19 ± 0.00DUL9.90 ± 0.01
PCS0.38 ± 0.012.57 ± 0.050.24 ± 0.010.06 ± 0.004.61 ± 0.070.57 ± 0.010.07 ± 0.000.38 ± 0.020.07 ± 0.000.11 ± 0.000.17 ± 0.02DUL9.23 ± 0.12
S18CS0.08 ± 0.003.89 ± 0.020.14 ± 0.000.05 ± 0.003.70 ± 0.020.73 ± 0.00ND0.74 ± 0.010.06 ± 0.000.06 ± 0.000.12 ± 0.00DUL9.57 ± 0.06
PCS0.41 ± 0.142.74 ± 0.270.30 ± 0.090.11 ± 0.023.03 ± 0.110.59 ± 0.010.08 ± 0.010.75 ± 0.020.11 ± 0.000.11 ± 0.030.15 ± 0.01DUL8.38 ± 0.11
S19CS0.09 ± 0.003.04 ± 0.010.20 ± 0.000.05 ± 0.004.65 ± 0.010.66 ± 0.00ND0.66 ± 0.000.06 ± 0.000.11 ± 0.000.34 ± 0.00DUL9.86 ± 0.01
PCS0.42 ± 0.042.05 ± 0.110.26 ± 0.020.07 ± 0.013.81 ± 0.140.52 ± 0.020.09 ± 0.030.57 ± 0.020.07 ± 0.000.11 ± 0.010.28 ± 0.01DUL8.25 ± 0.22
S20CS0.07 ± 0.004.38 ± 0.010.10 ± 0.010.06 ± 0.004.11 ± 0.010.74 ± 0.00ND0.54 ± 0.000.03 ± 0.010.12 ± 0.000.42 ± 0.00DUL10.57 ± 0.02
PCS0.54 ± 0.062.92 ± 0.150.41 ± 0.040.09 ± 0.013.38 ± 0.100.60 ± 0.020.09 ± 0.010.61 ± 0.090.09 ± 0.000.15 ± 0.020.44 ± 0.020.05 ± 0.009.37 ± 0.12
S21CS0.09 ± 0.013.63 ± 0.000.19 ± 0.000.06 ± 0.003.94 ± 0.000.66 ± 0.00ND0.66 ± 0.000.12 ± 0.000.10 ± 0.000.10 ± 0.00DUL9.55 ± 0.01
PCS0.45 ± 0.072.61 ± 0.030.28 ± 0.040.12 ± 0.013.35 ± 0.030.55 ± 0.010.10 ± 0.010.87 ± 0.110.15 ± 0.010.09 ± 0.010.13 ± 0.00DUL8.71 ± 0.18
DUL: detected under the limit of quantification, ND: not detected.
Publisher’s Note: MDPI stays neutral with regard to jurisdictional claims in published maps and institutional affiliations.

