Abstract
Midecamycin is a 16-membered macrolide antibiotic. It can inhibit the synthesis of bacterial proteins by blocking up the activity of peptidyl transferase in the 50S ribosome. We used high-resolution mass spectrometry to analyze midecamycin, and quantitatively analyzed of each component of midecamycin produced by 18 different companies. The developed methods were validated by assessing linearity, limit of quantitation (LOQ), accuracy, precision, and robustness. Good separations were achieved for all components. Ten components of midecamycin were identified, and the contents of these components were determined in midecamycin produced by different companies. The demarcation between impurities and components of midecamycin was not clear. A ligand-docking model was used for predicting the impurities and components of midecamycin. Components and impurities were docked with the target. The results reported in this article may be important for quality control and the predictive demarcation between impurities and components of midecamycin.
1. Introduction
Midecamycin is a naturally occurring 16-membered macrolide, which is synthesized from Streptomyces mycarofaciens [1,2]. Midecamycin was first reported in 1971 [3]. Midecamycin can inhibit the synthesis of bacterial proteins by blocking the activity of peptidyl transferase in the 50S ribosome. Midecamycin shows high activity against Gram-positive bacteria. It is widely used as a bacteriostatic agent with low toxicity and broad-spectrum activities [4]. Moreover, midecamycin is also active against mycoplasma species [5]. Midecamycin is widely used in the clinic for its use in upper and lower respiratory tract infections [6], and is widely used in Asian countries.
Midecamycin is synthesized from bioengineered strains. Bioengineered strains can produce many other minor structures. For example, macrolides are multicomponent antibiotics produced via fermentation or semi-synthetic processes. As small changes in the fermentation process can result in substantial changes in composition, these drugs are typically composed of a couple of main components accompanied by minor components and impurities with structural similarity at a level often higher than 0.1%.
Thus, the quality control of midecamycin is still challenging because of the complexity of its components. According to the International Council for Harmonisation of Technical Requirements for Pharmaceuticals for Human Use (ICH) guidelines, impurities exceeding the limit of 0.1% should be identified [7]. The structural research of components and impurities is important to ensure that drugs are safe and effective. Meanwhile, the demarcation between impurities and components of midecamycin is not clear. Many minor components may have the capacity to inhibit bacterial protein synthesis. Monographs on midecamycin are included in the Japanese Pharmacopoeia (JP) and Korean Pharmacopoeia (KP) [8,9], but its main components and impurities are not consistent.
In previous research, the degradation impurities in midecamycin have been investigated using liquid chromatography–mass spectrometry (LC–MS), and some minor components existing in midecamycin have been separated and identified. However, the quantitative analysis of minor components and impurities has not been investigated in the midecamycin tablets [10]. Due to the interference of excipients, the previous method of high-performance liquid chromatography (HPLC) is not applicable for midecamycin tablets. We carried out numerous surveys to learn about the formulations offered by different companies. As far as we know, this is the first paper to investigate the components and impurities in midecamycin tablets using the newly established HPLC and LC–MS. Meanwhile, the demarcation between impurities and components of midecamycin was not clear. In this article, a ligand-docking model was used to identify the impurities and components of midecamycin. The results of this ligand-docking model may be an important prediction method for quality control and the demarcation between impurities and components of midecamycin.
2. Materials and Methods
2.1. Materials and Reagents
Formic acid amine (LCMS grade) and ammonium hydroxide (LCMS grade) were purchased from Anaqua Chemicals Supply (ACS) (Wilmington, NC, USA). Chromatographic-reagent-grade acetonitrile was purchased from Merck. Water was purified using the Milli-Q Plus Water Purification System (Mettler Toledo, Co., Shanghai, China). The mobile phases and sample solutions were filtered through 0.25 mm solvent-resistant filters. Midecamycin raw materials and midecamycin tablets were acquired from different manufacturers. The reference substance of midecamycin (ID: 130377-9803, 95.9% of midecamycin A1) was obtained from the National Institute for Food and Drug Control (NIFDC) (Beijing, China).
2.2. Instrumentation
HPLC was performed on an LC-20AD (Shimadzu, Kyoto, Japan). The analysis of mass spectra was performed using an HPLC system (Ultimate 3000) and a Q Exactive Plus high-resolution mass spectrometer (Thermo Fisher Scientific, MA, USA). Data were acquired and processed using Xcalibur 2.2 software and Q Exactive 2.1 software (Thermo Fisher Scientific, MA, USA).
2.3. Liquid Chromatography
The Extend-C18 column (Agilent Technologies, CA, USA) (250 mm × 4.6 mm, 5 μm) was used at 35 °C. The mobile phase was composed of 100 mmol/L formic acid amine solution (A) (adjusted pH to 7.3 ± 0.1 with ammonium hydroxide) and acetonitrile (B). The gradient program (T/% B) was set as 0/40, 25/50, 30/60, 35/80, 36/40 and 45/40. The mobile phase was used at a flow rate of 1.0 mL/min. The injection volume was 10 µL. The analysis wavelengths of the method were 232 and 280 nm. Most of the components were tested under the wavelength of 231 nm, while only midecamycin A3 was tested under the wavelength of 280 nm.
2.4. Mass Spectrometry
The ion source parameters were as follows: positive ion mode, capillary temperature of 350 °C; electrospray voltage of 3.0 kV; vaporizer temperature of 300 °C; sheath gas at 50 arbitrary units (arb), auxiliary gas at 18 arb; S–Lens RF level at 50 arb. In this study, the positive full MS/data-dependent MS/MS (dd-MS2) scan mode was employed. The scan mode has two scan events (SEs): SE1 is a full MS scan, while SE2 is a dd-MS2 scan.
2.5. Molecular Docking
Molecular docking was carried out to investigate the binding mode between midecamycin A1 and ribosomes using AutoDock Vina 1.1.2 [11]. The details of this method are described in the Supplementary Materials [12,13,14,15,16].
2.6. Sample Preparation
The diluent was a mixed solution (the mobile phases A and B at a ratio of 60:40).
In the methods of liquid chromatography and mass spectrometry, sample solutions of midecamycin were prepared at 2.0 mg mL−1 in the diluent.
Midecamycin solution: We weighed 100 mg of midecamycin raw materials in a 50 mL volumetric flask; 30 mL of diluent was added for ultrasonic dissolution and dilution to a known volume, and then the mixture was filtered through a solvent-resistant filter.
Midecamycin tablet solution: We weighed and finely powdered at least 20 tablets. Then, we transferred an accurately weighed portion of the powder equivalent to about 100 mg of midecamycin to a 50 mL volumetric flask; 30 mL of diluent was added for ultrasonic dissolution and dilution to a known volume, and then the mixture was filtered through a solvent-resistant filter.
Excipient solution: Based on the formulations described in the survey replies, the excipient solution was a mixed solution prepared according to the highest concentration of each excipient component.
3. Results
3.1. Method Development for HPLC
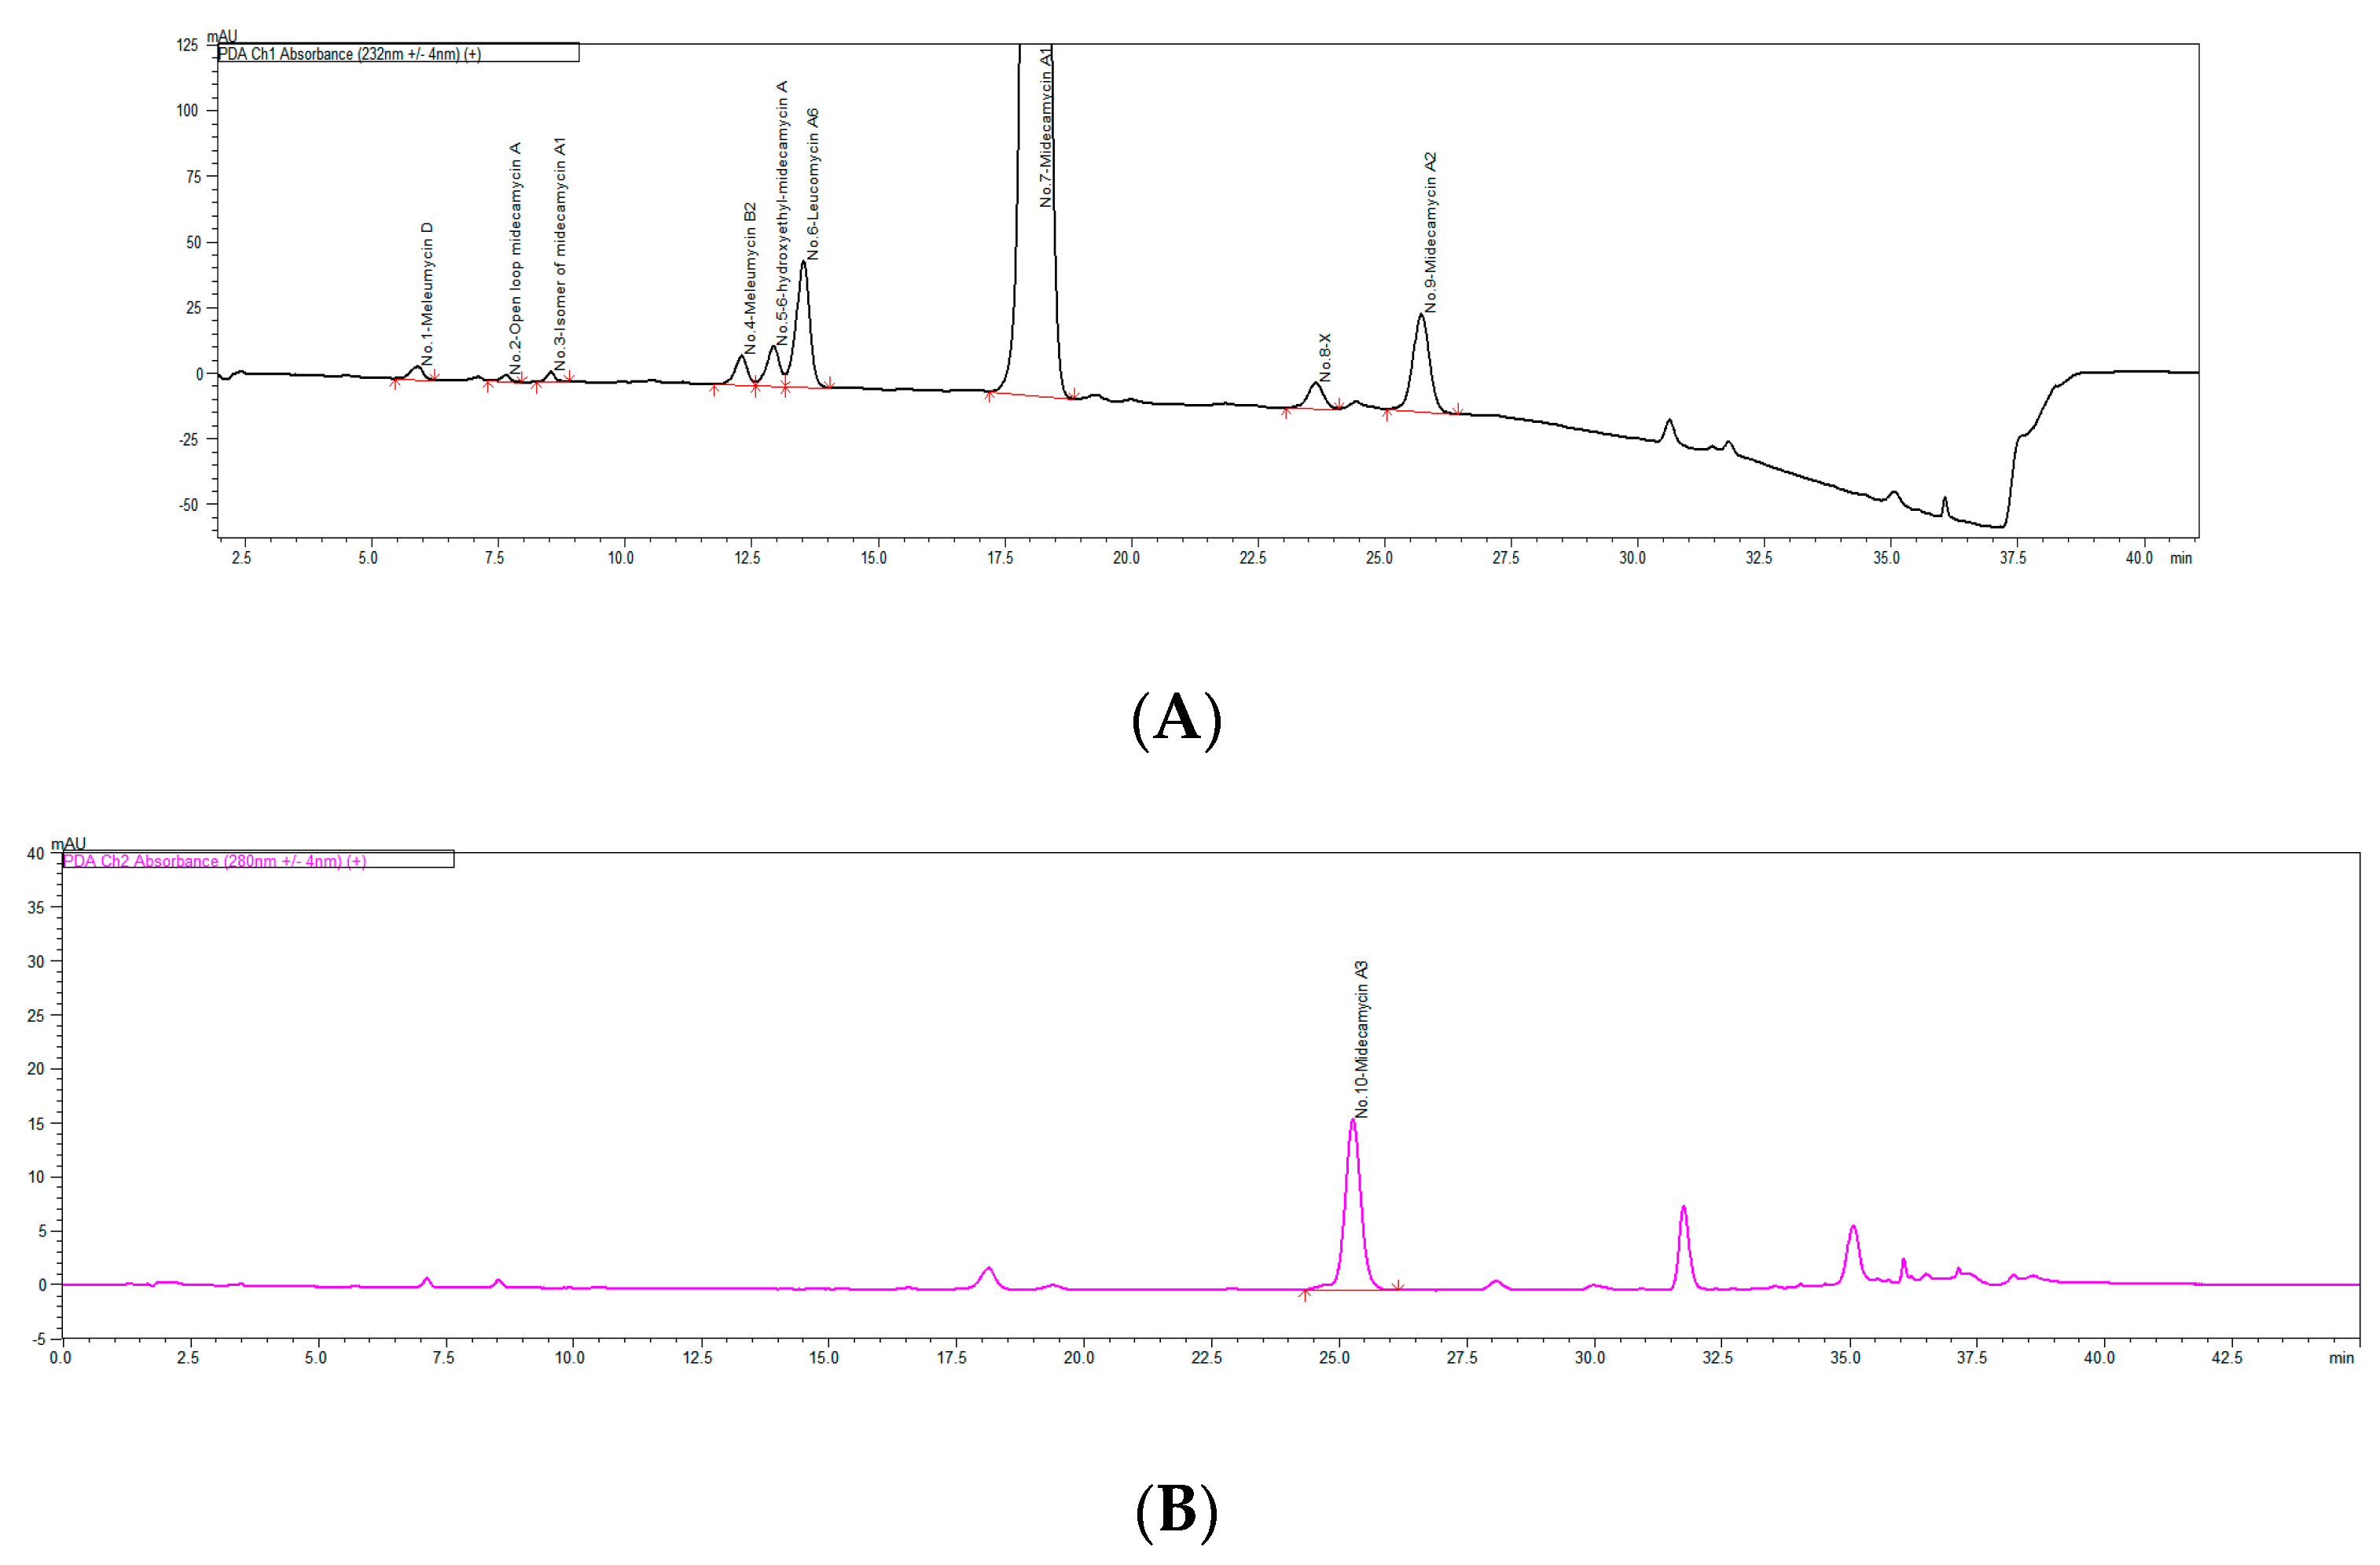
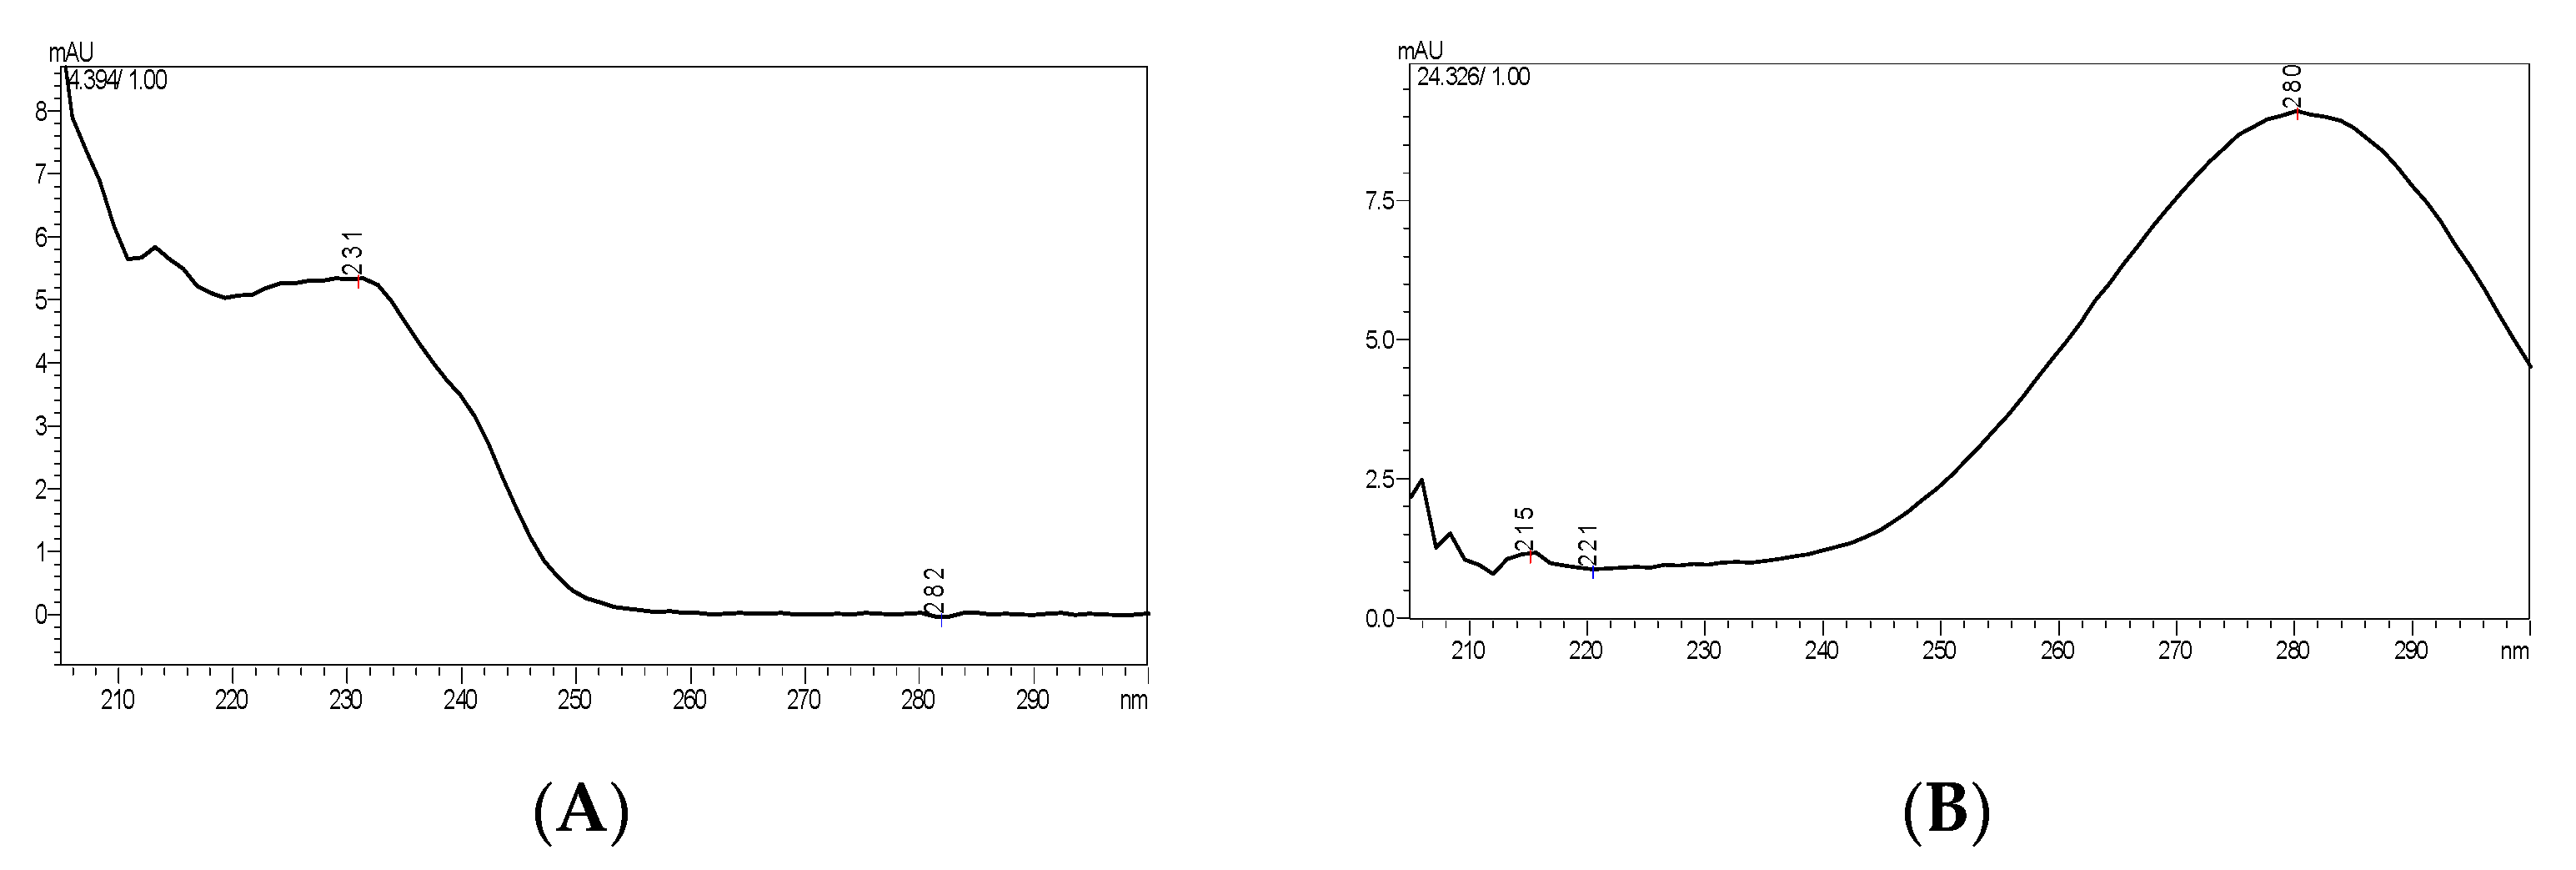
The factors that affected the chromatographic behavior were tested, including the type of salt, organic solvents, salt concentration, pH of the salt solution, and columns from different brands. Higher concentrations of formic acid amine gave a somewhat better separation, but to ensure the complete volatility of the mobile phase, its final concentration was kept at 100 mmol/L. Methanol was also evaluated as an organic modifier, but due to the presence of the [M + CH3OH + H]+ adduct which reduces the abundance of the ions of interest acetonitrile was ultimately selected. The LC separation method was performed on an Extend-C18 column (Agilent Technologies, CA, USA) (250 mm × 4.6 mm, 5 μm), BDS-Hypersil C18 column (Thermo Fisher Scientific, MA, USA) (250 mm × 4.6 mm, 5 μm), and Kromasil 100-5-C18 column (AkzoNobel, Amsterdam, the Netherlands) (250 mm × 4.6 mm, 5 μm).The Extend-C18 column gave the best results in terms of both separation and peak shape. To further improve the separation, the mobile phase was eluted by gradient elution (see Section 2.3). Different columns from different manufacturers have important differences in effects on the resolution of impurities (or components). The Extend-C18 column (250 mm × 4.6 mm, 5 μm) had the best resolution among the three tested columns. The Extend-C18 column or columns with equivalent efficiencyis recommended. The maximum information obtained by the photodiode array (PDA) detector can be used to identify the chromophores of the impurities (or components) in midecamycin. As shown in Figure 1, 10 peaks of midecamycin were analyzed at the wavelengths of 232 nm and 280 nm. For midecamycin, its related substances and components were detected by HPLC-DAD detection. In midecamycin, most of the components have maximum absorption at 232 nm. A few related substances have maximum absorption at 280 nm. In this research, the fixed wavelengths to evaluate the related substances (or components) were 232 nm and 280 nm. Figure 2 shows the typical UV spectra of the related substances (or components) in midecamycin.
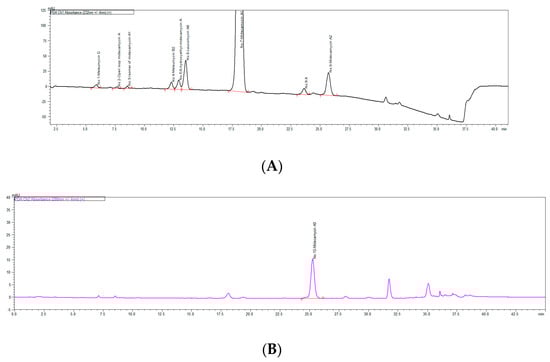
Figure 1.
UV chromatogram of midecamycin: (A) Detection wavelength of 231 nm (the peaks, in the following order, are meleumycin D, open-loop midecamycin A, isomer of midecamycin A1, meleumycin B2, 6-hydroxyethyl-midecamycin A, leucomycin A6, midecamycin A1, X, and midecamycin A2). (B) Detection wavelength of 280 nm (the peak is midecamycin A3). All of the structures are listed in Table 1.
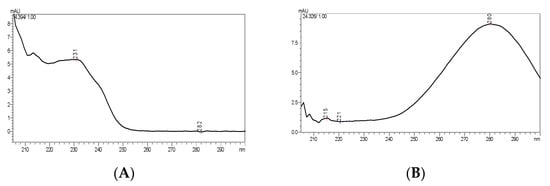
Figure 2.
Typical UV spectra: (A) meleumycin D (with the maximum absorption at 231 nm); (B) midecamycin A3 (with the maximum absorption at 280 nm). All of the UV spectra of impurities and components are shown in Figure S2.
3.2. Identification of Structures by LC–MS
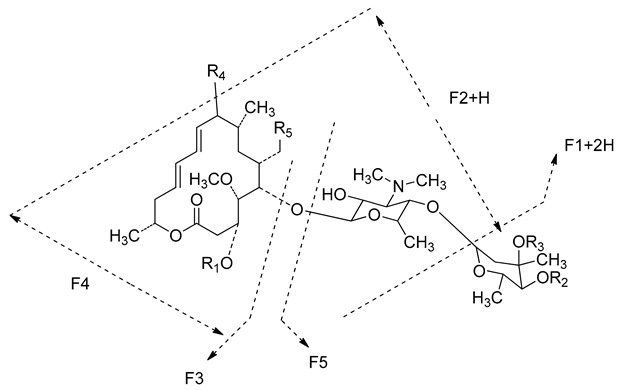
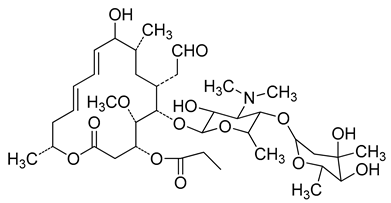
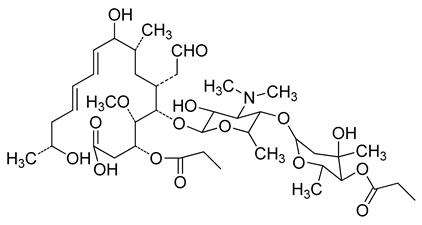
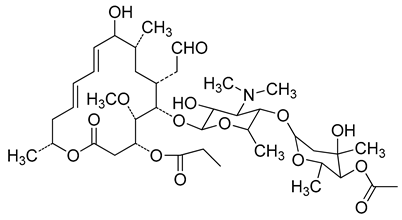
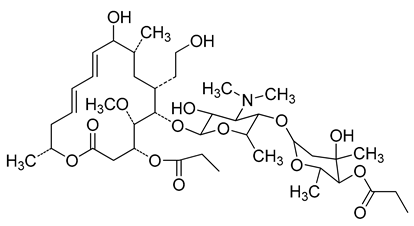
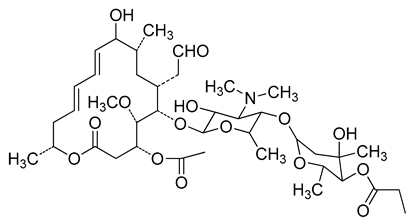
In this study, the HPLC-DAD method was compatible with mass detection. The components and impurities of midecamycin were detected using HRMS in positive electrospray ionization mode. The m/z values of all peaks were acquired via full-scan MS. The molecular weights were obtained from MS data. The structural information was obtained via dd-MS2 experiments. The main differences in the structures of the 16-membered ring macrolides were the substituent groups at aglycone or mycarose. According to the MS fragmentation regularities in the 16-membered macrolides, the structural elucidations of the impurities and components were deduced according to the structural differences compared with midecamycin A1 [17,18,19]. The fragments of the components in midecamycin are shown in Table 1. The detail of the formulae and m/z values of all components and impurities in midecamycin are given in Table 1.

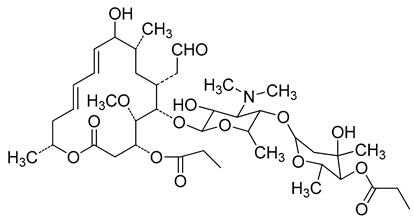
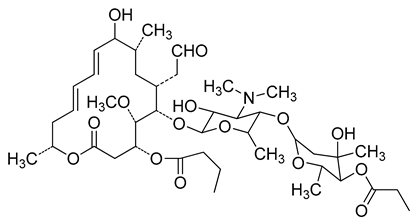
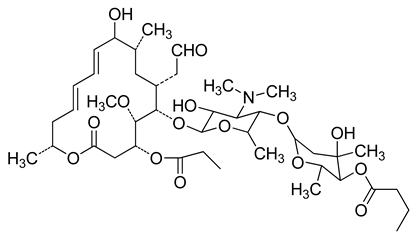
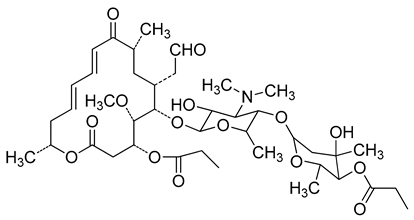
Table 1.
Structure of components/impurities in midecamycin and their mass spectrometric fragmentation pathway.
3.3. Quantitative Analysis of Impurities and Components Present in Commercial Midecamycin Samples
3.3.1. Solution Stability
The sample solutions of midecamycin tablets (2.0 mg mL−1) were maintained at 25 °C for 0 h, 2 h,4 h, 8 h, 12 h, 20 h, 24 h, and 48 h before injection. The solution was deemed to be stable when no more new peaks were found and the relative standard deviation (RSD) of the peak area was no more than 5%.
3.3.2. Linearity and Range
The linearity was demonstrated from 400 to 4000 µg mL−1 midecamycin A1 and from around 0.8 to 80 µg mL−1 midecamycin A3. Linear relationships between the peak area of the analyte and the corresponding concentration were assessed. The linearity of midecamycin A1 and midecamycin A3 was described by the linear equations of the calibration curves, as shown in Table 2.
Table 2.
Parameters of the calibration equations of midecamycin A1 and midecamycin A3, along with their LOD.
3.3.3. LOD and LOQ
The tablet solutions were diluted to known concentrations, and the LOD (limit of detection) and LOQ for midecamycin A1 and midecamycin A3 were calculated at those concentrations, revealing signal-to-noise ratios (S/N, obtained by ASTM calculation) of 3:1 and 10:1, respectively. The results of LOQ for midecamycin A1 and midecamycin A3 were 1.32 μg mL−1 and 0.76 μg mL−1, respectively. The results of LOD are presented in Table 2.
3.3.4. Accuracy
Standard spiking and recovery experiments were carried out to demonstrate the accuracy of the quantification of midecamycin A1. Three different levels (80%, 100%, and 120% contents of midecamycin A1 and midecamycin A3) were added to the excipient solution in triplicate. The excipient solution was a mixed solution prepared according to the highest concentration of each excipient component. The recovery percentages are shown in Table 3. The mean recovery percentages and the RSD% for each level were calculated.
Table 3.
Recovery of midecamycin A1 and midecamycin A3 by standard spiking.
3.3.5. Robustness
The robustness was assessed by the variations in flow rate (±0.2 mL min−1), column temperature (±2 °C), formic acid amine concentration (±0.01 mol/L), and pH (±0.2).
The resolutions of the peaks were used as the robustness index. In this study, the method was confirmed as robust against the variations. The Extend-C18 column (250 mm × 4.6 mm, 5 μm) had the best resolution among the three tested columns. The other two columns were a BDS-Hypersil (250 mm × 4.6 mm, 5 μm, Thermo Fisher Scientific, catalog number 10351834) and a Kromasil 100-5 (250 mm × 4.6 mm, 5 μm, AkzoNobel, catalog number M05CLA25). The Extend-C18 column—or columns with equivalent efficiency—is recommended (see Table 4).
Table 4.
The robustness data under various conditions for the HPLC separation of the analytes.
3.3.6. Repeatability
Six 100% spiked sample solutions of the tablets were injected to check the repeatability. The sample solutions were six different solutions prepared from the tablets obtained from Company 1. Sample solutions were prepared at 2.0 mg mL−1 (midecamycin) in the diluent. The RSD% for the contents of midecamycin A1 and midecamycin A3 was 0.6% and 1.7%, respectively, both of which were less than 2%. The data showed that the method could meet the minimal requirements for methods stated in international guidelines.
3.3.7. Analysis of Midecamycin Tablets
We collected midecamycin tablets from 18 enterprises for quantitative analysis. The midecamycin A1 and midecamycin A3 were tested by the external standard method with reference substances, using midecamycin A1 (231 nm) and midecamycin A3 (280 nm) as the references, respectively. The other minor components in midecamycin were tested by applying the developed method and using midecamycin A1 as the reference at 231 nm. The concentrations of minor components were calculated from the calibration curves. Relative amounts of the components in midecamycin are shown in Table 5.
Table 5.
Relative contents of components in midecamycin tablets from different companies.
3.4. Prediction of the Impurities and Components in Midecamycin
Midecamycin is known to interfere with protein synthesis by binding to the bacterial ribosome. Midecamycin A1 is the main component of midecamycin. Midecamycin A1 was docked with the active site of the ribosome, and the results are shown in Figure 3. The maximum binding affinity between midecamycin A1 and the ribosome was predicted to be −7.8 kcal/mol. The midecamycin A1 adopted a compact conformation to bind at the site of the ribosome (Figure 3), moving to the hydrophobic pocket and forming a strong hydrophobic binding (Figure 3). The midecamycin A1 was surrounded by the nucleotides U-746, A-2058, A-2059, A-2062, G-2505, U-2609, C-2610, and C-2611. Detailed analysis showed that one key hydrogen bond interaction was observed between the midecamycin and the nucleotide C-2611 (bond length: 2.2 Å), which was the main interaction between midecamycin A1 and the ribosome. All of these interactions helped the midecamycin to anchor to the binding site of the ribosome.
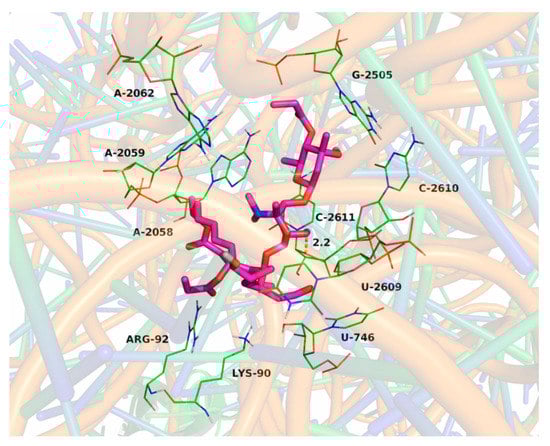
Figure 3.
Detailed analysis of the binding mode between midecamycin A1 and the ribosome. The ribosome is represented as a cartoon, and the representative binding nucleotides and amino acid residues are shown as lines. The midecamycin A1 is represented by rose red sticks; while the hydrogen bonds are shown as yellow dotted lines.
The impurities and components in midecamycin are all macrolides, but not all macrolides possess the required pharmacological properties to be sufficiently effective in the treatment of bacterial infections. The demarcation between impurities and components of midecamycin was not clear. A ligand-docking model was used for predicting the impurities and components of midecamycin. In order to display the binding differences between the impurities and the main components of midecamycin, the CDOCKER energy values indicated that some structures—especially meleumycin D—showed lower energy than midecamycin A1 (Table 6).
Table 6.
Docking results.
The maximum binding affinity between meleumycin D and the ribosome was predicted to be −5.9 kcal/mol, and the binding mode was different from that of midecamycin A1 (Figure 4), suggesting that meleumycin D could be defined as an impurity in midecamycin tablets.
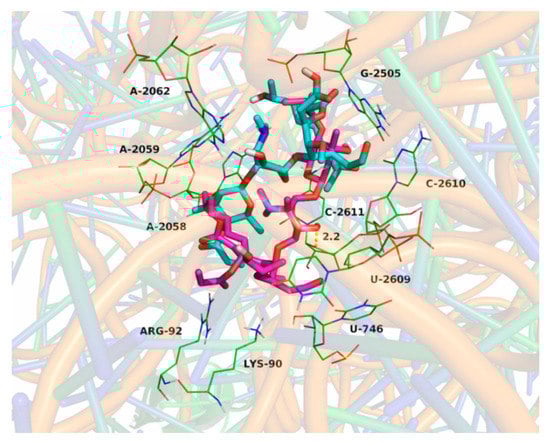
Figure 4.
Overlapped conformation of the midecamycin A1 (rose red sticks) and meleumycin D (cyan sticks) in the binding site of the ribosome.
4. Discussion
Ten components or impurities of midecamycin (Table 1) were identified in this research. With the development of analytical techniques, more minor components may be detected. The range of midecamycin A1 was 87.2~105.6%, and its RSD was 5.7%. The results showed that midecamycin A1 is the main component of midecamycin. The contents of other components and impurities varied between different manufacturers (Table 5), indicating that the different strains and fermentation technologies used by different manufactures could lead to differences in product quality. It is necessary to strengthen the control of the components and related substances of midecamycin, and to encourage the manufacturers to improve their fermentation technologies. Thus, the analysis methods applied in this research were effective and useful for the quantitative analysis of midecamycin tablets.
Macrolides represent a clinically important class of antibiotics that block protein synthesis by interacting with the large ribosomal subunit. The macrolide binding site is composed of rRNA. However, the mode of interaction of macrolides with rRNA and the exact location of the binding site have yet to be described. Some 14-, 15-, and 16-membered macrolides—for example erythromycin, tildipirosin, and azithromycin—have been studied using computationally calculated models to structurally model the mechanisms of resistance to peptide action. Previous studies have been conducted using computationally calculated models of the binding site, and revealed subtle differences in macrolide contacts, indicating how changes in the rRNA target have distinct effects on drug efficacy. The previous studies also showed that the structure–activity relationship (SAR) was more complex for macrolides. In this research, 10 components or impurities of midecamycin were studied using computationally calculated models. From the analysis of the binding mode between midecamycin A1 and the ribosome (Figure 3), one key hydrogen bond interaction was the main interaction between the midecamycin A1 and the ribosome. The CDOCKER energy value of midecamycin A1 was the highest among the components. The different CDOCKER energy values can show differences in binding to the target between different components of midecamycin. Software calculations provide a new basis for research to predict impurities or components in midecamycin. However, much remains to be accomplished, because macrolides have still not revealed all of their biological secrets. These models, while explaining many of the data, nevertheless represent static pictures of ribosome–drug interaction, and leave a number of questions unanswered.
In addition, more unknown impurities could later be discovered and identified with the development of analytical techniques. Meanwhile, the new reference substances of other components of midecamycin will be separated and synthesized in the future, which will be more conducive to the quantitative analysis and the determination of the activity of midecamycin’s components.
5. Conclusions
In this study, the developed HPLC methods provided better separation of the components and impurities in midecamycin. The developed HPLC methods could be considered for use in pharmacopoeic monographs in the future. The components and impurities were characterized based on MS/MS fragmentation pathways by HRMS. The components and impurities in commercial midecamycin tablets from 18 different companies were quantitatively analyzed. The results show that it is necessary to strengthen the control of the components and related substances of midecamycin, and to encourage the manufacturers to improve their fermentation technologies. Meanwhile, the molecular simulations offered a rational explanation of the interactions between midecamycin A1 and the ribosome, providing us with valuable information for the demarcation between impurities and components of midecamycin.
Supplementary Materials
The following supporting information can be downloaded at: https://www.mdpi.com/article/10.3390/separations9080225/s1. The method of Molecular docking; Figure S1. MS2 spectrums of the impurities; Figure S2. The UV spectrums of the impurities; Figure S3. The 3D docking images of the components (or impurities)
Author Contributions
M.Y.: methodology, formal analysis, investigation, writing—original draft; W.W.: conceptualization; W.L.: formal analysis; H.Y.: validation; T.S.: writing—review and editing; H.Z.: methodology; D.C.: supervision and project administration. All authors have read and agreed to the published version of the manuscript.
Funding
This research received no external funding.
Institutional Review Board Statement
Not applicable.
Informed Consent Statement
Not applicable.
Data Availability Statement
All data generated or analyzed during this study are included in the published article.
Conflicts of Interest
The authors declare no conflict of interest.
References
- Arsic, B.; Barber, J.; Cikoš, A.; Mladenovic, M.; Stankovic, N.; Novak, P. 16-membered macrolide antibiotics: A review. Int. J. Antimicrob. Agents 2018, 51, 283–298. [Google Scholar] [CrossRef] [PubMed]
- Cong, L.; Piepersberg, W. Cloning and characterization of genes encoded in dTDP-D-mycaminose biosynthetic pathway from a midecamycin- producing strain, Streptomyces mycarofaciens. Acta Biochim. Biophys. Sin. 2007, 39, 187–193. [Google Scholar] [CrossRef] [PubMed]
- Cui, W.; Ma, S. Recent advances in the field of 16-membered macrolide antibiotics. Mini-Rev. Med. Chem. 2011, 11, 1009–1018. [Google Scholar] [CrossRef] [PubMed]
- Schlegel, L.; Merad, B.; Rostane, H.; Broc, V.; Bouvet, A. In vitro activity of midecamycin diacetate, a 16-membered macrolide, against Streptococcus pyogenes isolated in France, 1995–1999. Clin. Microbiol. Infect. 2001, 7, 362–366. [Google Scholar] [CrossRef] [PubMed]
- Wang, N.; Zhou, Y.; Zhang, H.; Liu, Y. In Vitro activities of acetylmidecamycin and other antimicrobials against human macrolide resistant Mycoplasma pneumoniae isolates. J. Antimicrob. Chemother. 2020, 75, 1513–1517. [Google Scholar] [CrossRef] [PubMed]
- Zhu, X.; Xu, J.; Duan, X.; Lu, L.; Zhang, K.; Gao, Y.; Dong, L.; Sun, H. Facile fabrication of three-dimensional graphene microspheres using-cyclodextrin aggregates as substrates and their application for midecamycin sensing. RSC Adv. 2015, 5, 77469–77477. [Google Scholar] [CrossRef]
- Q3A. Impurities. 2020. Available online: https://www.ich.org/page/quality-guidelines (accessed on 18 February 2020).
- The Ministry of Health, Labour and Welfare. The Japanese Pharmacopoeia, 17th ed.; JP18; The Ministry of Health, Labour and Welfare: Chiyoda-ku, Japan, 2021.
- Commissioner of the Korea Food and Drug Administration. Korea Pharmacopoeia, 10th ed.; Ministry of Food and Drug Safety: Cheongju-si, Korea, 2012.
- Wang, J.; Liu, G.; Zhu, B.; Tang, L. Universal quantification method of degradation impurities in 16-membered macrolides using HPLC-CAD and study on source of the impurities. J. Pharm. Biomed. Anal. 2020, 184, 113170–113179. [Google Scholar] [CrossRef] [PubMed]
- Trott, O.; Olson, A.J. AutoDock Vina: Improving the speed and accuracy of docking with a new scoring function, efficient optimization, and multithreading. J Comput. Chem. 2010, 31, 455–461. [Google Scholar] [CrossRef] [PubMed]
- Golkar, T.; Zieliński, M.; Berghuis, A.M. Look and outlook on enzyme-mediated macrolide resistance. Front. Microbiol. 2018, 9, 1942. [Google Scholar] [CrossRef]
- Hansen, J.L.; Ippolito, J.A.; Ban, N.; Nissen, P.; Moore, P.B.; Steitz, T.A. The structures of four macrolide antibiotics bound to the large ribosomal subunit. Mol. Cell 2002, 10, 117–128. [Google Scholar] [CrossRef]
- Artsimovitch, I.; Seddon, J.; Sears, P. Fidaxomicin is an inhibitor of the initiation of bacterial RNA synthesis. Clin. Infect Dis. 2012, 55 (Suppl. 2), S127–S131. [Google Scholar] [CrossRef] [PubMed]
- Sanner, M.F. Python: A programming language for software integration and development. J. Mol. Graph. Model. 1999, 17, 57–61. [Google Scholar] [PubMed]
- Morris, G.M.; Huey, R.; Lindstrom, W.; Sanner, M.F.; Belew, R.K.; Goodsell, D.S.; Olson, A.J. AutoDock4 and AutoDockTools4: Automated docking with selective receptor flexibility. J Comput. Chem. 2009, 30, 2785–2791. [Google Scholar] [CrossRef] [PubMed]
- Liu, G.; Zhu, B.; Ren, X.; Wang, J. Universal response method for the quantitative analysis of multi-components in josamycin and midecamycin using liquid chromatography coupled with charged aerosol detector. J. Pharm. Biomed. Anal. 2021, 192, 113679. [Google Scholar] [CrossRef] [PubMed]
- Liu, G.; Zhu, B.; Ren, X.; Wang, J. Characterization of 28 unknown impurities in 16-membered macrolides by liquid chromatography coupled with ion trap/time-of-flight mass spectrometry. J. Pharm. Biomed. Anal. 2020, 186, 113324. [Google Scholar] [CrossRef] [PubMed]
- Zhang, X.; Li, J.; Wang, C.; Song, D.; Hu, C. Identification of impurities in macrolides by liquid chromatography-mass spectrometric detection and prediction of retention times of impurities by constructing quantitative structure-retention relationship (QSRR). J. Pharm. Biomed. Anal. 2017, 145, 262–272. [Google Scholar] [CrossRef] [PubMed]


Publisher’s Note: MDPI stays neutral with regard to jurisdictional claims in published maps and institutional affiliations. |
© 2022 by the authors. Licensee MDPI, Basel, Switzerland. This article is an open access article distributed under the terms and conditions of the Creative Commons Attribution (CC BY) license (https://creativecommons.org/licenses/by/4.0/).