Article

Evaluation of the Base Stability of Hydrophilic Interaction Chromatography Columns Packed with Silica or Ethylene-Bridged Hybrid Particles

Waters Corporation, Milford, MA 01757, USA
*
Author to whom correspondence should be addressed.
Separations 2022, 9(6), 146; https://doi.org/10.3390/separations9060146
Submission received: 23 May 2022 / Revised: 1 June 2022 / Accepted: 6 June 2022 / Published: 8 June 2022
(This article belongs to the Section Chromatographic Separations)

Abstract

:
Stability as a function of mobile phase pH is an important consideration when selecting a chromatographic column. While the pH stability of reversed-phase columns is widely studied, there are relatively few reports of the stability of hydrophilic interaction chromatography (HILIC) columns. We evaluated the stability of silica and ethylene-bridged hybrid HILIC columns when used with mobile phases containing basic buffers. The predominant mode of column degradation observed in our studies was a decrease in efficiency due to voiding, resulting from the hydrolysis of the silica particles. Associated with this were increases in tailing factors. Retention factor changes were also noted but were smaller than the efficiency losses. The dependence of the rate of efficiency decrease on the key variables of temperature, mobile phase pH and water content were studied for an unbonded silica column. The effect of the acetonitrile concentration on the pH of the mixed aqueous/acetonitrile mobile phases was also investigated. Using conditions found to cause a 50% decrease in efficiency after approximately five hours of exposure to the basic solution, we evaluated eight different commercially available HILIC columns containing silica or ethylene-bridged hybrid particles. The results show large differences between the stability of the silica and ethylene-bridged hybrid particle stationary phases, with the latter exhibiting greater stability.

1. Introduction

Hydrophilic Interaction Chromatography (HILIC) is a valuable approach for separating polar compounds because it is characterized by retention that increases with increasing analyte polarity [1,2]. HILIC is carried out using a polar stationary phase and a less polar organic/aqueous mobile phase [1]. A variety of HILIC stationary phases are commercially available, including materials based on silica, organic polymer and hybrid organic/inorganic particles [3,4]. Other materials, including carbon [5,6,7] and aluminosilicates [8], are also investigated for HILIC. Among these, silica-based columns, particularly those containing unbonded silica, are the most widely referenced [9]. While silica particles generally have excellent mechanical strength, allowing them to be packed to form efficient and rugged columns, they suffer from a limited pH range due to the hydrolysis of silica in basic solutions [10]. The hydrolysis of silica results in the formation of silicic acid (Si(OH)4), which may polymerize to form oligomers. These hydrolysis products dissolve in the mobile phase and elute from the column. As the mass loss progresses, the packed bed structure becomes compromised and voids form, resulting in a large decrease in efficiency [11]. The hydrolysis products may be observed as column bleed when using evaporative light scattering, charged aerosol or electrospray ionization mass spectrometry detectors [12,13,14,15]. Retention time changes have also been reported [8,16,17]. These issues make it difficult when using silica-based columns to realize the benefits of operating with high pH mobile phases. These benefits include avoiding the degradation of acid-labile compounds, tuning separation selectivity, increasing detection sensitivity and optimizing peak shapes [18,19,20,21,22].
While many silica-based HILIC columns are recommended by their manufacturers for use up to pH 8, it has been shown that column degradation may occur at much lower pH values. For example, in a study carried out for an unbonded silica column using a mobile phase containing a pH 5 ammonium acetate buffer with a gradient from 5.45 to 50.50% water, the column showed significant efficiency losses after only 33.3 h [23]. In a study involving an unbonded silica column and an isocratic separation with a 75/25 v/v acetonitrile/25 mM ammonium acetate ( p w w H 6.8) (aq) mobile phase at room temperature, a 12% increase in retention time was observed for a positively charged compound after only 30 h [16].
A number of variables have been shown to affect the rate of column degradation at high pH in studies of reversed-phase (RP) columns. In addition to buffer pH, these variables include temperature, the type and concentration of the organic solvent and the chemical identity and concentration of the buffer [24,25,26]. An important consideration not mentioned in these studies is that the addition of an organic solvent to an aqueous buffer significantly changes the pH due to shifts in the pKa of the buffer species, which arise from the lowering of the dielectric constant of the solution [27]. The implications of these shifts for understanding the retention of ionizable compounds in reversed-phase chromatography and HILIC have been described by Rosés and coworkers [28,29,30,31,32,33,34]. As an example of the magnitude of the effect, an ammonium acetate buffer measured as pH 4.0 in water gave a pH of 7.0 in a solution containing 95% acetonitrile [34]. Since the pH shifts increase with increasing organic solvent concentration, the effects are usually more significant in HILIC than in RP separations.
Here, we describe the development of an accelerated base stability test for HILIC columns. We evaluated the effect of mobile phase water content, buffer pH and temperature on the stability of an unbonded silica column. Our goal was to identify test conditions that cause >50 % efficiency loss after ca. 5 h of exposure to the basic solution. Using these conditions, we then compared the stability of eight different HILIC columns, including unbonded silica, unbonded ethylene-bridged hybrid (BEH) and surface-modified silica and BEH™ stationary phases. BEH particles have previously been shown to exhibit improved base stability vs. silica particles under reversed-phase conditions [35].

2. Materials and Methods

2.1. Chemicals

LC-MS grade acetonitrile (ACN) was obtained from Fisher Scientific (Hampton, NH, USA). Ammonium formate (AF), ammonium acetate (AA), ammonium bicarbonate (AmBic), acetic acid, ammonium hydroxide, formic acid and all test compounds were sourced from Millipore-Sigma (Burlington, MA, USA). Deionized water was produced using a Millipore Milli-Q™ system (Burlington, MA, USA).

2.2. Instrumentation and Columns

All chromatographic evaluations were performed using ACQUITY™ UPLC™ H-Class or Arc Systems equipped with ACQUITY photodiode array detectors (Waters Corporation, Milford, MA, USA). ACQUITY UPLC BEH Amide (1.7 µm, 2.1 × 50 mm), BEH HILIC (1.7 µm, 2.1 × 50 mm), Atlantis™ HILIC (3 µm, 2.1 × 50 mm) and CORTECS™ HILIC (1.6 µm, 2.1 × 50 mm) columns were obtained from Waters Corporation (Milford, MA, USA). Ascentis™ Si (3.0 μm, 2.1 × 50 mm), TSKgel™ Amide-80 (2.0 μm, 2.0 × 50 mm) and SeQuant™ ZIC™-HILIC 100 Å columns (3.5 μm, 2.1 × 50 mm) were purchased from Sigma-Aldrich (Saint Louis, MO, USA) and Accucore™ HILIC columns (2.6 μm, 2.1 × 50 mm) were from Thermo Fisher (West Palm Beach, FL, USA). An Orion™ Versa Star Pro™ advanced electrochemistry meter from Thermo Fisher (West Palm Beach, FL, USA) was used for pH measurements.

2.3. Sample and Mobile Phase Preparation

The sample used for the tests investigating the effects of pH, water content and temperature contained acenaphthene as the hold-up time marker (25 μg/mL), adenine (25 μg/mL), cytosine (50 μg/mL) and sodium p-toluene sulfonate (TS) (400 μg/mL) dissolved in 80/20 v/v ACN/water. The sample used for the column comparisons contained acenaphthene (19 μg/mL), thymine (3.7 μg/mL), adenine (3.7 μg/mL) and cytosine (7.7 μg/mL) dissolved in 90/10 v/v ACN/water.
The pH values of the buffer solutions were determined as aqueous solutions, with the pH meter calibrated using aqueous reference buffers, designated as p w w H values. The p w w H 3.00 AF buffer was prepared by dissolving AF in water to give a concentration of 100 mM, then adding formic acid to adjust the pH. The p w w H 5.60 AA buffer was prepared by dissolving AA in water to give a concentration of 100 mM, with acetic acid added to adjust the pH. The p w w H 7.80 AmBic buffer was prepared by dissolving AmBic in water to give a 100 mM solution. The p w w H 11.00 and 11.30 AmBic buffers were prepared by dissolving AmBic in water to give a concentration of 100 mM, then adding 30% ammonium hydroxide to adjust the pH.
The challenge solutions were made by premixing acetonitrile, water and a 100 mM aqueous buffer in different ratios. For each composition, the final buffer concentration was 10 mM. We measured the pH values of these mixtures, with the pH meter calibrated using aqueous reference buffers, designated as p w s H values.

2.4. Method Details

The accelerated base stability tests were carried out using the gradient program shown in Table 1. One microliter of a sample containing acenaphthene (the hold-up time marker), cytosine, adenine and TS or thymine was separated using a 95/5 v/v acetonitrile/100 mM AF p w w H 3.00 (aq) mobile phase at a flow rate of 0.4 mL/min with UV absorbance detection (254 nm). A challenge solution of varying composition was then passed through the column at 0.4 mL/min for 20.57 min (75 column volumes), followed by washing with 50/50 v/v and 90/10 v/v acetonitrile/water, then equilibrating with the 95/5 v/v acetonitrile/100 mM AF p w w H 3.00 (aq) test mobile phase (all at 0.4 mL/min). This cycle was generally repeated until the column showed efficiency losses greater than 50%. The column temperature was maintained at 70 °C unless noted otherwise. The USP efficiencies, USP tailing factors and retention factors of the compounds were determined vs. the time exposed to the challenge solution. For the experiments involving different water concentrations, pH and temperatures, two CORTECS HILIC columns were tested under each condition. CORTECS HILIC columns were chosen because they showed significant changes after <15 h of contact with the challenge mobile phase. For the study of eight different stationary phases, three columns of each type were tested, and nine gradient cycles were carried out for each. For all experiments, the trends in the relative efficiency changes were found to be similar for all retained test compounds, so the average values were used. The retention factor trends were not the same for all test compounds, so these data were treated individually. For the comparison of the eight stationary phases, the results obtained for the replicate columns were averaged, and the means and standard deviations calculated.

3. Results

3.1. pH Values in Mixed Organic-Aqueous vs. Aqueous solutions

While it is common to control and report the pH value for the aqueous component of the mobile phase before adding the organic solvent, it is important to consider the pH shifts in the mixed aqueous/organic solutions. Rosés and coworkers previously reported these shifts for sodium acetate and sodium carbonate buffers, among others [28,29,30,31,32,33,34]. However, the shifts for some of the specific buffers used in our study were not reported. Consequently, we measured the p w s H values for mixtures containing the buffers that we used for the challenge solutions for varying acetonitrile concentrations. The results, given in Table 2, show that the p w s H values of the mixtures containing the p w w H 5.60 ammonium acetate and p w w H 7.80 ammonium bicarbonate buffers increased with increasing acetonitrile concentration, while the p w w H 11.00 ammonium bicarbonate buffer showed the opposite trend. The results for the ammonium acetate buffer were very similar to those previously reported for a p w w H 5.07 sodium acetate buffer [30] and the results for the p w w H 7.80 ammonium bicarbonate buffer were close to those reported for a p w w H 8.84 sodium carbonate buffer [33]. However, our results for the p w w H 11.00 ammonium bicarbonate buffer do not resemble those reported for a p w w H 10.84 sodium carbonate buffer but instead show behavior similar to that of a p w w H 9.15 ammonium hydroxide buffer [31]. This is likely because the ammonium concentration exceeds the carbonate/bicarbonate concentration in our p w w H 11.00 ammonium bicarbonate buffer, as the pH was adjusted by adding an ammonium hydroxide solution.

3.2. Stability of CORTECS HILIC Columns as a Function of Water Content

To investigate how the rate of column degradation varies with the water content of the mobile phase, CORTECS HILIC columns were tested using challenge solutions composed of acetonitrile/buffer mixtures with different water concentrations: 20, 40 or 60% v/v. For each composition, the challenge solution contained 10 mM ammonium bicarbonate p w w H 11.00, and the temperature was maintained at 70 °C. Because p w s H depends on the acetonitrile content, the p w s H of the three different compositions varied, from 10.54 in the 60% aqueous solution to 10.37 in the 40% aqueous solution and 10.11 in the 20% aqueous solution. Two columns were tested with each composition. The results are shown in Figure 1 as plots of efficiency as a % of the initial value vs. the time exposed to the challenge solution. The results show that the rate of efficiency loss increases with increasing water content. The time to 50% efficiency loss (t½) was 12.3–14.4 h for the 20% aqueous composition, 4.5–4.8 h for 40% aqueous and 1.0 h for the 60% aqueous solution.
Accompanying the decreases in efficiency, we observed large (100–400%) increases in the tailing factors of the three test compounds that occurred at the times of the steepest drops in efficiency. The largest changes were observed for the anionic compound TS, which was weakly retained on the CORTECS HILIC column, with an initial k of 0.23. The low retention makes TS particularly susceptible to the impact of voids. Because the information provided by the changes in tailing factors is redundant with the efficiency trends, we focused on the latter.
The retention factors of all three test compounds decreased with increasing exposure time, with the largest changes observed for the 60% aqueous composition (30–34% decreases at t½). Smaller changes in the retention factors were measured for the other aqueous concentrations: 5–12% decreases at t½ for 40% aqueous and 8–14% decreases at t½ for the 20% aqueous composition. The weakly retained anionic compound TS generally showed smaller relative changes in k compared to adenine and cytosine. The decreases in the retention factors did not show the abrupt declines observed for the efficiencies, except for the 60% challenge solution (see Supporting Information Figure S1).

3.3. Stability of CORTECS HILIC Columns as a Function of pH

We investigated the dependence of the rate of degradation of CORTECS HILIC columns on the pH of the challenge solution for a constant aqueous content of 40% and temperature of 70 °C. Two additional buffers were used: a p w w H   7.80   ammonium bicarbonate buffer, for which we measured a p w s H   of 8.96 in 60% acetonitrile, and a p w w H   5.60 ammonium acetate buffer, for which we measured a p w s H   of 6.99 in 60% acetonitrile. Two columns were tested with each challenge solution. The results shown in Figure 2 demonstrate that the rate of efficiency loss decreased with decreasing pH. For the p w s H   10.37 mobile phase (containing a p w w H 11.00 buffer) t½ was 4.5–4.8 h. The t½ values were 4.8–5.5 h for the p w s H   8.96 mobile phase (containing a p w w H 7.80 buffer) and 10.3–12.3 h for the p w s H   6.99 mobile phase (containing a p w w H 5.60 buffer). For all pH values, the retention factors of adenine and cytosine decreased with increasing exposure time, with the relative changes at t½ ranging from 10 to 13% for adenine and 6 to 7% for cytosine (see Supporting Information Figure S2). No change or a small increase was observed for the retention factor of TS.

3.4. Stability of CORTECS HILIC Columns as a Function of Temperature

To study the dependence of the rate of degradation on temperature, we tested CORTECS HILIC columns using temperatures ranging from 30 to 70 °C. For these experiments, we used a p w s H   10.37 challenge solution with an aqueous content of 40% and a p w w H 11.00 ammonium bicarbonate buffer. Two columns were evaluated at each temperature. The results shown in Figure 3 demonstrate that the rate of efficiency loss decreased with decreasing temperature. The t½ values increased from 4.5–4.8 h at 70 °C to 5.8 h at 50 °C and 6.2–6.5 h at 30 °C. For all three temperatures, the retention factors of adenine decreased with increasing exposure time, with the relative changes at t½ ranging from 10 to 15%. In the experiments at 30 °C and 50 °C, the retention factors for cytosine and TS increased from the first to the second injection by 5 to 8%, then slowly decreased to end up close to the initial values (see Supporting Information Figure S3).

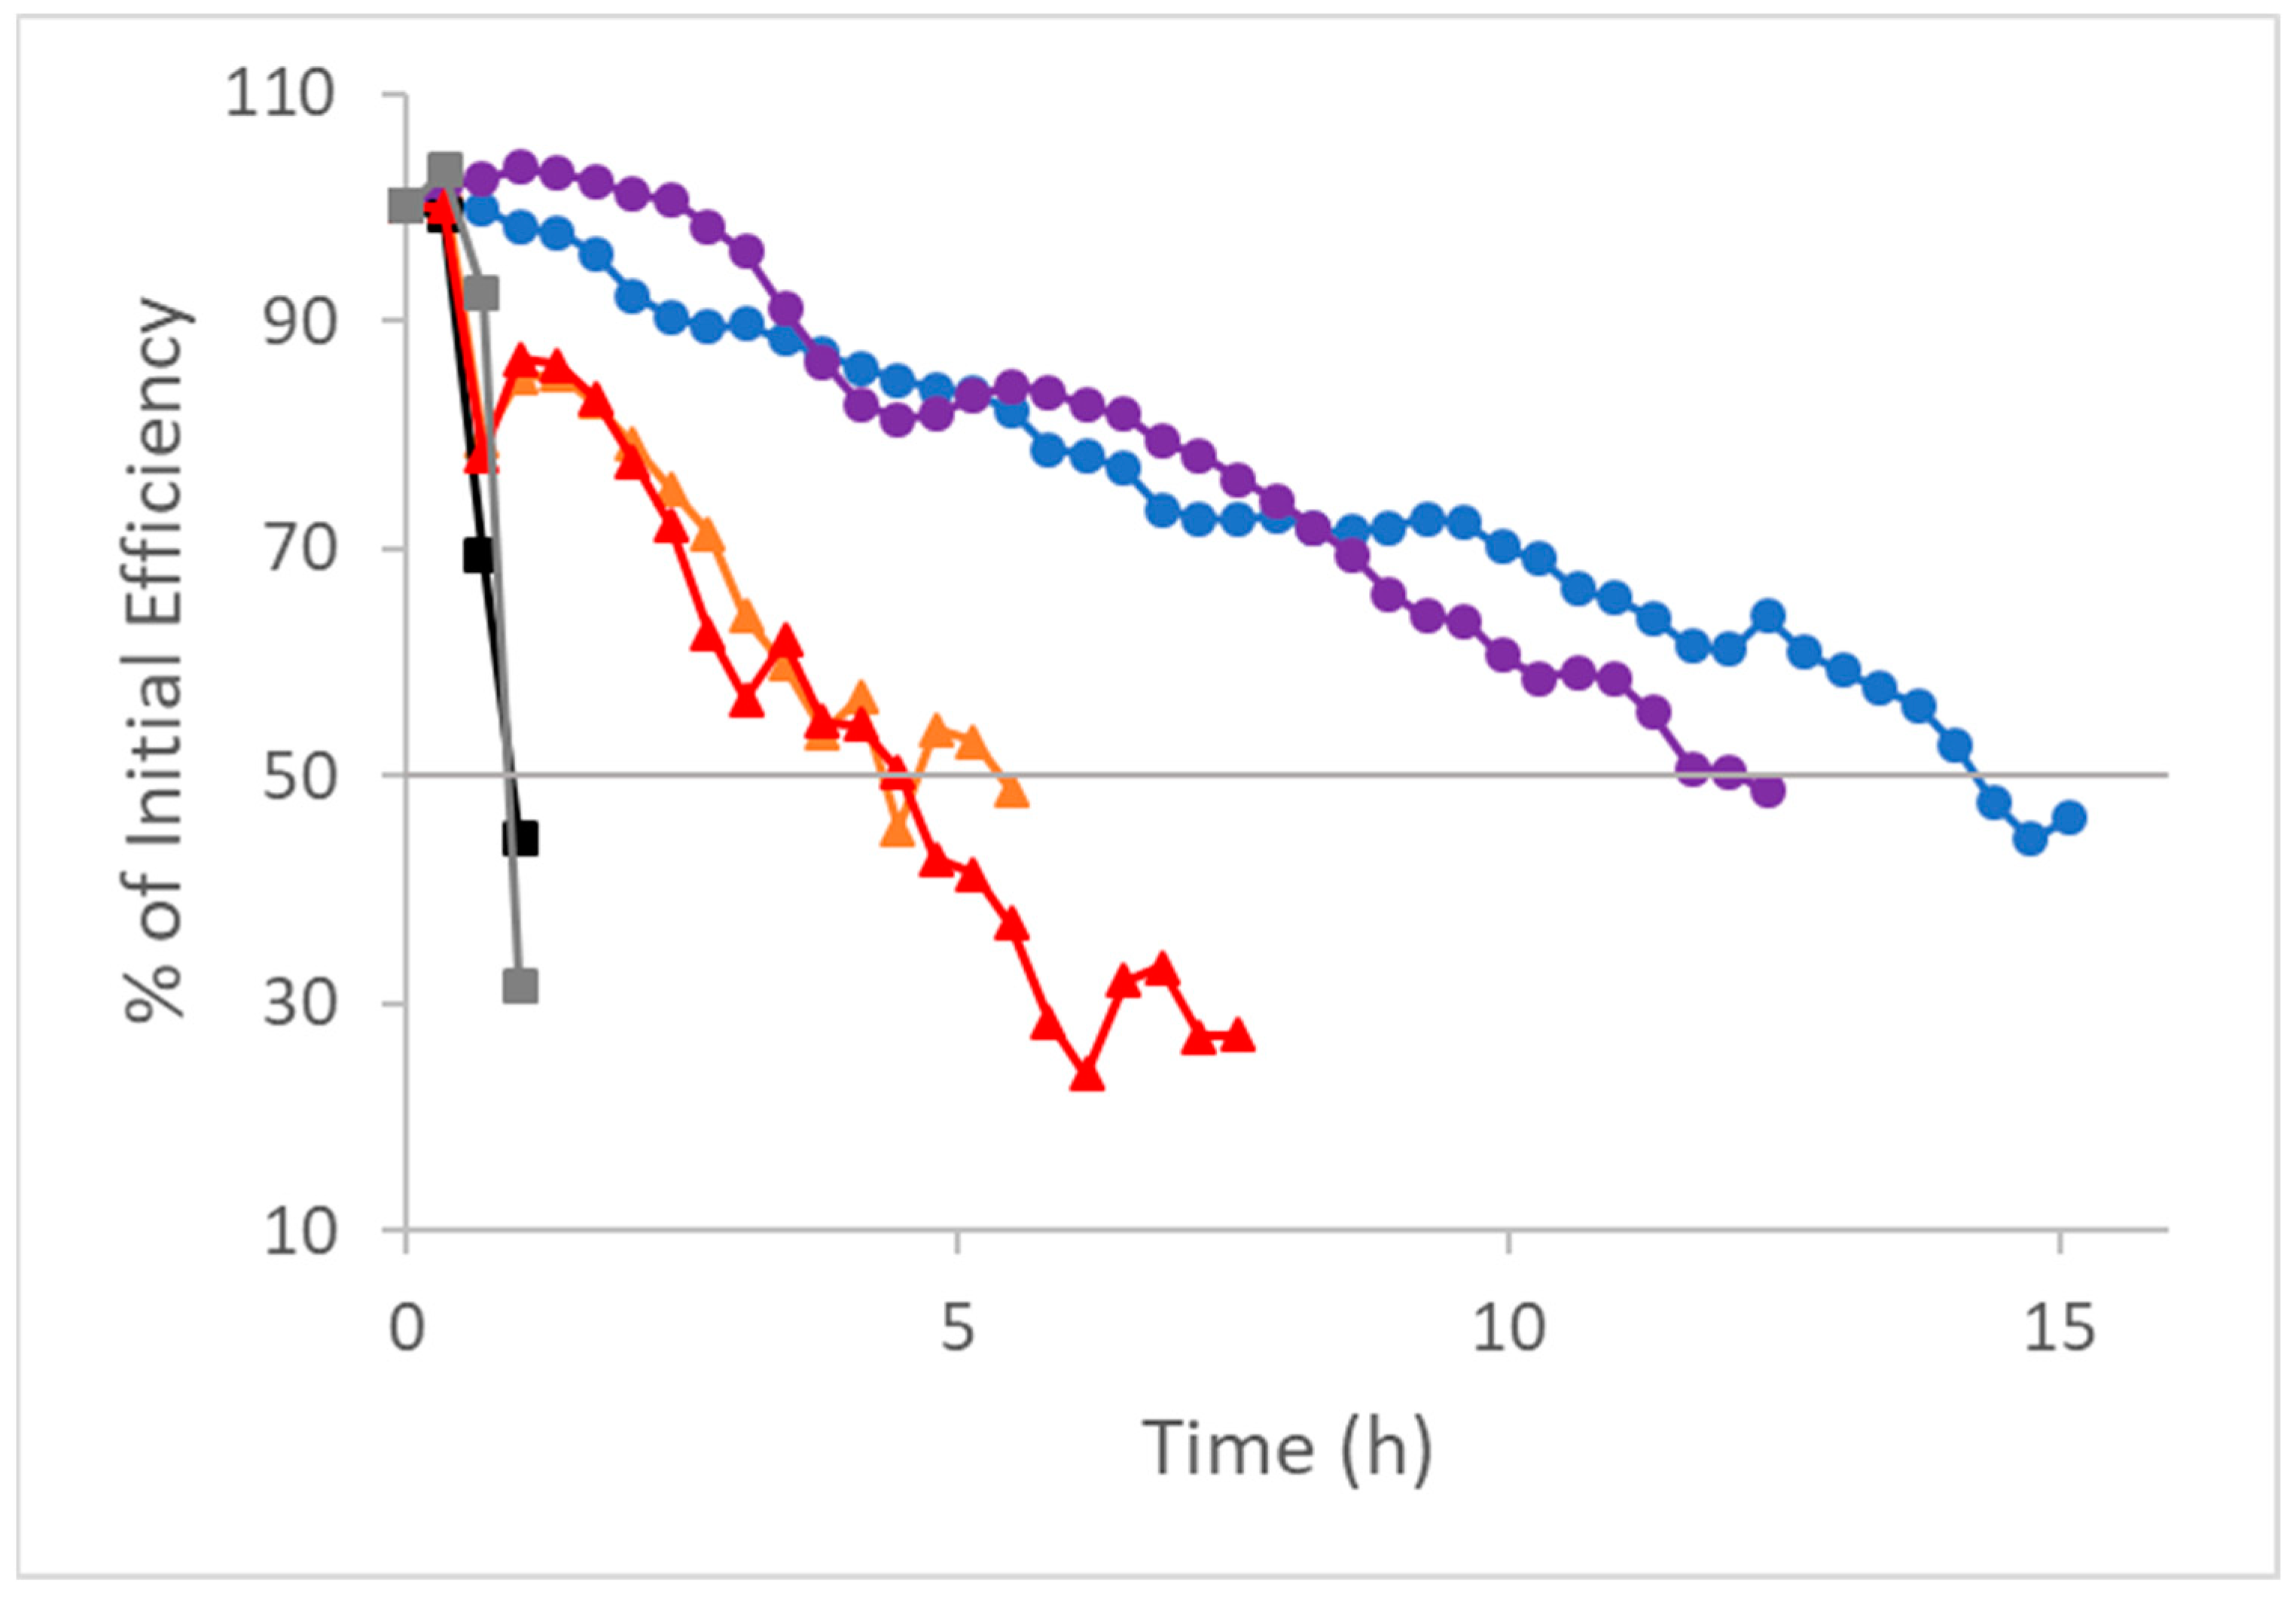
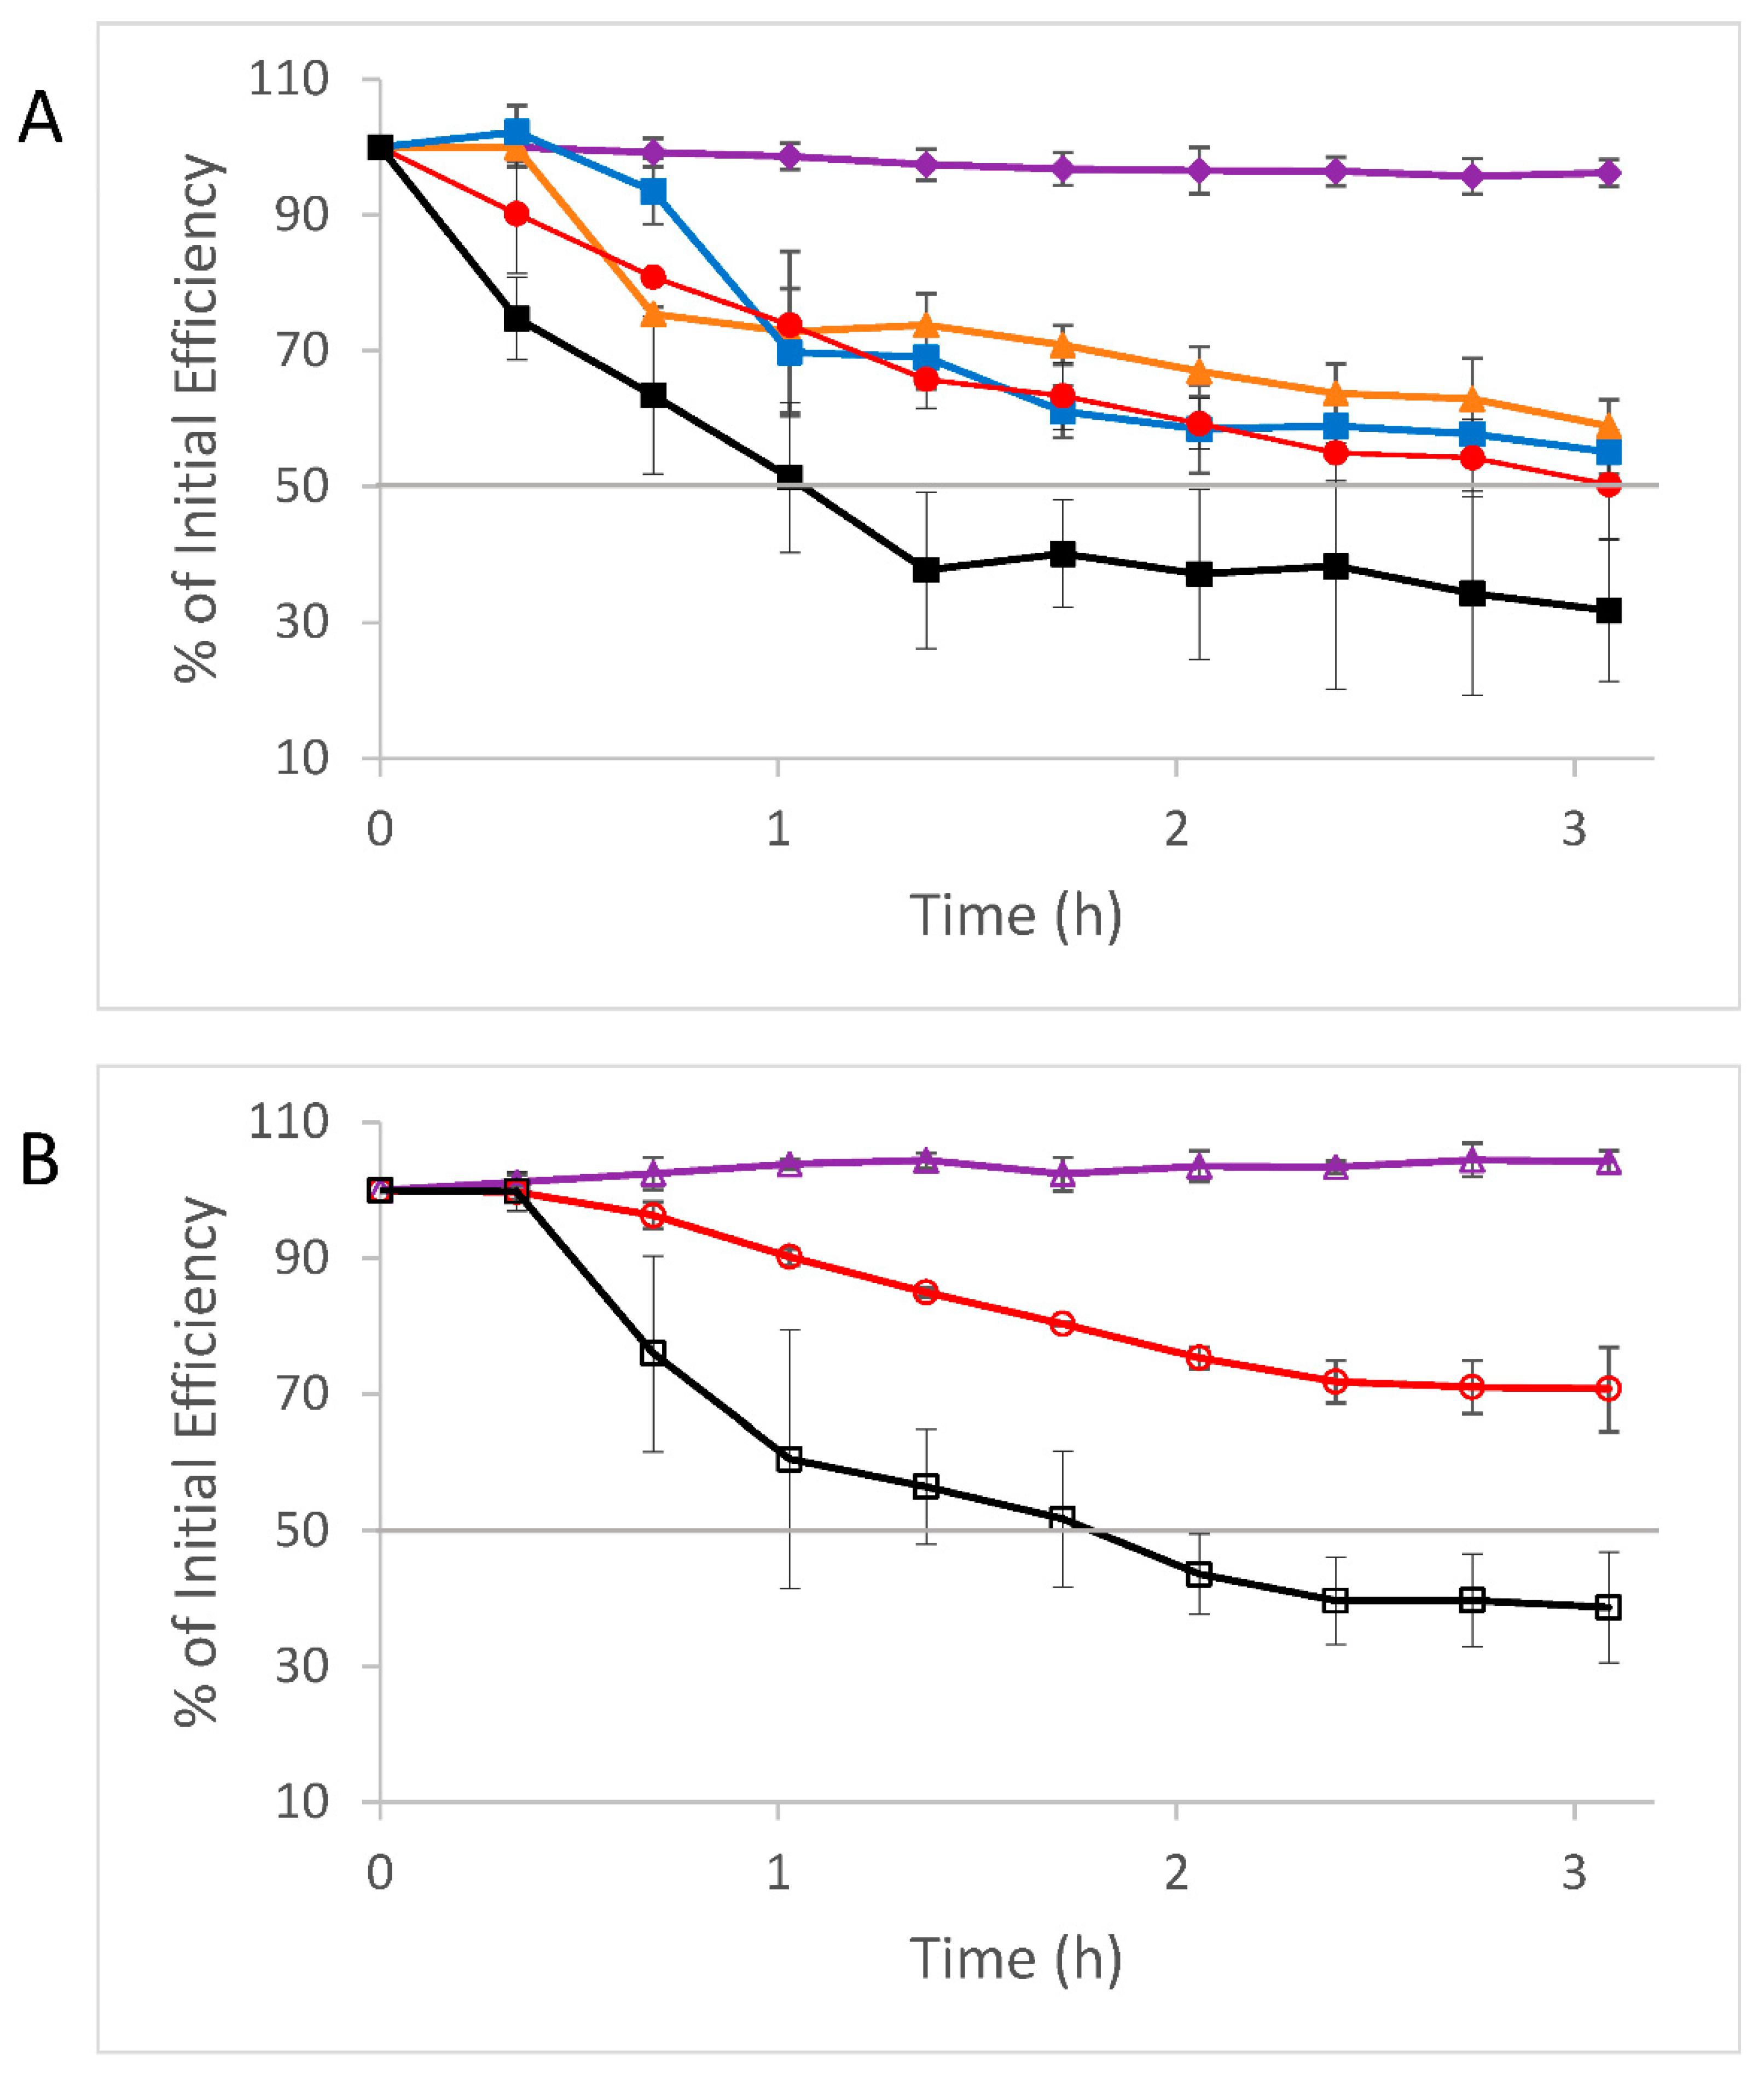
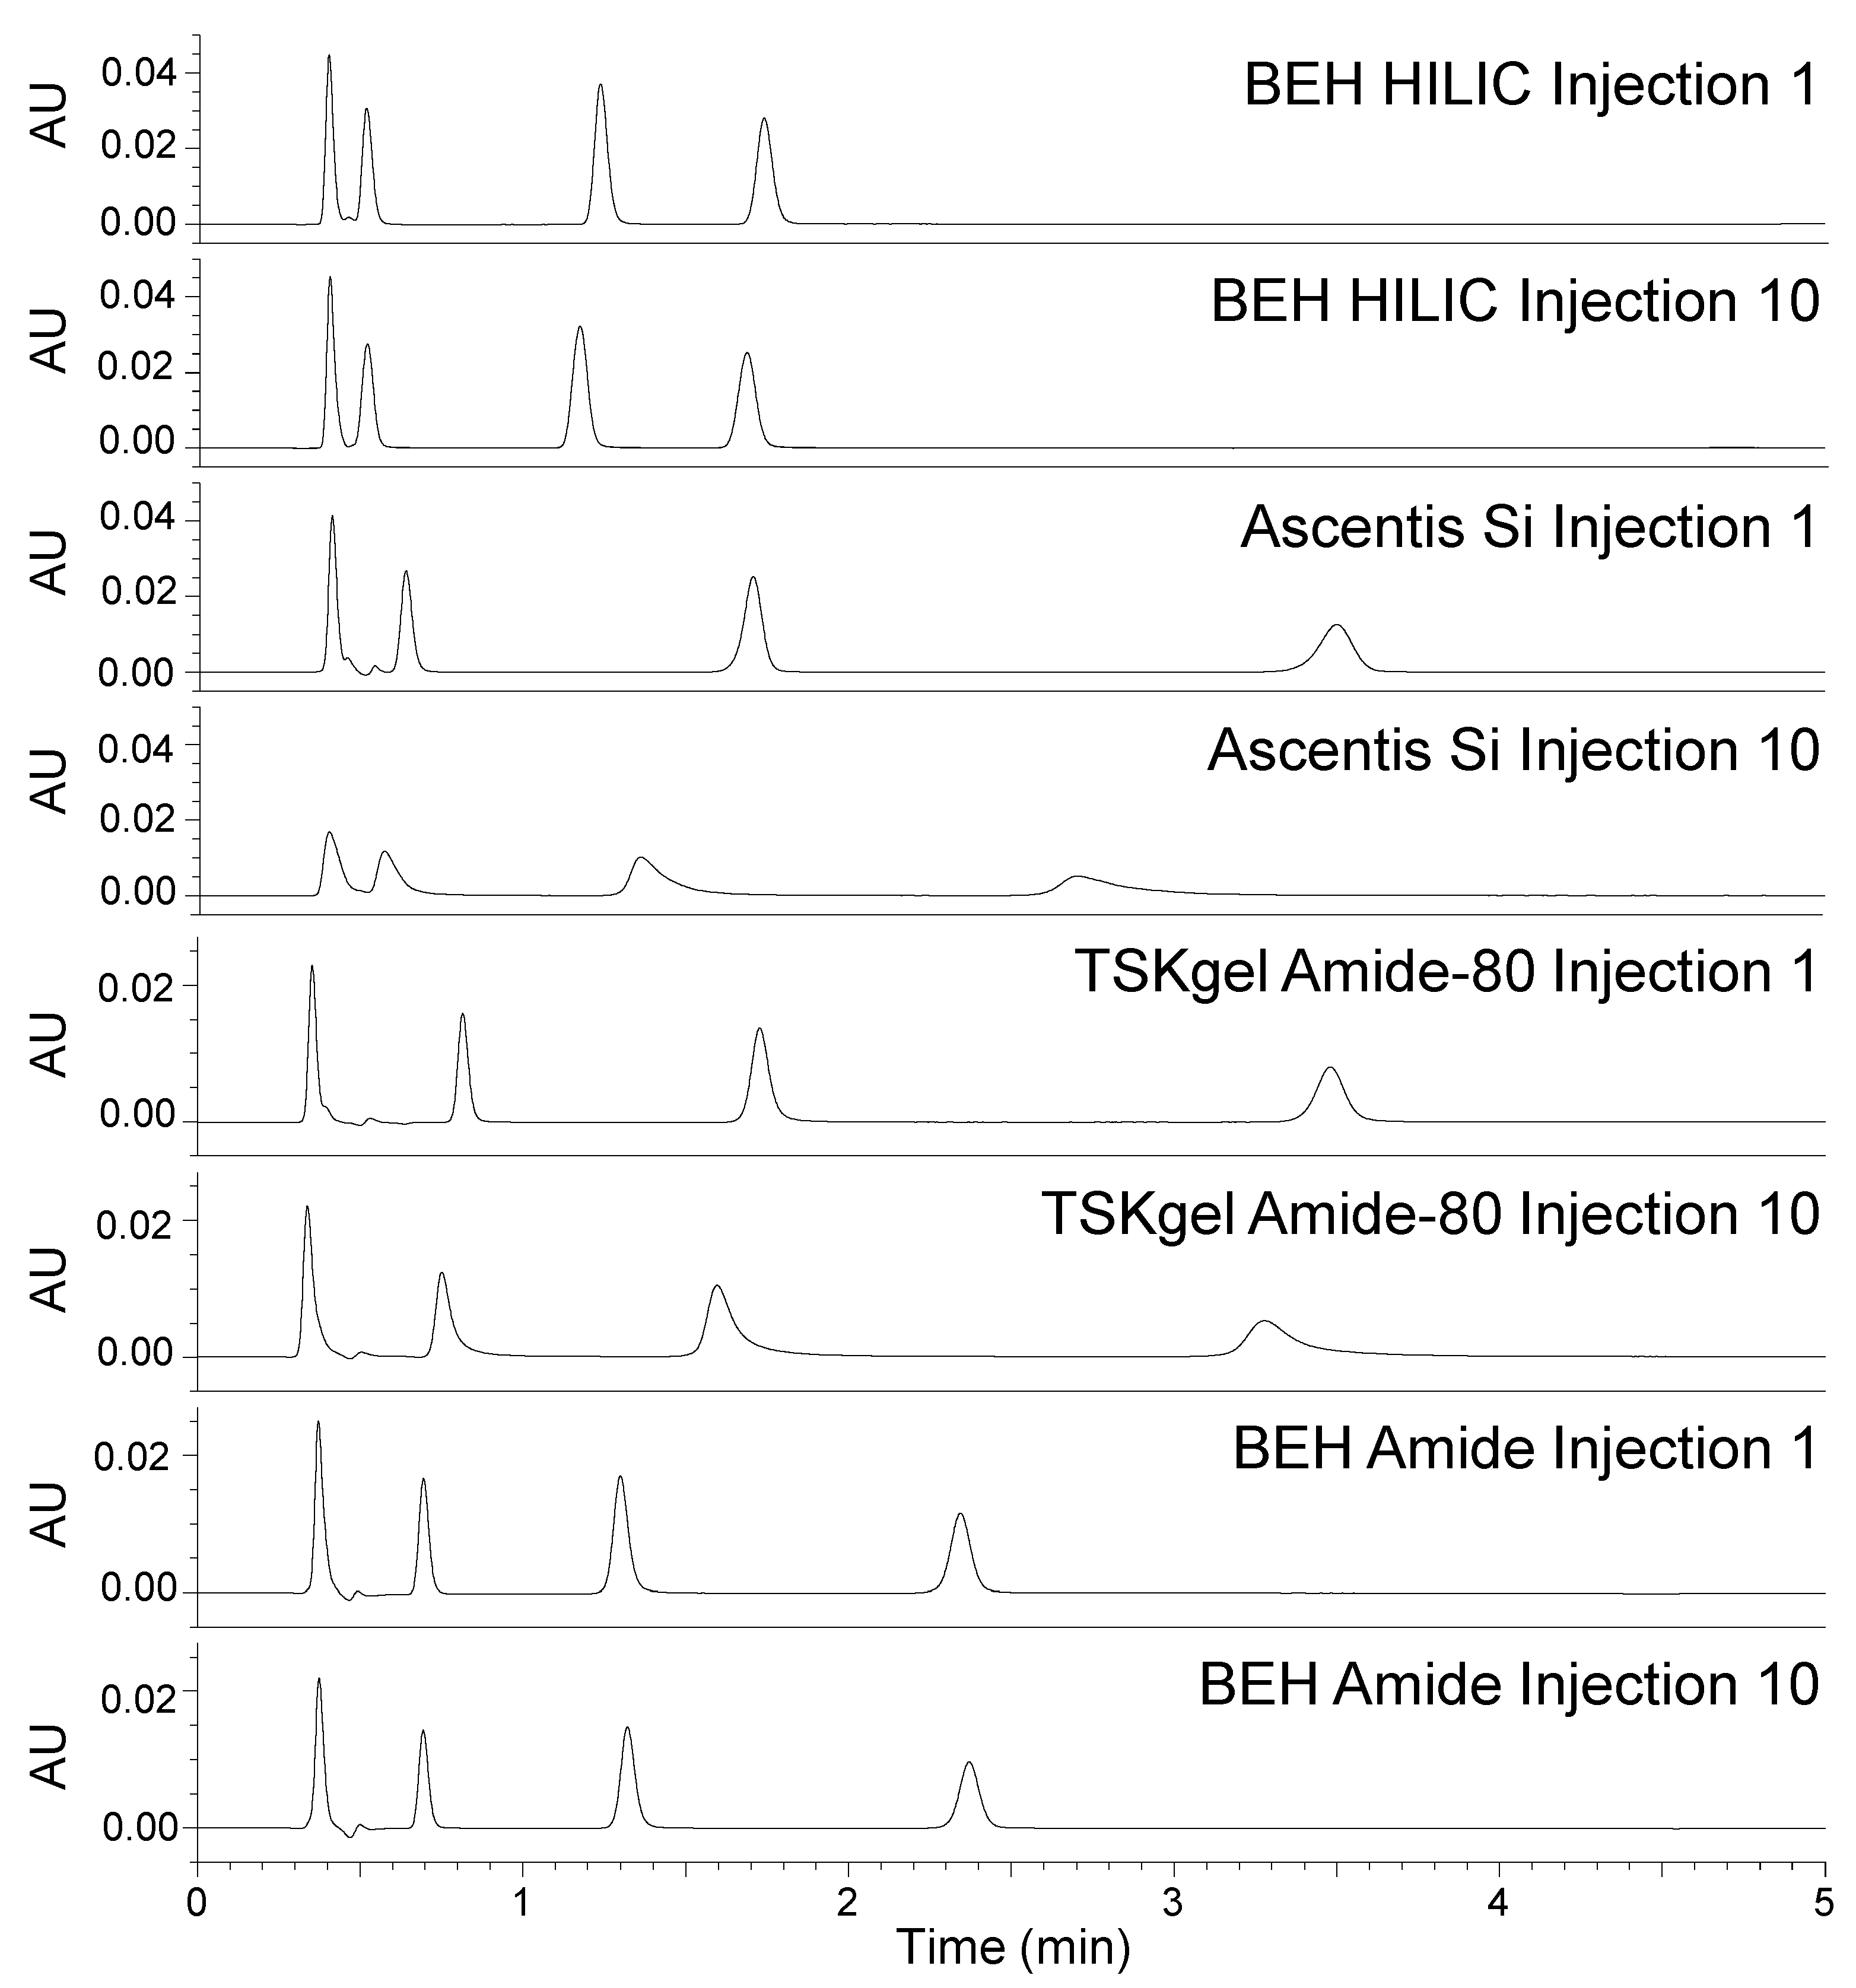
3.5. Stability Comparison of Silica and Ethylene-Bridged Hybrid Columns

We chose a temperature of 70 °C and a p w s H   10.87 challenge solution containing 40% of an aqueous p w w H 11.30 ammonium bicarbonate buffer to evaluate the stability of HILIC columns packed with eight different stationary phases. The properties of the stationary phases are summarized in Table 3. Five of them were unbonded silica or BEH particles, and three were surface modified. Two of the silicas had a solid-core morphology, while the other six materials were fully porous. For each stationary phase, three columns were tested.
The relative efficiency trends for the five unbonded materials are displayed in Figure 4A. Three of the silica column brands (Accucore HILIC, Atlantis HILIC and CORTECS HILIC) showed similar rates of efficiency loss, with decreases of 41 to 50% after 3.09 h of exposure to the high pH solution. The Ascentis Si columns showed an average efficiency loss of 68% after 3.09 h, while the BEH HILIC columns exhibited an average loss of only 3.8%. Initial and final chromatograms for the Ascentis Si and BEH HILIC columns are shown in Figure 5.
The results for the three surface-modified stationary phases are shown in Figure 4B. The silica-based TSKgel Amide-80 columns showed an average efficiency loss of 61% after 3.09 h of exposure to the high pH solution, similar to that of the Ascentis Si columns. The ZIC-HILIC columns showed a smaller average efficiency loss of 29% after 3.09 h. In contrast, the BEH Amide columns exhibited an average increase in efficiency of 4.2% after 3.09 h. The latter result is similar to that recently reported for a sulfobetaine stationary phase based on BEH particles using the same test conditions but extended to 34 h of contact with the challenge solution [36]. Initial and final chromatograms for the TSKgel Amide-80 and BEH Amide columns are shown in Figure 5.
In addition to changes in efficiency, we also observed retention factor changes during these experiments. The relative changes after 3.09 h of exposure to the high pH solution are summarized in Table 4. The retention factor changes are shown as a function of time in Supporting Information Figures S4–S6. The relative changes in retention factor were generally smaller than the relative changes in efficiency. A rough correlation was observed between these responses, with the stationary phase that showed the largest relative efficiency losses (Ascentis Si) also exhibiting the largest relative decreases in retention factor. Conversely, the material that gave the smallest relative changes in efficiency (BEH Amide) exhibited the smallest relative changes in retention factor.

4. Discussion

We observed that the primary failure mode resulting from the exposure of silica-based HILIC columns to basic mobile phases is a loss of column efficiency and an associated increase in peak tailing. Previous studies of silica-based reversed-phase columns have shown that this is due to the hydrolysis of the silica particles, which involves the formation of silicic acid and removal of this hydrolysis product in the mobile phase [24,25,26]. This causes the packed bed to shift, forming voids. It is these voids that cause the loss of column efficiency and increased tailing. We observed visible voids at the inlet ends of the packed beds when we removed the end fittings from many of the columns after completing our stability tests (see example in Supporting Information Figure S7). The observed retention decreases were likely caused by the loss of surface area due to Ostwald ripening [37] and/or because of the loss of particle mass. In a few cases, we observed slight increases in retention factors. This may be explained by the formation of additional silanol groups due to the hydrolysis of siloxane bonds in the particles [16]. For the surface-modified stationary phases, loss of the attached groups may also result in retention changes.
Water concentration, pH and temperature were all shown to affect the rate of efficiency loss, with higher values of each causing a shorter time to column failure, as measured by t½. Within the ranges investigated, the largest effects were seen when varying the water concentration and pH. The dependence on water concentration is more consequential for HILIC than for RP separations because typical HILIC mobile phases have lower water concentrations. Methods employing basic mobile phases with water concentrations less than approximately 20% are expected to show relatively slow degradation. However, faster degradation is likely in protocols that involve basic mobile phases with higher water concentrations, such as in gradient methods used to separate compounds covering a wide range of polarities. An important example of such methods is polar metabolomics studies, where gradients increasing to 80 to 90% water are common [19,20,21,22].
Regarding the dependence on pH, our results suggest that the p w s H values need to be considered. Prior studies of the aqueous solubility of amorphous silica as a function of pH show relatively constant solubility from pH 1–8, then a dramatic increase at higher values [10]. Thus, it initially seemed surprising that silica columns showed significant degradation with aqueous/organic mobile phases containing buffers with p w w H   values as low as 5 [23]. However, when taking into account the shifts caused by adding high concentrations of acetonitrile to the aqueous buffer, these observations are more understandable. With common buffers such as formate and acetate, the p w s H values may be higher than the p w w H by 1 to 2 units in solutions containing 50 to 80% acetonitrile.
When considering the recommended pH ranges for columns, it is important to know whether they refer to p w w H or p w s H values. Comparing our stability results to the pH ranges recommended by the column manufacturers (see Table 3), it appears that different approaches have been used. Thus, while the recommended range for Accucore HILIC columns extends to pH 8, the stability of these columns was found to be very similar to that of CORTECS HILIC columns, which have a recommended limit of pH 5. Similarly, TSKgel Amide-80 and SeQuant ZIC-HILIC columns have recommended upper pH limits of 7.5 and 8, respectively, yet our results show they have similar base stability as CORTECS HILIC columns.
In comparing the base stability of the different HILIC stationary phases, several factors appear to explain the results. The most dramatic differences were seen for the BEH-based stationary phases compared to those based on silica, with the former having much greater stability. This is consistent with previous results obtained under RP conditions [35]. For silica-based stationary phases, the specific surface area is likely an important variable, as suggested by the relatively fast changes observed for the Ascentis Si and TSKgel Amide-80 columns, which are based on particles with reported surface areas of 450 m2/g. Because the hydrolysis reaction occurs at the surface of the particles, the rate of degradation increases with increasing surface area [38].
Surface modification of silica particles is known to decrease the rate of particle hydrolysis, with the decrease dependent on the coverage of the bonded groups [13,14,16,25,26]. Higher bonding coverages tend to better protect the underlying particles from hydrolysis. We found smaller retention factor changes for BEH Amide columns compared to BEH HILIC columns, which likely is due to the protection of the BEH particle surface by the amide groups, which are present at a relatively high surface concentration of 7.5 μmol/m2. Further work is needed to determine how high the bonding coverage needs to be to decrease the rate of high pH degradation of columns packed with silica-based stationary phases.

5. Conclusions

These results demonstrate that typical silica-based HILIC stationary phases are hydrolyzed when exposed to basic mobile phases containing 20% or higher concentrations of water. This results in large decreases in column efficiency and increases in tailing factors as a result of the formation of voids. Smaller changes in retention factors were also observed. The time to loss of 50% of the initial efficiency (t½) was shown to be affected by the water content and pH of the mobile phase, as well as by column temperature, with an increase in each of these resulting in shorter t½ values.
Using a p w s H 10.87 mobile phase containing 60/40 v/v acetonitrile/ p w w H 11.30 ammonium bicarbonate (aq) and a temperature of 70 °C, we found t½ values of approximately 1–5 h for several silica-based HILIC columns. Stationary phases made from the highest surface area silicas (450 m2/g) showed the fastest rates of efficiency loss, followed by those made from lower surface area silicas (100–330 m2/g). Columns containing stationary phases based on BEH particles showed very little degradation under these conditions. These results support the use of BEH-based HILIC columns for methods involving basic mobile phases, particularly when the water content is greater than approximately 20%.

Supplementary Materials

The following supporting information can be downloaded at: https://www.mdpi.com/article/10.3390/separations9060146/s1. Figure S1: Effect of the water concentration of the challenge solution on retention factor stability for CORTECS HILIC columns; Figure S2: Effect of the pH of the challenge solution on retention factor stability for CORTECS HILIC columns; Figure S3: Effect of temperature on retention factor stability for CORTECS HILIC columns; Figure S4: Retention factor stability for three unbonded silica or BEH columns exposed to p w s H 10.87 60/40 ACN/AmBic (aq) at 70 °C; Figure S5: Retention factor stability for two unbonded solid-core silica columns exposed to p w s H 10.87 60/40 ACN/AmBic (aq) at 70 °C; Figure S6: Retention factor stability for three bonded silica or BEH columns exposed to p w s H 10.87 60/40 ACN/AmBic (aq) at 70 °C; Figure S7: Photographs of the inlet ends of the packed beds for two columns after base stability evaluation.

Author Contributions

Conceptualization, T.H.W.; formal analysis, T.H.W., B.A.A. and K.B.; methodology, T.H.W.; investigation, B.A.A. and K.B.; visualization, T.H.W., B.A.A. and K.B.; writing—original draft preparation, T.H.W.; writing—review and editing, T.H.W. All authors have read and agreed to the published version of the manuscript.

Funding

This research received no external funding.

Informed Consent Statement

Not applicable.

Data Availability Statement

The data presented in this study are available on request from the corresponding author.

Conflicts of Interest

The authors are employed by Waters Corp., the manufacturer of several of the columns that were evaluated. ACQUITY, Atlantis, BEH, CORTECS and UPLC are trademarks of Waters Technologies Corporation. Ascentis, Milli-Q, SeQuant and ZIC are trademarks of Merck KGaA. Accucore is a trademark of Thermo Fisher Scientific Inc. Orion, and Versa Star Pro are trademarks of Thermo Orion Inc. TSKgel is a trademark of Tosoh Corporation.

References

  1. Alpert, A.J. Hydrophilic interaction chromatography for the separation of peptides, nucleic acids and other polar compounds. J. Chromatogr. 1990, 499, 177–196. [Google Scholar] [CrossRef]
  2. Hemström, P.; Irgum, K. Hydrophilic interaction chromatography. J. Sep. Sci. 2006, 29, 1784–1821. [Google Scholar] [CrossRef]
  3. Jandera, P. Stationary and mobile phases in hydrophilic interaction chromatography: A review. Anal. Chim. Acta 2011, 692, 1–25. [Google Scholar] [CrossRef]
  4. Guo, Y.; Gaiki, S. Retention and selectivity of stationary phases for hydrophilic interaction chromatography. J. Chromatogr. A 2011, 1218, 5920–5938. [Google Scholar] [CrossRef]
  5. Wahab, M.F.; Ibrahim, M.E.A.; Lucy, C.A. Carboxylate modified porous graphitic carbon: A new class of hydrophilic interaction liquid chromatography phases. Anal. Chem. 2013, 85, 5684–5691. [Google Scholar] [CrossRef]
  6. Ibrahim, M.E.A.; Wahab, M.F.; Lucy, C.A. Hybrid carbon nanoparticles modified core-shell silica: A high efficiency carbon-based phase for hydrophilic interaction chromatography. Anal. Chim. Acta 2014, 820, 187–194. [Google Scholar] [CrossRef]
  7. Hou, Y.; Zhang, F.; Liang, X.; Yang, B.; Liu, X.; Dasgupta, P.K. Poly(vinyl alcohol) modified porous graphitic carbon stationary phase for hydrophilic interaction liquid chromatography. Anal. Chem. 2016, 88, 4676–4681. [Google Scholar] [CrossRef]
  8. Wimalasinghe, R.M.; Weatherly, C.A.; Wahab, M.F.; Thakur, N.; Armstrong, D.W. Geopolymers as a new class of high pH stable supports with different chromatographic selectivity. Anal. Chem. 2018, 90, 8139–8146. [Google Scholar] [CrossRef]
  9. Kartsova, L.A.; Bessonova, E.A.; Somova, V.D. Hydrophilic interaction chromatography. J. Anal. Chem. 2019, 74, 415–424. [Google Scholar] [CrossRef]
  10. Iler, R.K. The Chemistry of Silica; Wiley: New York, NY, USA, 1979; pp. 3–104. [Google Scholar]
  11. Law, B.; Chan, P.F. Stability of silica packing materials towards a mixed aqueous-organic eluent at alkaline pH. J. Chromatogr. 1989, 467, 267–271. [Google Scholar] [CrossRef]
  12. Huang, Z.; Richards, M.A.; Zha, Y.; Francis, R.; Lozano, R.; Ruan, J. Determination of inorganic pharmaceutical counterions using hydrophilic interaction chromatography coupled with a Corona CAD detector. J. Pharm. Biomed. Anal. 2009, 50, 809–814. [Google Scholar] [CrossRef]
  13. Qian, K.; Peng, Y.; Zhang, F.; Yang, B.; Liang, X. Preparation of a low bleeding polar stationary phase for hydrophilic interaction liquid chromatography. Talanta 2018, 182, 500–504. [Google Scholar] [CrossRef]
  14. Qian, K.; Yang, Z.; Zhang, F.; Yang, B.; Dasgupta, P.K. Low-bleed silica-based stationary phase for hydrophilic interaction chromatography. Anal. Chem. 2018, 90, 8750–8755. [Google Scholar] [CrossRef]
  15. Walter, T.H.; Blaze, M.T.; Boissel, C. Electrospray ionization mass spectrometry ion suppression/enhancement caused by column bleed for three mixed-mode reversed-phase/anion-exchange high performance liquid chromatography columns. Rapid Commun. Mass Spectrom. 2021, 35, e9098. [Google Scholar] [CrossRef]
  16. Wang, Y.; Wahab, M.F.; Breitbach, Z.S.; Armstrong, D.W. Carboxylated cyclofructan 6 as a hydrolytically stable high efficiency stationary phase for hydrophilic interaction liquid chromatography and mixed mode separations. Anal. Methods 2016, 8, 6038–6045. [Google Scholar] [CrossRef]
  17. Li, C.; Hao, W.; Yan, F.; Su, M. Aminopropyl-functionalized ethane-bridged periodic mesoporous organosilica spheres: Preparation and application in liquid chromatography. J. Chromatogr. A 2011, 1218, 408–415. [Google Scholar] [CrossRef]
  18. Fountain, K.J.; Xu, J.; Diehl, D.M.; Morrison, D. Influence of stationary phase chemistry and mobile-phase composition on retention, selectivity, and MS response in hydrophilic interaction chromatography. J. Sep. Sci. 2010, 33, 740–751. [Google Scholar] [CrossRef]
  19. Teleki, A.; Sánchez-Kopper, A.; Takors, R. Alkaline conditions in hydrophilic interaction chromatography for intracellular metabolite quantification using tandem mass spectrometry. Anal. Biochem. 2015, 475, 4–13. [Google Scholar] [CrossRef]
  20. Zhang, T.; Creek, D.J.; Barrett, M.P.; Blackburn, G.; Watson, D.G. Evaluation of coupling reversed phase, aqueous normal phase, and hydrophilic interaction liquid chromatography with orbitrap mass spectrometry for metabolomic studies of human urine. Anal. Chem. 2012, 84, 1994–2001. [Google Scholar] [CrossRef] [Green Version]
  21. Zhang, R.; Watson, D.G.; Wang, L.; Westrop, G.D.; Coombs, G.H.; Zhang, T. Evaluation of mobile phase characteristics on three zwitterionic columns in hydrophilic interaction liquid chromatography mode for liquid chromatography-high resolution mass spectrometry based untargeted metabolite profiling of Leishmania parasites. J. Chromatogr. A 2014, 1362, 168–179. [Google Scholar] [CrossRef] [Green Version]
  22. Petrova, B.; Warren, A.; Vital, N.Y.; Culhane, A.J.; Maynard, A.G.; Wong, A.; Kanarek, N. Redox metabolism measurement in mammalian cells and tissues by LC-MS. Metabolites 2021, 11, 313. [Google Scholar] [CrossRef]
  23. Grumbach, E.S.; Diehl, D.M.; Neue, U.D. The application of novel 1.7 μm ethylene bridged hybrid particles for hydrophilic interaction chromatography. J. Sep. Sci. 2008, 31, 1511–1518. [Google Scholar] [CrossRef]
  24. Wehrli, A.; Hildenbrand, J.C.; Keller, H.P.; Stampfli, R.; Frei, R.W. Influence of organic bases on the stability and separation properties of reversed-phase chemically bonded silica gels. J. Chromatogr. 1978, 149, 199–210. [Google Scholar] [CrossRef]
  25. Kirkland, J.J.; van Straten, M.A.; Claessens, H.A. High pH mobile phase effects on silica-based reversed-phase high-performance liquid chromatographic columns. J. Chromatogr. A 1995, 691, 3–19. [Google Scholar] [CrossRef] [Green Version]
  26. Claessens, H.A.; van Straten, M.A.; Kirkland, J.J. Effects of buffers on silica-based column stability in reversed-phase high-performance liquid chromatography. J. Chromatogr. A 1996, 728, 259–270. [Google Scholar] [CrossRef]
  27. Tindall, G.W.; Perry, R.L. Explanation for the enhanced dissolution of silica column packing in high pH phosphate and carbonate buffers. J. Chromatogr. A 2003, 988, 309–312. [Google Scholar] [CrossRef]
  28. Canals, I.; Portal, J.A.; Bosch, E.; Rosés, M. Retention of ionizable compounds on HPLC. 4. mobile phase pH measurement in methanol/water. Anal. Chem. 2000, 72, 1802–1809. [Google Scholar] [CrossRef]
  29. Espinosa, S.; Bosch, E.; Rosés, M. Retention of ionizable compounds on HPLC. 5. pH scales and the retention of acids and bases with acetonitrile-water mobile phases. Anal. Chem. 2000, 72, 5193–5200. [Google Scholar] [CrossRef]
  30. Espinosa, S.; Bosch, E.; Rosés, M. Retention of ionizable compounds on HPLC. 12. The properties of liquid chromatography buffers in acetonitrile-water mobile phases that influence HPLC retention. Anal. Chem. 2002, 74, 3809–3818. [Google Scholar] [CrossRef]
  31. Subirats, X.; Bosch, E.; Rosés, M. Retention of ionizable compounds on high-performance liquid chromatography XV. Estimation of the pH variation of aqueous buffers with the change of the acetonitrile fraction of the mobile phase. J. Chromatogr. A 2004, 1059, 33–42. [Google Scholar] [CrossRef]
  32. Rosés, M. Determination of the pH of binary mobile phases for reversed-phase liquid chromatography. J. Chromatogr. A 2004, 1037, 283–298. [Google Scholar] [CrossRef]
  33. Subirats, X.; Bosch, E.; Rosés, M. Retention of ionizable compounds on high-performance liquid chromatography XVIII: pH variation in mobile phases containing formic acid, piperazine, tris, boric acid or carbonate as buffering systems and acetonitrile as organic modifier. J. Chromatogr. A 2009, 1216, 2491–2498. [Google Scholar] [CrossRef]
  34. Alvarez-Segura, T.; Subirats, X.; Rosés, M. Retention-pH profiles of acids and bases in hydrophilic interaction liquid chromatography. Anal. Chim. Acta 2019, 1050, 176–184. [Google Scholar] [CrossRef]
  35. Wyndham, K.D.; O’Gara, J.E.; Walter, T.H.; Glose, K.H.; Lawrence, N.L.; Alden, B.A.; Izzo, G.S.; Hudalla, C.J.; Iraneta, P.C. Characterization and evaluation of C18 HPLC stationary phases based on ethyl-bridged hybrid organic/inorganic particles. Anal. Chem. 2003, 75, 6781–6788. [Google Scholar] [CrossRef]
  36. Walter, T.H.; Alden, B.A.; Berthelette, K.; Field, J.A.; Lawrence, N.L.; McLaughlin, J.; Patel, A.V. Characterization of a highly stable zwitterionic hydrophilic interaction chromatography stationary phase based on hybrid organic-inorganic particles. J. Sep. Sci. 2022, 45, 1389–1399. [Google Scholar] [CrossRef]
  37. Davis, P.J.; Deshpande, R.; Smith, D.M.; Brinker, C.J.; Assink, R.A. Pore structure evolution in silica gel during aging/drying. IV. Varying pore fluid pH. J. Non-Cryst. Solids 1994, 167, 295–306. [Google Scholar] [CrossRef]
  38. Kirkland, J.J.; Henderson, J.W.; DeStefano, J.J.; van Straten, M.A.; Claessens, H.A. Stability of silica-based, endcapped columns with pH 7 and 11 mobile phases for reversed-phase high-performance liquid chromatography. J. Chromatogr. A 1997, 762, 97–112. [Google Scholar] [CrossRef] [Green Version]
Figure 1. Effect of the water concentration of the challenge solution on the stability of 2.1 × 50 mm 1.6 μm CORTECS HILIC columns, shown as % of initial efficiency vs. time exposed to the basic solution. The columns were exposed at 70 °C to solutions containing acetonitrile and an aqueous p w w H 11.00 ammonium bicarbonate buffer (blue and purple circles, 20% buffer, p w s H 10.11; orange and red triangles, 40% buffer, p w s H 10.37; black and gray squares, 60% buffer, p w s H 10.54).
Separations 09 00146 g001
Figure 2. Effect of the pH of the challenge solution on the stability of 2.1 × 50 mm 1.6 μm CORTECS HILIC columns, shown as % of initial efficiency vs. time exposed to the basic solution. The columns were exposed at 70 °C to solutions containing acetonitrile and different aqueous buffers, with a 60/40 v/v ACN/buffer ratio (blue and purple circles, ammonium acetate, p w s H 6.99; orange and red triangles, ammonium bicarbonate, p w s H 8.96; black and gray squares, ammonium bicarbonate, p w s H 10.37).
Separations 09 00146 g002
Figure 3. Effect of temperature on the stability of 2.1 × 50 mm 1.6 μm CORTECS HILIC columns, shown as % of initial efficiency vs. time exposed to the basic solution. The columns were exposed to a p w s H 10.37 solution containing acetonitrile and aqueous ammonium bicarbonate, with a 60/40 v/v ACN/buffer ratio (blue and purple circles, 30 °C; orange and red triangles, 50 °C; black and gray squares, 70 °C).
Separations 09 00146 g003
Figure 4. Accelerated stability test results for eight different stationary phases shown as % of initial efficiency vs. time exposed to the basic solution. The columns were exposed at 70 °C to a solution containing acetonitrile and aqueous p w w H 11.30 ammonium bicarbonate, with a 60/40 v/v ACN/buffer ratio, p w s H 10.87. The average results for three replicate columns are shown with error bars indicating + one standard deviation. (A) Unbonded silica or BEH materials (purple diamonds, BEH HILIC; orange triangles, Accucore HILIC; blue squares, CORTECS HILIC; red circles, Atlantis HILIC; black squares, Ascentis Si). (B) Surface-modifed silica and BEH materials (open purple triangles, BEH Amide; open red circles, SeQuant ZIC-HILIC; open black squares, TSKgel Amide-80).
Separations 09 00146 g004
Figure 5. Representative chromatograms for BEH HILIC, Ascentis Si, TSKgel Amide-80 and BEH Amide columns before (injection 1) and after (injection 10) accelerated base stability testing using the conditions described in Figure 4. Peak identification, left to right: acenaphthene, thymine, adenine, cytosine.
Separations 09 00146 g005
Table 1. Gradient program for the base stability test.
Time (min)Flow Rate (mL/min)%A—Water%B—
Acetonitrile
%C—100 mM Ammonium Formate pH 3 (aq)%D—Challenge SolutionCurve 1
initial0.4000.095.05.00.0initial
13.730.4000.00.00.0100.011
34.300.4000.00.00.0100.011
35.970.40050.050.00.00.06
39.270.40050.050.00.00.06
40.930.40010.090.00.00.06
44.230.40010.090.00.00.06
45.900.4000.095.05.00.06
68.130.4000.095.05.00.011
1. Curve indicates the shape of the change of the solvent composition for each gradient segment. Curve 11 is a step change at the end of the segment, and curve 6 is a linear change during the segment.
Table 2. Measured pH values of challenge solutions with different acetonitrile (ACN) concentrations.
pH
% ACNAmmonium AcetateAmmonium BicarbonateAmmonium Bicarbonate
05.607.8011.00
105.838.3410.68
206.048.4910.64
306.278.7410.60
406.528.8110.54
506.768.8010.44
606.998.9610.37
707.259.1210.25
807.559.4010.11
907.799.7510.28
Table 3. Chemical and physical properties of the stationary phases evaluated.
Stationary PhaseParticle ChemistrySurface ChemistryMorphologyParticle Size (μm)Average Pore Diameter (Å)Surface Area (m2/g)Recommended pH Range
Accucore HILICsilicaunbondedsolid-core2.6801302–8
Ascentis Sisilicaunbondedfully porous3.01004502–6
Atlantis HILICsilicaunbondedfully porous3.01003301–5
BEH AmideBEHamidefully porous1.71301852–11
BEH HILICBEHunbondedfully porous1.71301851–9
CORTECS HILICsilicaunbondedsolid-core1.6901001–5
SeQuant ZIC-HILICsilicasulfobetainefully porous3.51001803–8
TSKgel Amide-80silicaamidefully porous2.0804502.0–7.5
Table 4. Retention factor % changes after 3.09 h of exposure to 60/40 ACN/pH 11.30 ammonium bicarbonate (aq) mobile phase at 70 °C. For each stationary phase three columns were tested, and the averages (Avg) and standard deviations (St Dev) are reported.
ThymineAdenineCytosineOverall
Stationary PhaseAvgSt DevAvgSt DevAvgSt DevAvg
Ascentis Si−22.51.3−24.42.9−23.82.3−23.6
Atlantis HILIC−9.10.4−9.50.9−8.70.7−9.1
Accucore HILIC−6.02.8−8.11.5−4.42.1−6.2
BEH HILIC−1.10.7−8.60.1−4.80.2−4.8
TSKgel Amide-80−5.71.7−4.11.2−1.51.3−3.8
SeQuant ZIC-HILIC−1.50.7−4.40.6−3.10.7−3.0
CORTECS HILIC−1.12.4−6.41.80.82.9−2.2
BEH Amide−1.30.31.61.31.01.10.4
Publisher’s Note: MDPI stays neutral with regard to jurisdictional claims in published maps and institutional affiliations.

