
Investigation of Molecular Mean Free Path, Molecular Kinetic Energy, and Molecular Polarity Affecting Knudsen Diffusivity along Pore Channels


Abstract
:1. Introduction
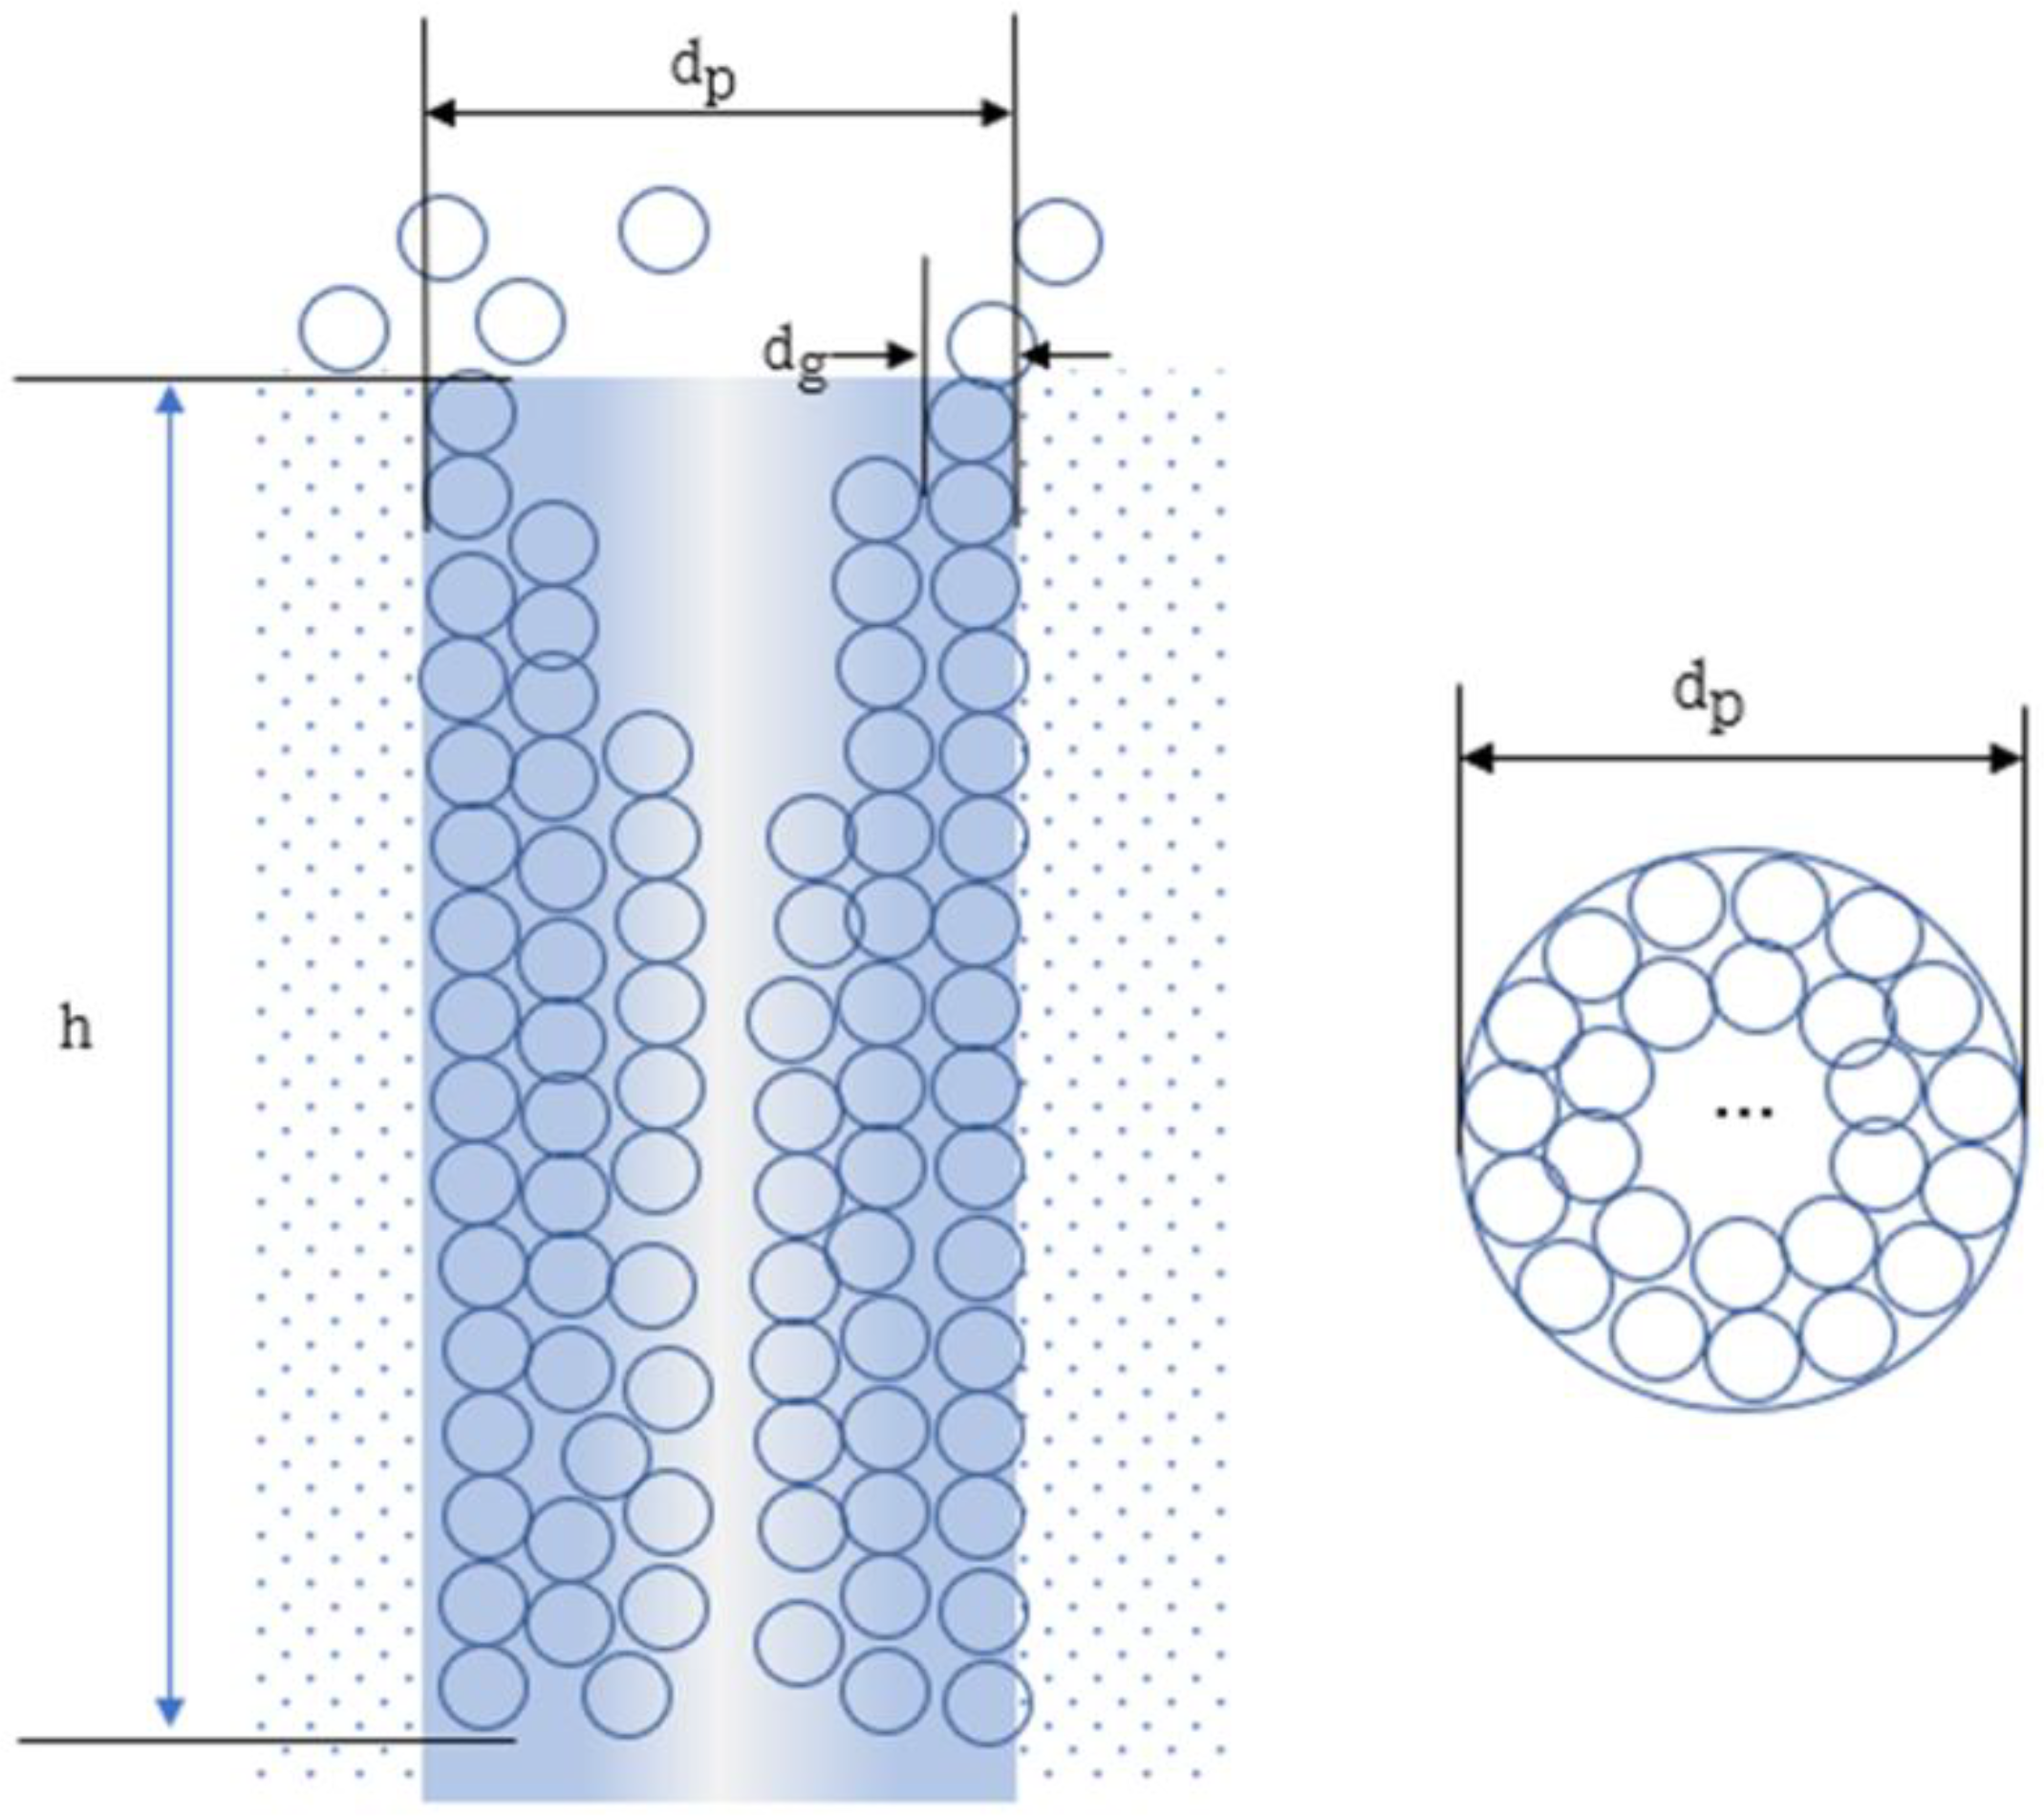
2. Model Postulate
3. Experimental Materials and Methods
3.1. Material Synthesis
3.2. Characterization
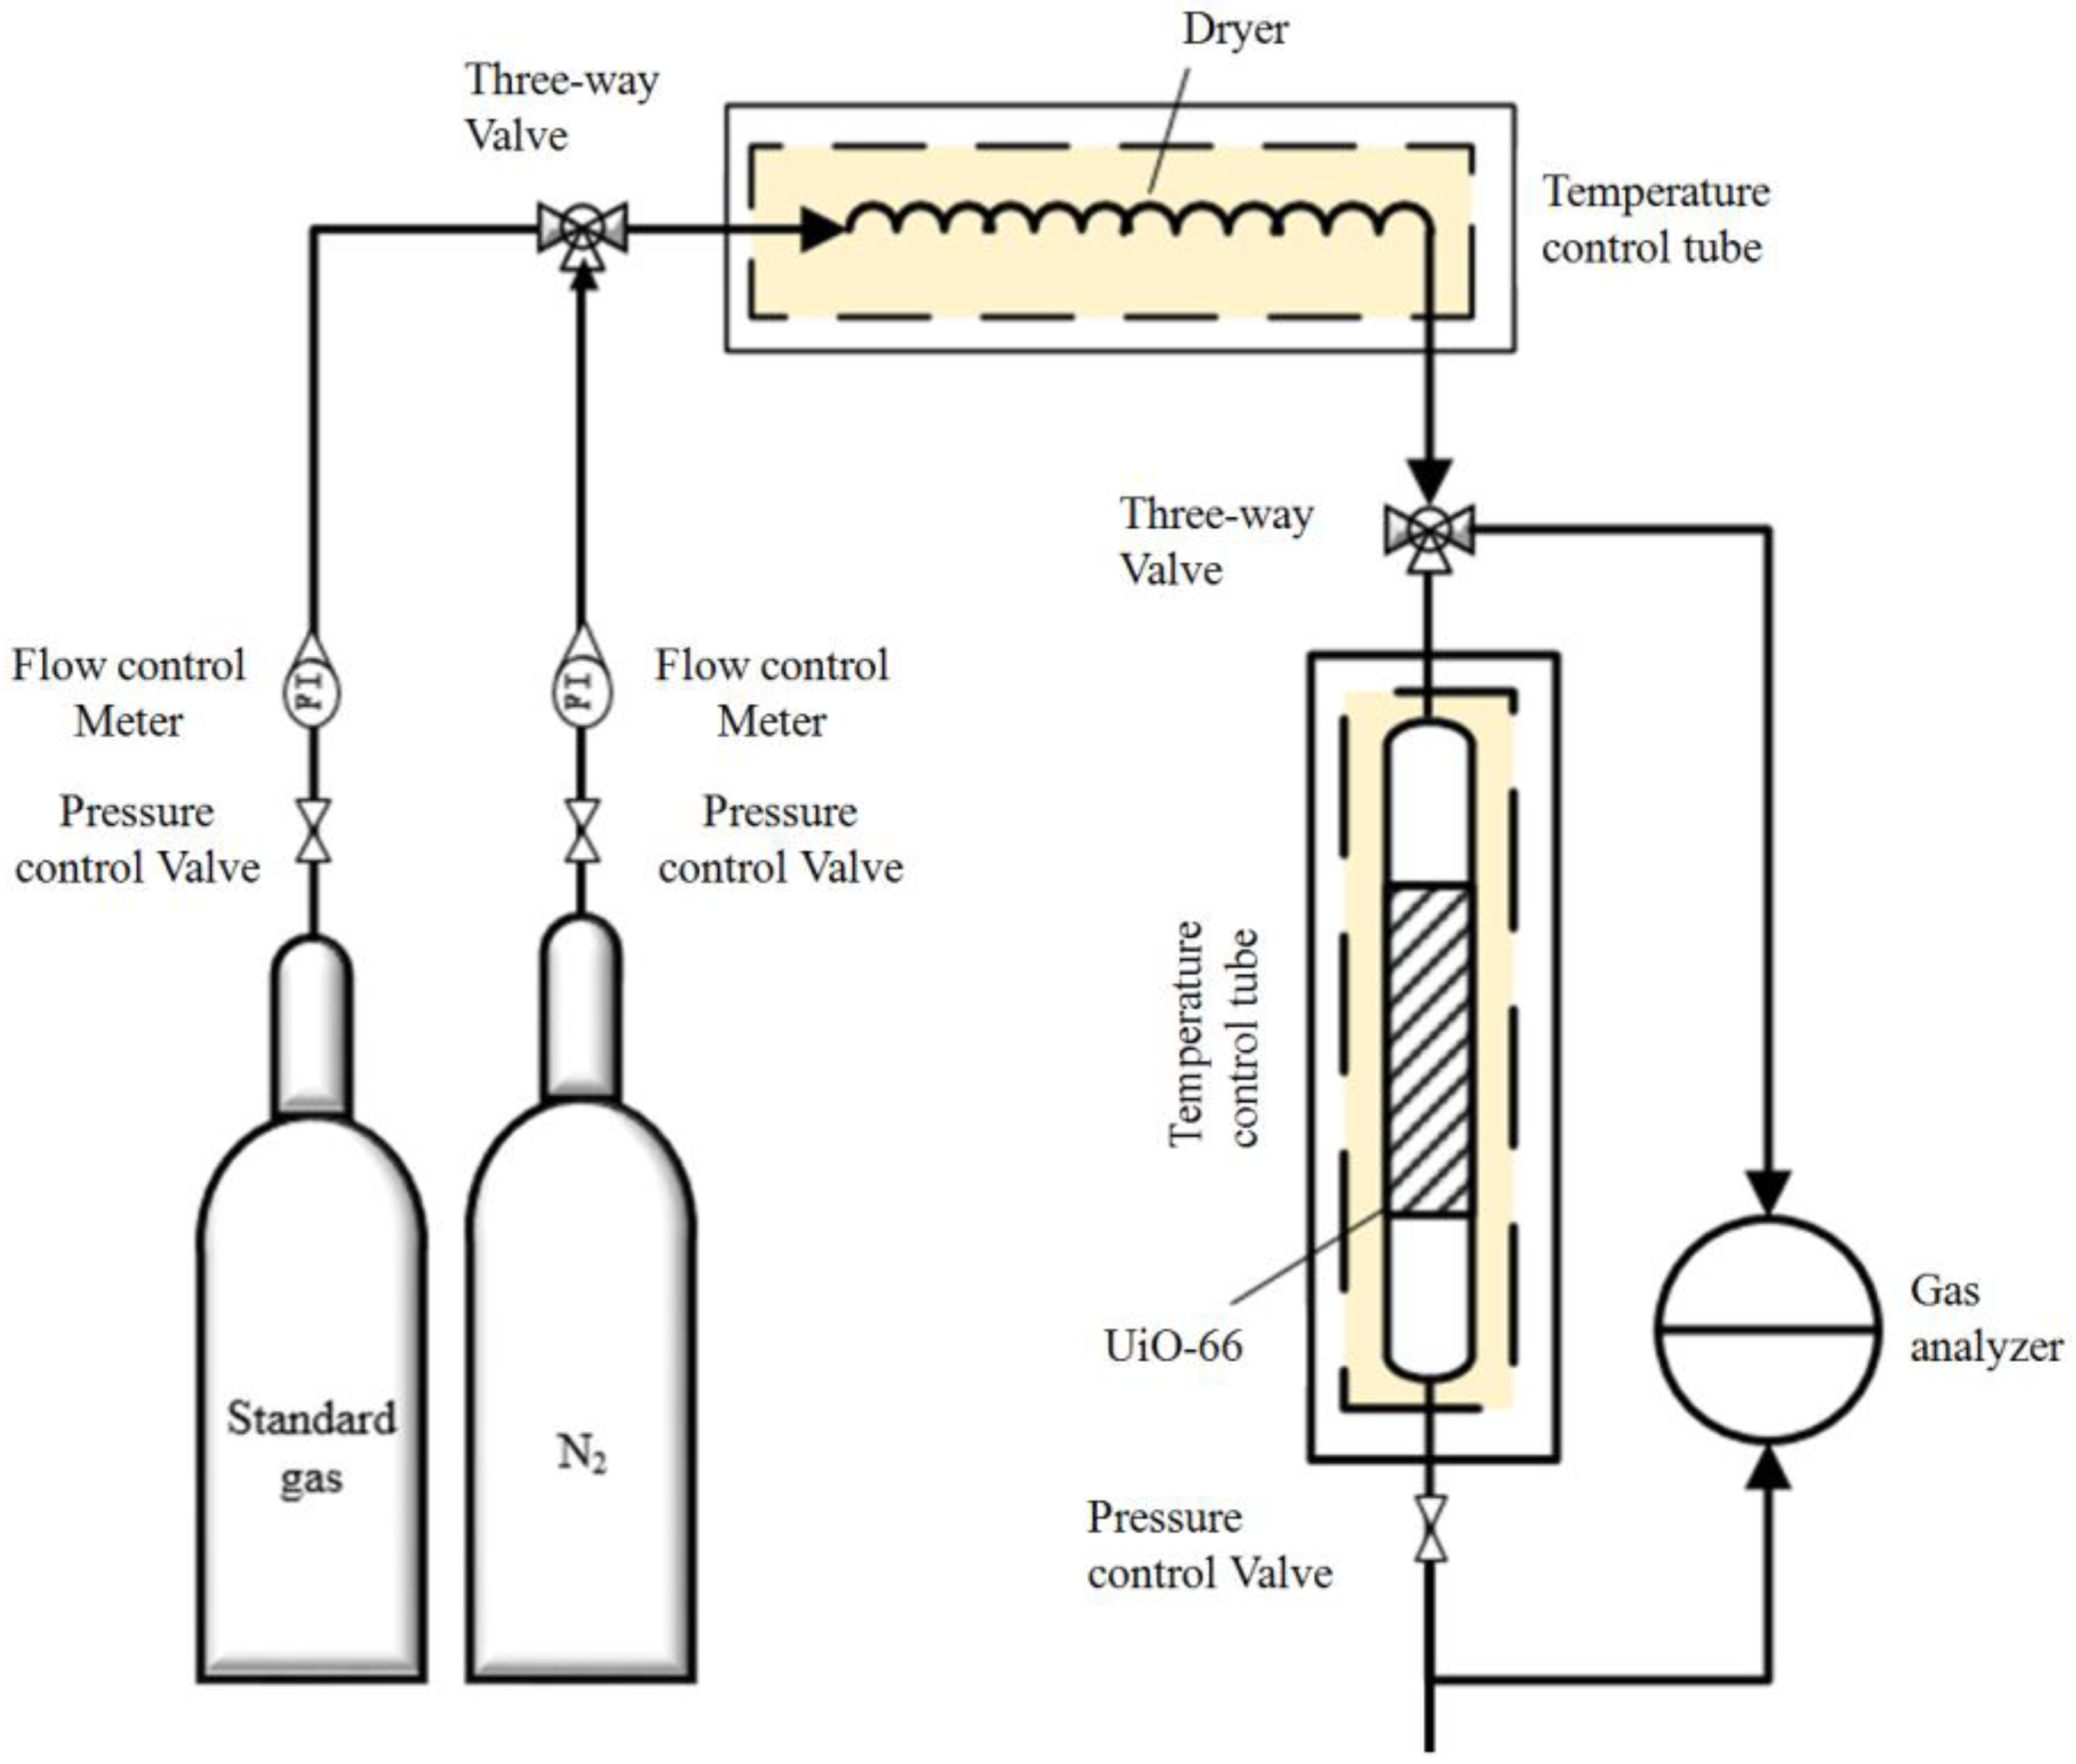
3.3. Adsorption Experiments
4. Results and Discussions
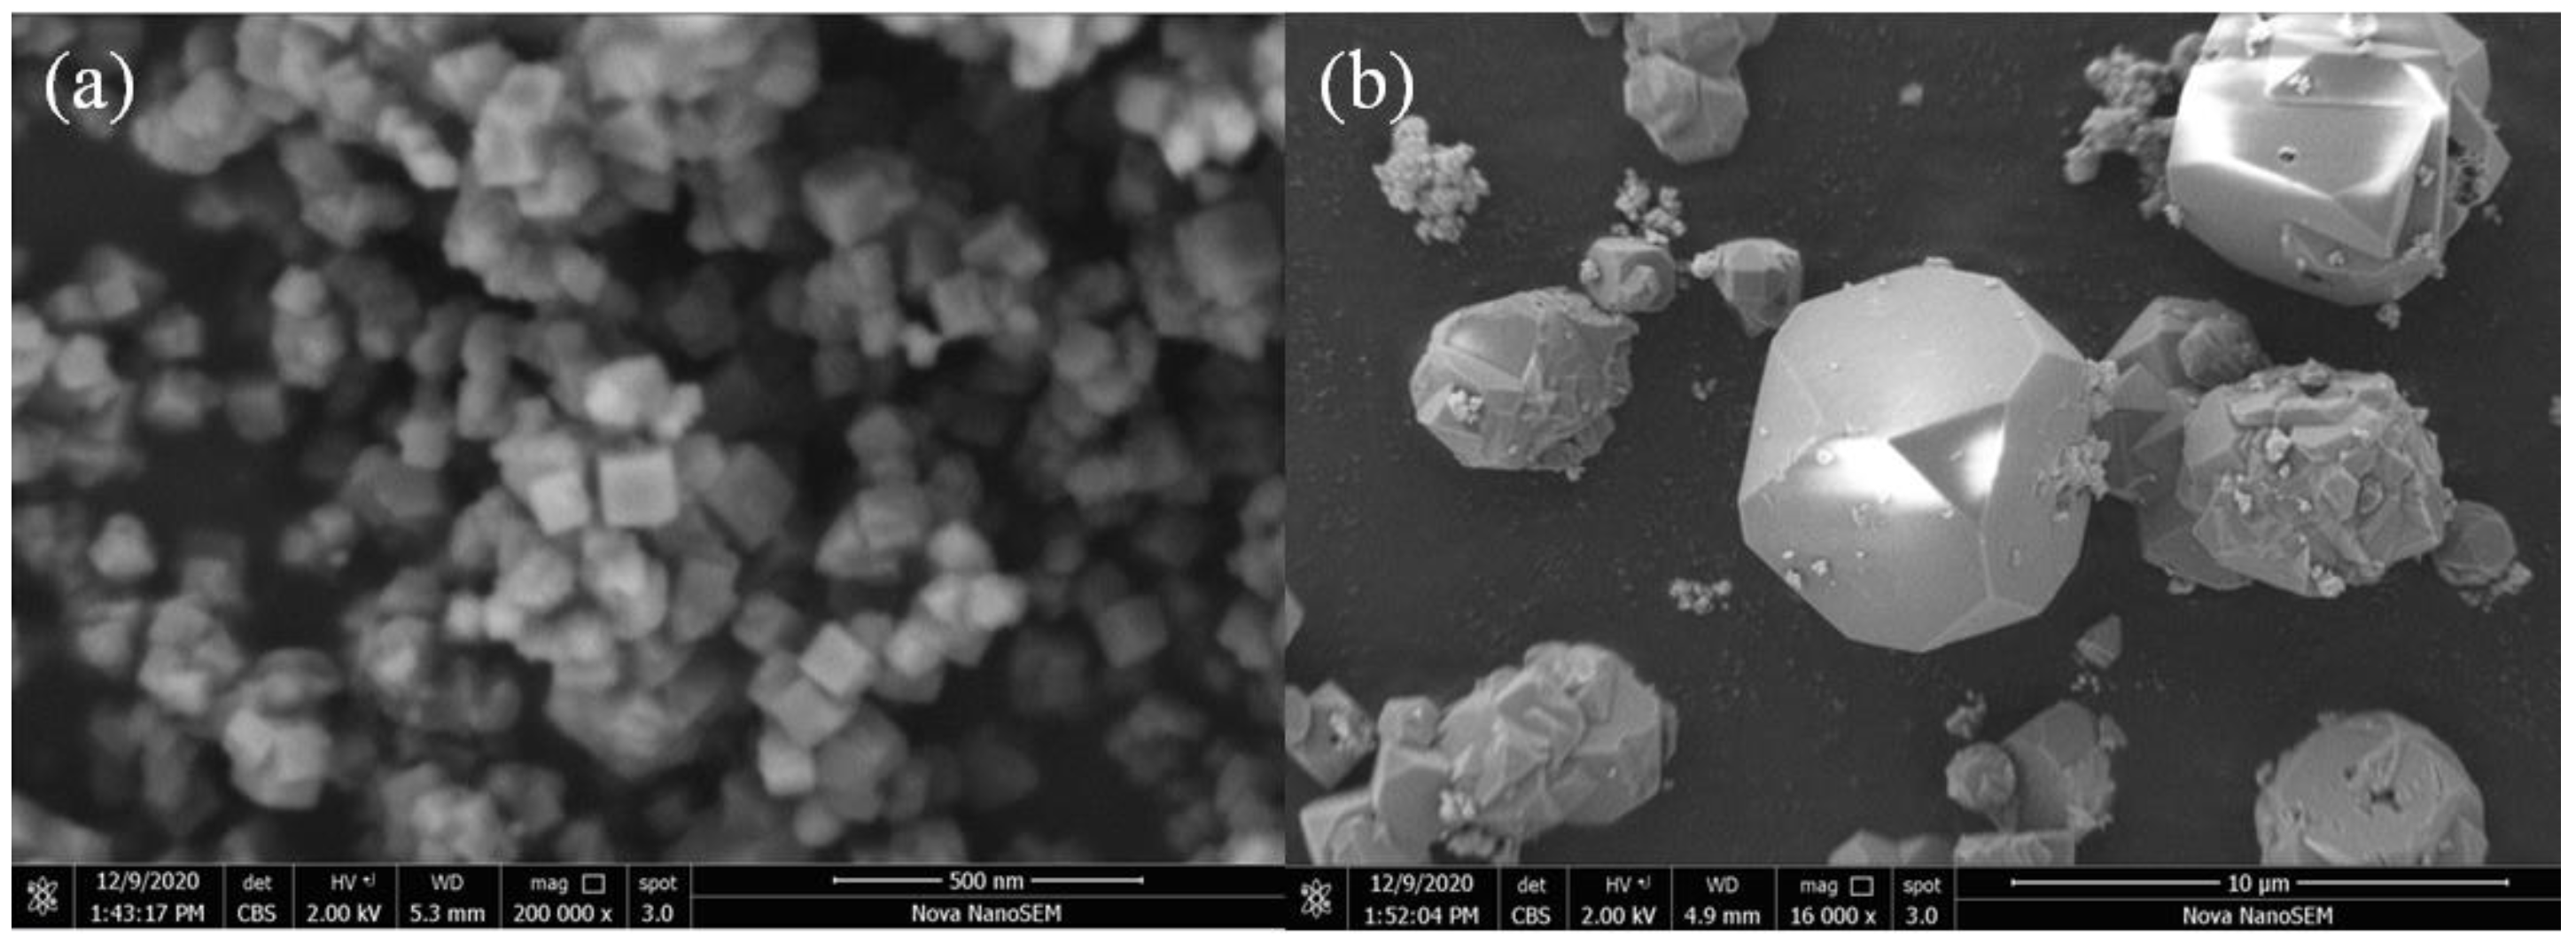
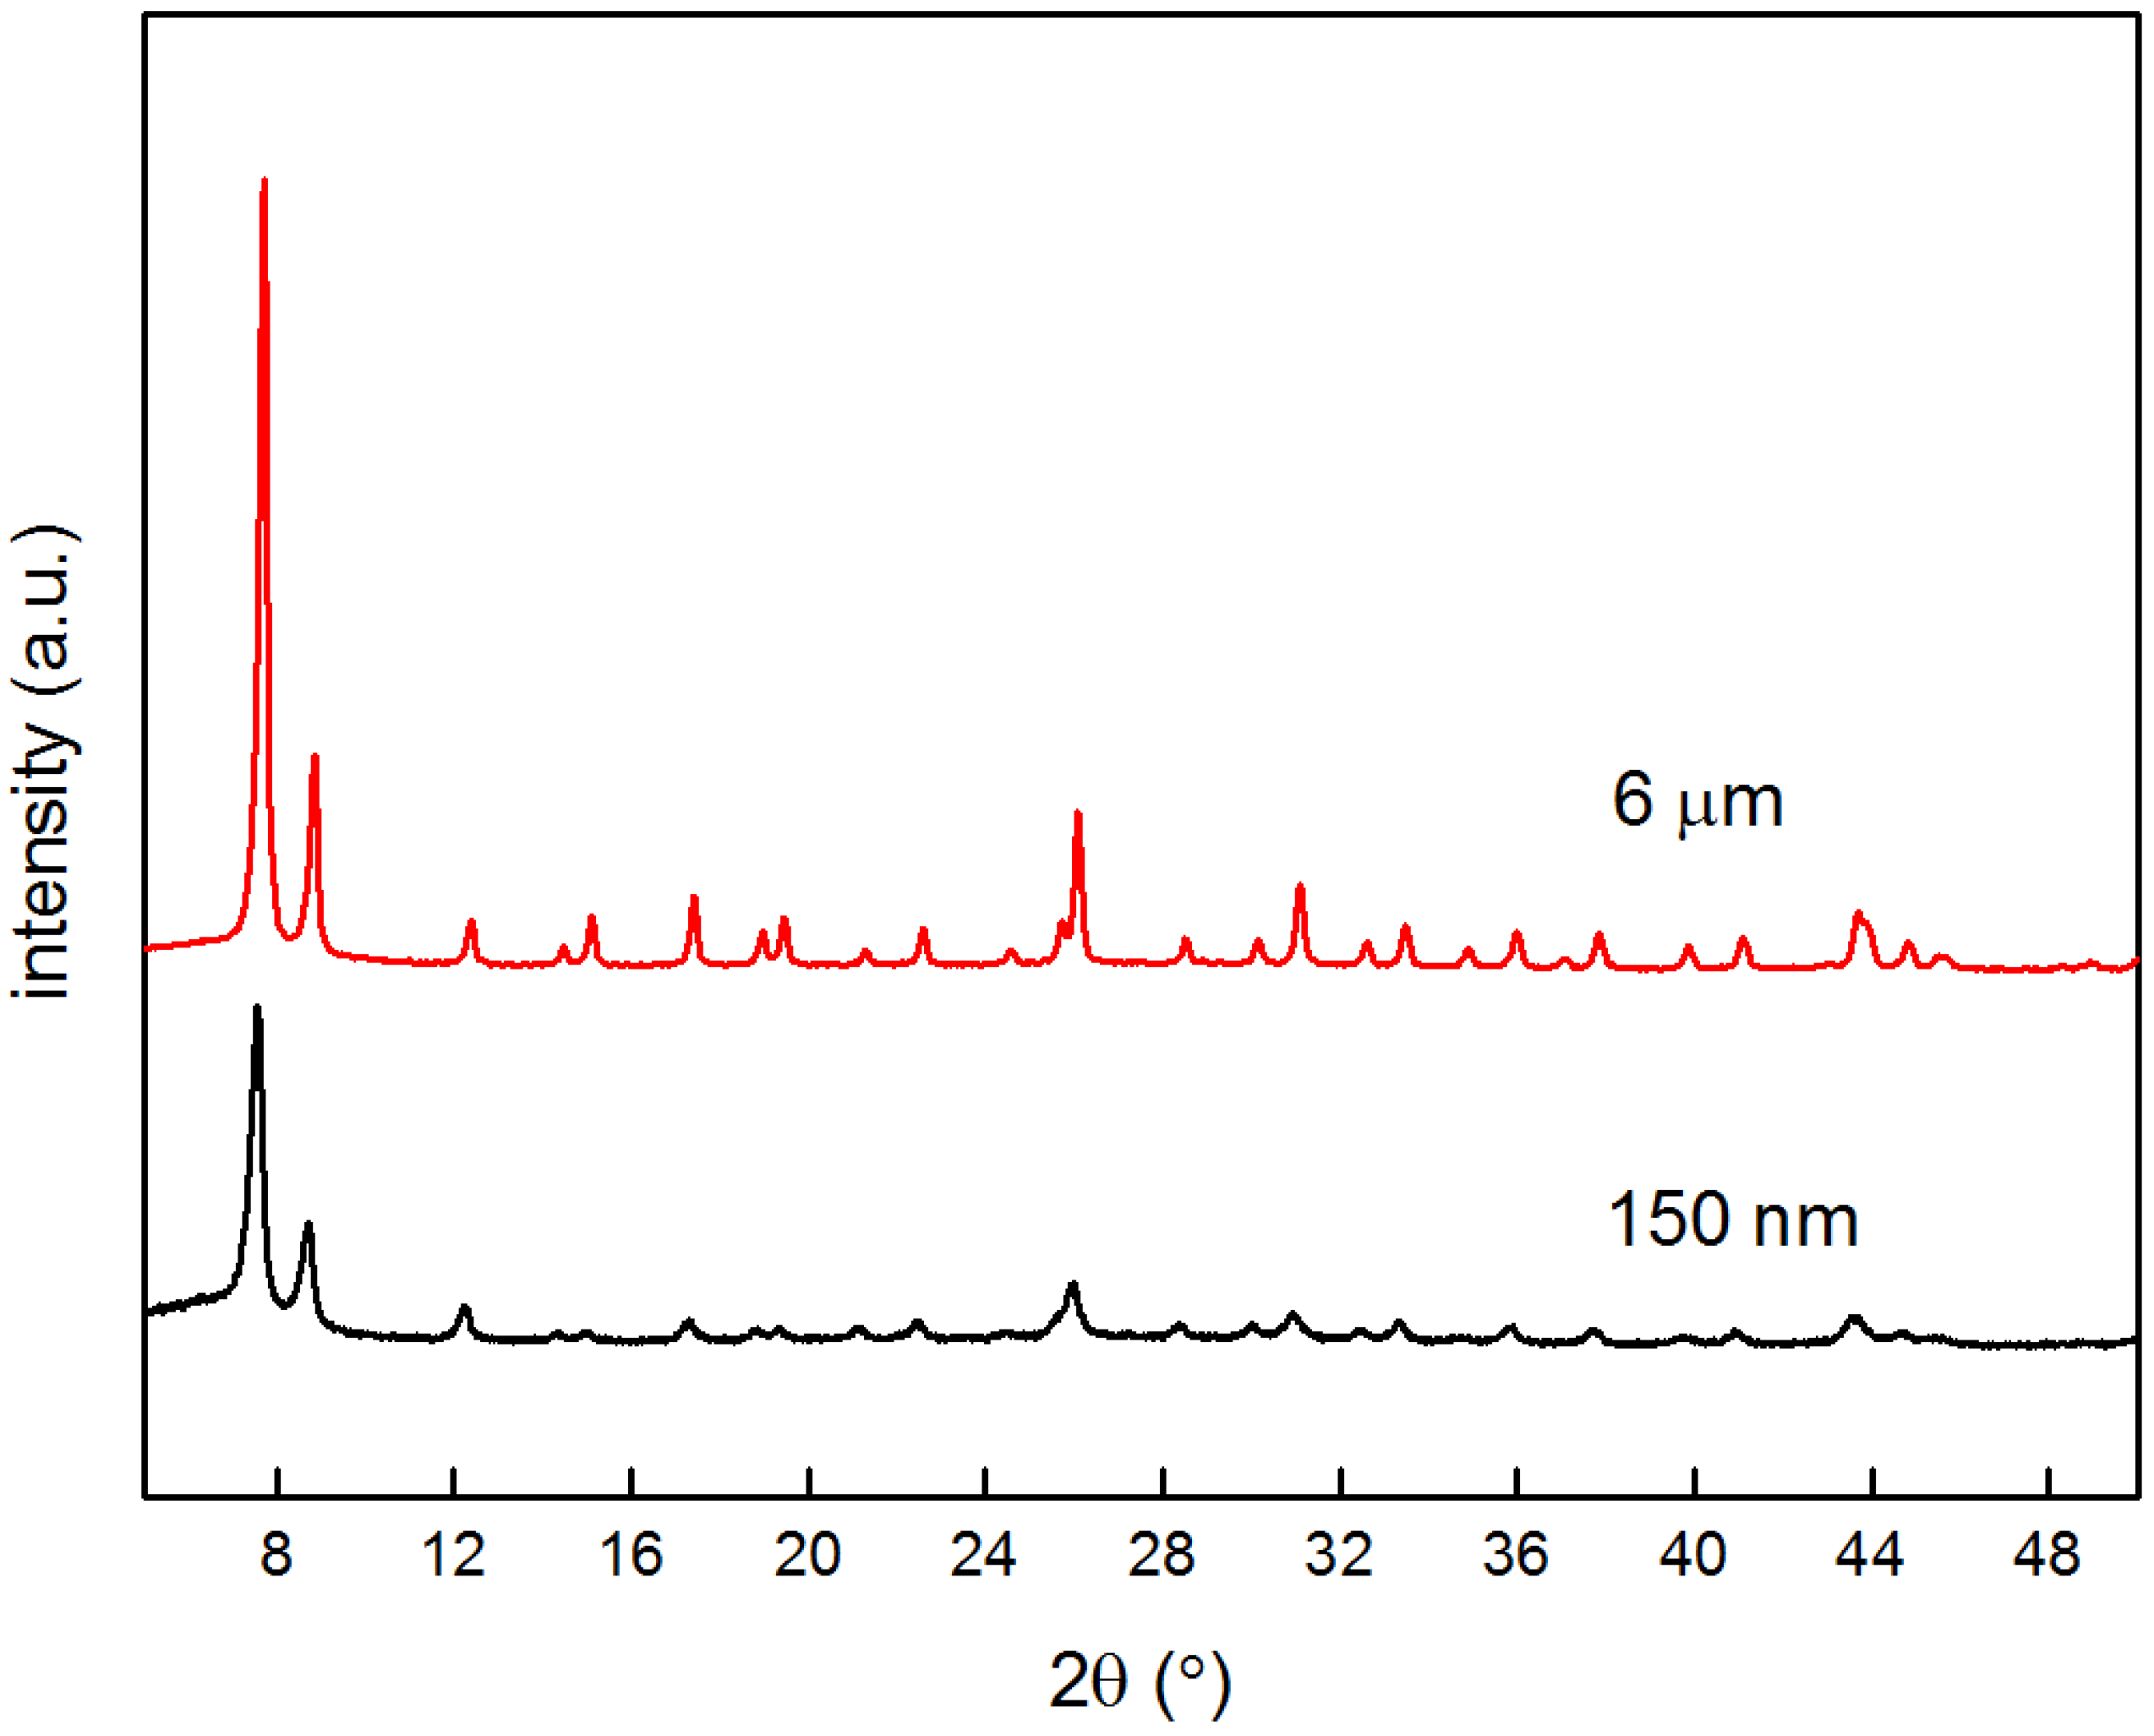
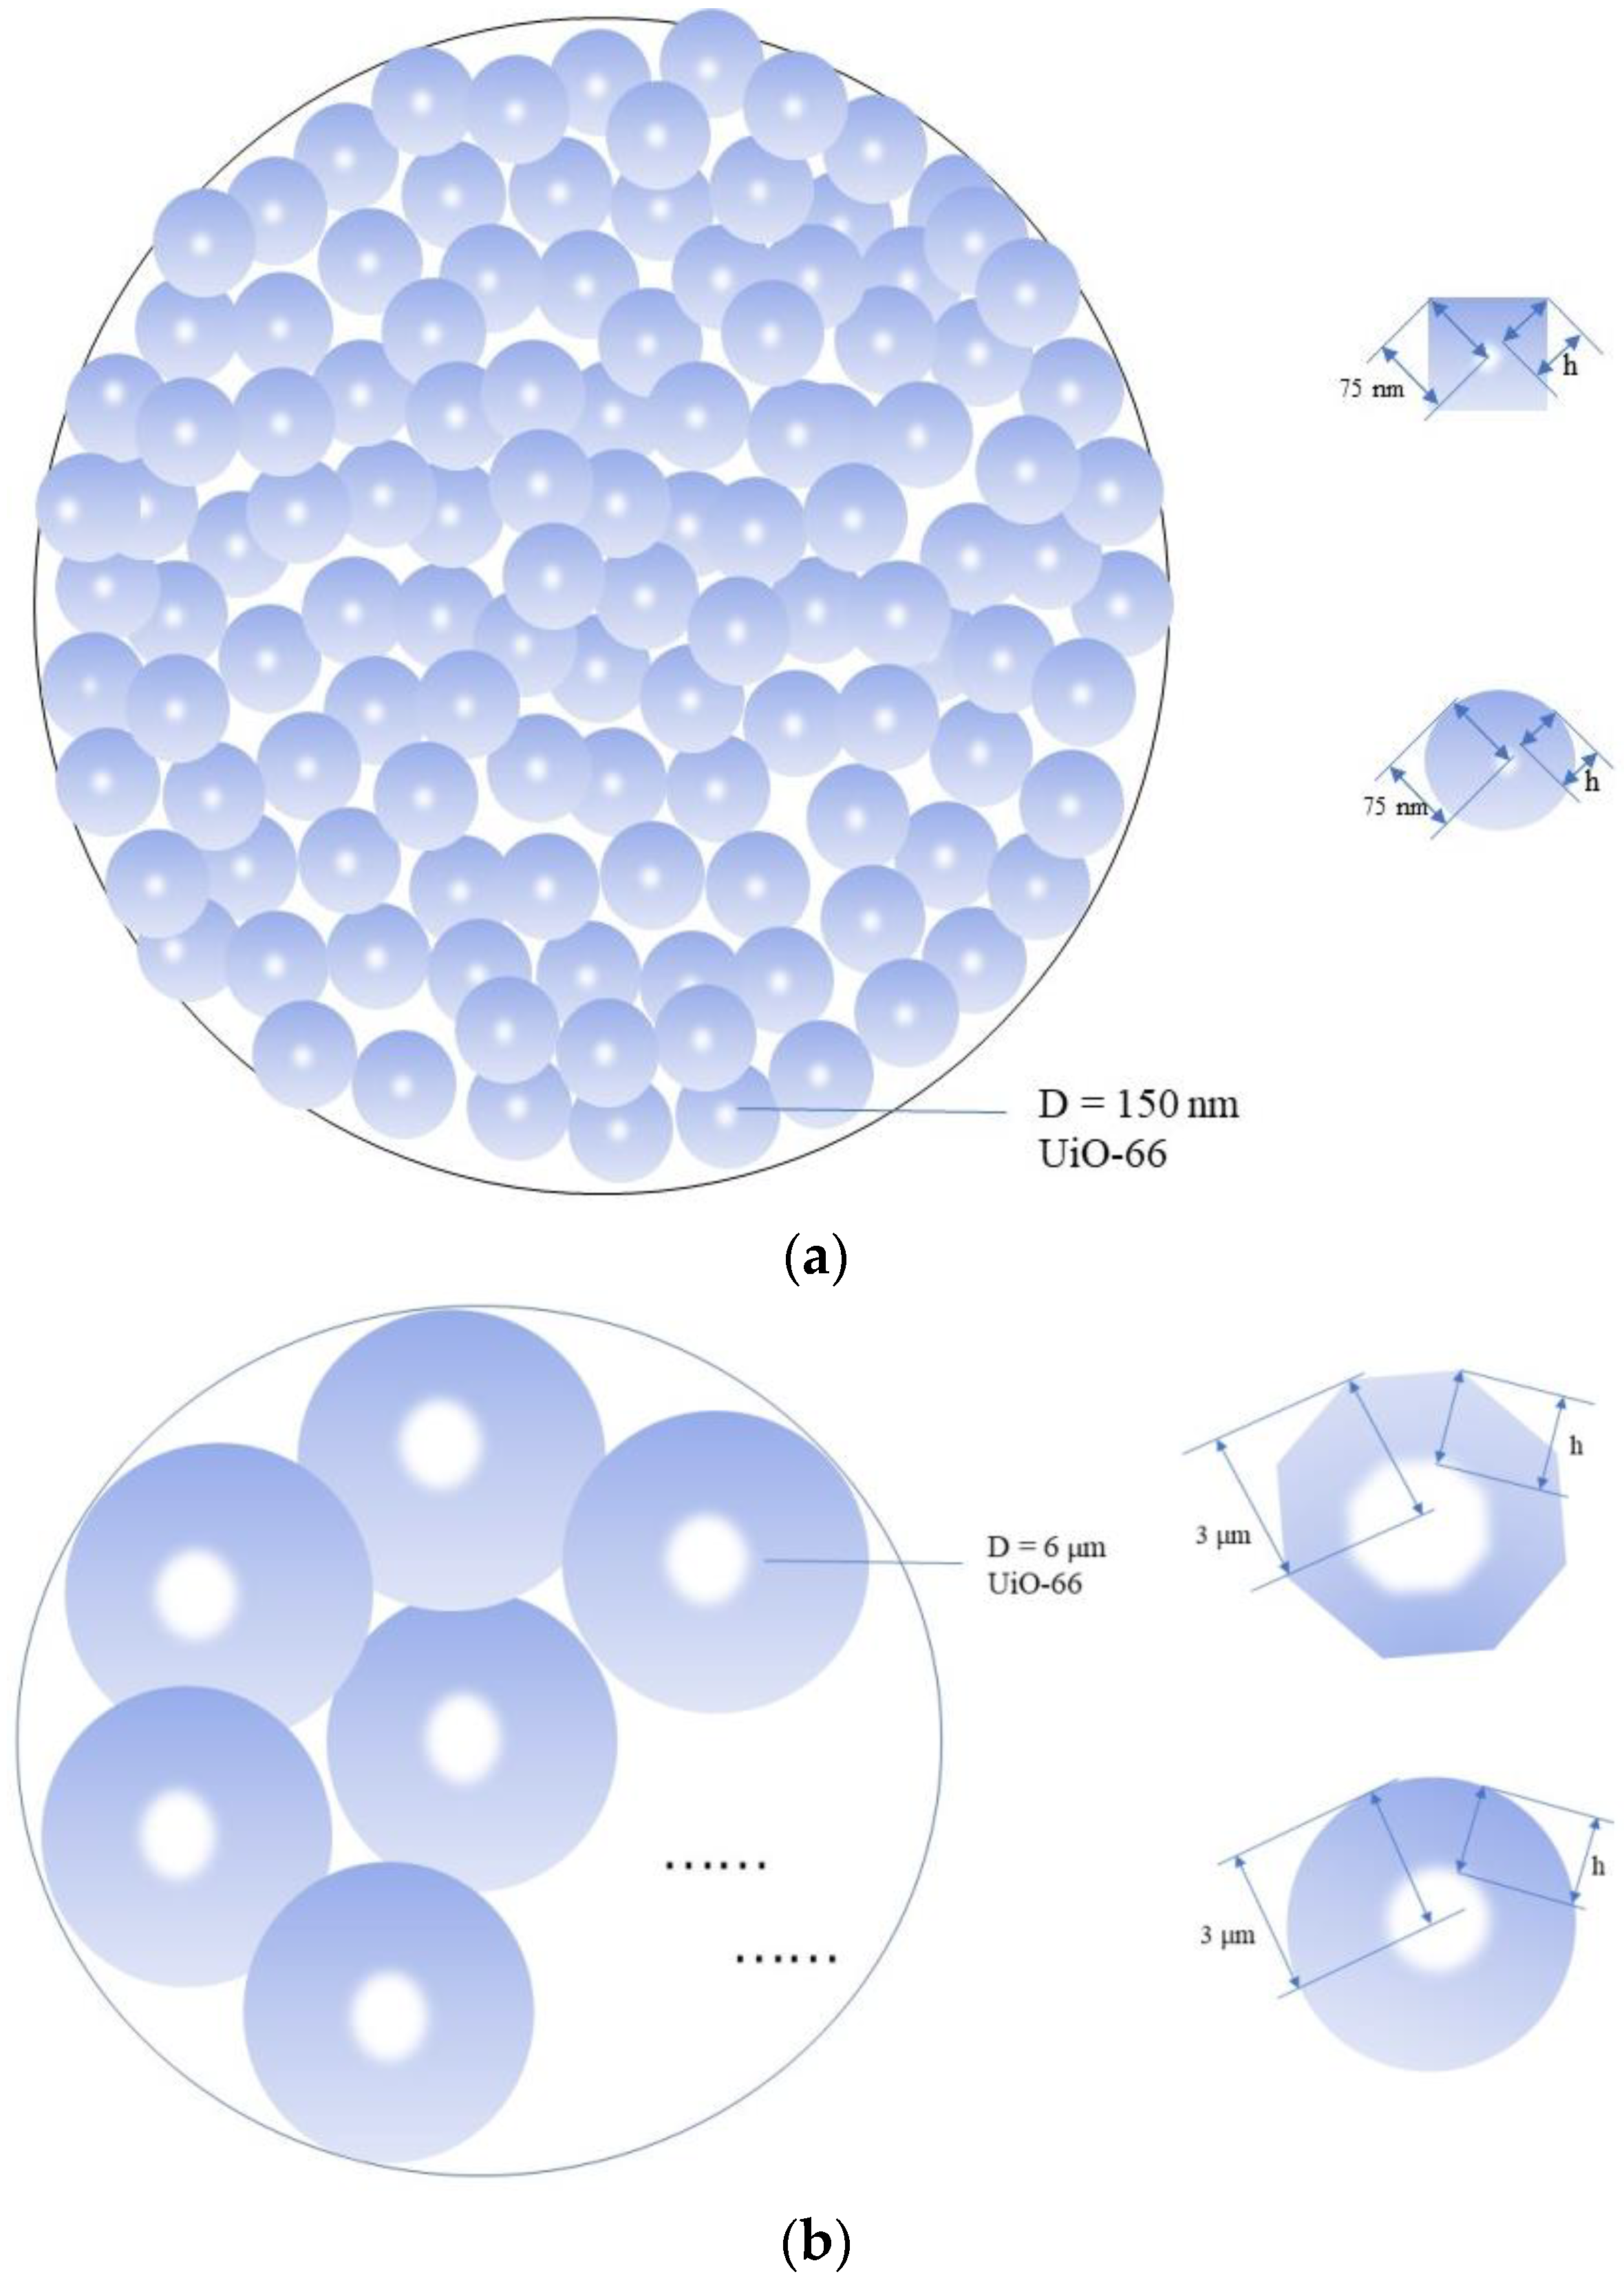
4.1. Characterization
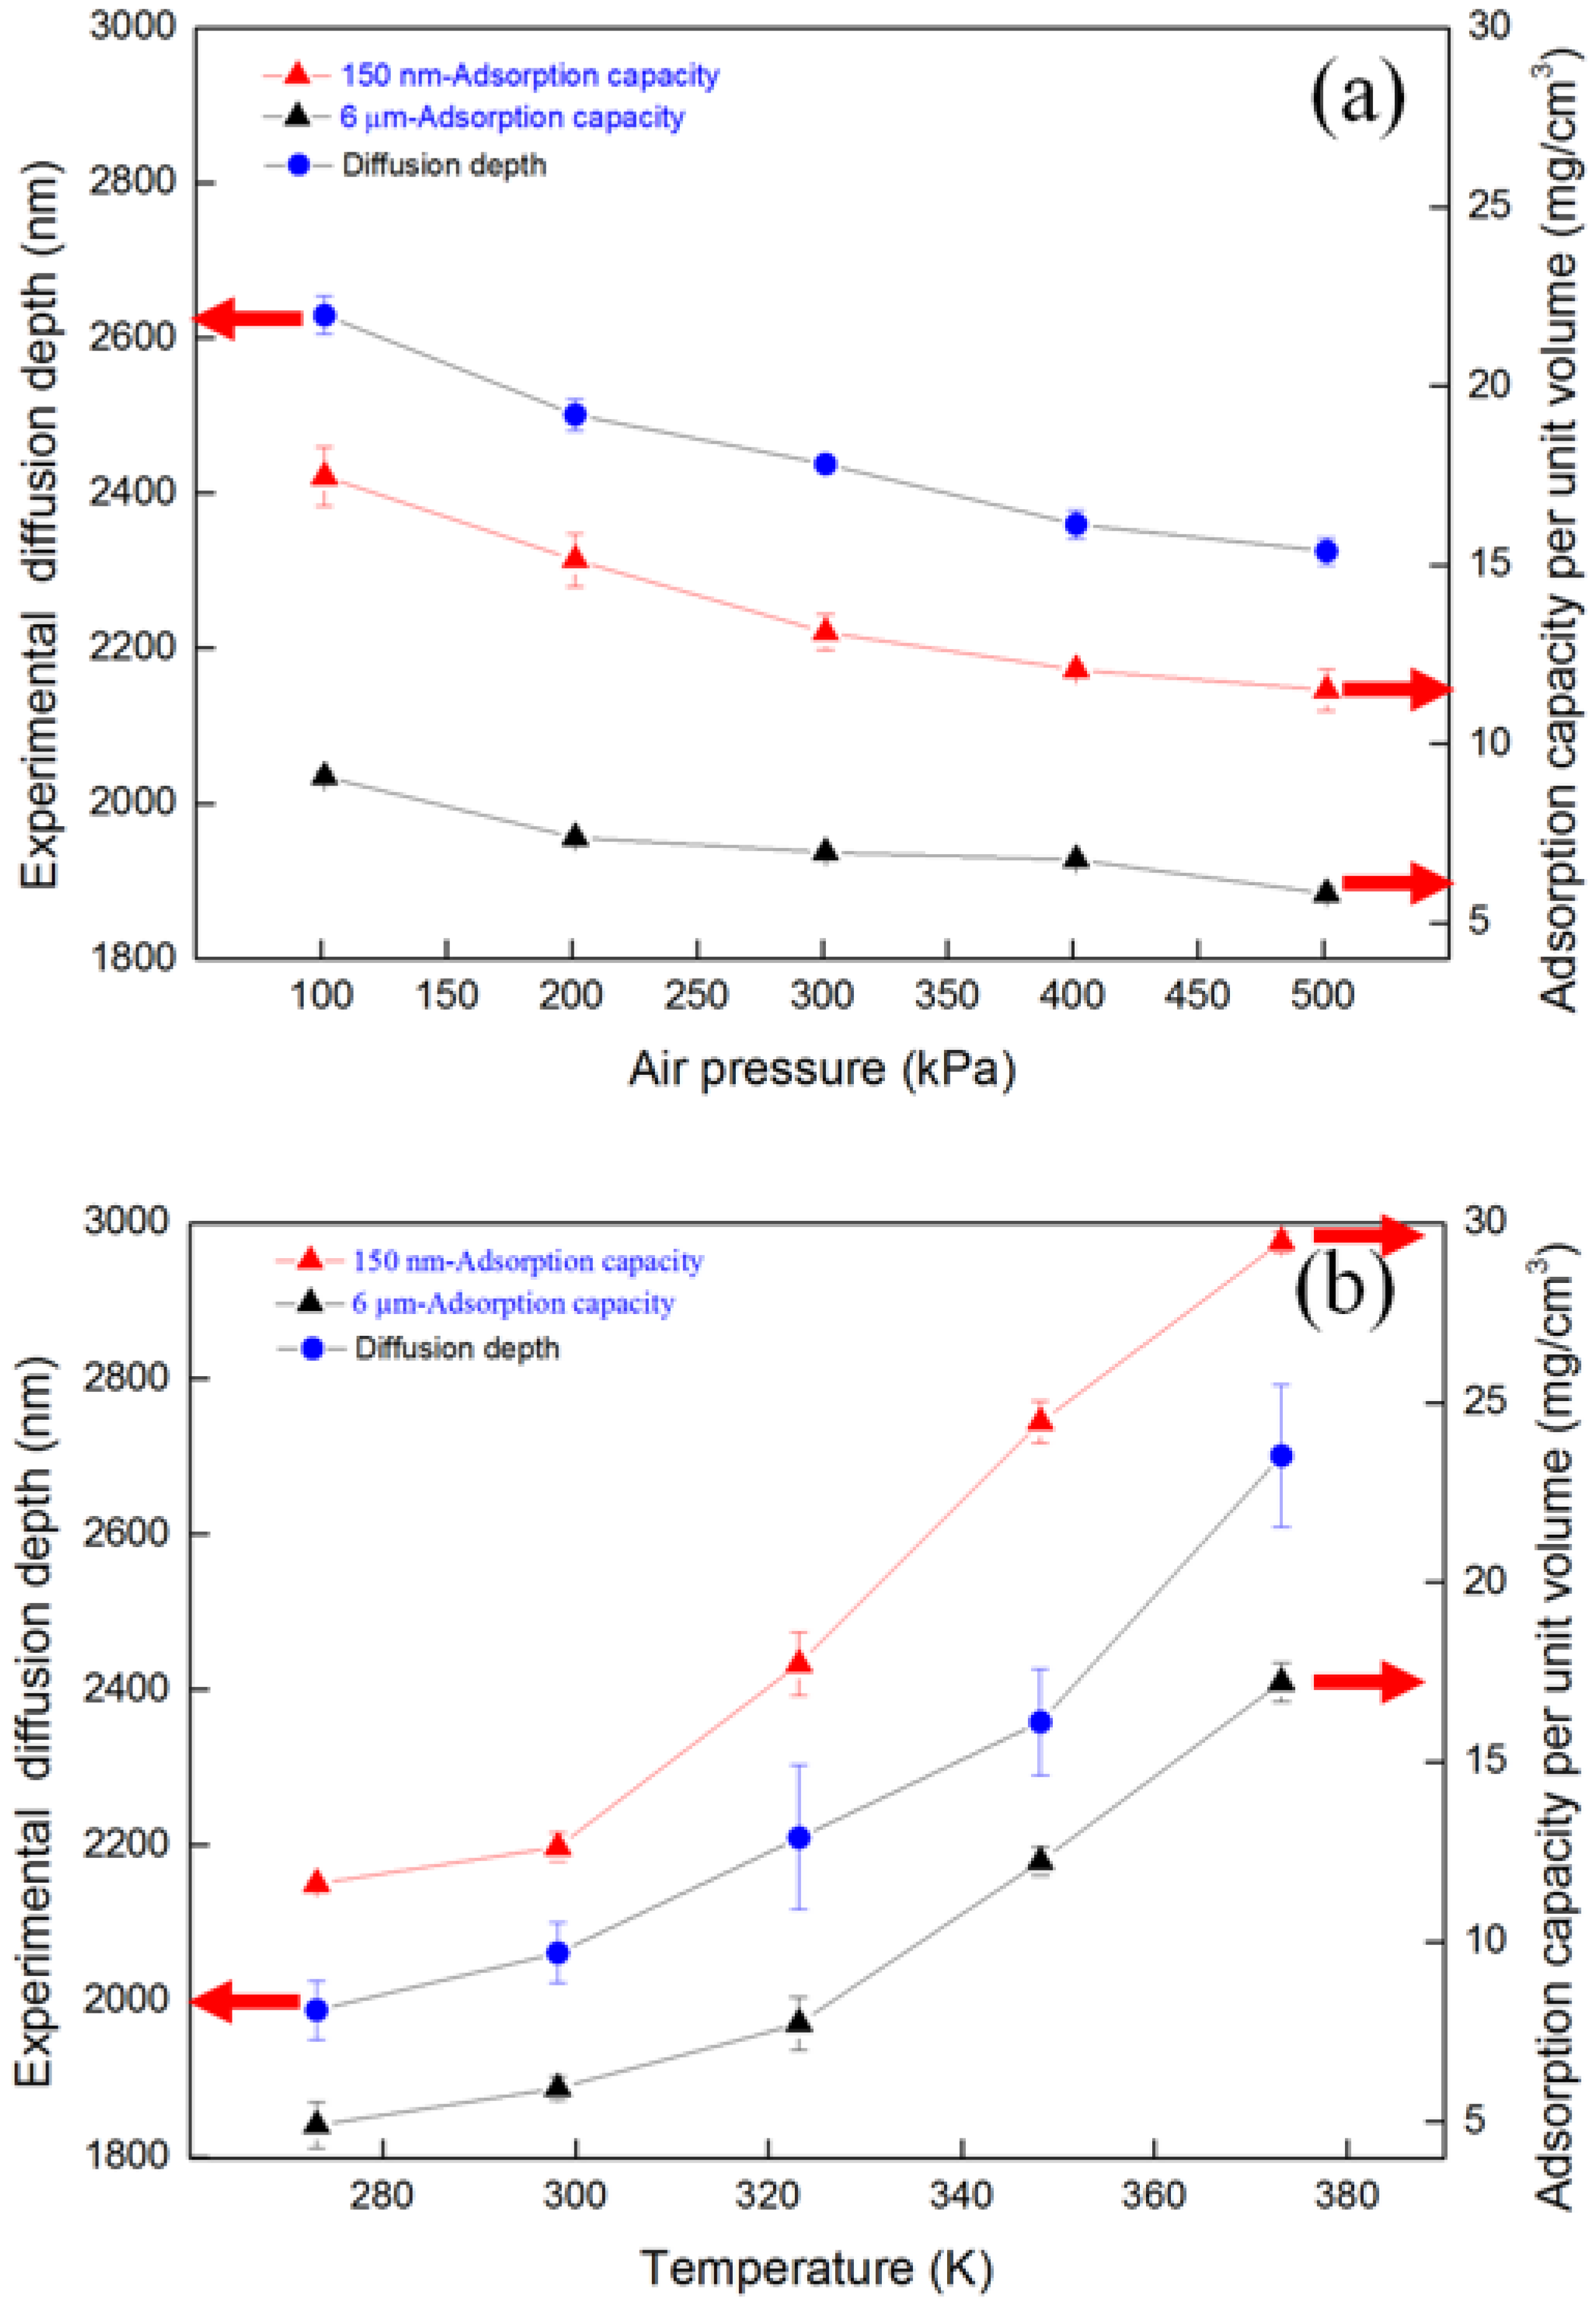
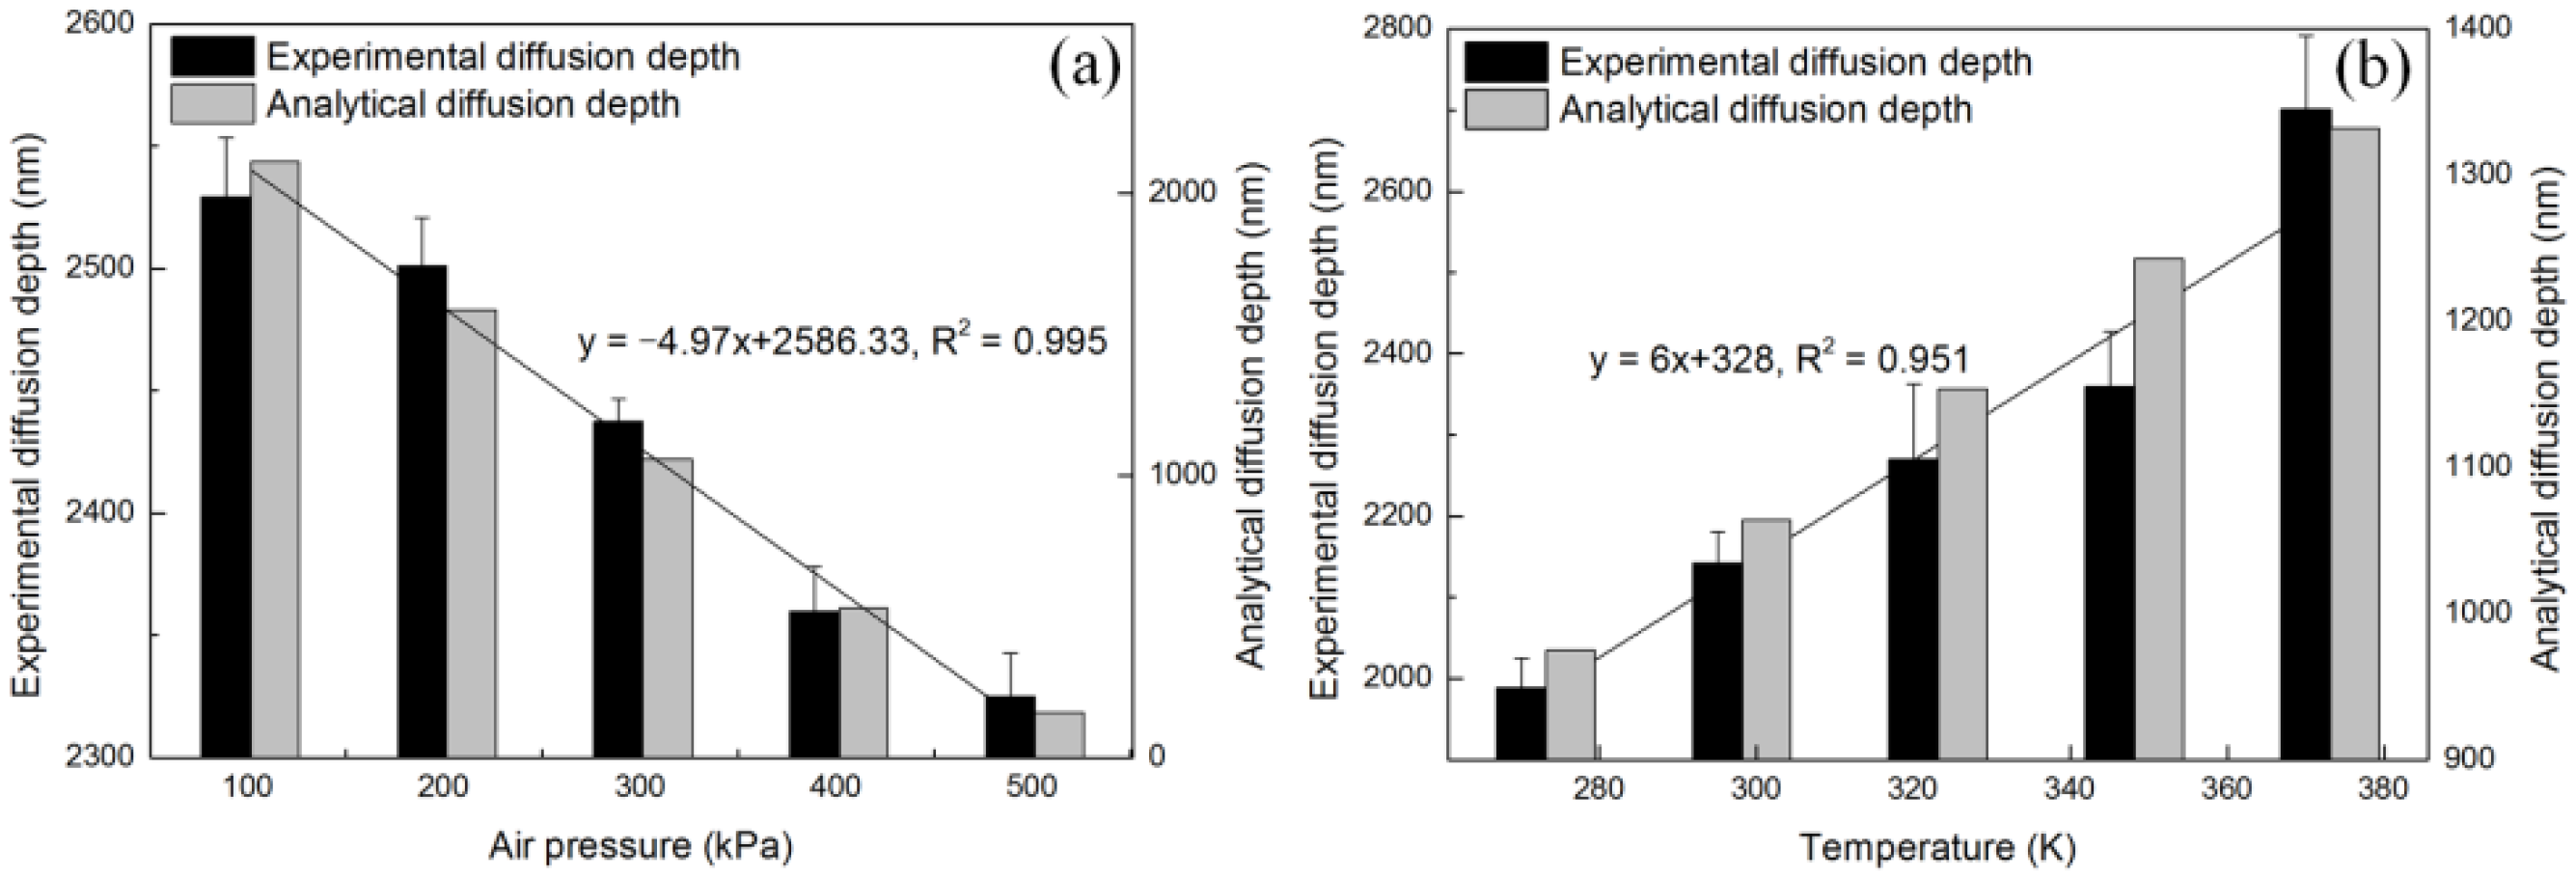
4.2. Diffusion Depth Validation with Adsorption Experiment
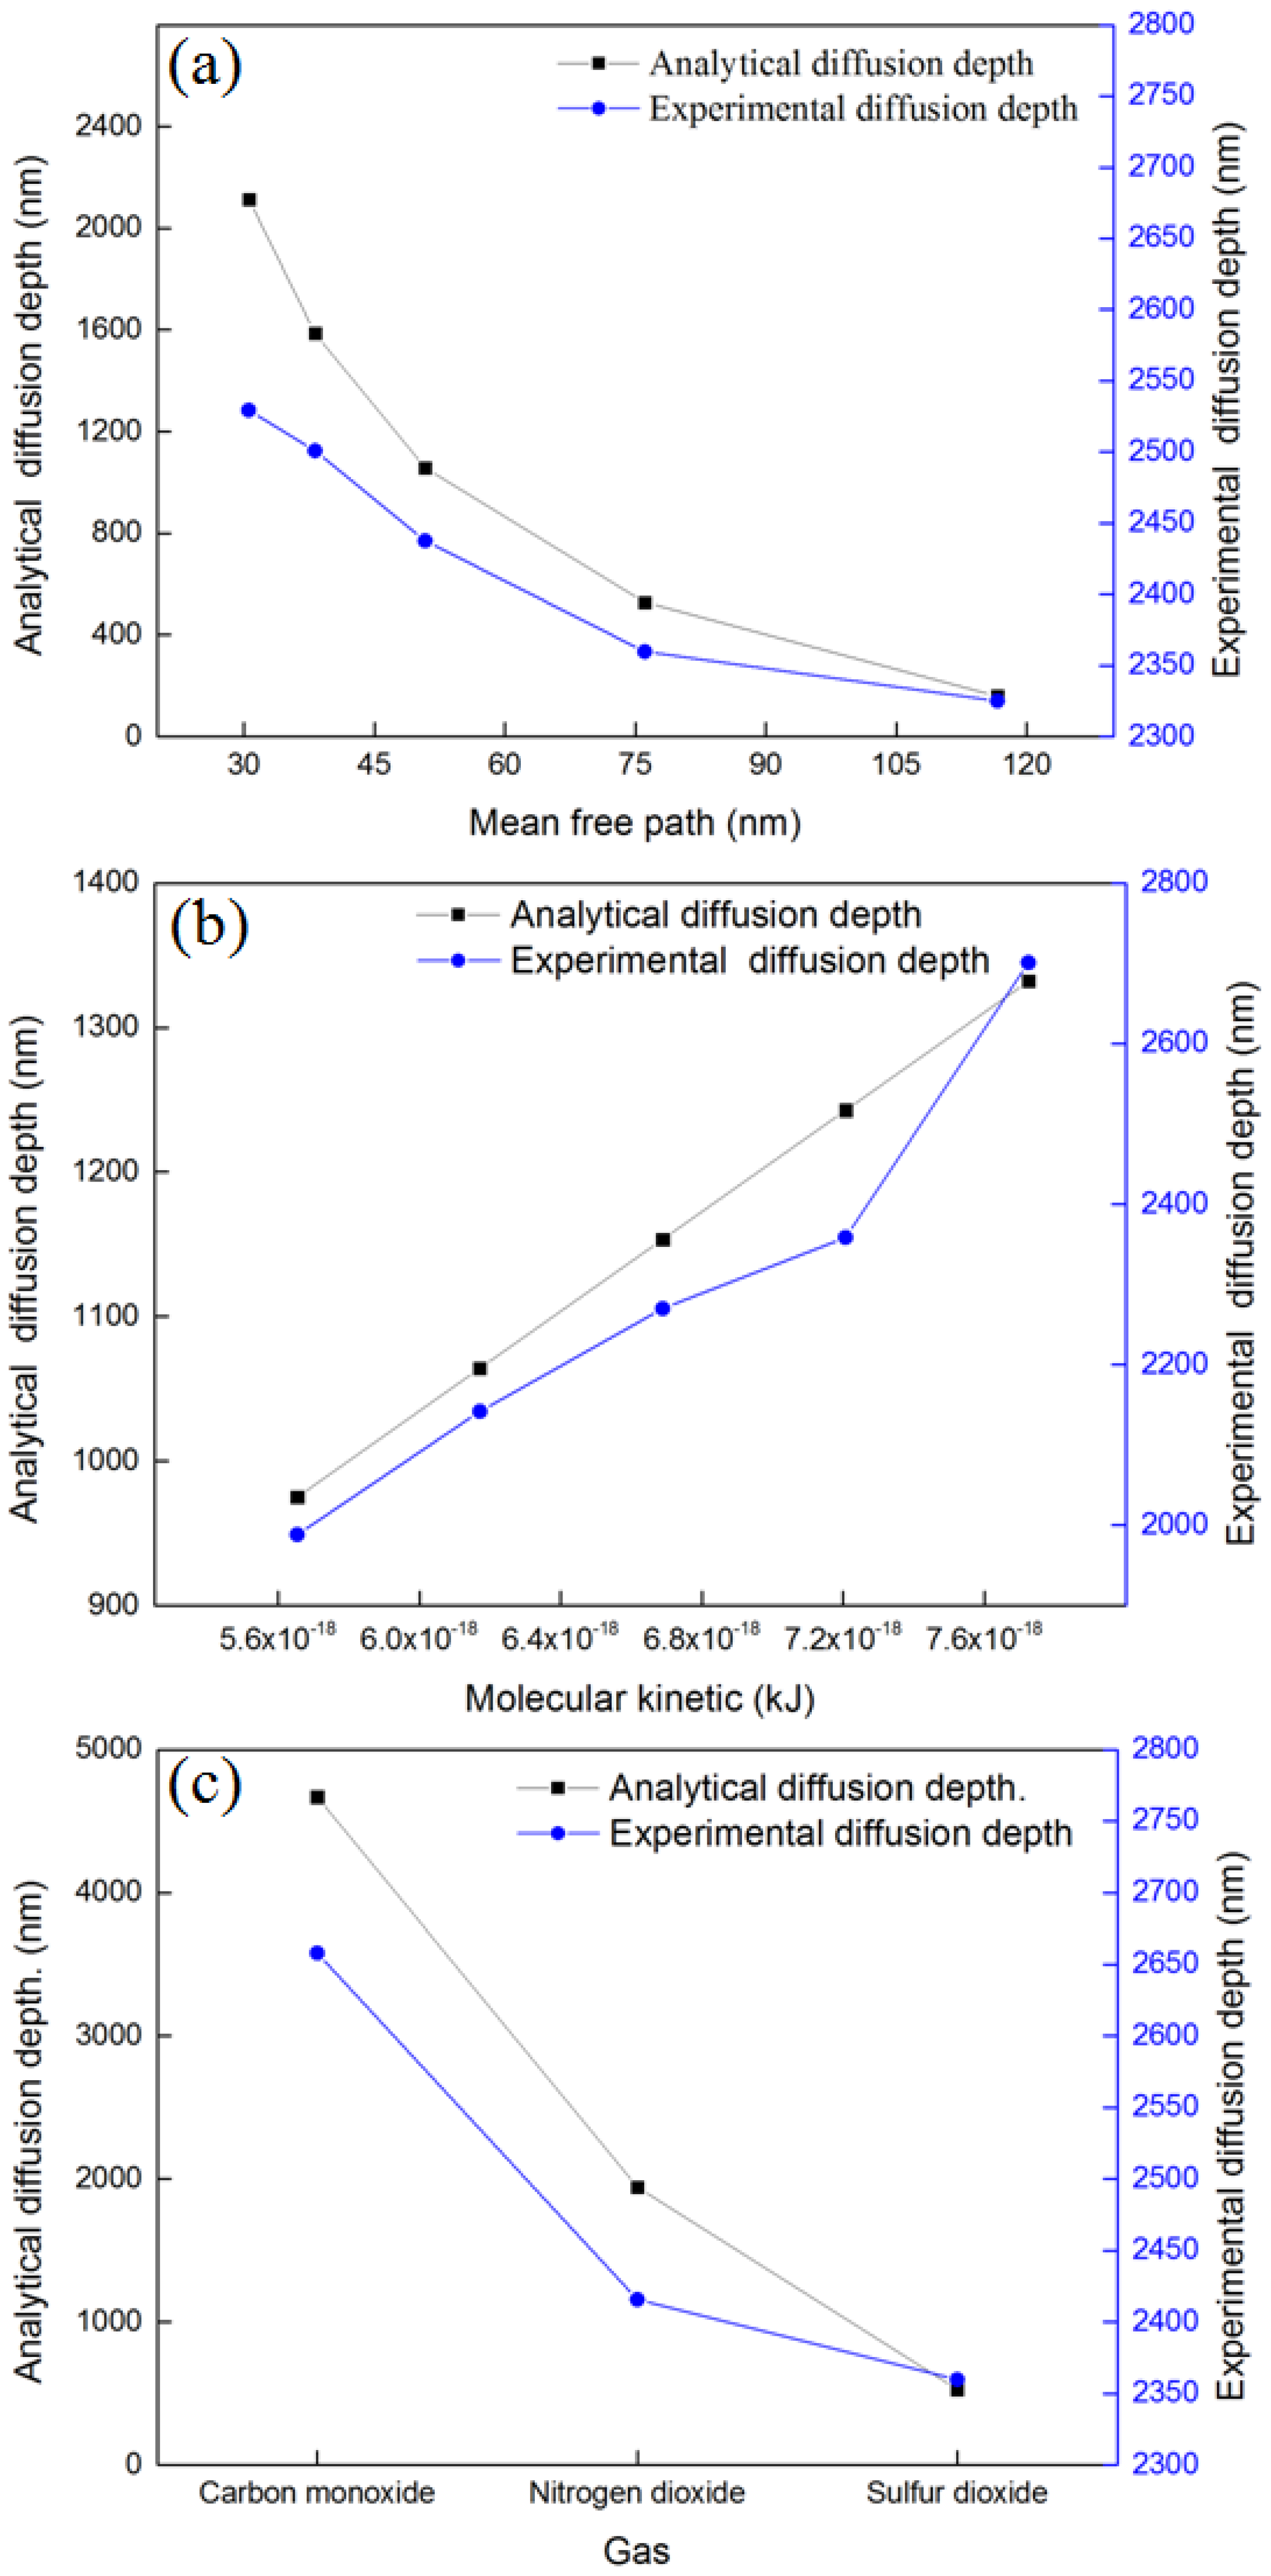
4.3. Effect of Mean Free Path, Molecular Kinetic Energy, and Molecular Polarity
5. Conclusions
Supplementary Materials
Author Contributions
Funding
Informed Consent Statement
Data Availability Statement
Acknowledgments
Conflicts of Interest
References
- Wang, Y.; Diaz, D.F.R.; Chen, K.S.; Wang, Z.; Adroher, X.C. Materials, technological status, and fundamentals of PEM fuel cells—A review. Mater. Today 2020, 32, 178–203. [Google Scholar] [CrossRef]
- Wang, X.X.; Swihart, M.T.; Wu, G. Achievements, challenges and perspectives on cathode catalysts in proton exchange membrane fuel cells for transportation. Nat. Catal. 2019, 2, 578–589. [Google Scholar] [CrossRef]
- St-Pierre, J.; Zhai, Y.; Angelo, M. Quantitative ranking criteria for PEMFC contaminants. Int. J. Hydrog. Energy 2012, 37, 6784–6789. [Google Scholar] [CrossRef]
- Cui, X.; Chen, K.; Xing, H.; Yang, Q.; Krishna, R.; Bao, Z.; Wu, H.; Zhou, W.; Dong, X.; Han, Y.; et al. Pore chemistry and size control in hybrid porous materials for acetylene capture from ethylene. Science 2016, 353, 141–144. [Google Scholar] [CrossRef] [PubMed]
- Cui, X.; Yang, Q.; Yang, L.; Krishna, R.; Zhang, Z.; Bao, Z.; Wu, H.; Ren, Q.; Zhou, W.; Chen, B.; et al. Ultrahigh and Selective SO2 Uptake in Inorganic Anion-Pillared Hybrid Porous Materials. Adv. Mater. 2017, 29, 1606929. [Google Scholar] [CrossRef] [PubMed]
- Tartakovsky, D.M.; Dentz, M. Diffusion in Porous Media: Phenomena and Mechanisms. Transp. Porous Media 2019, 130, 105–127. [Google Scholar] [CrossRef]
- Jacobs, M.H. Diffusion processes. In Ergebnisse der Biologie; Frisch, V.K., Goldschmidt, R., Ruhland, W., Winterstein, H., Eds.; Springer: New York, NY, USA, 1967. [Google Scholar]
- Nakano, Y.; Iwamoto, S.; Yoshinaga, I.; Evans, J.W. The effect of pore necking on Knudsen diffusivity and collision frequency of gas molecules with pore walls. Chem. Eng. Sci. 1987, 42, 1577–1583. [Google Scholar] [CrossRef]
- Burganos, V.N.; Sotirchos, S.V. Knudsen Diffusion in parallel, multidimensional or randomly oriented capillary structures. Chem. Eng. Sci. 1989, 44, 2451–2462. [Google Scholar] [CrossRef]
- Sahimi, M.; Gavalas, G.R.; Tsotsis, T.T. Statistical and continuum models of fluid-solid reactions in porous media. Chem. Eng. Sci. 1990, 45, 1443–1502. [Google Scholar] [CrossRef]
- Keil, F.J. Diffusion and reaction in porous networks. Catal. Today 1999, 53, 245–258. [Google Scholar] [CrossRef]
- Satterfield, C.N. Mass Transfer in Heterogeneous Catalysis; MIT Press: Cambridge, MA, USA, 1970. [Google Scholar]
- Wakao, N.; Smith, J.M. Diffusion in catalyst pellets. Chem. Eng. Sci. 1962, 17, 825–834. [Google Scholar] [CrossRef]
- Froment, G.F.; Bischoff, K.B. Chemical Reactor Analysis and Design, 3rd ed.; Wiley: New York, NY, USA, 1990. [Google Scholar]
- Arbabi, S.; Sahimi, M. Computer simulations of catalyst deactivation—II. The effect of morphological, transport and kinetic parameters on the performance of the catalyst. Chem. Eng. Sci. 1991, 46, 1749–1755. [Google Scholar] [CrossRef]
- Zhang, L.; Seaton, N.A. The application of continuum equations to diffusion and reaction in pore networks. Chem. Eng. Sci. 1994, 49, 41–50. [Google Scholar] [CrossRef]
- Wua, K.; Li, X.; Guo, C.; Chen, Z. Adsorbed Gas Surface Diffusion and Bulk Gas Transport in Nanopores of Shale Reservoirs with Real Gas Effect-Adsorption-Mechanical Coupling. In Proceedings of the Spe Reservoir Simulation Symposium, Houston, TX, USA, 23–25 February 2015. [Google Scholar]
- Evans, J.W.; Abbasi, M.H.; Sarin, A. A Monte Carlo simulation of the diffusion of gases in porous solids. J. Chem. Phys. 1980, 72, 2967–2973. [Google Scholar] [CrossRef]
- Cavka, J.H.; Jakobsen, S.; Olsbye, U.; Guillou, N.; Lamberti, C.; Bordiga, S.; Lillerud, K.P. A new zirconium inorganic building brick forming metal organic frameworks with exceptional stability. J. Am. Chem. Soc. 2008, 130, 13850–13851. [Google Scholar] [CrossRef] [PubMed]
- Han, Y.; Liu, M.; Li, K.; Zuo, Y.; Wei, Y.; Xu, S.; Zhang, G.; Song, C.; Zhang, Z.; Guo, X. Facile synthesis of morphology and size-controlled zirconium metal-organic framework UiO-66: The role of hydrofluoric acid in crystallization. Crystengcomm 2015, 17, 6434–6440. [Google Scholar] [CrossRef]
- Schaate, A.; Roy, P.; Godt, A.; Lippke, J.; Waltz, F.; Wiebcke, M.; Behrens, P. Modulated Synthesis of Zr-Based Metal-Organic Frameworks: From Nano to Single Crystals. Chem. A Eur. J. 2011, 17, 6643–6651. [Google Scholar] [CrossRef] [PubMed]
- Valenzano, L.; Civalleri, B.; Chavan, S.; Bordiga, S.; Nilsen, M.H.; Jakobsen, S.; Lillerud, K.P.; Lamberti, C. Disclosing the Complex Structure of UiO-66 Metal Organic Framework: A Synergic Combination of Experiment and Theory. Chem. Mater. 2011, 23, 1700–1718. [Google Scholar] [CrossRef]
- Wu, H.; Chua, Y.S.; Krungleviciute, V.; Tyagi, M.; Chen, P.; Yildirim, T.; Zhou, W. Unusual and Highly Tunable Missing-Linker Defects in Zirconium Metal-Organic Framework UiO-66 and Their Important Effects on Gas Adsorption. J. Am. Chem. Soc. 2013, 135, 10525–10532. [Google Scholar] [CrossRef] [PubMed]
- Vermoortele, F.; Bueken, B.; Le Bars, G.; Van de Voorde, B.; Vandichel, M.; Houthoofd, K.; Vimont, A.; Daturi, M.; Waroquier, M.; Van Speybroeck, V.; et al. Synthesis Modulation as a Tool To Increase the Catalytic Activity of Metal-Organic Frameworks: The Unique Case of UiO-66(Zr). J. Am. Chem. Soc. 2013, 135, 11465–11468. [Google Scholar] [CrossRef] [PubMed]


| DMF (mL) | Concentration of Reactants (mM) | ZrCl4 (g) | H2BDC (g) | HF (mL) | Eq. of HF | Crystal Size (nm) |
|---|---|---|---|---|---|---|
| 50 | 13.6 | 0.159 | 0.113 | 0 | 0 | 150 |
| 50 | 13.6 | 0.159 | 0.113 | 0.087 | 3 | 6000 |
| Crystal Size μm | Crystal Morphology | BET Surface Area m2/g | Micro-Pore Volume cm3/g | Pore Volume (cm3/g) | Pore Size (nm) |
|---|---|---|---|---|---|
| 0.15 | Small cube | 899 | 0.23 | 0.36 | 0.9 |
| 6 | Large truncated cube | 1235 | 0.36 | 0.55 | 0.9 |
Publisher’s Note: MDPI stays neutral with regard to jurisdictional claims in published maps and institutional affiliations. |
© 2022 by the authors. Licensee MDPI, Basel, Switzerland. This article is an open access article distributed under the terms and conditions of the Creative Commons Attribution (CC BY) license (https://creativecommons.org/licenses/by/4.0/).
Share and Cite
Xu, B.; Qin, H.; Chen, L. Investigation of Molecular Mean Free Path, Molecular Kinetic Energy, and Molecular Polarity Affecting Knudsen Diffusivity along Pore Channels. Separations 2022, 9, 130. https://doi.org/10.3390/separations9050130
Xu B, Qin H, Chen L. Investigation of Molecular Mean Free Path, Molecular Kinetic Energy, and Molecular Polarity Affecting Knudsen Diffusivity along Pore Channels. Separations. 2022; 9(5):130. https://doi.org/10.3390/separations9050130
Chicago/Turabian StyleXu, Bin, Haotian Qin, and Lu Chen. 2022. "Investigation of Molecular Mean Free Path, Molecular Kinetic Energy, and Molecular Polarity Affecting Knudsen Diffusivity along Pore Channels" Separations 9, no. 5: 130. https://doi.org/10.3390/separations9050130
APA StyleXu, B., Qin, H., & Chen, L. (2022). Investigation of Molecular Mean Free Path, Molecular Kinetic Energy, and Molecular Polarity Affecting Knudsen Diffusivity along Pore Channels. Separations, 9(5), 130. https://doi.org/10.3390/separations9050130