Abstract
The aim of this study was to develop a fast RP-HPLC method for simultaneous measurement of two antidiabetic formulations (vildagliptin + remogliflozin and teneligliptin + remogliflozin) under identical experimental conditions. Using the Box–Behnken approach and response surface design, the interaction and quadratic influence of three variable parameters, acetonitrile %, pH of the mobile phase, and flow rate, on resolution between the peaks were optimized. To forecast the resolution of peaks (2.7 and 6.5) for the three anti-diabetic medications, the design space with desirability function was used to find the optimal chromatographic conditions. Isocratic elution with 58:42 acetonitrile and phosphate buffer (20 mM KH2PO4, pH adjusted to 4.9 with orthophosphoric acid) over a Zorabx C18 HPLC column with a flow rate of 1.2 mL min−1 separated all three analytes in 2.5 min. In addition, the optimized HPLC process was validated using ICH recommendations. The devised HPLC method’s precision and accuracy were proven by the low percent relative standard deviation (0.60–1.65%), good percentage recovery (98.18–101.50%), and low percentage relative errors (0.20–1.82%). The method’s robustness was also proven by slightly varying the five separate parameters. Finally, the accuracy of the proposed HPLC approach was confirmed using a standard addition method for simultaneous determination of vildagliptin + remogliflozin and teneligliptin + remogliflozin from formulations. Furthermore, the findings demonstrated that experimental design can be successfully used to optimize chromatographic conditions with fewer runs. The devised HPLC method for simultaneous quantification of two binary combinations utilizing the same chromatographic conditions is fast, accurate, precise, and easy, and it might be utilized in laboratories for routine quality control investigations on both formulations.
1. Introduction
Type 2 Diabetes is a chronic endocrine condition characterized by elevated blood glucose levels with micro and macrovascular complications [1,2,3]. As a result, when compared to monotherapy, treatment with a combination of oral hypoglycemic medications with different mechanisms of action is widely favored for improving glycemic control [4,5]. The combination of dipeptidyl peptidase-4 (DPP-4) inhibitors such as vildagliptin (Figure 1A, VLG) and teneligliptin (Figure 1B, TNG) with the sodium-glucose cotrasportase-2 (SGLT-2) inhibitor, remogliflozin etabonate, (Figure 1C, RGE) has just been approved by the Food and Drug Administration for the treatment of diabetes mellitus type 2 [6,7]. DPP-4 inhibitors increase the secretion of insulin by inhibiting the enzyme DPP-4 responsible for degradation of incretins in the blood, thereby decreasing the blood glucose level by lowering the blood glucagon level, and improving pancreatic cell function [8,9]. DDP-4 inhibitors also lower HbA1c levels without causing hypoglycemia and weight gain [10,11,12]. Further, teneligliptin can be taken in patients with renal failure without dose adjustment [13,14].
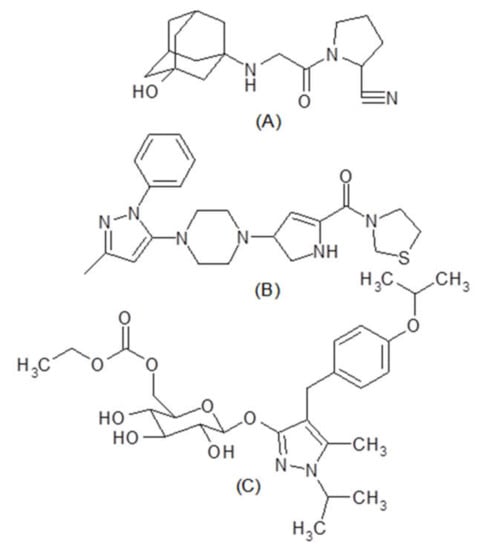
Figure 1.
Chemical structure of vildagliptin (A), teneligliptin (B), and remogliflozin etabonate (C).
The SGLT-2 inhibitor remogliflozin etabonate works by blocking the enzyme SGLT-2 present in the proximal renal tubule, which is responsible for the reabsorption of 90% of glucose from the glomerular filtrate [15]. The blood glucose level is reduced by glycosuria and simultaneously it reduces body weight. Further, SGLT-2 is also safe to use because it reduces renal failure and has cardioprotective properties [16,17,18]. Furthermore, due to their complementary mechanisms of action, the combination of SGLT-2 and DPP-4 inhibitors is useful in treating type 2 diabetes, and no hypoglycemia is reported in patients treated with this unique combination [7,19,20].
For quality control, a suitable analytical approach for assaying these anti-diabetic medicines is necessary. All laboratories are interested in developing easy, rapid, and reliable analytical processes for analyzing pharmaceuticals in various formulations, which can be accomplished by estimating a larger number of medications using a single approach employing the same stationary and mobile phases [21]. For the measurement of remogliflozin alone and in combination with other antidiabetic medications, only a few analytical procedures have been established. The LC-MS [22]. approach was used to determine the amount of REM in plasma. For the determination of REM in combination with metformin, our research team reported UV spectrophotometric methods and HPLC procedures [23,24]. Different analytical methods such as HPTLC [25], UV spectrophotometric [25], HPLC [26,27], and UPLC [28]. methods have also been documented in the literature for the quantification of REM. Several analytical methods for estimating VLD alone and in combination are illustrated in the literature [29,30,31,32,33,34,35], including UV spectrophotometric, HPLC, HPTLC, and LCMS approaches. For simultaneous measurement of teneligliptin and metformin, several UV spectrophotometric [36,37,38], HPTLC [38], and HPLC [39,40,41]. approaches have been reported. The stability-indicating HPLC method with the UPLC-MS technique for identification of degraded products was reported [42]. For the measurement of teneligliptin and its metabolite in plasma, an LC-MS/MS method was devised [43]. One HPLC approach for simultaneous measurement of vildagliptin and remogliflozin has been published, but no internal standard was used, and the analytical duration was long. Furthermore, no analytical method has been reported for the simultaneous determination of remogliflozin and teneligliptin. As a result, the goal of this study is to establish a simple, fast, and reliable RP-HPLC process for quantifying remogliflozin in the presence of vildagliptin and teneligliptin in the formulation using internal standards. Further, a multivariate optimization technique was adopted for optimizing the HPLC parameters. Experimental design with response surface design represents the cumulative effects of all variable parameters of HPLC responsible for the separation of analytes [44,45,46]. Furthermore, multivariate optimization reduces the number of experiments required for optimization, saves time, effort and money. Hence, in the present work Box–Behnken response surface technique [46]. was used to optimize the separation of three antidiabetic medicines from the formulations. Finally, using the optimized HPLC approach, fixed-dose combinations consisting of VLG + RGE and TNG + RGE were estimated simultaneously.
2. Materials and Methods
2.1. Reagents and Standards
Pharmaceutical grade analytes of remogliflozin etabonate, teneligliptin, and vildagliptin were purchased from Biokemix India Ltd. (Hyderabad, India). Analytical grade acetonitrile, potassium dihydrogen phosphate, and ortho-phosphoric acid were procured from Sigma Aldrich (St. Louis, MO, USA). Purified water prepared by Milli-Q (Millipore, Billerica, MA, USA) was used for preparing standard, sample solutions, and phosphate buffer.
2.2. Instrumentation and Chromatographic Condition
Analysis was performed using Agilent high performance liquid chromatographic system (1200 series, Agilent Technologies, Waldbronn, Germany). HPLC system was equipped with degasser, quaternary pump, autosampler, and diode array detector with a personal computer. The UV absorption of analytes was monitored using chem-station software (Agilent Technologies, Ver B 03.04.2). The analytes were separated using a reversed phase C18 HPLC column, Zorbax C18 (100 mm × 4.6 mm, i.d., particle size 5 µm).
2.2.1. Box–Behnken Optimization Configuration
For the study of interaction and quadratic effects of three variable factors, a three-level factorial design with the Box–Behnken approach was used. pH of the mobile phase (3, 4, and 5), percentage of acetonitrile (50%, 55%, and 60%), and flow rate (1, 1.2, and 1.4) are three parameters considered at three levels (−1, 0, and +1). Throughout the trials, the concentration of potassium dihydrogen phosphate (20 mM) and detector wavelength (210 nm) were kept constant. Seventeen tests with five center points were done in random sequence, as suggested by the program (Design Expert Ver. 12), and the mobile phase was pumped for 15 min to achieve complete equilibrium of stationary and mobile phases between the runs. The resolutions between VLG and TNG (RS1) and TNG to RGE (RS2) were calculated as a response. To obtain the optimal chromatographic condition, design space with desirability 1 was used.
2.2.2. Optimized Chromatographic Configuration
The optimal mobile phase is a 58%:42% (v/v) mixture of acetonitrile and 20 mM phosphate buffer (pH adjusted to 4.9 with orthophosphoric acid). The flow rate of the mobile phase was adjusted to 1.2 mL min−1 and the wavelength of the detector was set at 210 nm. The analysis was carried out by injecting 20 µL of analyte solutions at ambient temperature (25 °C).
2.2.3. Robustness Chromatographic Configuration
The robustness of the proposed HPLC method was investigated by slightly varying five parameters: acetonitrile %, mobile phase pH, injection volume, detector wavelength, and flow rate. The analysis was carried out by modifying one parameter at a time while maintaining the optimal state of the other. The variations in the conditions are volume of acetonitrile by 58 ± 2% (v/v), pH of the mobile by 4.9 ± 0.2, injection volume by 20 ± 0.1 µL, wavelength by 210 ± 2 nm, and flow rate by 1.2 ± 0.1 mL.
2.3. Preparation of Standard Solutions
Reference standard solutions of RGE, VLG, and TNG were prepared by transferring 100 mg of analytes separately into 100 mL volumetric flasks. VLG and TNG were dissolved in water, whereas RGE was dissolved in methanol to get 1 mg mL−1 solution. By diluting the aforementioned solution with mobile phase, a working standard solution of 200 µg mL−1 was prepared.
2.4. Procedure for the Calibration Curve
Transferring the required quantity of VLG and RGE stock solutions (200 µg mL−1) into a 10 mL volumetric flask obtained working standard solutions containing 5–100 µg mL−1 of VLG and RGE. As an internal standard, sufficient TNG was added to all standard solutions to achieve a concentration of 25 µg mL−1. Similarly, working standard solutions comprising of 5–100 µg mL−1 RGE and 2–60 µg mL−1 TNG, as well as 50 µg mL−1 VLG as an internal standard, were prepared. Triplicate injections of the solutions were made, and chromatograms were recorded. Peak area ratios for analytes were computed, and a calibration curve was built against each concentration. The corresponding linear curves were used to generate regression equations and coefficients.
2.5. Preparation of Sample Solutions
Formulation 1: Twenty tablets (VLG 50 mg and RGE 100 mg) were weighed and grounded into a powder. The powder equivalent to a 10 mg of VLG and 20 mg of RGE was transferred into a 10 mL volumetric flask consisting of 50 mL of methanol. The solution was sonicated for 15 min to dissolve the analytes, then filtered through Whatman filter paper into another 10 mL volumetric flask, the residue was washed with fresh methanol, and the final volume of adjusted to 10 mL using methanol. Further, the required quantity of aforesaid solutions was diluted with mobile phase to get the concentration of the analytes in the calibration range and IS TNG (25 µg mL−1) solution was added before injecting 20 µL of solution into the HPLC system for analysis.
Formulation 2: Fixed-dose combination of RGE and TNG was not available in the local market, hence, separate tablets consisting of 100 mg of RGE and 10 mg of TNG were weighed separately and powdered together. The powder equivalent to 10 mg of RGE and 1 mg of TNG was weighed and a sample solution was prepared implementing the above procedure. Before injecting 20 µL of solution into the HPLC system for analysis, the needed quantity of aforesaid solutions was diluted with mobile phase to get the concentration of the analytes in the calibration range, and IS VLG (50 µg mL−1) solution was added.
3. Results and Discussions
3.1. Optimization of Chromatographic Conditions
For well-separated symmetric peaks, the mobile phase composition must be optimized. The traditional optimization entails changing one factor at a time while keeping the other factors constant; this does not account for the combined effects of other variable parameters involved in analyte separation. It also necessitates a greater number of experiments and is time-consuming. As a result, we investigated using a multivariate optimization technique such as response surface methodology (RSM), which evaluates the relative effects of different variable parameters [45,46]. It also requires fewer experiments and takes less time. RSM generates useful data and statistically useful information about the interaction of multiple chromatographic parameters. A three-level, three-factor Box–Behnken design (BBD) was used for the experimental design [46]. The percentage of acetonitrile, the pH of the mobile phase, and the flow rate were the three factors evaluated for the optimization of chromatographic conditions, with the resolution between the peaks as the response. The pH of the mobile phase was maintained with a potassium dihydrogen phosphate (20 mM) buffer. An acidic pH was chosen based on the pKa values of VLG (9.03), RGE (6.8), and TNG (8.7) to improve analyte ionization and retention time. To ionize the analytes, the pH of the phosphate buffer was adjusted to 3, 4, and 5 with ortho-phosphoric acid. Acetonitrile was used as an organic modifier because it provides a good peak appearance and fast analyte elution. To develop a rapid analytical method with good resolution between the peaks, 100 mm C18 RP HPLC column with 50%, 55%, and 60% of acetonitrile in the mobile phase and flow rates of 1.0, 1.2, and 1.4 were selected to optimize the chromatographic condition by BBD. Seventeen experiments were performed in random order with five center points as suggested by the Design-Expert program for BBD (Table 1). The resolution between the first two peaks of VLG and TNG (RS1) and the second and third peaks of TNG and RGE (RS2) were computed, and 3D response surfaces were created.

Table 1.
Seventeen experiments suggested by BBD for optimization of chromatographic conditions.
As indicated by the Design Expert program, the effect of variable parameters on the resolution was described as a polynomial equation with the quadratic model (Equation (1))
where Y is the resolution between the peaks, β0 is the constant, β1 to β9 are the regression coefficient values of the three variable factors acetonitrile percentage (X1), pH of the mobile phase (X2), and flow rate (X3). X12, X22, and X32 are quadratic terms of each factor and X1X2,
X1X3, and X2X3 indicate the interaction between the factors.
The regression coefficient values are shown in Table 2 together with their corresponding p-values (p < 0.05). The results showed that each of the three variables had a considerable impact on the resolution between the peaks. It was evident from the results that, all three variables had a significant influence on the resolution between the peaks (p < 0.05). On both RS1 and RS2, the first-order influence of acetonitrile %, flow rate, and pH of the mobile phase, as well as the quadratic influence of flow rate and pH of the mobile phase, were very significant (p < 0.001). The percentage of acetonitrile and the flow rate had a detrimental influence on the resolution between VLG and TNG, although the pH of the mobile phase had a positive impact. The resolution between TNG and RGE was negatively affected by all three variables. Furthermore, the estimated F value for the model was 62.92 and 118.94 for RS1 and RS2, respectively, along with p-values less than 0.05, indicating a significant model.
Table 2.
Quadratic equation coefficients with related probability values (p-values) for peak resolution.
The coefficients of parameters fit the model effectively, with strong R2 values for resolution factors (0.9878 for RS1 and 0.9931 for RS2). Further, the predicted R2 valve 0.8971 is in agreement with the adjusted R2 value 0.9721 for RS1 whereas the predicted R2 value 0.8995 is in agreement with the adjusted R2 value 0.9852. Further, the adequate precision for RS1 and RS2 was found to be 26.3176 and 38.3854, respectively, which is more than 4, indicating that this model can be utilized to navigate design space. The response surface model (Figure 2) exhibited that a decrease in the amount of acetonitrile with a decrease in the pH reduced the resolution between VLG and TNG, and the resolution was less than 2. Good resolution between TNG and RGE peaks was observed with an increase in the amount of acetonitrile and pH. The mobile phase flow rate of 1 mL min−1 produced good resolution but took more than 3 min to analyze, whereas the resolution between VLG and TNG was less than 2 with a flow rate of 1.4 mL min−1.
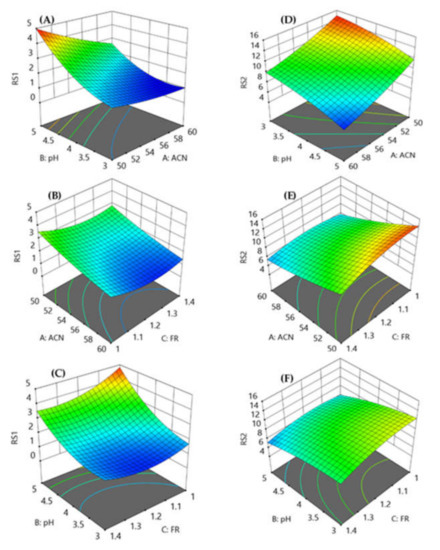
Figure 2.
Response surface models showing the effect of percentage of acetonitrile, pH of the mobile phase and flow rate on the resolution between VLG to TNG (A–C) and TNG to RGE (D–F).
All response models fit into the quadratic polynomial model (Table 2) and Figure 3 shows that predicted versus actual resolution values are close to each other and on the diagonal line, demonstrating that the model adequately fits the data. Furthermore, to develop a rapid HPLC method with good resolution and peak symmetry, resolution between the first two peaks was set at a target value of 2.7, and resolution between the second and third peaks was set at a target value of 6.5 in the design space. Finally, the optimal chromatographic condition selected by the design space with desirability value of 0.996, which is close to 1, was acetonitrile 58%, pH 4.9, and flow rate 1.2 (Figure 4).
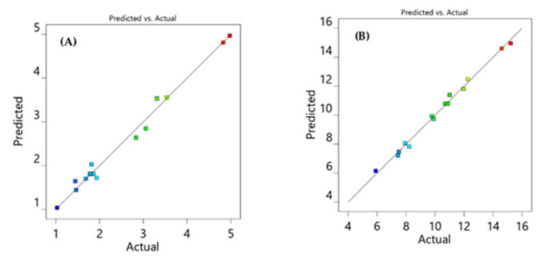
Figure 3.
Diagnostic plots showing the predicted against actual values for resolution between VLG to TNG (RS1) (A) and TNG to RGE (RS2) (B).
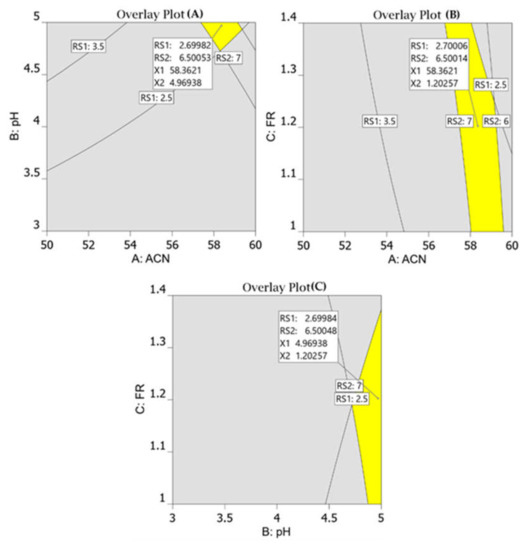
Figure 4.
Overlay plots for optimum chromatographic conditions suggested by the Design-Expert software. The perctentage of acetonitrile against pH of mobile phase (A); flow rate against % of acetonitrile (B); flow rate against pH of the mobile phase (C).
The proposed chromatographic condition was validated using a mobile phase of acetonitrile: phosphate buffer (pH 4.9) in a ratio of 58%: 42% (v/v) with a flow rate of 1.2 mL min−1 in five experiments. The average resolution between VGE and TNG was 2.71 compared to the projected value of 2.7, while the average resolution between TNG to RGE was 6.49 compared to the predicted value of 6.5. All three analytes were separated within 2.5 min with acceptable resolution and peak shape (Figure 5). As a result, for assessing standard and formulation solutions, optimum chromatographic conditions were used.
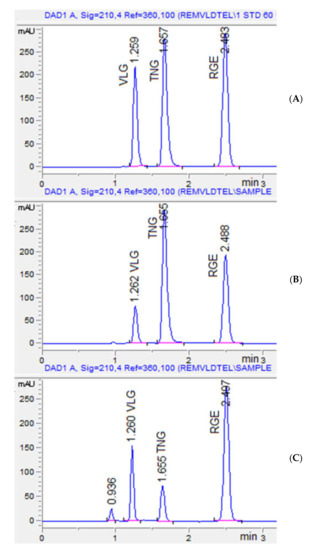
Figure 5.
Representative chromatograms for standard (A), VLG + RGE formulation with IS TNG (B), and TNG+ RGE with IS VLG (C). The retention time of VLG was 1.26 min, TNG: 1.65 min, and RGE: 2.48 min. The peak at 0.936 is Ferric oxide yellow present in the TNG tablet coating.
3.2. Validation of the Proposed HPLC Method
3.2.1. System Suitability Test
A system suitability test was carried out to ensure that the chromatographic technique was suitable and effective for the analysis of the analytes. Retention time, peak area, peak symmetry, resolution, and theoretical plate number per meter were evaluated as system appropriateness factors. For the system suitability test standard solution consisting of 20 µg mL−1 of VLG, 40 µg mL−1 RGE, and 10 µg mL−1 TNG were injected in six replicates. Table 3 shows the results of the analysis in six replicates, as well as the percentage relative standard deviation determined and tabulated. For retention time and peak area, the percentage RSD was less than 2. The peak symmetry, resolution, and theoretical plate number per meter, were found to be close to 1, above 2, and more than 2000, respectively.
Table 3.
System suitability and regression analysis results.
3.2.2. Linearity
The linearity of the analytes was determined by analyzing two series of solutions in the concentration range of 5–100 µg mL−1 for VLG and RGE and 5–100 µg mL−1 of RGE and 2–60 µg mL−1 for TNG. (Figure S1 and S2). For the binary mixture of VLG and RGE, TNG (25 µg mL−1) was employed as an internal standard, whereas for the TNG and RGE binary mixture, 50 µg mL−1 of VLG was utilized as an internal standard. Peak area ratios were calculated from the chromatograms, and a calibration curve was built against the corresponding analyte concentration (Figure S3 and S4). Table 3 contains additional regression equations derived from the linearity graph. The regression coefficient values are close to 1 (R2 > 0.999), indicating a good regression analysis.
3.2.3. Limits of Detection and Quantification
Limits of detection (LOD) and limits of quantification (LOQ) were calculated by using the signal to noise ratio of the chromatogram. LOD is 3.3 times and LOQ is 10 times the signal to noise ratio of a chromatogram. Chromatograms were recorded by injecting different concentrations of analytes in the range of 0.25 µg mL−1 to 5 µg mL−1 in triplicate and average peak heights were recorded. A blank chromatogram was recorded by injecting the mobile phase, and the average noise was calculated and compared with the analytes chromatograms to calculate the LOD and LOQ. The sensitivity of the proposed HPLC method was confirmed by the low LOD and LOQ (Table 3).
3.2.4. Precision and Accuracy
The precision of the proposed method was evaluated by within-day repeatability by analyzing the three different concentrations (Low, Medium, and High) covering the entire calibration range in triplicate. Further, between-day precision was performed by analyzing the above solutions for three successive days. Precision was expressed as a percentage relative standard deviation, which was found to be less than two for both within and between-day precision confirming the precision of the HPLC method. (Table 4) Accuracy of the method was expressed as percentage assay and percentage relative error, which was found to be in the range of 98.18–101.50% and less than ±1.82% respectively, confirming the accuracy of the proposed HPLC method (Table 4).
Table 4.
Precision and accuracy results.
3.2.5. Robustness Study
If the analysis result is not affected by the small changes in the experimental conditions, the analytical method is robust. The robustness of the proposed HPLC method was investigated by slightly varying five parameters: acetonitrile %, mobile phase pH, injection volume, detector wavelength, and flow rate. The peak area of analytes determines the assay results, hence, peak area has been considered to determine the influence of changes in the experimental condition. The resolution between the peaks is important for the baseline separation; hence resolution was also determined with slight changes in the experimental conditions. The analysis was carried out by injecting a standard solution containing 25 µg mL−1 of each analyte in six replicates and the peak area with standard deviation was tabulated in Table 5. The peak area and resolution did not change even when the experimental conditions were changed slightly, indicating the robustness of the proposed HPLC method. A one-way ANOVA test was applied to the different parameters’ results and F values at p = 0.05 were recorded. The calculated F values were lower than the critical F value at p = 0.05, indicating no statistically significant difference was observed in the analysis results with a slight change in the experimental condition.
Table 5.
Robustness study results.
3.3. Application to the Formulation and Recovery Study
The proposed RP-HPLC method was used to estimate VLG + RGE and TNG + RGE simultaneously from the respective formulations. Assay findings of both formulations were precise, and the amount of analytes corresponds to the label claim (Table 6). This has been confirmed from percentage recovery and% RSD. The accuracy was further confirmed by the recovery study using the standard addition approach. The previously analyzed formulation solution was spiked with known amounts of standard analyte solutions at three levels (50%, 100%, and 150%) and evaluated. The percentage recovery was found to be in the range of 98–102% with a very low% RSD (Table 6). The good percentage recovery of the added analyte confirmed the specificity of the developed HPLC method. Further comparison of chromatograms of blank, standard, and sample showed no interfering peaks appeared due to formulation excipients at the retention time of analytes (Figure 5). However, degradation products and other impurities were not determined in the present work; this is the limitation of this method.
Table 6.
Analysis results of drugs from formulations and standard addition method by optimized HPLC method.
4. Conclusions
In the present study, a rapid and simple RP HPLC method was developed for concurrent quantification of two antidiabetic formulations consisting of VLG + RGE and TNG + RGE, using the same chromatographic conditions. Furthermore, Box–Behnken methodology, one of the three-level factorial experimental designs, was applied to optimize critical chromatographic conditions. The response surface models were analyzed and statically validated to predict the resolution between the peaks. In addition, the results demonstrated that experimental design could be successfully used for chromatographic condition optimization with few runs. The developed HPLC method for simultaneous quantification of two binary combinations utilizing the same chromatographic conditions is fast, accurate, precise, and easy, and it might be utilized in laboratories for routine quality control investigations on both formulations.
Supplementary Materials
The following are available online at https://www.mdpi.com/article/10.3390/separations9020023/s1. Figure S1: Chromatograms of standards VLG + RGE (5–100 µg/ml) with TNG as IS (25 µg/ml); Figure S2: Chromatogram of standard solutions of TNG (2–60 µg/ml) + RGE (5–100 µg/ml) with VLG as IS (50 µg/ml); Figure S3: Calibration curve for VLG and RGE using TNG as internal standard; Figure S4: Calibration curves for TNG and RGE using VLG as internal standard.
Author Contributions
Conceptualization, N.S.; data curation, K.N.V.; formal analysis, M.A., K.N.V., A.B.N. and P.K.D.; funding acquisition, M.A.; investigation, K.N.V., N.S. and P.K.D.; methodology, M.A., K.N.V., N.S., A.B.N. and P.K.D.; project administration, N.S.; resources, P.K.D.; supervision, M.A.; validation, M.A., K.N.V., A.B.N. and P.K.D.; visualization, N.S.; writing—original draft, M.A. and A.B.N.; writing—review and editing, M.A., K.N.V., N.S., A.B.N. and P.K.D. All authors have read and agreed to the published version of the manuscript.
Funding
The authors are thankful to the Deanship of Scientific Research, King Faisal University, Al-Ahsa, Saudi Arabia for financial support under the Group project (Grant #1811018). The APC was funded by the Deanship of Scientific Research, King Faisal University, Al-Ahsa.
Institutional Review Board Statement
Ethical approval is not required for this study.
Informed Consent Statement
The study did not require an Informed Consent Statement.
Data Availability Statement
The data generated during this work were included in the manuscript and submitted as Supplementary Materials.
Acknowledgments
This work was supported through the Group Funding track by the Deanship of Scientific Research, Vice Presidency for Graduate Studies and Scientific Research, King Faisal University, Saudi Arabia.
Conflicts of Interest
The authors declare that they have no known competing financial interests or personal relationships that could have appeared to influence the work reported in this paper.
References
- Chatterjee, S.; Khunti, K.; Davies, M.J. Type 2 diabetes. Lancet 2017, 389, 2239–2251. [Google Scholar] [CrossRef]
- Mouhayyar, C.; Riachy, R.; Khalil, A.B.; Eid, A.; Azar, S. SGLT2 inhibitors, GLP-1 agonists, and DPP-4 inhibitors in diabetes and microvascular complications: A review. Int. J. Endocrinol. 2020, 2020, 1762164. [Google Scholar] [CrossRef] [PubMed]
- Cade, W.T. Diabetes-related microvascular and macrovascular diseases in the physical therapy setting. Phys. Ther. 2008, 88, 1322–1335. [Google Scholar] [CrossRef] [PubMed]
- Abdul-Ghani, M.A.; Puckett, C.; Triplitt, C.; Maggs, D.; Adams, J.; Cersosimo, E.A.; DeFronzo, R. Initial combination therapy with metformin, pioglitazone and exenatide is more effective than sequential add-on therapy in subjects with new-onset diabetes. Results from the Efficacy and Durability of Initial Combination Therapy for Type 2 Diabetes (EDICT). Diabetes Obes. Metab. 2015, 17, 268–275. [Google Scholar] [CrossRef]
- American Diabetes Association. 9. Pharmacologic approaches to glycemic treatment: Standards of medical care in diabetes-2020. Diabetes Care. 2020, 43, S98–S110. [Google Scholar] [CrossRef]
- Son, C.; Makino, H.; Kasahara, M.; Tanaka, T.; Nishimura, K.; Taneda, S.; Nishimura, T.; Kasama, S.; Ogawa, Y.; Miyamoto, Y.; et al. Comparison of efficacy between dipeptidyl peptidase-4 inhibitor and sodium–glucose cotransporter 2 inhibitor on metabolic risk factors in Japanese patients with type 2 diabetes mellitus: Results from the CANTABILE study. Diabetes Res. Clin. Pr. 2021, 180, 109037. [Google Scholar] [CrossRef] [PubMed]
- Ahsan, S. Abstract #1004069: Effectiveness of remogliflozin and vildagliptin combination in type 2 diabetes mellitus patients uncontrolled on triple oral drug therapy. Endocr. Pr. 2021, 27, S62. [Google Scholar] [CrossRef]
- Vella, A. Mechanism of Action of DPP-4 Inhibitors—New Insights. J. Clin. Endocrinol. Metab. 2012, 97, 2626–2628. [Google Scholar] [CrossRef] [PubMed]
- Mak, W.Y.; Nagarajah, J.R.; Halim, H.A.; Ramadas, A.; Pauzi, Z.M.; Pee, L.T.; Jagan, N. dipeptidyl peptidase-4 inhibitors use in type II diabetic patients in a tertiary hospital. J. Pharm. Policy Pr. 2020, 13, 1–8. [Google Scholar] [CrossRef]
- Baksh, S.N.; Segal, J.B.; McAdams-DeMarco, M.; Kalyani, R.R.; Alexander, G.C.; Ehrhardt, S. dipeptidyl peptidase-4 inhibitors and cardiovascular events in patients with type 2 diabetes, without cardiovascular or renal disease. PLoS ONE 2020, 15, e0240141. [Google Scholar] [CrossRef]
- Kawanami, D.; Takashi, Y.; Takahashi, H.; Motonaga, R.; Tanabe, M. Renoprotective effects of DPP-4 inhibitors. Antioxidants 2021, 10, 246. [Google Scholar] [CrossRef] [PubMed]
- Bhavadasan, K.; Davis, A.M.; Kolanthavel, B. Impact of dipeptidyl peptidase-4 inhibitors on glycemic control and Cardiovascular safety with adherence: An overview. Int. J. Diabetes Metab. 2019, 25, 90–99. [Google Scholar] [CrossRef]
- Li, X.; Huang, X.; Bai, C.; Qin, D.; Cao, S.; Mei, Q.; Ye, Y.; Wu, J. Efficacy and safety of teneligliptin in patients with type 2 diabetes mellitus: A systematic review and meta-analysis of randomized controlled trials. Front. Pharmacol. 2018, 9, 449. [Google Scholar] [CrossRef] [PubMed]
- Erande, S.; Sarwardekar, S.; Desai, B. QT/QTc safety and efficacy evaluation of teneligliptin in Indian type 2 diabetes mellitus patients: The “thorough QT/QTc” study (Q-SET study). Diabetes Metab. Syndr. Obes. 2019, 12, 961–967. [Google Scholar] [CrossRef] [PubMed]
- Joshi, S.S.; Singh, T.; Newby, D.E.; Singh, J. Sodium-glucose co-transporter 2 inhibitor therapy: Mechanisms of action in heart failure. Heart 2021, 107, 1032–1038. [Google Scholar] [CrossRef] [PubMed]
- Nelinson, D.S.; Sosa, J.M.; Chilton, R.J. SGLT2 inhibitors: A narrative review of efficacy and safety. J. Osteopat. Med. 2021, 121, 229–239. [Google Scholar] [CrossRef]
- Tentolouris, A.; Vlachakis, P.; Tzeravini, E.; Eleftheriadou, I.; Tentolouris, N. SGLT2 inhibitors: A review of their antidiabetic and cardioprotective effects. Int. J. Environ. Res. Public Health 2019, 16, 2965. [Google Scholar] [CrossRef]
- Bonora, B.M.; Avogaro, A.; Fadini, G.P. Extraglycemic Effects of SGLT2 Inhibitors: A review of the evidence. Diabetes, Metab. Syndr. Obes. 2020, 13, 161–174. [Google Scholar] [CrossRef]
- Scheen, A.J. Pharmacokinetic Characteristics and Clinical Efficacy of an SGLT2 inhibitor plus DPP-4 inhibitor combination therapy in type 2 diabetes. Clin. Pharmacokinet. 2017, 56, 703–718. [Google Scholar] [CrossRef]
- Lingvay, I. Sodium glucose cotransporter 2 and Dipeptidyl Peptidase-4 inhibition: Promise of a dynamic duo. Endocr. Pr. 2017, 23, 831–840. [Google Scholar] [CrossRef]
- Attimarad, M.; Venugopala, K.; Sreeharsha, N.; Chohan, M.; Shafi, S.; Nair, A.; Pottathil, S. A rapid HPLC method for the concurrent determination of several antihypertensive drugs from binary and ternary formulations. Separations 2021, 8, 86. [Google Scholar] [CrossRef]
- Sigafoos, J.F.; Bowers, G.D.; Castellino, S.; Culp, A.G.; Wagner, D.S.; Reese, M.J.; Humphreys, J.E.; Hussey, E.K.; Semmes, R.L.O.; Kapur, A.; et al. Assessment of the drug interaction risk for remogliflozin etabonate, a sodium-dependent glucose cotransporter-2 inhibitor: Evidence from in vitro, human mass balance, and ketoconazole interaction studies. Drug Metab. Dispos. 2012, 40, 2090–2101. [Google Scholar] [CrossRef] [PubMed]
- Attimarad, M.; Nair, A.; Sreeharsha, N.; Al-Dhubiab, B.; Venugopala, K.; Shinu, P. Development and validation of green uv derivative spectrophotometric methods for simultaneous determination metformin and remogliflozin from formulation: Evaluation of greenness. Int. J. Environ. Res. Public Heal. 2021, 18, 448. [Google Scholar] [CrossRef] [PubMed]
- Attimarad, M.; Elgorashe, R.E.E.; Subramaniam, R.; Islam, M.M.; Venugopala, K.N.; Nagaraja, S.; Balgoname, A.A. Development and validation of rapid RP-HPLC and green second-derivative UV spectroscopic methods for simultaneous quantification of metformin and remogliflozin in formulation using experimental design. Separations 2020, 7, 59. [Google Scholar] [CrossRef]
- Tayade, A.B.; Patil, A.S.; Shirkhedkar, A.A. Development and validation of zero order uv-spectrophotometric method by area under curve technique and high performance thin layer chromatography for the estimation of remogliflozin etabonate in bulk and in-house tablets. Invent. Rapid Pharm. Anal. Qual. Assur. 2019, 3, 1–5. [Google Scholar]
- Bhatkar, T.; Badkhal, A.V.; Bhajipale, N.S. stability indicating rp-hplc method development and validation for the esti-mation of remogliflozin etabonate in bulk and pharmaceutical dosage form. Int. J. Pharmace. Res. 2020, 12, 4197–4207. [Google Scholar] [CrossRef]
- Shah, D.; Gondalia, I.; Patel, V.; Mahajan, A.; Chhalotiya, U.K. Stability indicating liquid chromatographic method for the estimation of remogliflozin etabonate. J. Chem. Metrol. 2020, 14, 125–132. [Google Scholar] [CrossRef]
- Tammisetty, M.R.; Challa, B.R.; Puttagunta, S.B. A Novel Analytical Method for the Simultaneous Estimation of Remogliflozin and Metformin Hydrochloride by UPLC/PDA in Bulk and Formulation Application to the Estimation of Product Traces. Turk. J. Pharm. Sci. 2021, 18, 296–305. [Google Scholar] [CrossRef]
- Dayoub, L.A.; Amali, F. Development of a new visible Spectrophotometric analytical method for determination of Vildagliptin in bulk and Pharmaceutical dosage forms. Res. J. Pharm. Technol. 2020, 13, 2807. [Google Scholar] [CrossRef]
- Kumari, B.; Khansili, A. Analytical Method Development and Validation of UV-visible Spectrophotometric Method for the Estimation of Vildagliptin in Gastric Medium. Drug Res. 2020, 70, 417–423. [Google Scholar] [CrossRef]
- Giordani, C.F.A.; Campanharo, S.C.; Wingert, N.R.; Bueno, L.M.; Manoel, J.W.; Garcia, C.V.; Volpato, N.M.; Iop, G.D.; Mello, P.D.A.; Flores, E.M.D.M.; et al. UPLC-ESI/Q-TOF MS/MS method for determination of vildagliptin and its organic impurities. J. Chromatogr. Sci. 2020, 58, 718–725. [Google Scholar] [CrossRef]
- Abdel-Ghany, M.F.; Abdel-Aziz, O.; Ayad, M.F.; Tadros, M.M. Validation of different spectrophotometric methods for determination of vildagliptin and metformin in binary mixture. Acta. A Mole Biomole Spectro. 2014, 125, 175–182. [Google Scholar] [CrossRef]
- Moneeb, M.S. Spectrophotometric and spectrofluorimetric methods for the determination of saxagliptin and vildagliptin in bulk and pharmaceutical preparations. Bull. Fac. Pharm Cairo Uni. 2013, 51, 139–150. [Google Scholar] [CrossRef][Green Version]
- Altunkaynak, Y.; Yavuz, Ö.; Levent, A. Firstly electrochemical examination of vildagliptin at disposable graphite sensor: Sensitive determination in drugs and human urine by square-wave voltammetry. Microchem. J. 2021, 170, 106653. [Google Scholar] [CrossRef]
- Shakoor, A.; Ahmed, M.; Ikram, R.; Hussain, S.; Tahir, A.; Jan, B.M.; Adnan, A. Stability-indicating RP-HPLC method for simultaneous determination of metformin hydrochloride and vildagliptin in tablet and biological samples. Acta Chromtogr. 2020, 32, 39–43. [Google Scholar] [CrossRef]
- Sen, A.; Hinsu, D.; Sen, D.; Zanwar, A.; Maheshwari, R.; Chandrakar, V. Analytical method development and validation for simultaneous estimation of Teneligliptin hydrobromide hydrate and Metformin hydrochloride from it’s pharmaceutical dosage form by three different UV spectrophotometric methods. J. Appl. Pharm. Sci. 2016, 6, 157–165. [Google Scholar] [CrossRef]
- Joshi, H.; Khristi, A. Absorbance ratio method development and validation for the simultaneous estimation of teneligliptin hydrobromide hydrate and metformin hydrochloride in tablet dosage form. Int. Res. J. Pharm. 2018, 9, 47–55. [Google Scholar] [CrossRef]
- Chitlange, S.S.; Rawat, D.G.; Gandhi, S.P. Estimation of anti diabetic teneligliptin in bulk and formulation by densitometric and spectrophotometric method. Anal. Chem. Lett. 2017, 7, 556–566. [Google Scholar] [CrossRef]
- Shaikh, A.R.; Ahmed, B.A.R.K.; Ibrahim, M. A validated stability indicating RP-HPLC method for simultaneous estimation of metformin and teneligliptin in bulk and pharmaceutical dosage form. Int. J. Pharm. Sci. Res. 2018, 9, 1705–1712. [Google Scholar] [CrossRef]
- Mrunal, C.S.; Annapurna, M.M. Simultaneous determination of metformin and teneligliptin by liquid chromatography in tablets. As. J. Pharmaceu. 2018, 12, 736–739. [Google Scholar] [CrossRef]
- Vetapalem, R.; Yejella, R.P.; Atmakuri, L.R. Development and validation of a stability indicating rp-hplc method for simultaneous estimation of teneligliptin and metformin. Turk. J. Pharm. Sci. 2020, 17, 141–147. [Google Scholar] [CrossRef]
- Kumar, T.N.V.G.; Vidyadhara, S.; Narkhede, N.A.; Silpa, Y.S.; Lakshmi, M.R. Method development, validation, and stability studies of teneligliptin by RP-HPLC and identification of degradation products by UPLC tandem mass spectroscopy. J. Anal. Sci. Technol. 2016, 7, 27. [Google Scholar] [CrossRef]
- Park, J.; Kim, K.; Park, J. Development of a liquid chromatography/tandem-mass spectrometry assay for the simultaneous determination of teneligliptin and its active metabolite teneligliptin sulfoxide in human plasma. Biomed. Chromatogr. 2020, 34, e4721. [Google Scholar] [CrossRef]
- Attimarad, M.; Venugopala, K.N.; SreeHarsha, N.; Aldhubiab, B.E.; Nair, A.B. Validation of rapid RP-HPLC method for concurrent quantification of amlodipine and celecoxib in pure and formulation using an experimental design. Microchem. J. 2020, 152, 104365. [Google Scholar] [CrossRef]
- Sahu, P.K.; Ramisetti, N.R.; Cecchi, T.; Swain, S.; Patro, C.S.; Panda, J. An overview of experimental designs in HPLC method development and validation. J. Pharm. Biomed. Anal. 2018, 147, 590–611. [Google Scholar] [CrossRef] [PubMed]
- Awotwe-Otoo, D.; Agarabi, C.; Faustino, P.J.; Habib, M.J.; Lee, S.; Khan, M.; Shah, R.B. Application of quality by design elements for the development and optimization of an analytical method for protamine sulfate. J. Pharm. Biomed. Anal. 2012, 62, 61–67. [Google Scholar] [CrossRef] [PubMed]


Publisher’s Note: MDPI stays neutral with regard to jurisdictional claims in published maps and institutional affiliations. |
© 2022 by the authors. Licensee MDPI, Basel, Switzerland. This article is an open access article distributed under the terms and conditions of the Creative Commons Attribution (CC BY) license (https://creativecommons.org/licenses/by/4.0/).