Article

Luminol Doped Silica-Polymer Sensor for Portable Organic Amino Nitrogen and Ammonium Determination in Water

by
Sara Bocanegra-Rodríguez
,
Carmen Molins-Legua
and
Pilar Campíns-Falcó
*
MINTOTA Research Group, Departament de Química Analítica, Facultat de Química, Universitat de València, Dr. Moliner 50, Burjassot, 46100 Valencia, Spain
*
Author to whom correspondence should be addressed.
Separations 2021, 8(9), 149; https://doi.org/10.3390/separations8090149
Submission received: 7 August 2021 / Revised: 31 August 2021 / Accepted: 7 September 2021 / Published: 10 September 2021
(This article belongs to the Section Materials in Separation Science)

Abstract

:
We propose a portable sensor, obtained by embedding luminol into the tetraethylorthosilicate/trietoxymethylsilane (TEOS/MTEOS) composite, for the quantitative determination of organic amino nitrogen and ammonium in water with the goal of achieving low levels of concentration. The method is based on the reaction between amino nitrogen compounds and hypochlorite to produce chloramino derivatives. Then, the remaining hypochlorite reacts with luminol sensor by producing a luminescence signal, which was measured by using a portable luminometer, being inversely proportional to nitrogen concentration. The liberation of the luminol from sensor is higher than 90% and the sensor is stable for at least a week at room temperature. This portable method was successfully validated and applied to the analysis of several real waters: fountain, river transition, lagoon, and seawater with recovery values between 92% and 112%, which indicated that the matrix effect was absent. The achieved limit of detection was around 10 µg·L−1, expressed as N. This sensor allows in situ monitoring owing to its simplicity, rapidity, and portability.

1. Introduction

In situ monitoring technologies appeared as an advance for complementing the classical methods in the laboratory. The concept of in situ analysis employed here was described in [1]. In the analytical context, in situ analysis can be defined as a function of the place where the analytical process is carried out, which means at the same place where the phenomenon occurs.
During the last years, the number of publications about sensors and in situ analysis are growing. For example, by matching in the data base web of science (WOS) the following search terms “in situ” and “sensor” and “water” for 2010 and 2020, the number of published papers and the number of citations were: 244 and 4768, and 681 and 25,314, respectively (July 2021). The types of the most in situ sensors reported in the literature are electrochemical and optical devices. Optical techniques are considered one of the best techniques for sensor development due to their figures of merit [2]. Table 1 shows the last covered topics of optical sensors in recent review articles. Several analytes, materials, and optical techniques were described. Only one paper partially treated chemiluminescence. On the other hand, these reviews showed the need of new knowledge for improving their responses, uses, and utilities.
Other important topics are related to enabling on-chip micro-/nanosensors such as optofluidic devices and micro-/nanofab techniques [14,15].
Based on previous studies, ammonium and nitrogen groups from organic compounds react with hypochlorite reagent in alkaline media to generate chloramines [16,17,18]. We propose here TEOS and MTEOS reagents to develop a new portable sol–gel sensor in a polystyrene tube, which contains immobilized luminol. Luminol was stable in the TEOS/MTEOS composite, and the sensor allowed the releasing of luminol to the solution and subsequent analysis of ammonium and dissolved organic nitrogen. The method is based on the oxidation reaction of luminol carried out by hypochlorite. First, the ammonium and nitrogen groups from organic compounds react with hypochlorite reagent in alkaline media to generate chloramines. Secondly, the remaining hypochlorite reacts with luminol by producing a chemiluminescence (CL) signal at maximum of 425 nm, inversely proportional to ammonium and organic amino nitrogen concentrations (see Figure 1).
The method was successfully applied to a variety of real water samples by including fountain, river, transitional, lagoon, and sea water. The total CL signal is registered with a portable luminometer. The results revealed that the developed sensor displays good selectivity and sensitivity. The sensor provided security, rapidity, portability, and cost-effectiveness in reference to other methods.

2. Materials and Methods

2.1. Materials

All reagents were of analytical grade. Ultrapure water obtained using Nanopure II system (Barnstead, NH, USA) was used for preparation and dilution of all solutions. Luminol, zein, and NaOH were obtained from Sigma-Aldrich (Saint Louis, MO, USA). Sodium hydrogen carbonate (NaHCO3) and sodium carbonate (Na2CO3) were purchased from Merck (Darmstadt, Germany) and sodium hypochlorite (10%) from Panreac (Barcelona, Spain). Sylgard 184 silicon elastomer and Sylgard 184 silicon elastomer curing agent were purchased from Dow Corning, Midland, MI, USA. The sensors were gelified into polystyrene immunoassay plates by Corning Incorporated, Corning, NY, USA.
Tetramethyl orthosilicate (TEOS), trimethoxymethylsilane (MTEOS), glycol and poly(ethylene glycol) (PEG), ammonia chloride, methylamine, dimethylamine, putrescine, spermine, chromium (III) chloride, Cobalt(II) chloride, Cu(II) chloride, Fe(III) chloride, and Cd(II) chloride were purchased from Sigma-Aldrich (Saint Louis, MO, USA).
Polystyrene tubes were obtained from Labbox (Barcelona, Spain).
Stock solution of 35 mM luminol solution was prepared by dissolving an appropriate amount of luminol in buffer 0.3 M HCO3/CO32− pH = 10.8. The mixture was stirred for 15 min in Vortex. The solution was prepared fresh daily.

2.2. Apparatus

The luminescence measurements were recorded by a portable tube luminometer from Berthold Technologies (Bad Wildbad, Germany) and a spectrofluorometer Jasco FP 750 (Tokyo, Japan). The emission was measured inside the transparent polystyrene tubes, which contained the developed sensor, in the portable luminometer. For preparing the solutions, a Vortex mixer from Labnet International (Edison, NJ, USA) was used.
Microscopic images were taken with a Nikon microscope ECLIPSE E200LED MV Series (Nikon Corporation, Tokyo, Japan) under bright-field illumination using 10× and 50× objectives.
The micrographs of scanning electronic microscope (SEM) were obtained with a HITACHI-S4800 (Hitachi, Tokyo, Japan) operating at 20 kV. For measuring samples, Au/Pd coating was required.

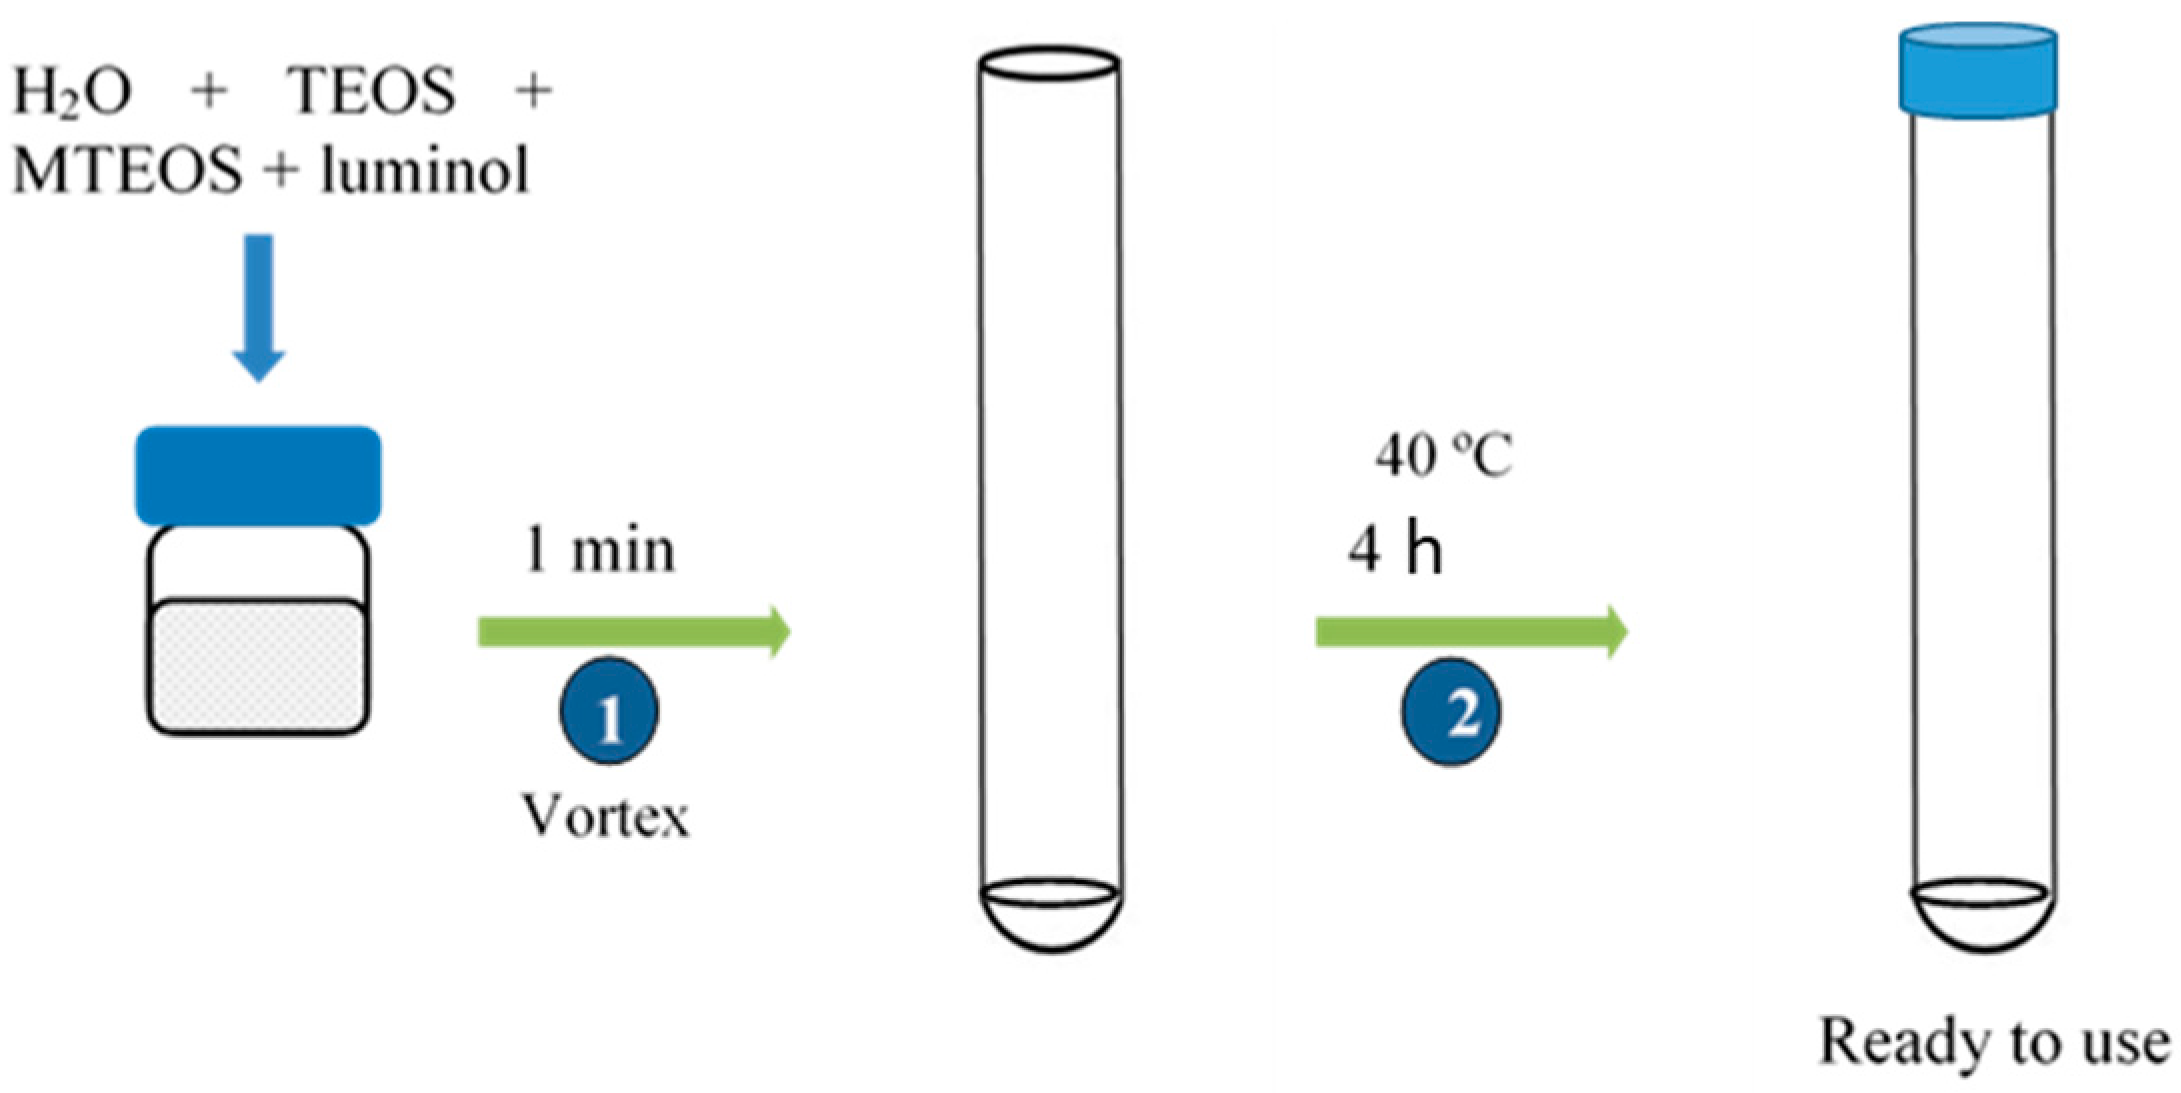
2.3. Sensor Fabrication

The sensors were fabricated by mixing in a glass vial 50 µL of nanopure water, 100 µL of TEOS, 100 µL of MTEOS, and 2 mL of luminol 0.04 mM (pH = 10.7). To obtain a homogeneous dispersion, the mix was vortexed for 1 min, and afterwards 200 µL of the mixture were deposited on the bottom of the polystyrene tube. Tubes were heated at 40 °C for 4 h and then they were covered with a polystyrene tube cap and stored at room temperature (Figure 2). The same procedure was used to prepare PEG and glycerol modified sensors. Table 2 shows the composition of the different studied compositions expressed per unit.

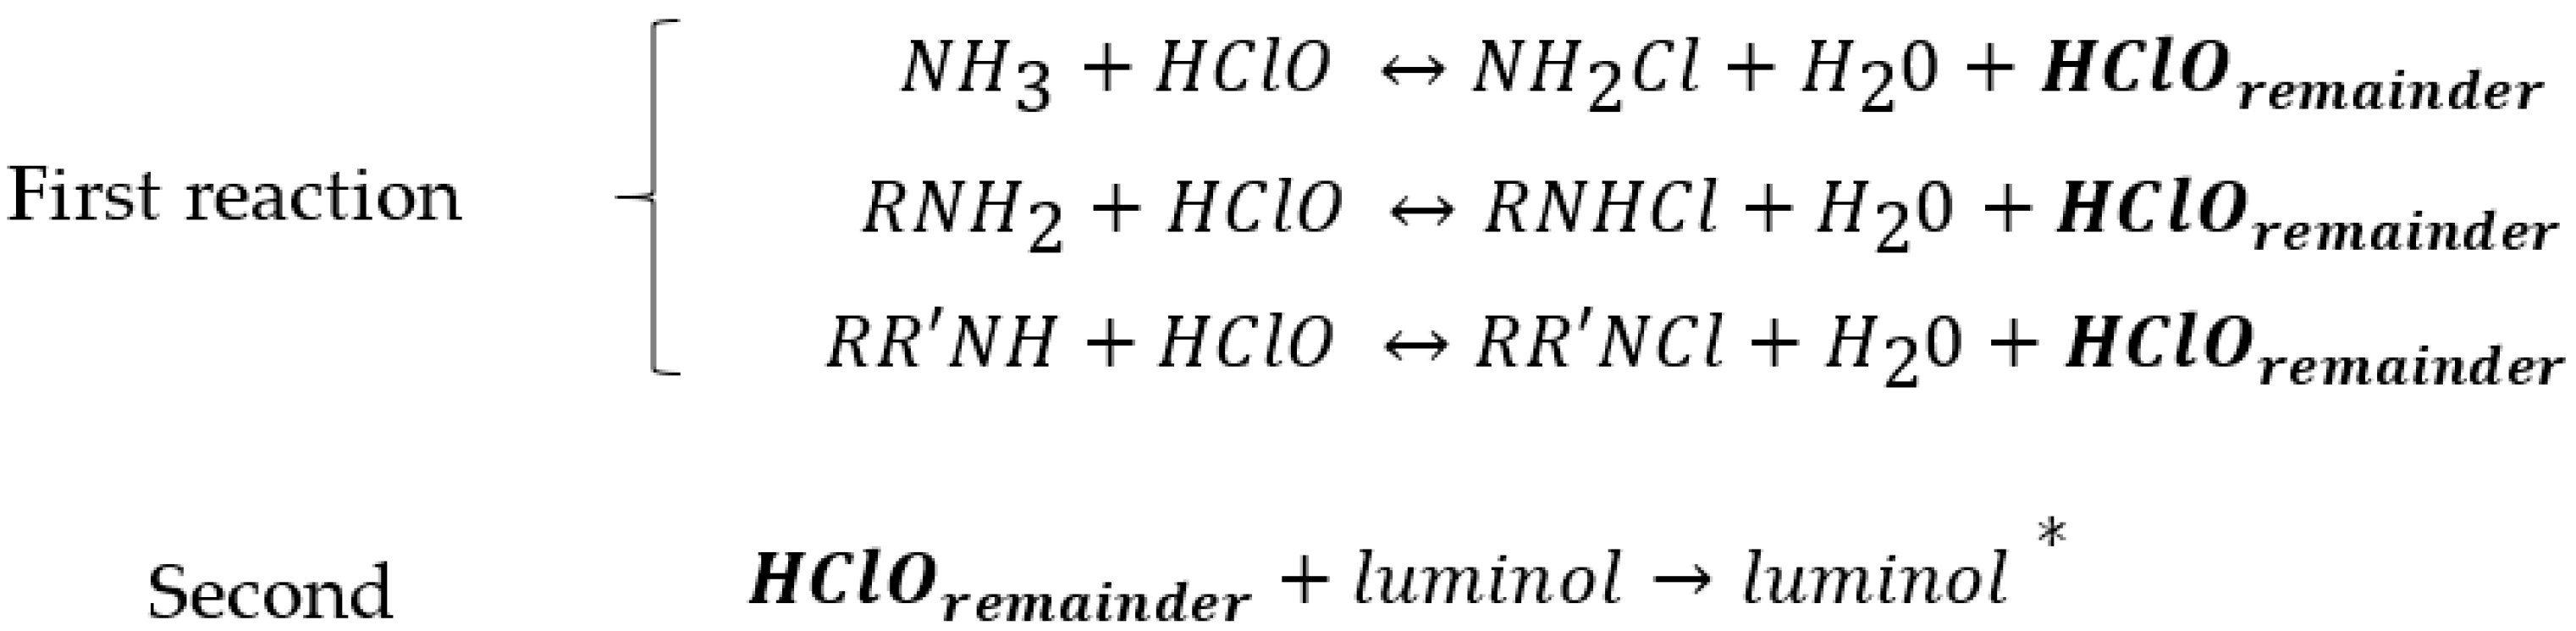
2.4. Determination of Ammonium and Organic Amino Nitrogen by Using a Portable Luminometer

(1)
In Solution
First, 20 µL of 0.4 mM luminol were added inside the tube. Then, 400 µL of a dissolution composed by 50 µL of 0.248 µM sodium hypochlorite and 350 µL of nitrogen standard solution or sample was thrown in to start the reaction. The CL signal was captured at 10 s. The same protocol was used for measuring the CL signal by the lab equipment.
(2)
By using the sensor
A total of 350 µL of the nitrogen standard or sample was mixed with 50 µL of 0.248 µM sodium hypochlorite during 1 min. Then, the mixture was placed in the tube containing the luminol sensor (this was considered time zero for measuring CL). The CL signal was captured at 10 s. All assays were carried out at room temperature by triplicate.
Water samples from fountain, seawater, transition, lagoon, and river were taken from different points of the Valencian Community (Spain). For recovery studies, samples were spiked with nitrogen concentrations of 0.07 and 0.105 mg L−1. Each sample was analyzed in triplicate.

3. Results and Discussion

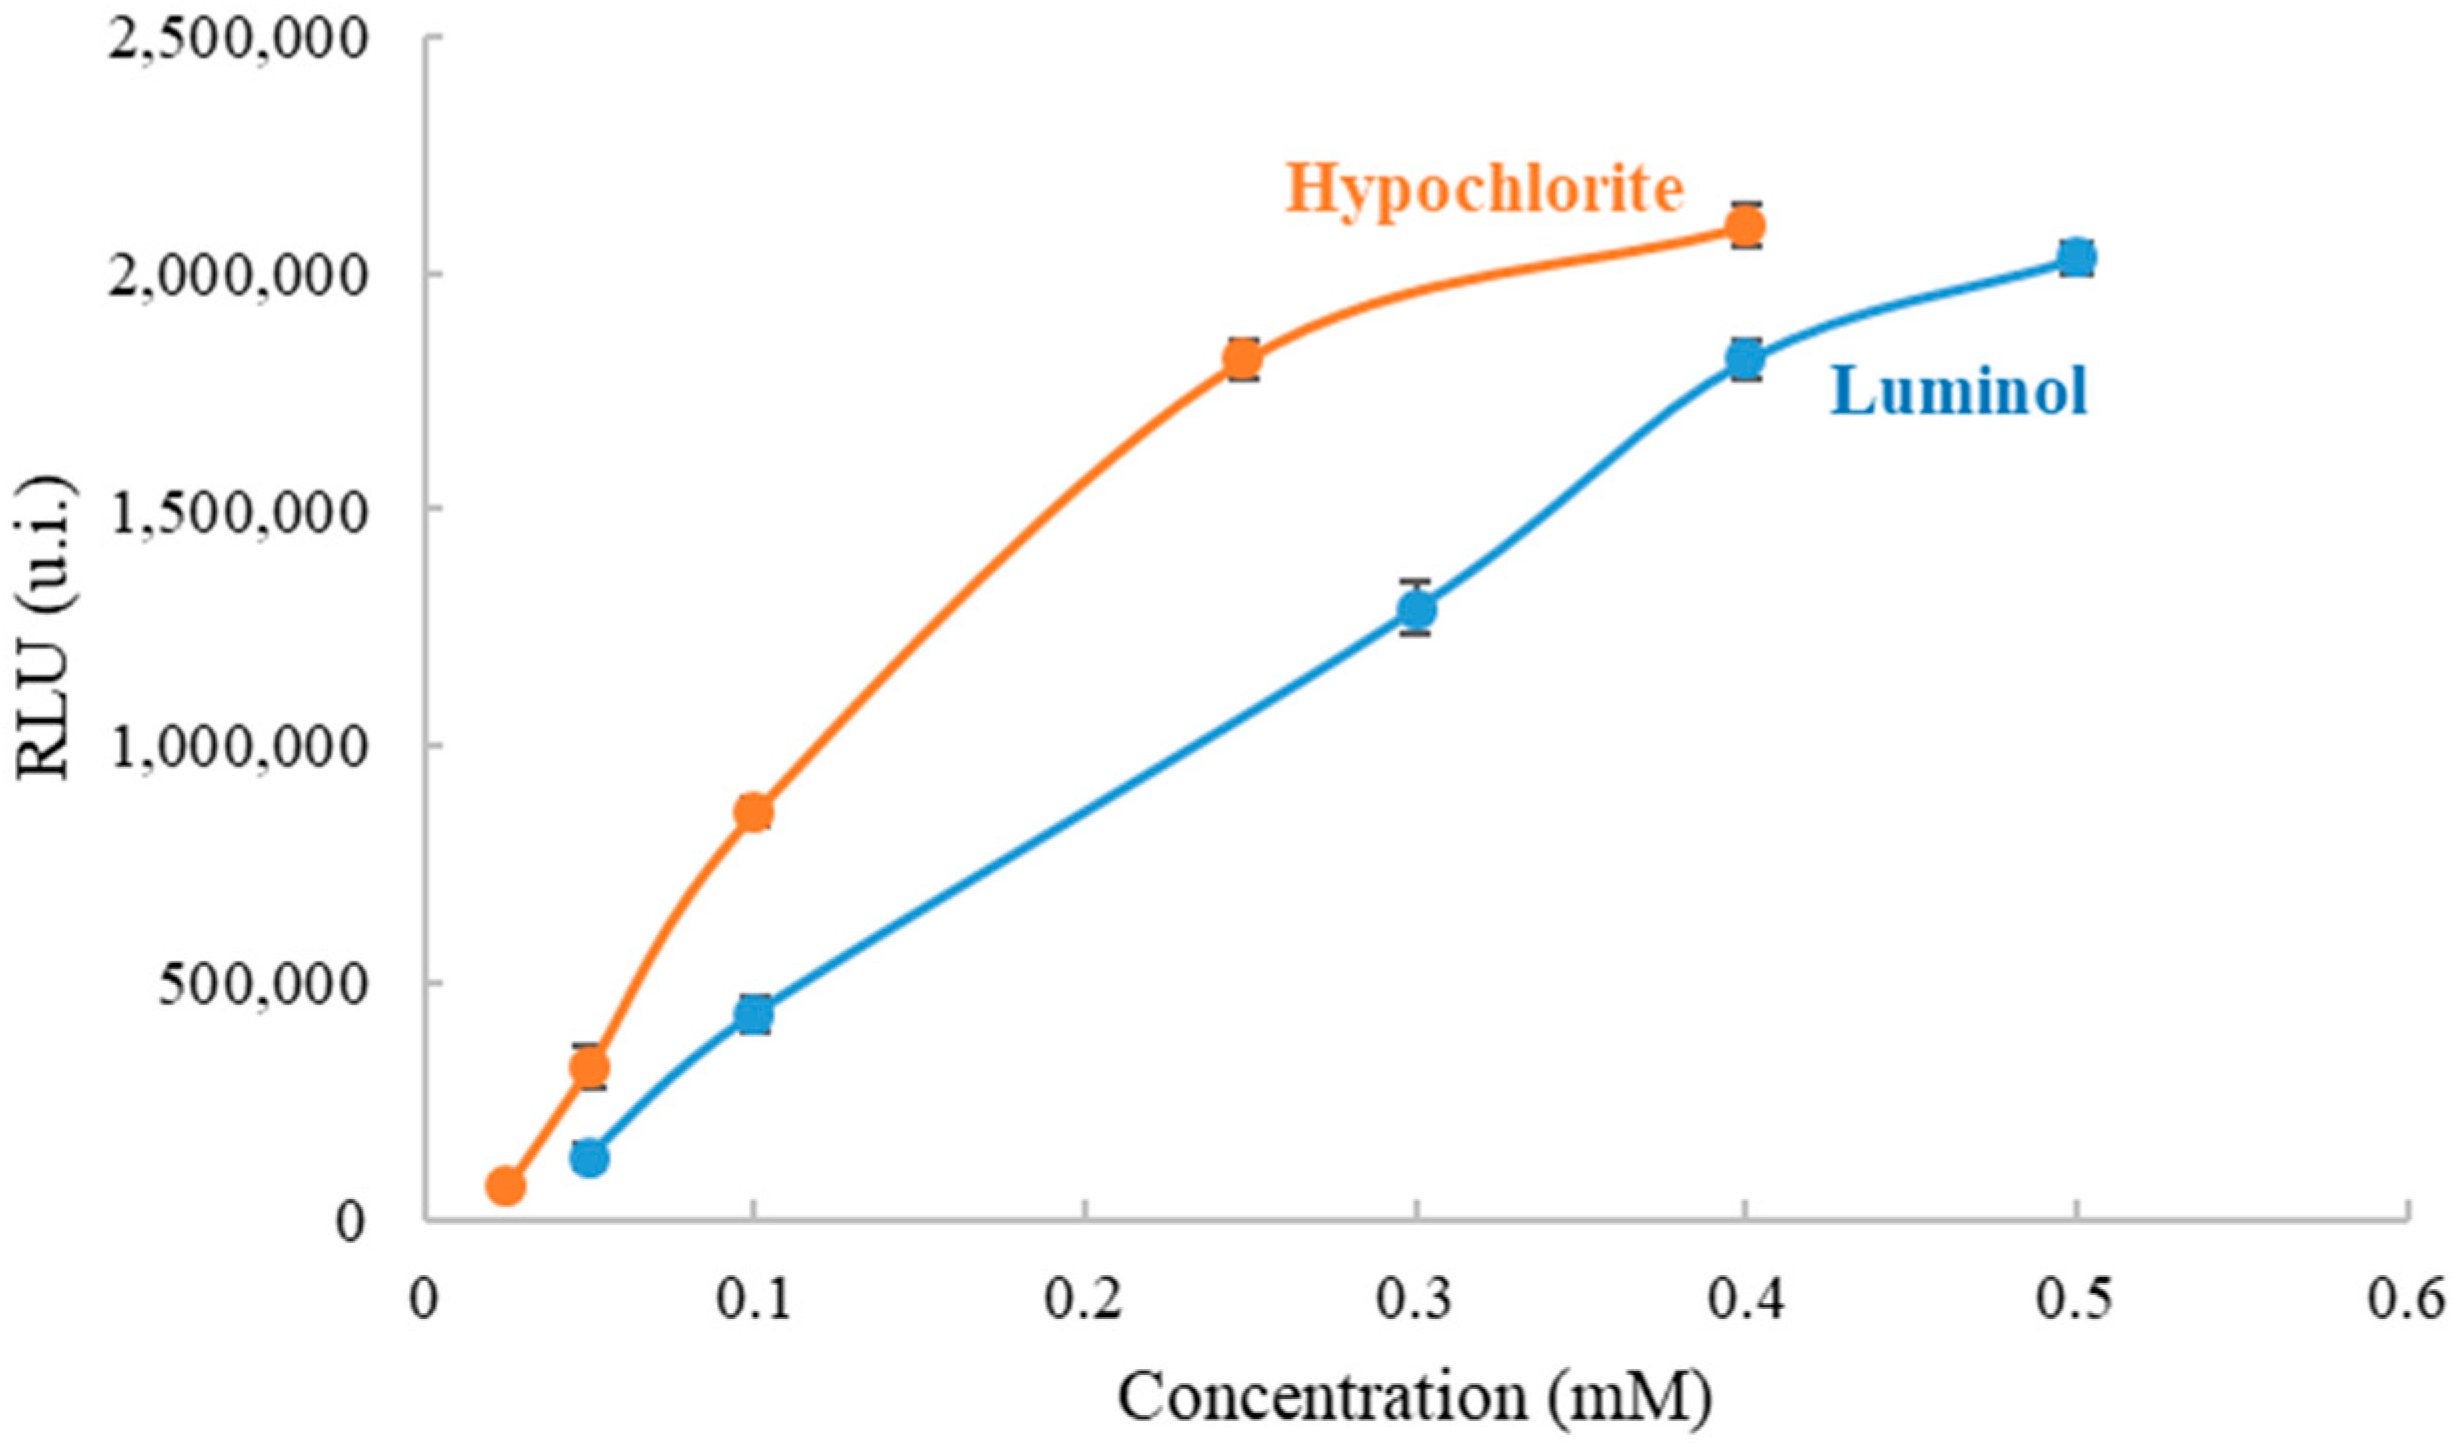
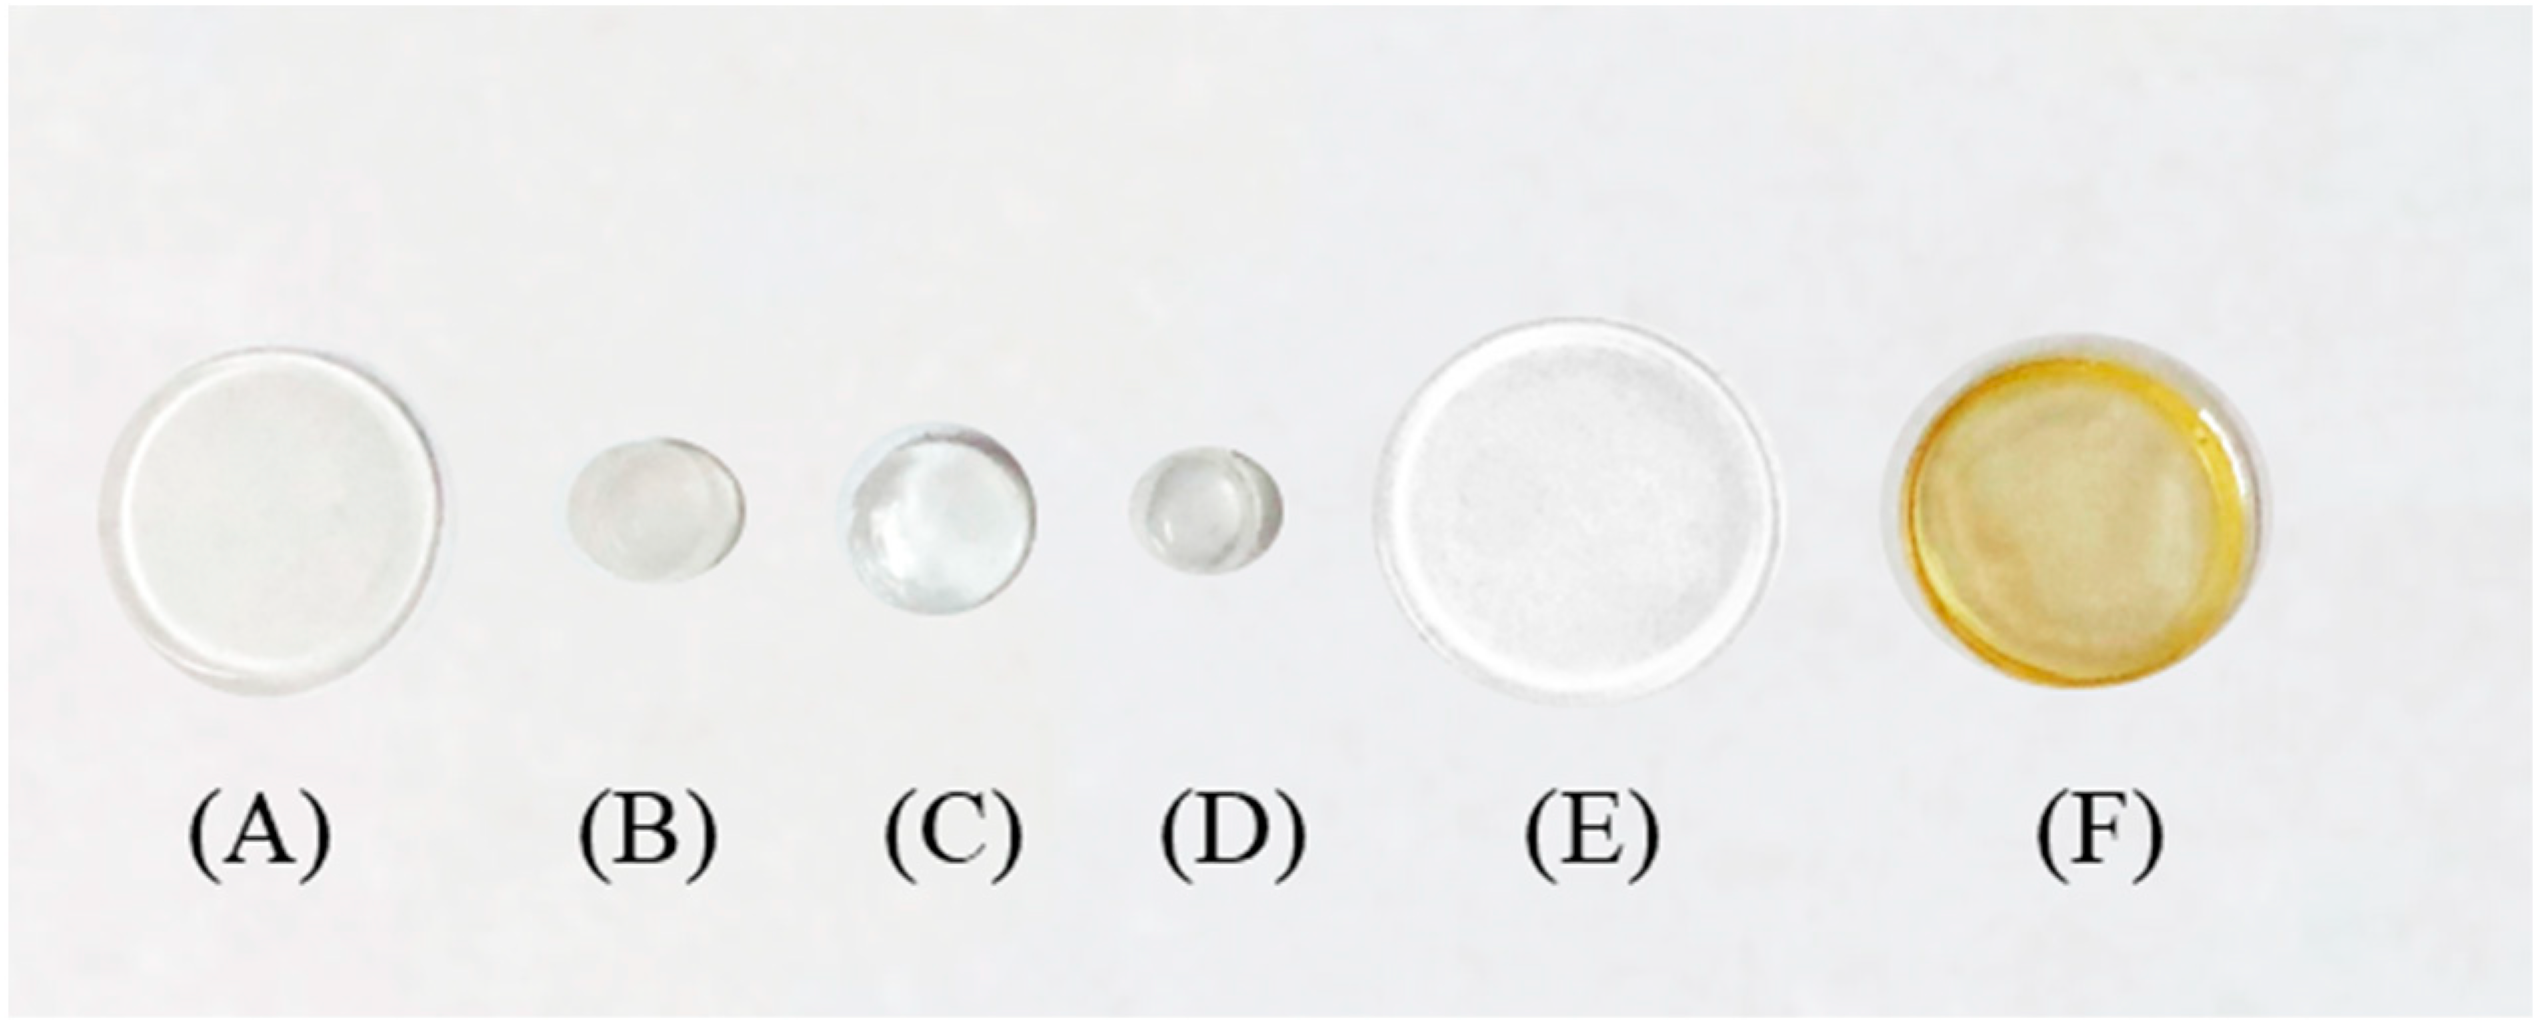
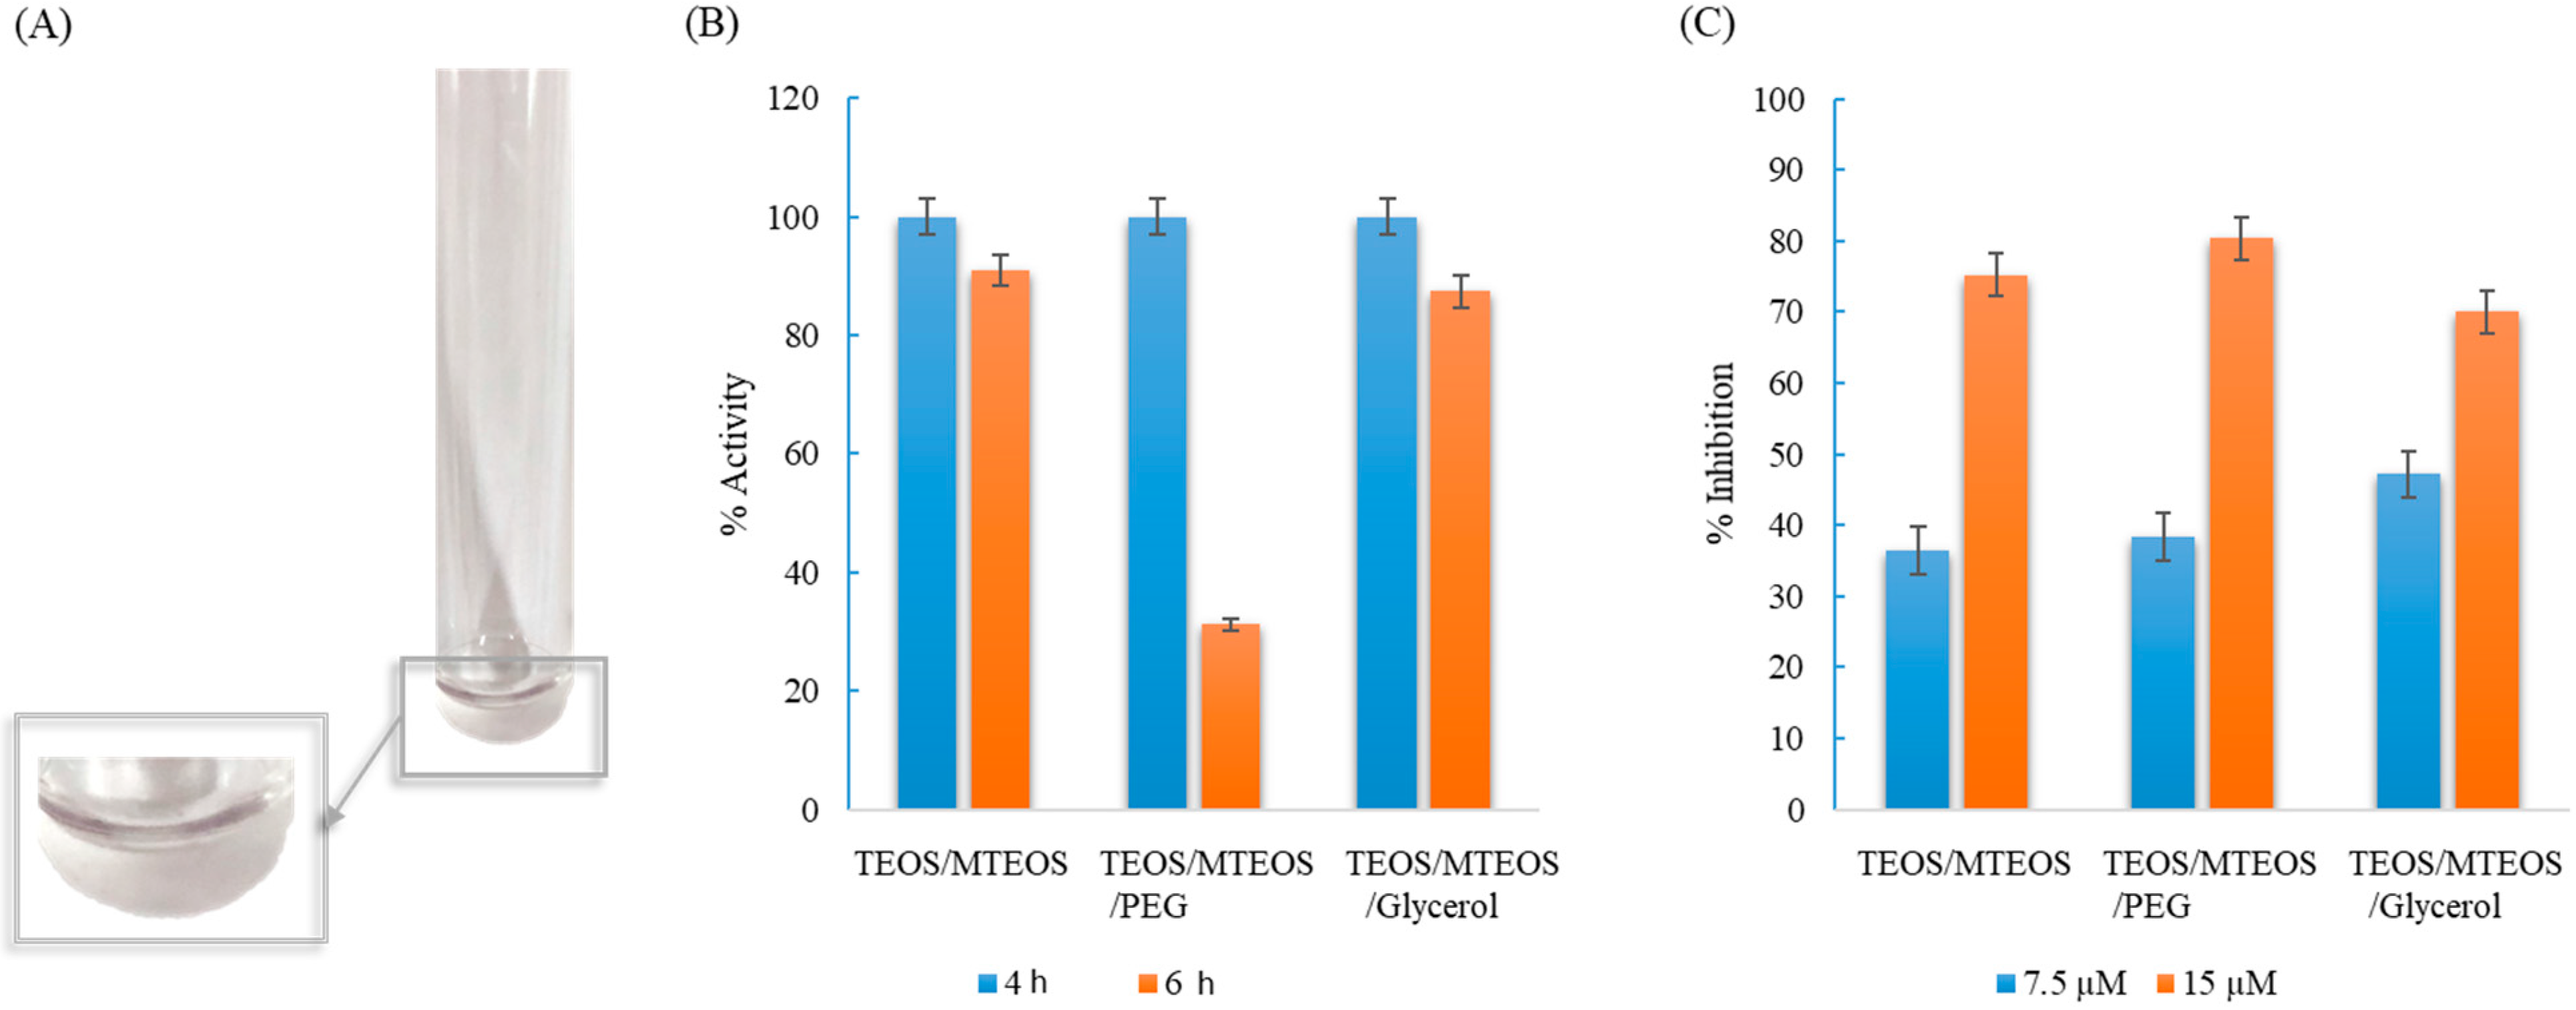
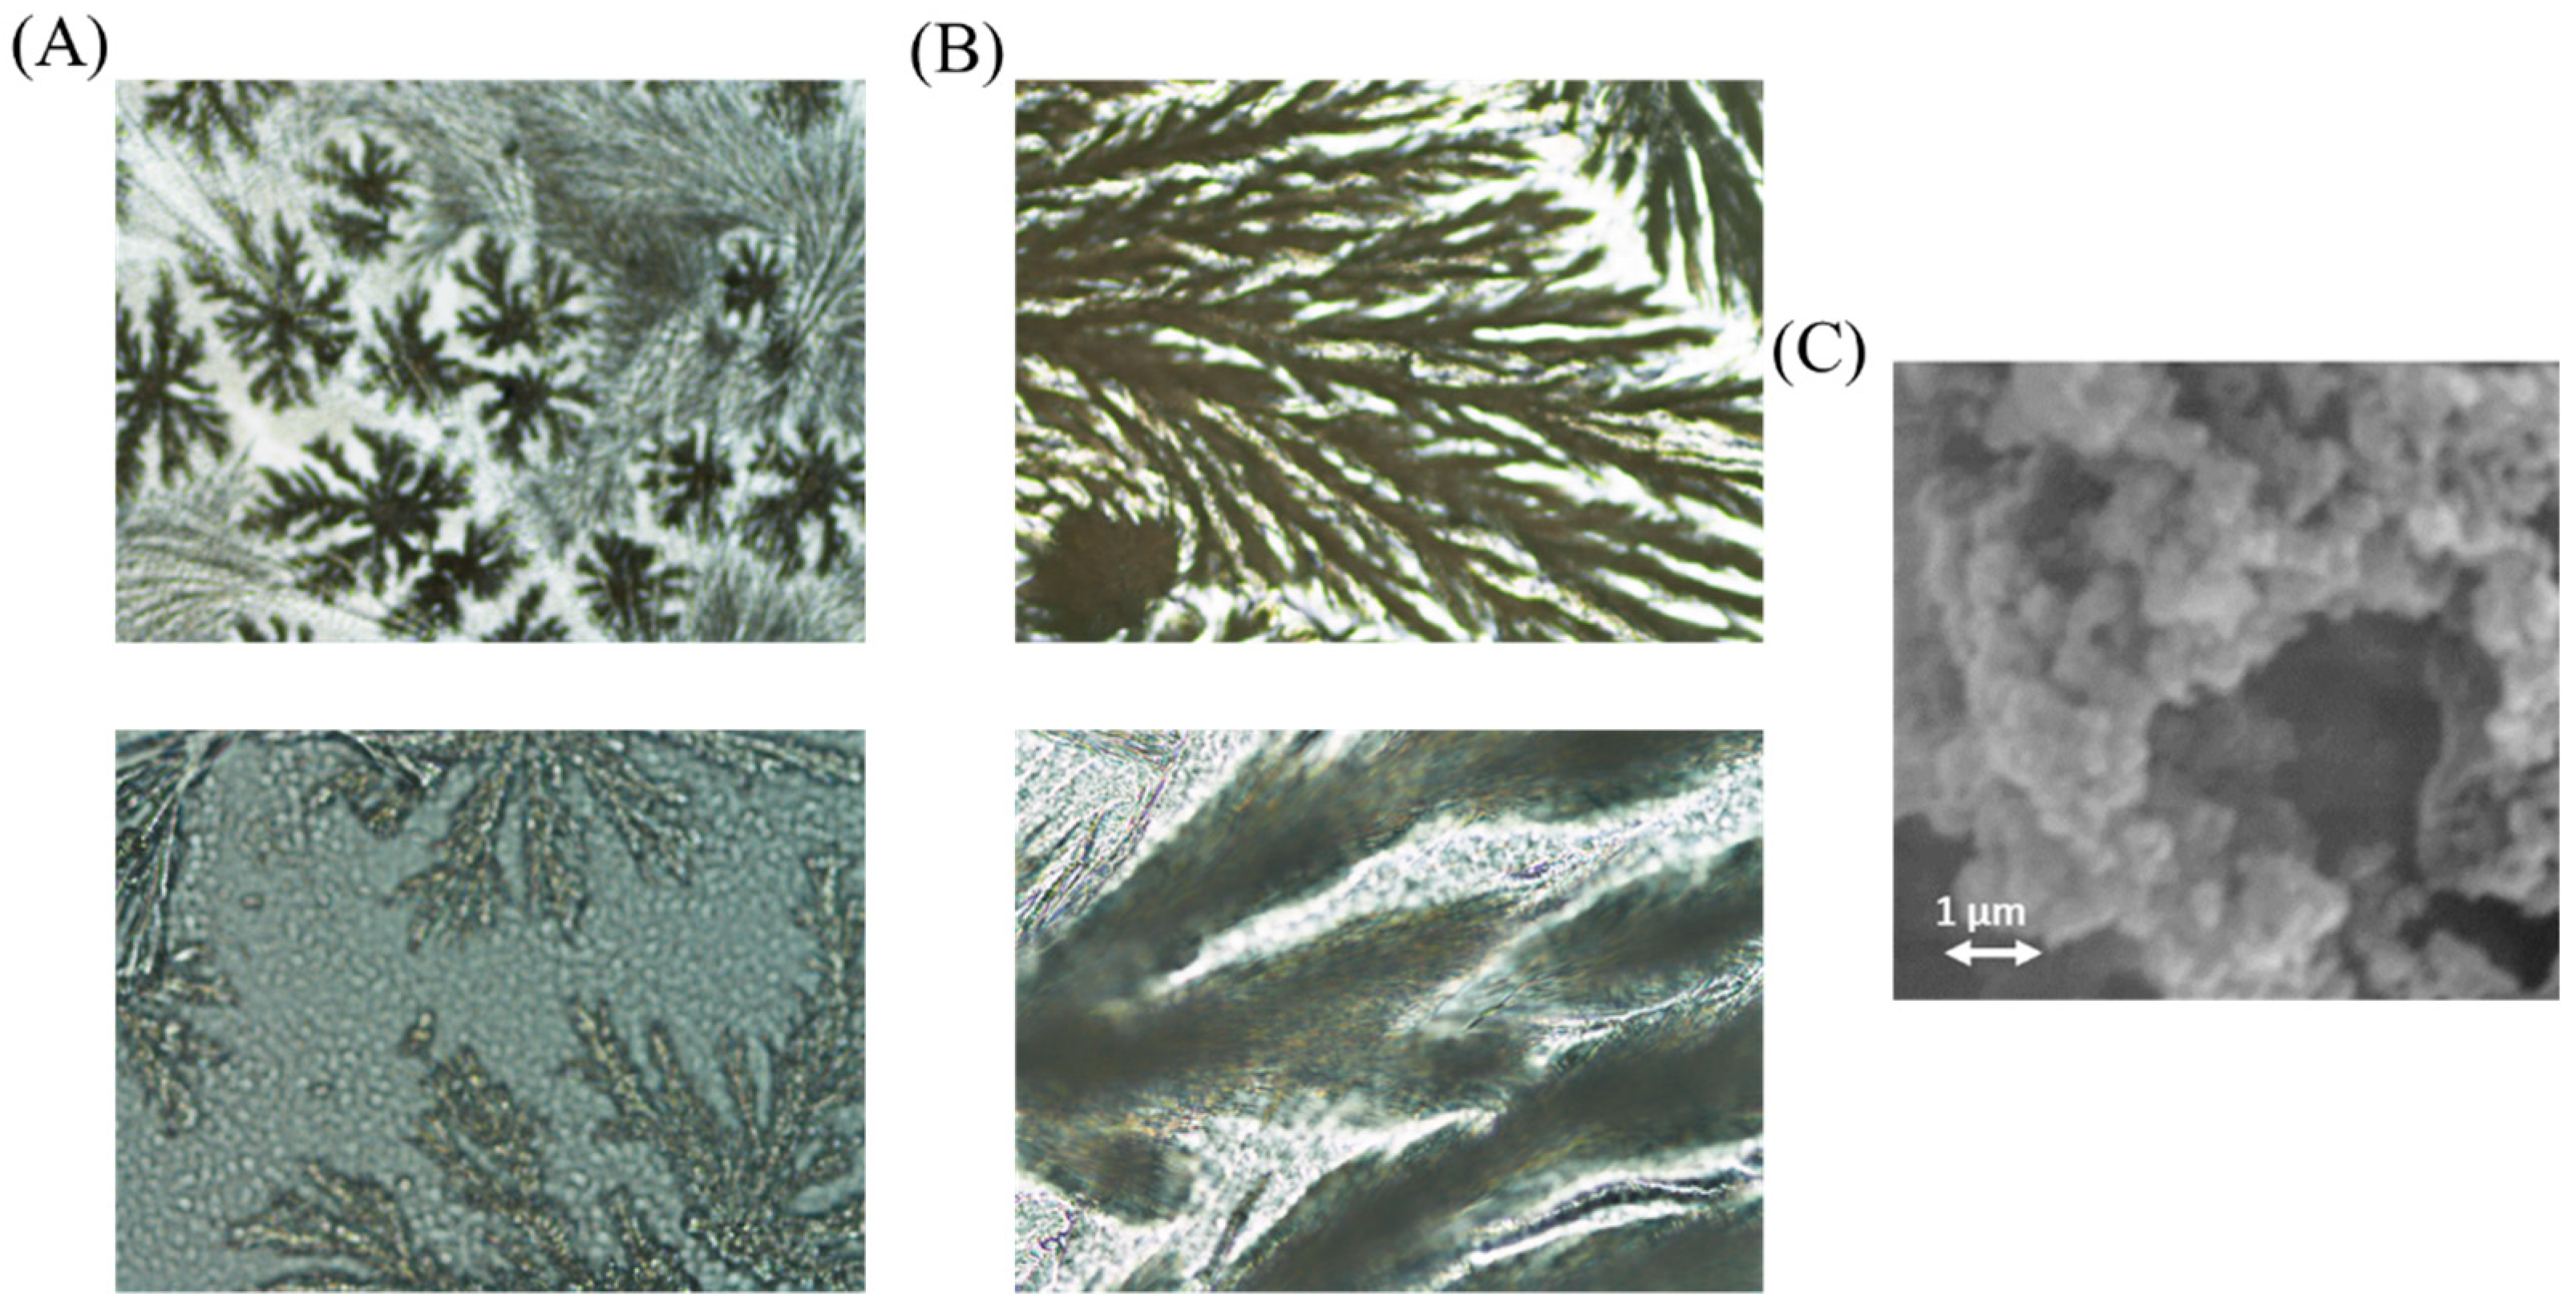
3.1. Optimization of Luminol Immobilization

To establish the optimal conditions for organic amino nitrogen and ammonium determination, the effect of luminol and sodium hypochlorite concentration on CL intensity of the formed compound was previously studied in solution using the portable luminometer. First, the luminol concentration was kept constant (0.4 mM) and the sodium hypochlorite concentrations were varied between 0.025 mM and 0.4 mM. The light intensity, a transient signal, was recorded at 10 s, which was the minimum time needed for measuring precisely in the portable instrument and achieving low detection limits. As shown in Figure 3, it was found that the CL signal increased as the sodium hypochlorite concentration increased too. It was interesting to reach the maximum signal of the luminometer without saturation in order to obtain the maximum working range for the analyte, due to the fact that the presence of the analyte decreases the CL signal. Moreover, it was important that the CL signal is not highly dependent on luminol concentration, thus 0.248 mM was selected. Second, the sodium hypochlorite concentration was kept constant (0.248 mM) and the luminol concentrations were varied between 0.05 mM and 0.5 mM (Figure 3). The light intensity was recorded at 10 s also. The results showed that the CL signal increased as sodium hypochlorite concentration increased. The selected concentration was 0.4 mM, the first value in the plateau.
To check the best material to immobilize and after to release luminol to the solution, different supports were tested. Based on our experience [1,19,20,21,22], several solid supports for luminol entrapment were studied: PDMS, zein, and TEOS/MTEOS. Solid supports of PDMS (Figure 4A,B) or PDMS-TEOS (Figure 4C–E) containing luminol were synthetized. PDMS-based sensors were added to solutions containing buffer 0.2 M HCO3/CO32− PH = 11.2 to study luminol liberation, then 50 µL of hypochlorite were added to start the CL reaction. Non-reaction was observed, thus the liberation of luminol was not produced. This behavior can be attributed to the hydrophobicity of the PDMS support. No differences in behavior were observed between PDMS and PDMS/TEOS and different sensor sizes. Furthermore, the covalent binding of luminol on PDMS was tested inside a polystyrene tube; however, the immobilization cannot be carried out through the amino group or the immobilization of luminol though the NH2 group impeded its oxidation by sodium hypochlorite reagent. Zein was tested as a releasing support (Figure 4F) also; however, it is a protein and its nitrogen groups reacted with the sodium hypochlorite, thus all hypochlorite is consumed and the luminol oxidation was not carried out.
Finally, a sol–gel support based on TEOS/MTEOS containing luminol, which provided a hydrosoluble support, was assayed (see Figure 5A). The influence of different compounds in the device composition (see Section 2.3) was studied in order to select the best sol–gel with suitable sensibility, solidification properties, stability, and satisfactory accessibility of the analyte to the reagent. The addition of two plasticizers, PEG and glycerol, in the sol–gel was tested in order to assay their possible benefits in the determination of analytes.
Two parameters were studied in order to select the best components in the sol–gel sensor (Figure 5B): first, the loss of activity from the sensor vs. the time to heat in the oven, and then, the sensitivity achieved to determinate nitrogen (7.5 µM and 15 µM of nitrogen were tested). As it is shown in Figure 5B, the time to heat in the oven at 40 °C was optimized in order to achieve an optimal functional solid without affecting to the luminol stability. At 4 h, all sensors were solidified; however, an increase of 2 h produces a loss of activity in the sensor, which contained PEG. Figure 5C shows the % inhibition achieved by the different sensors; the addition of glycerol makes the sensor less sensible, which can be due to the glycerol change the viscosity of the sensor, which can be related to the luminescence signal obtained.
To sum up, it was observed that the addition of PEG did not provide significate advantages, the linear range can be considered similar than that achieved without adding PEG, and there was a big difference of activity if the sensor was heated during 6 h for gelification (see Figure 5B). The addition of glycerol makes the sensor less sensible. According to the results, the option without PEG or Glycerol was selected for further experiments. Microscopy images were obtained of the sol–gel sensor with and without luminol (Figure 6). Morphology of the composite containing luminol was more ramified than that corresponding to the composite without luminol (se also SEM images).
Once the sensor was developed, the efficacy of luminol releasing was evaluated by comparing the reaction in solution and with the sensor. The y-intercept from the reaction in solution was considered the maximum CL signal to achieve (100%). The stability of the sensor over time was evaluated by using 0.248 µM of sodium hypochlorite. The CL signal was measured after 7 days by storage the sensor at room temperature and in the fridge. The results show a good remaining activity in the sensor at room temperature (90 ± 3%); however, in the fridge the sensor is stable for only 3 days, which can be due to the sol–gel changing its physical properties.

3.2. Analytical Parameters, Stability and Interferences

The applicability of the sol–gel sensor to determine organic amino nitrogen and ammonium was evaluated by analyzing various nitrogen-containing compounds. All concentrations were expressed as nitrogen. The responses of the developed sensor to nitrogen solutions were recorded over 60 s. According to the results, 10 s were selected as a compromise between the analytical signal and the total analysis time. The slopes of the calibration graphs (µM−1 of N) obtained for methylamine as target of primary amines and dimethylamine as target of secondary amines in comparison with that obtained for ammonion were 94% and 91%, respectively. It has to be noted that tertiary amines (trimethylamine) do not respond to nitrogen concentration. Putrescine and spermine were selected as model compounds of polyamines. The slope values obtained were 108% and 82% in comparison with ammonium, respectively. From these results, total nitrogen content of these compounds can be quantified with this procedure, which is in accordance with [17] due to the slope values obtained for ammonium and organic amino groups, which were statistically similar expressed as µM−1 of N: (−5.5 ± 0.5)104; n = 5.
Analytical parameters for the determination of dissolved organic nitrogen and ammonium by using a portable luminometer and with a conventional luminometer are given in Table 3. Although the results obtained with the conventional equipment were measured in solution, the sensitivity achieved by using the portable luminometer with the sensor was higher. This result is due to the portable luminometer capture the luminescence signal at all wavelengths. Linear range and LOD are adequate to determine nitrogen in water samples [17]. RSD values verify that the precision of the method can be considered satisfactory, 3.4 and 5% were obtained for intra- and interday by measuring 0.14 ppm nitrogen stock solution (values provided from sensors obtained from different synthesis). RSD values for the conventional luminometer were obtained by measuring 0.75 ppm nitrogen stock solution. An aim of this paper is to develop a quick procedure that allows evaluating the nitrogen amount in water samples. The species determined have been the organic nitrogen and ammonia.
The influence of salt concentration was studied for sea samples, which have a high salinity (35 mg L−1) through spiked sea water with ammonium (0.07 and 0.105 ppm). The recovery was satisfactory (98 and 106%, respectively; see next section also). The selectivity toward compounds with sulfur atoms, and according to Meseguer et al. [17], sodium sulfide (S2-) and mercaptoethanol (R-SH), decreased the chemiluminescence signal. However, there is not interference in the concentration of biogenic sulfur found in natural waters (around 0.25 ppb) [17]. Moreover, the interference of some metallic ions (Cr(III), Co(II), Cu(II), Fe(III) and Cd(II)) was studied and non-signal was observed at the maximum concentration levels established by the European Legislation (Directive 2015/1787), related to the quality of water intended for human consumption.

3.3. Analysis of Samples

Different water samples were analyzed using the proposed CL sensor. Samples were fortified and the standard additions method was used to validate the accuracy of the method.
Table 4 shows the found nitrogen concentration in water samples calculated from the calibration curve of N by external calibration and the recovery percentage of the added nitrogen (0.07 ppm and 0.105 ppm). Matrix effects were evaluated by spiking the water samples with nitrogen. The recovery values were between 94 and 112%, thus no matrix effect was present by using the developed sensor under the optimized experimental conditions. The nitrogen contents can be obtained directly from interpolation in the standard calibration curve. Values of total amino nitrogen found in samples were between 0.073 and 0.268 ppm N.

4. Conclusions

The objective of this work was to develop a portable CL sensor for in situ control of organic amino nitrogen and ammonium where luminol was embedded in a TEOS/MTEOS sol–gel support. The sensor provides a successful release of luminol to the medium. The luminescent signal was measured employing a portable luminometer, which allows to determine nitrogen in place with high sensitivity. The sensor provides suitable linearity, precision, and stability at room temperature.
Furthermore, this developed procedure allows a rapid and simple in situ analysis of nitrogen in samples without trained personnel or complicated sample pre-treatment. The sensor was applied to the measurement of organic amino nitrogen and ammonium in water from different sources (fountain, river, transitional, lagoon, and sea). The proposed sensor offers the advantage of simplicity, rapidity, portability and low-cost analysis, as well as high sensitivity. This portable solution improved the detection limit achieved and sustainability of a previous paper published by us [17] based on flow injection analysis and chemiluminescence detection. Moreover, it conserves the option to be an approximation to Kjeldahl method and it does not require sample treatment, being the measurement time of 10 s.

Author Contributions

Conceptualization, P.C.-F.; Investigation, S.B.-R., C.M.-L. and P.C.-F.; Methodology, S.B.-R. and C.M.-L.; Project administration, C.M.-L.; Resources, P.C.-F.; Supervision, P.C.-F.; Validation, S.B.-R. and C.M.-L.; Writing—review & editing, P.C.-F. All authors have read and agreed to the published version of the manuscript.

Funding

This research was funded by EU-FEDER/MINCIU-AEI of Spain (project CTQ2017-90082-P) and Generalitat Valenciana (PROMETEO 2020/78).

Institutional Review Board Statement

Not applicable.

Informed Consent Statement

Not applicable.

Data Availability Statement

Not applicable.

Acknowledgments

The authors are grateful to the EU-FEDER/MINCIU-AEI of Spain (project CTQ2017-90082-P) and Generalitat Valenciana (PROMETEO 2020/78) for the financial support received. SB expresses her gratitude to the PROMETEO program for her predoctoral grant.

Conflicts of Interest

The authors declare no conflict of interest. The founding sponsors had no role in the design of the study; in the collection, analyses, or interpretation of data; in the writing of the manuscript, and in the decision to publish the results.

References

  1. Jornet-Martínez, N.; Moliner-Martínez, Y.; Molins-Legua, C.; Campíns-Falcó, P. Trends for the development of in situ analysis devices. In Encyclopedia of Analytical Chemistry; John Wiley & Sons, Ltd.: Chichester, UK, 2017; pp. 1–23. [Google Scholar] [CrossRef]
  2. Leonardi, A.A.; Lo Faro, M.J.; Irrera, A. Biosensing platforms based on silicon nanostructures: A critical review. Anal. Chim. Acta 2021, 1160, 338393. [Google Scholar] [CrossRef] [PubMed]
  3. Asamoah, B.O.; Uurasjarvi, E.; Raty, J.; Koistinen, A.; Roussey, M.; Peiponen, K.E. Towards the Development of Portable and In Situ Optical Devices for Detection of Micro-and Nanoplastics in Water: A Review on the Current Status. Polymers 2021, 13, 730. [Google Scholar] [CrossRef] [PubMed]
  4. Burratti, L.; Ciotta, E.; De Matteis, F.; Prosposito, P. Metal Nanostructures for Environmental Pollutant Detection Based on Fluorescence. Nanomaterials 2021, 11, 276. [Google Scholar] [CrossRef] [PubMed]
  5. Mahmud, M.A.P.; Ejeian, F.; Azadi, S.; Myers, M.; Pejcic, B.; Abbassi, R.; Razmjou, A.; Asadnia, M. Recent progress in sensing nitrate, nitrite, phosphate, and ammonium in aquatic environment. Chemosphere 2020, 259, 12749. [Google Scholar] [CrossRef]
  6. Alberti, G.; Zanoni, C.; Magnaghi, L.R.; Biesuz, R. Disposable and Low-Cost Colorimetric Sensors for Environmental Analysis. Int. J. Environ. Res. Public Health 2020, 17, 8331. [Google Scholar] [CrossRef] [PubMed]
  7. Masson, J.F. Portable and field-deployed surface plasmon resonance and plasmonic sensors. Analyst 2020, 145, 3776–3800. [Google Scholar] [CrossRef] [PubMed]
  8. Kalyani, N.; Goel, S.; Jaiswal, S. On-site sensing of pesticides using point-of-care biosensors: A review. Environ. Chem. Lett. 2020, 19, 345–354. [Google Scholar] [CrossRef]
  9. An, Y.; Ren, Y.; Bick, M.; Dudek, A.; Waworuntu, E.H.W.; Tang, J.; Chen, J.; Chang, B.S. Highly fluorescent copper nanoclusters for sensing and bioimaging. Biosens. Bioelectron. 2020, 154, 112078. [Google Scholar] [CrossRef] [Green Version]
  10. Carstea, E.M.; Popa, C.L.; Baker, A.; Bridgeman, J. In situ fluorescence measurements of dissolved organic matter: A review. Sci. Total Environ. 2020, 699, 134361. [Google Scholar] [CrossRef]
  11. Gong, X.Q.; Cai, J.; Zhang, B.; Zhao, Q.; Piao, J.F.; Peng, W.P.; Gao, W.C.; Zhou, D.M.; Zhao, M.; Chang, J. A review of fluorescent signal-based lateral flow immunochromatographic strips. J. Mater. Chem. B 2017, 7, 5079–5091. [Google Scholar] [CrossRef]
  12. Hu, X.; Liu, T.T.; Zhuang, Y.X.; Wang, W.; Li, Y.Y.; Fan, W.H.; Huang, Y.M. Recent advances in the analytical applications of copper nanoclusters. Trends Analyt. Chem. 2016, 77, 66–75. [Google Scholar] [CrossRef]
  13. Bapat, G.; Labade, C.; Chaudhari, A.; Zinjarde, S. Silica nanoparticle based techniques for extraction, detection, and degradation of pesticides. Adv. Colloid Interface Sci. 2016, 237, 1–14. [Google Scholar] [CrossRef] [PubMed]
  14. Sun, Y.-L.; Sun, S.-M.; Wang, P.; Dong, W.-F.; Zhang, L.; Xu, B.-B.; Chen, Q.-D.; Tong, L.-M.; Sun, H.-B. Customization of Protein Single Nanowires for Optical Biosensing. Small 2015, 11, 2869–2876. [Google Scholar] [CrossRef] [PubMed]
  15. Sima, F.; Kawano, H.; Miyawaki, A.; Kelemen, L.; Ormos, P.; Wu, D.; Xu, J.; Midorikawa, K.; Sugioka, K. 3D Biomimetic Chips for Cancer Cell Migration in Nanometer-Sized Spaces Using “Ship-in-a-Bottle” Femtosecond Laser Processing. ACS Appl. Bio Mater. 2018, 1, 1667–1676. [Google Scholar] [CrossRef]
  16. Pla-Tolós, J.; Moliner-Martínez, Y.; Molins-Legua, C.; Herráez-Hernández, R.; Verdú-Andrés, J.; Campíns-Falcó, P. Selective and sensitive method based on capillary liquid chromatography with in-tube solid phase microextraction for determination of monochloramine in water. J. Chromatogr. A 2015, 1388, 17–23. [Google Scholar] [CrossRef]
  17. Meseguer-Lloret, S.; Molins-Legua, C.; Verdú-Andrés, J.; Campíns-Falcó, P. Chemiluminescent method for detection of eutrophication sources by estimation of organic amino nitrogen and ammonium in water. Anal. Chem. 2006, 78, 7504–7510. [Google Scholar] [CrossRef]
  18. Khan, P.; Idrees, D.; Moxley, M.A.; Corbett, J.A.; Ahmad, F.; Von Figura, G.; Sly, W.S.; Waheed, A.; Hassan, M.I. Luminol-based chemiluminescent signals: Clinical and non-clinical application and future uses. Appl. Biochem. Biotechnol. 2014, 173, 333–355. [Google Scholar] [CrossRef] [PubMed] [Green Version]
  19. Jornet-Martinez, N.; Moliner-Martinez, Y.; Herráez-Hernández, R.; Molins-Legua, C.; Verdú-Andres, J.; Campíns-Falcó, P. Designing solid optical sensors for in-situ passive discrimination of volatile amines based on a new one-step hydrophilic PDMS preparation. Sens. Actuators B 2016, 223, 333–342. [Google Scholar] [CrossRef]
  20. Jornet-Martínez, N.; Bocanegra-Rodríguez, S.; González-Fuenzalida, R.A.; Molins-Legua, C.; Campíns-Falcó, P. In Situ Analysis Devices for Estimating the Environmental Footprint in Beverages Industry. In Processing and Sustainability of Beverages, Processing and Sustainability of Beverages; Elsevier Inc.: Amsterdam, The Netherlands, 2019. [Google Scholar] [CrossRef]
  21. Bocanegra-Rodríguez, S.; Jornet-Martínez, N.; Molins-Legua, C.; Campíns-Falcó, P. Delivering Inorganic and Organic Reagents and Enzymes from Zein and Developing Optical Sensors. Anal. Chem. 2018, 90, 8501–8508. [Google Scholar] [CrossRef] [PubMed]
  22. Serra-Mora, P.; Jornet-Martinez, N.; Moliner-Martinez, Y.; Campíns-Falcó, P. In tube-solid phase microextraction-nano liquid chromatography: Application to the determination of intact and degraded polar triazines in waters and recovered struvite. J. Chromatogr. A 2017, 1513, 51–58. [Google Scholar] [CrossRef] [PubMed]
Figure 1. Reactions involved in the chemiluminescence assay. Luminol* is the excited electronic state of the oxidized form and sheds its “extra” energy by emitting a photon of light.
Separations 08 00149 g001
Figure 2. Procedure of TEOS/MTEOS/luminol sensor fabrication.
Separations 08 00149 g002
Figure 3. Optimization of concentration of hypochlorite and luminol working in solution to measure organic amino nitrogen and ammonium with a portable luminometer.
Separations 08 00149 g003
Figure 4. Different support material tested in order to immobilize luminol. (A,B) PDMS with different size; (CE) PDMS and TEOS with different size; (F) zein.
Separations 08 00149 g004
Figure 5. (A) Developed TEOS/MTEOS sol–gel sensor in the polystyrene tube. (B) % of remaining activity in the developed devices at different time to heat the device in the oven at 40 °C. (C) % reaction inhibition as function of nitrogen concentration (7.5 µM and 15 µM).
Separations 08 00149 g005
Figure 6. Microscopy images of the developed TEOS/MTEOS sensor. (A) Without luminol and (B) with luminol (10× and 50×). (C) SEM micrographs of TEOS-MTEOS-luminol.
Separations 08 00149 g006
Table 1. Selected review articles showing the last topics about optical sensors.
Analytes/Publication Year/Covered TopicReference
Micro-and nanoplastics in water/2021/Potential in situ integrated optical devices.[3]
Environmental pollutants/2021/Updated guide on fluorescent metallic nanosystems used as optical sensors.[4]
Nitrate, nitrite, phosphate, and ammonium in aquatic environment/2020/Recommendations and future directions for improving sensing accuracy and robustness.[5]
Environmental analysis/2020/A brief insight into low-cost and disposable colorimetric sensors.[6]
Several/2020/A roadmap to deploy plasmonic sensors is provided. [7]
Pesticides/2020/Point-of care biosensors such as colorimetric, fluorescence, chemiluminescence, photoluminescence, surface-enhanced Raman scattering, and electrochemical.[8]
Several/2020/Representative applications of CuNCs in detection and in vivo/in vitro imaging and in situ generation for sensing and bioimaging.[9]
Dissolved organic matter/2020/Advances in in situ fluorescence measurements in various water environments.[10]
Several/2017/Different fluorescent reporters applied and their unique properties as well as signal amplification strategies helping to enhance detection performance. [11]
Several/2016/Recent advances in the analytical applications of Cu NCs based on their optical, electrochemical, and catalytical properties. [12]
Pesticides/2016/SiNPs on account of their chemically inert nature and amenability to surface modifications as tools for fabricating devices for ‘on-site’ applications.[13]
Table 2. Different mixtures tested in order to develop a luminol sensor. For all mixtures, 4.4 µL of nanopure water was used.
ReagentSensor ASensor BSensor C
TEOS (µL)8.98.98.9
MTEOS (µL)8.98.98.9
Luminol 0.4 M (pH = 10.7) (µL)177.8177.8177.8
PEG (mg)-5.8-
Glycerol (mg)--1.8
Table 3. Several figures of merit of portable bynomial sensor luminometer and conventional procedure: in solution and lab equipment. a by using the sensor b in solution.
KindCalibrationPrecision, % RSD (n = 3)
EquipmentLinear Range (ppm)Slope (ppm−1)R2IntradayInterdayLOD (ppm)
Portable a0.036–0.35(−4.2 ± 0.2)1060.9913.450.012
Conventional b0.24–4−2370 ± 700.9940.81-0.07
Table 4. Nitrogen found and recoveries in different water samples. a Processed in situ.
SampleAdded (ppm N)Found (ppm N)(%) Recovery
Fountain (S1) a00.08 ± 0.01
0.070.140 ± 0.00497
0.1050.26 ± 0.03107
River (S2)00.268 ± 0.009
0.070.344 ± 0.020109
Transition (S3)00.073 ± 0.009
0.070.144 ± 0.011101
0.1050.19 ± 0.02107
Lagoon (S4)00.228 ± 0.011
0.070.306 ± 0.007112
0.1050.327 ± 0.01994
Sea (S5)00.16 ± 0.03
0.070.228 ± 0.00698
0.1050.271 ± 0.018106
Publisher’s Note: MDPI stays neutral with regard to jurisdictional claims in published maps and institutional affiliations.

