1. Introduction
Acute skin and skin structure infections (ASSSI) and community-acquired pneumonia (CAP) are the most common bacterial infection diseases across the globe. Patients infected by ASSSI and CAP are related with high morbidity, mortality or long term stays in clinics, in this manner forcing a critical burden from a societal and health-payer perspective [
1,
2,
3]. Delafloxacin (DFX) is a novel fluoroquinolone (FQ) class antibiotic, approved by the US Food and Drug Administration for treatment of ASSSI and CAP [
4]. DFX is an anionic FQ and has broad spectrum activity against Gram-positive, Gram-negative and atypical activity, including activity against FQ non-susceptible methicillin-resistant staphylococcus aureus (MRSA) isolates [
3,
5,
6]. Unlike other FQ, DFX possesses distinct chemical characteristics by three unique modifications in their quinolone ring, which increase its antimicrobial activity as well as its pharmacokinetic and toxicity profile [
7]. The presence of a hetero-aromatic ring at the N
1 position produces its antibacterial activity; a weak polar group at the C
8 position enhances its potency against quinolone-resistant Gram-positive bacteria; and the absence of basic group at the C
7 position makes it weakly acidic, thereby causing increased intracellular penetration in bacteria in acidic environments (
Figure S1) [
8,
9,
10].
The recommended intravenous (IV) dose of DFX is 300 mg twice daily for a 60-min infusion, whereas it is administered orally as 450 mg twice daily for 5–14 days [
4]. Much evidence has confirmed that the recommended dose and frequency of administration for FQs may be not suitable for all patients, and it might be exposed to a high risk for quinolone resistance [
11]. Therefore, during FQ therapy, therapeutic drug monitoring (TDM) is an informative tool used to correlate pharmacokinetic (PK) and pharmacodynamics (PD) relationships to optimize personalize therapy for therapeutic success, reduce toxicity risk, increase patient compliance and to minimize the chance for antimicrobial resistance [
12,
13]. Consequently, the relationship between the peak plasma concentration (C
max) and the minimum inhibitory concentration (MIC), together with the relationship between the area under curve (AUC) and the MIC of the drugs, are the most relevant PK/PD ratios employed for the evaluation of the effective therapy, adverse events and to minimize the antimicrobial resistance [
14]. Like other FQs, the PK/PD relationship of DFX most closely associated with the efficacy was the 24 h (free-AUC)/MIC ratio [
15]. Before performing TDM, a selective, precise and reliable assay must be available to determine the drug in the blood or other biological matrices. Being a novel FQ, only few assays are available in the literature for quantification of DFX in biological samples [
16,
17,
18]. Among the available techniques, high-performance/ultra-performance liquid chromatography techniques, coupled with mass spectrometry (HP/UPLC-MS/MS) detection, is considered the gold standard method to accurately determine the plasma concentrations of drugs [
19]. However, the sample preparation methods for previously reported HP/UPLC-MS/MS methods are based on liquid-liquid extraction (LLE), which requires high solvent consumptions, a time consuming and evaporation-reconstitution step before sample analysis.
Green analytical techniques offer many advantages over routine techniques for the analysis of compounds in pharmaceutical or biological samples [
20,
21,
22,
23]. Numerous metric approaches, e.g., the Analytical Eco-Scale (AES), Red-Green-Blue (RGB), Green Analytical Procedures Index (GAPI), National Environmental Methods Index (NEMI) and AGREE metric approaches have been applied for the greenness evaluation of various analytical methods [
24,
25,
26,
27,
28]. The previous greenness assessment (NEMI, AES, GAPI and RGB) methods are based on the limited number of principles of green analytical chemistry (GAC). However, the newly developed metric approach “AGREE” utilizes all 12 principles of GAC, which is a better predictor of the greenness and therefore was used for the greenness assessment of the current method [
26]. The aim of this study was to develop a simpler and reliable environmentally benign green UPLC-MS/MS method for high-throughput analysis of DFX in plasma samples. Since DFX is not yet registered in Saudi Arabia, ethical issues pertaining to the use of drugs in human subjects restricted us in making a direct application of the method in human subjects. Therefore, the developed method was successfully applied in pharmacokinetic studies of novel oral self-nanoemulsifying drug delivery system (SNEDDS) formulation in rats [
29]. Moreover, Deming regression analysis was used to establish the linear relationship between this method and our previously reported LLE method [
16].
2. Material and Methods
2.1. Chemical and Reagents
DFX (purity; ≥98.0%) was purchased from “Beijing Mesochem Technology Co. Ltd. Beijing, China” whereas losartan (used as internal standard; IS) was from “Amriya Pharmaceutical Industries Cairo, Egypt” (
Figure S1). Gradient grades of methanol and acetonitrile (ACN) were procured from “Fisher Scientific Limited, Leicestershire, UK”. The formic acid and dimethyl sulphoxide (DMSO), both of AR grade, were from “Loba Chemie Pvt. Ltd. Mumbai, India” and were used for the stock solution and mobile phase preparation, respectively. Deionized water was dispensed from “Milli-QR Gradient A10R, Millipore, Moscheim Cedex, France” and was used in the studies.
2.2. Instrumentation
UPLC-MS/MS quantitation was performed on an Acquity triple quadrupole (TQD) mass spectrometer linked to an Acquity H-Class UPLC system (Waters Corp., Milford, MA, USA). Chromatographic separation was performed on a Waters Acquity BEH C18 Column [50 mm × 2.1 mm (i.d.); 1.7 μm particle size] connected with a 0.2 μm inline disc filter (Waters Corp., Milford, MA, USA). The mobile phase was eluted in gradient mode at flow rate of 0.3 mL min−1, consisting of a mixture of 0.1% formic acid in water as solvent A and 0.1% formic acid in ACN as solvent B. Gradient conditions were 0–0.5 min, 20–80% B; 0.5–1.0 min, 50% B; 1–2 min, 20% B. The following settings were used: sample injection volume, 5 μL (partial loop mode); column oven temperature, 35 °C; auto-sampler temperature, 12 °C; and total run time, 3 min. The washing solvent consisting of a mixture of ACN and water (80:20, v/v) was used.
The electrospray ionization (ESI), operated in positive mode, was used for ionization processing, and multiple reaction monitoring (MRM) was used for identification and quantification of compounds. The precursor to the product ion transition of 441.1 → 379.1 (qualifier), 441.1 → 423.1 (quantifier) for DFX and 423.1 → 207.1 for IS were monitored. The quantifier-to-qualifier ion ratio was expected to be within 20% of those in QC samples. The mass spectrometry parameters were optimized as capillary voltage 3.60 kV, and source and desolvation temperatures were set at 150 °C and 350 °C, respectively. Cone voltage (CV) was 36 V and 22 V for DFX and IS, respectively, whereas optimal collision energy (CE) was determined at 26 eV (qualifier) and 20 eV for both quantifier and IS, respectively. The dwell time for all transitions was set to 0.106 s (
Table 1). Nitrogen (650 L/h) and argon (0.16 mL min
−1) were used as desolvation and collision gas flow, respectively. The MassLynx V4.1 and TargetLynx V4.1 software were used for sample acquisition and data processing, respectively.
2.3. Preparation of Stock, Calibration Standards (CSs) and Quality Controls (QCs) Samples
The stock solution of DFX (1 mg mL−1) and losartan (500 µg mL−1) were prepared in DMSO and methanol, respectively, after accurate weighing of their standard. The DFX stock was further serially diluted with 50% methanol to achieve different working standard solutions. These working standards were further spiked to blank human plasma to achieve the plasma CSs of 2.92, 9.72, 32.40, 108, 360, 1200, 4000 and 6666 ng mL−1 concentration. Similar steps were followed to prepare plasma QC samples of 9.6 ng mL−1 (LQC), 480 ng mL−1 (MQC) and 6000 ng mL−1 (HQC) concentrations. The IS working standard of 1 µg mL−1 was also prepared in 50% methanol as and when required. All aqueous solutions were stored in a refrigerator temperature at 4 ± 2 °C, whereas spiked plasma samples were kept in a deep freezer (80 ± 5 °C).
2.4. Sample Preparation
An aliquot of 150 µL of plasma samples (CSs, QC and real samples) were transferred into a 2 mL capacity Eppendorf tube. The 20 µL of IS (1 µg mL−1) was added into each sample except blank and vortex-mixed for 30 s. Then, 300 µL of ACN was added into each tube and vortex-mixed thoroughly for 1 min for each sample. The samples were transferred for cold (4 °C) centrifugation up to 12 min at 10,500× g. After centrifugation, 150 µL of supernatant were transferred to insert (containing preinstall spring) subjects to UPLC-MS/MS analysis.
2.5. Method Validation
The method was validated in a plasma matrix by following guidelines for bioanalytical method validation [
30]. The validated parameters were selectivity, sensitivity, linearity, precision and accuracy, matrix effects and recovery, carryover effects and stabilities studies. In addition, partial validation in terms of precision and accuracy were also performed in a rat plasma matrix before its application in pharmacokinetic study.
2.5.1. Selectivity/Specificity and Carryover Effects
For method selectivity (endogenous interference) determination, two types of samples were analyzed: six blank human plasma samples (from different lots) and samples spiked with DFX at the lower limit of quantification (LLOQ) level with IS. The carry-over effects were determined to ensure the absence of sample response effects of previous injection on the next samples during analysis. It was measured by comparing the response of blank plasma samples which were injected just after the injection of the highest calibrator samples of the calibration curve (CC). All samples were processed and analyzed according to proposed method procedure. The endogenous interference or carry-over effects were negligible when the disturbance peak areas were ≤20% of LLOQ for DFX and 5% for IS.
2.5.2. Linearity and Sensitivity
The linearity of an analytical procedure is the ability to gain test results which are directly proportional to the concentration of analyte in the sample. It was determined by analyzing three independent CCs which were prepared by spiking eight different concentrations (2.92–6666 ng mL−1) of DFX. The CCs were established using a peak area ratio of DFX/IS versus the DFX actual concentrations. The slopes, intercepts and regression coefficients (r2) were obtained by linear regression analysis. The best weighting factor (1/x2, 1/x, none) was selected in order to minimize the sum of squared residuals. Back-calculated standard amounts should not differ from ±15% of the nominal value (except ±20% for the lowest standard).
The LLOQ, which represents the sensitivity of the method, was determined by measuring the lowest concentration of the CCs, whose response should be five times higher than the blank samples. Consequently, its back-calculated concentration must be 80–120% accuracy and precision within the ±20% range.
2.5.3. Precision and Accuracy
The precision of an analytical procedure is expressed as the closeness of agreement between the measured values obtained by the replicate measurements and the measure as a coefficient of variation (CV = (SD/mean) × 100), while accuracy is expressed as the closeness of a measured value to real value expressed as (measured concentration/nominal concentration) × 100. Both precision and accuracy were measured at LLOQ and all three QC concentrations in five replicates. All samples were analyzed on the same day and on three consecutive days to evaluate within- and between-day variation in precision and accuracy. The criteria for acceptability of precision is within ±15% (CV, %) and accuracy is within ±15% deviation from the nominal values, except for LLOQ, which is within 20%.
2.5.4. Recovery and Matrix Effects
The percentages of extraction recovery (% ER) and matrix effects (% ME) were evaluated by comparing the peak area of the analyte and IS by using their LQC, MQC and HQC samples (n = 6). Three sets of samples were prepared which included blank plasma matrices spiked with analyte before sample processing (A); blank plasma matrices spiked with analyte after sample processing (B); and spiking of analyte in a mixture of ACN:water (3:1, v/v) (C). All samples were analyzed by the proposed method, and their peak areas were measured. The % ER was calculated as A/B*100, whereas % ME was measured as B/C*100. A similar procedure was followed to determine % ER and % ME of IS. For acceptance, the variation in % ER at each QC level should be <15% (CV, %); however, % ME should be ±15% for each QC level.
2.5.5. Stability
The stability of DFX in different storage conditions was evaluated at LQC and HQC concentrations in five replicates. The bench top stability was determined by keeping the samples at room temperature for 12 h before processing. The auto-sampler stability was determined by keeping the processes samples in a sample manager at 12 °C for 24 h before analysis. The freeze–thaw stability was determined over three freeze–thaw cycles. In each cycle, the samples were frozen and stored at −80 °C for 24 h and then thawed at room temperature. The long term stability was determined after storing the untreated QC samples at −80 °C for 60 days. All samples were analyzed and determined with freshly prepared CCs and were considered to be stable if their method values were within 15% error of the nominal values.
2.6. Greenness Assessment Using AGREE (Analytical Greenness Metric Approach and Software)
The greenness assessment of the developed method was performed by utilizing all 12 principles of GAC [
26]. The eco-scale values were calculated using “AGREE: The Analytical Greenness Calculator (version 0.5, Gdansk University of Technology, Gdansk, Poland, 2020)”.
2.7. Application in Preclinical Pharmacokinetic Study
In order to investigate the feasibility of the method, the method was applied successfully in a preclinical pharmacokinetic study on twelve healthy male Wistar albino rats which were divided into two groups: one as the control (normal suspension) and the other as the treated group (SNEDDS). The experimental protocol was approved by the “Research Ethics Committee (Reference no. KSU-SE-19-27, dated 6 March 2019)”. The blood samples were collected from them at a predetermined time interval after dosing. The plasma samples were separated and were stored in a deep refrigerator until analysis by the proposed method.
2.8. Correlation with Previous Method
Deming regression was applied by analyzing 14 randomly taken actual rat samples to establish the relationship between this PPT method and our previously reported LLE method [
16], assuming equal variance among them. Statistical analyses were performed using QI Macros
®, SPC Excel add-in software (KnowWare International, Inc., Denver, CO, USA).
3. Results and Discussion
3.1. Optimization of Mass Spectrometry Conditions
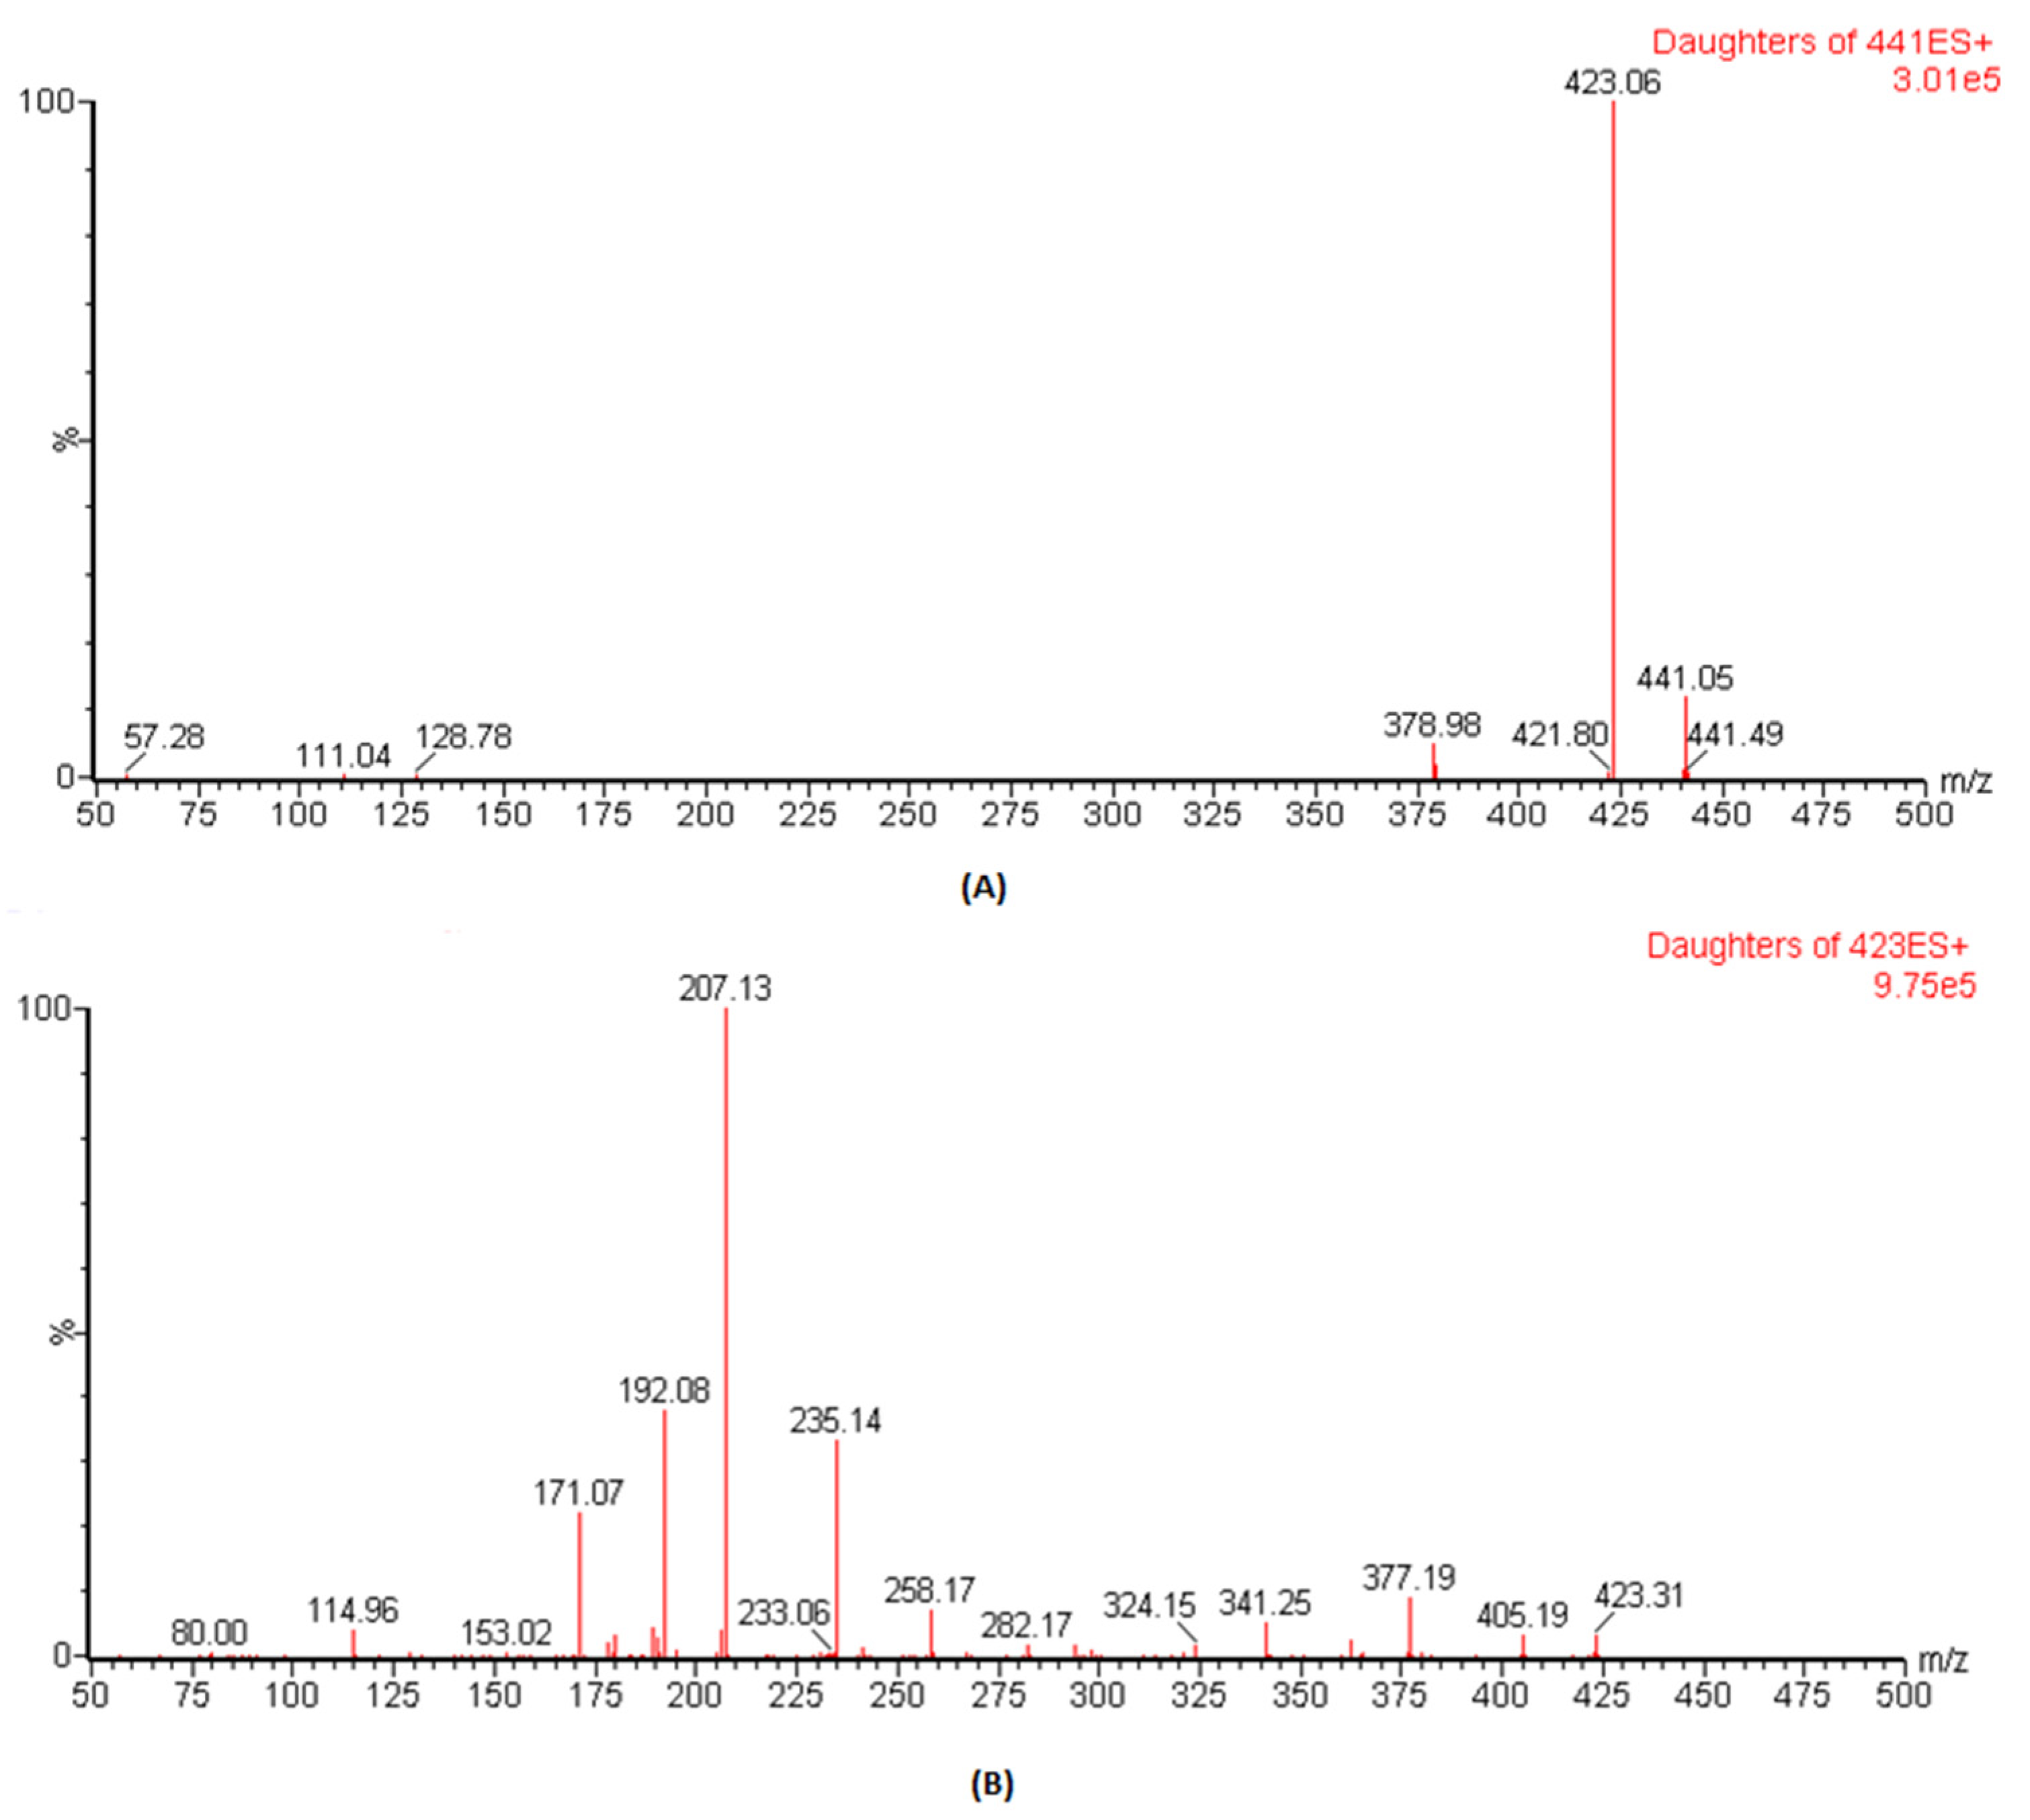
The ESI conditions for DFX and IS (losartan) were optimized, and analysis was carried out by mass spectral scanning equipped with IntelliStart technology where the conditions were automatically optimized both for the precursor and the daughter ions. During IntelliStart programming, DFX was found to be sensitive in positive mode and produced precursor ions at 441.1, which, on fragmentation, gave daughter ions at 379.1 with high intensities. Therefore, in previous reported assays, the precursor to product ions of 441.14 → 379.1 was used as
m/
z ion transition for quantitative analysis [
16,
17]. However, once we performed manual optimization, the spectra of daughter ions at
m/
z of 223.1 was more dominant than
m/
z of 379.1 (
Figure 1). Therefore, herein, the precursor to the product ion transition of 441.1 → 423.1 was selected as the quantifier whereas the transition of 441.1 → 379.1 was used as the qualifier in this study. For IS,
m/
z of 423.1 → 207.1 produced more predominant intensities and was selected for MRM transition. The optimized parameters such as “precursor & daughter ions, ionization mode, dwell time, cone voltage and collision energy”, to achieve the best results for these conditions, are presented in
Table 1.
3.2. Optimization of Sample Preparation Method
Protein precipitation is one of the more straightforward, simple, one-step and cost-effective approaches for sample preparation and is used for generating clean extracts for LC-MS quantitation from samples. It is typically performed by direct addition of a precipitating agent (e.g., ACN/methanol/acetone) to sample matrices followed by precipitation (mixing/vortexing) and centrifugation (to draw the protein precipitate to the bottom of the sample vial, leaving other components in the liquid layer). Their suitability using organic solvents (methanol, acetone and ACN) or mixtures in different ratios with the sample matrix were tied. Interestingly, the ACN in ratio of 2:1 with sample matrix produced acceptable sensitivity and matrix effects without following the dying and reconstitution steps and was selected for sample preparation procedure. However, our previous method, the protein precipitation method, was not sufficient due to poor recovery and high matrix effects, which might be due to isocratic mobile phase elution and low sensitivity with 441.1 → 379.1. By using the protein precipitation method, we were able to achieve the LLOQ value of 2.92 ng/mL−1 (without drying and reconstitution steps).
3.3. Optimization of Chromatographic Conditions
Good chromatographic conditions should have ability to efficiently elute the analytes of choice and separate them from the co-eluting endogenous substances and impurities at the lowest possible levels of concentration. By using our previous mobile phase conditions (isocratic elution), we did not achieve the desired sensitivity (2.92 ng/mL) and acceptable matrix effects by using the protein precipitation method. Therefore, we screened the chromatographic elution by the gradient programing mode by using different organic modifiers (methanol, ACN) and aqueous buffers (formic acid, ammonium acetate). Finally, the ACN and waters, both having 0.1% formic acid, produced the best separation with acceptable matrix effects at a flow rate of 0.3 mL min−1 by gradient programing, starting the organic phase with 20%. During column selection, the Acquity BEH C18 column of 50 and 100 mm with the same internal diameter (2.1 mm) and particle size (µm) were tried, and finally, optimum retention time (tR) with peak symmetry was achieved with a 50 mm column and was fixed for separation. The total rum time was 3 min to equilibrate with proper washing and balancing of the column.
3.4. Method Validation
3.4.1. Selectivity and Carry-Over Effects
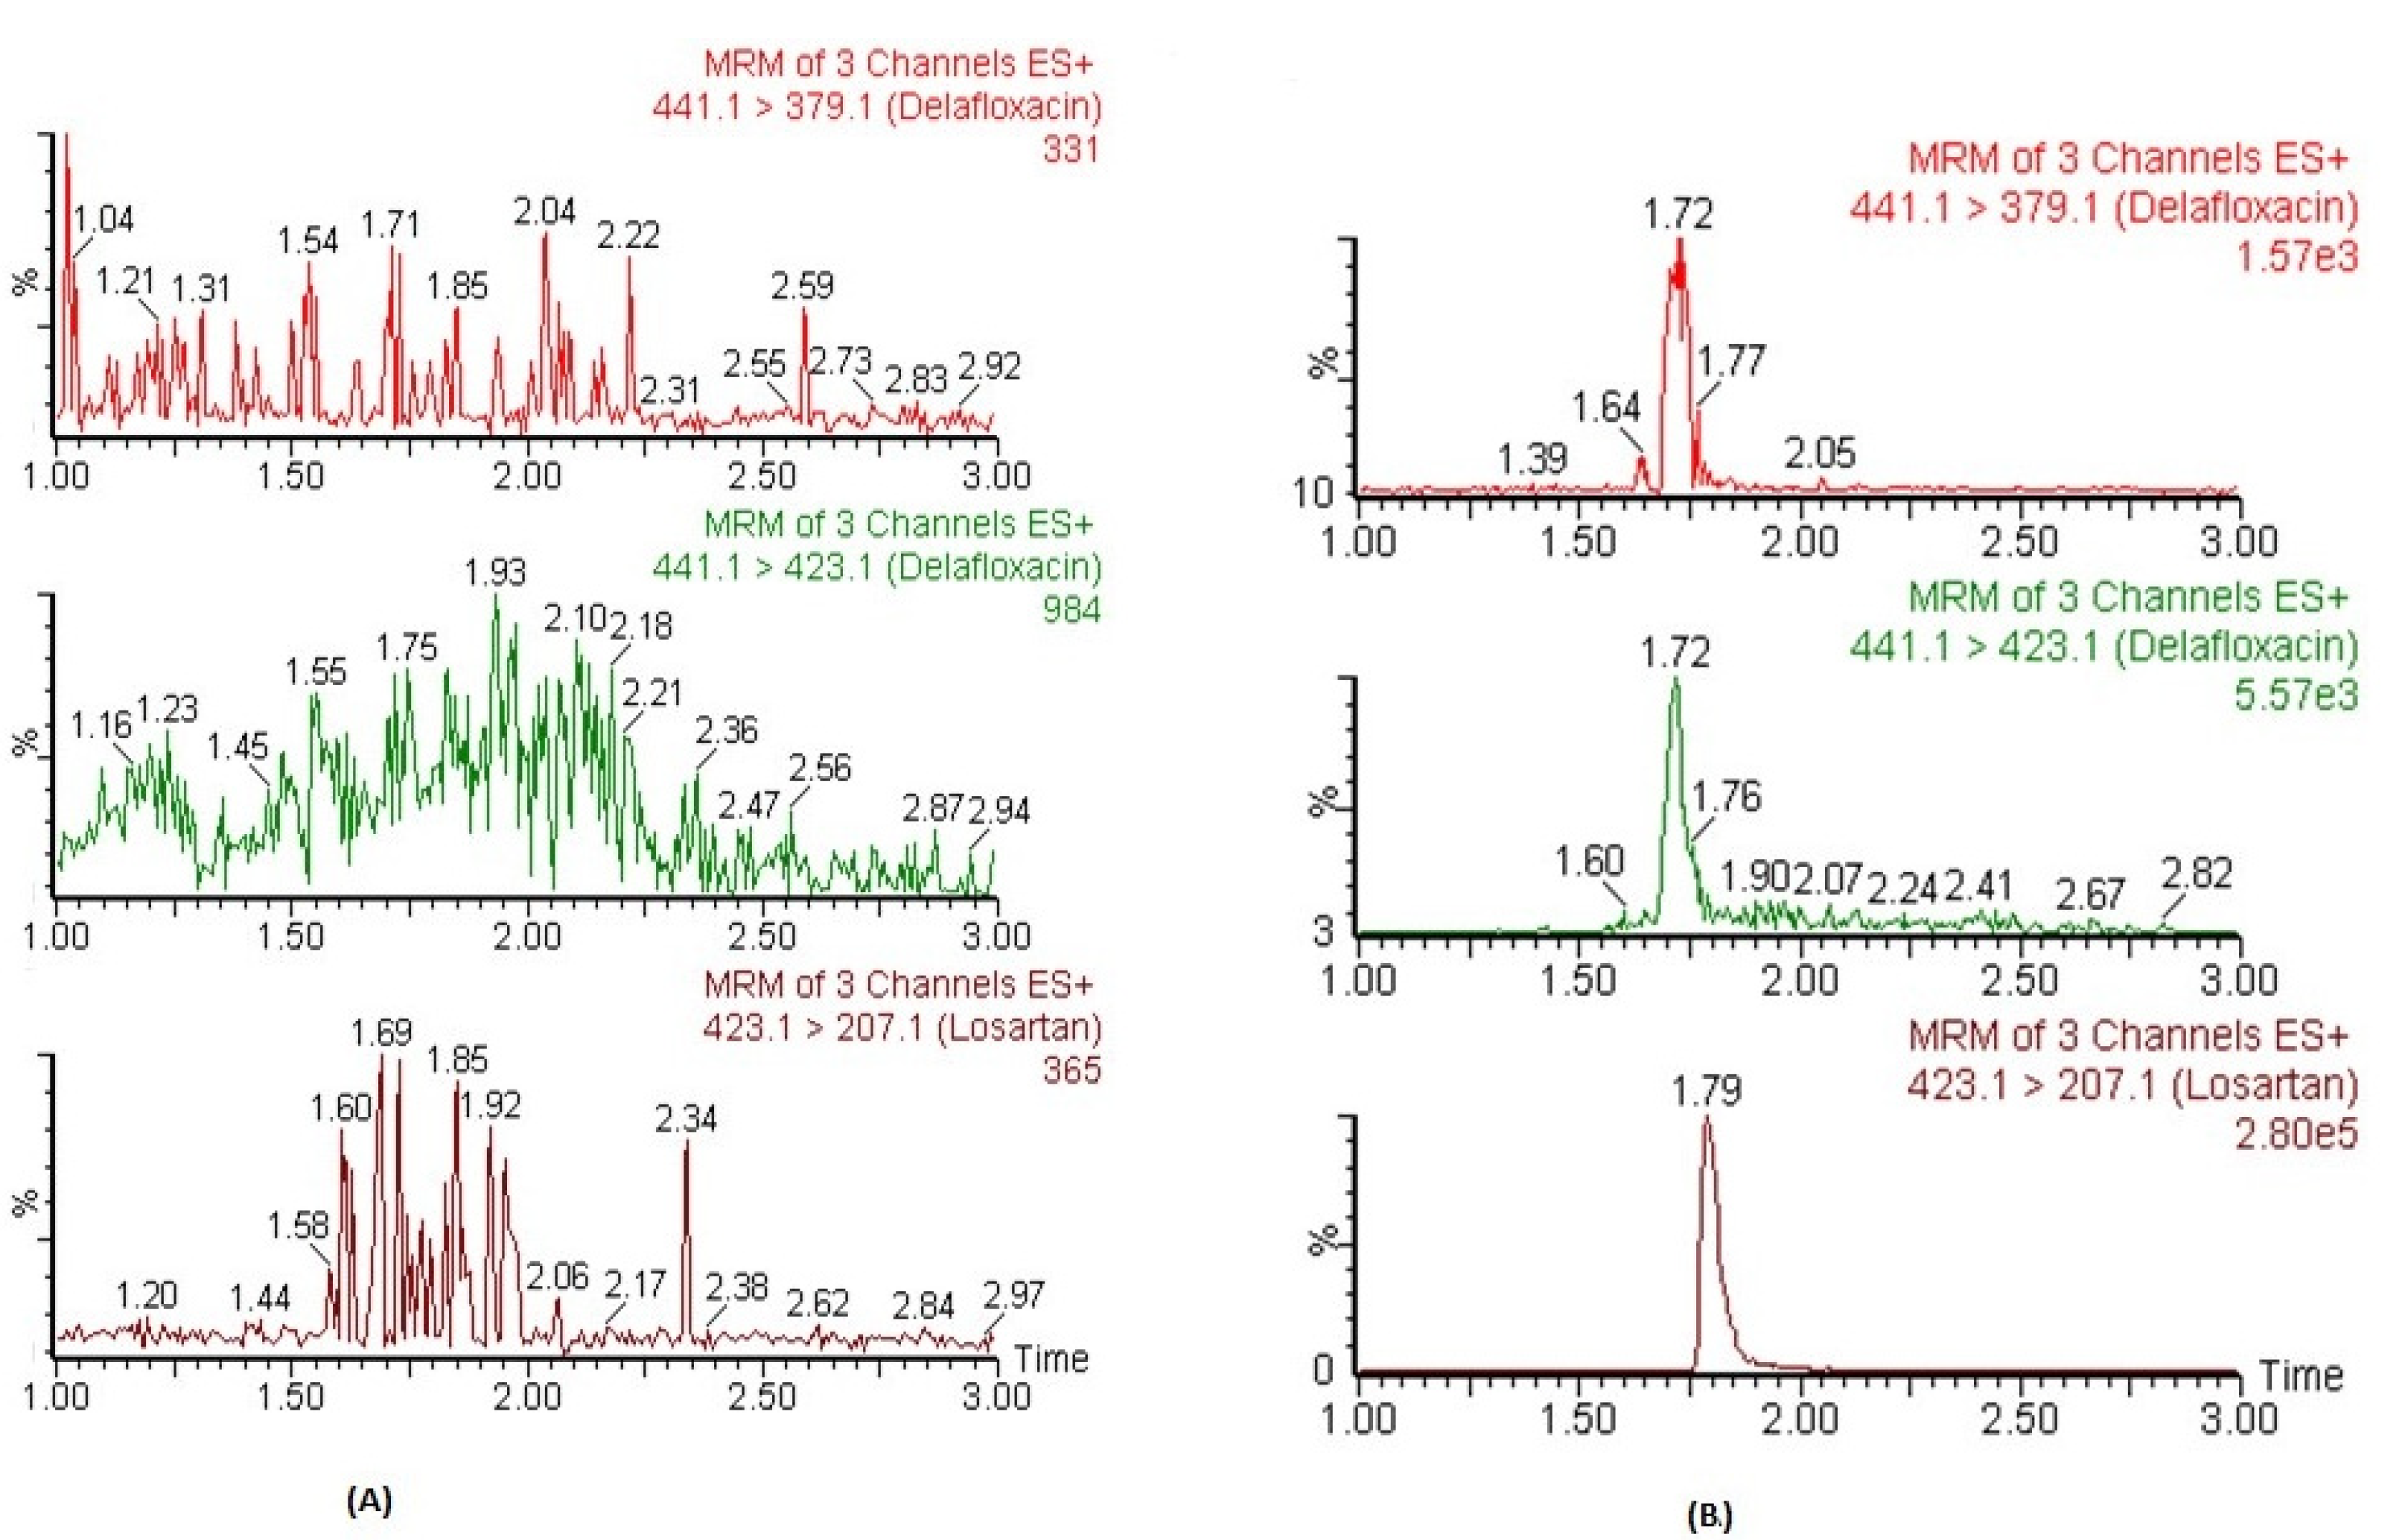
The chromatograms of blank plasma did not show any significant co-eluting peaks at t
R of DFX and IS. The t
R DFX and IS were 1.72 and 1.79 min, respectively.
Figure 2A represents the chromatograms of blank plasma samples for DFX and IS. Similarly, no significant peaks (≥20% of lower limit of quantification; LLOQ) were observed in processed blank samples which were injected just after the highest calibrator-processed samples of CC. These findings indicate that this method exhibited excellent specificity, and carryover was determined to be negligible.
3.4.2. Linearity and Sensitivity
The CCs in human plasma were found to be linear between concentration ranges of 2.92–6666 ng mL
−1 with an acceptable correlation coefficient of r
2 ≥ 0.995. The mean back-calculated concentration of all calibrators of three CCs were within the acceptable limits range of ±15% variation, and precisions values were ≤15% (CV, %). The weighing factor of 1/x
2 showed minimum bias during weighing factor optimization of back-calculated concentrations. Within this linear concentration range, the plasma concentrations could be detected precisely. The lowest concentration of the CCs was 2.92 ng mL
−1, which was detected and quantified with acceptable accuracy and precision (≤20%) and was considered as LLOQ of the assay. Moreover, its responses were five times higher than the blank samples. The representative MRM chromatograms of DFX and IS in human plasma spiked at LLOQ concentration are presented in
Figure 2B.
3.4.3. Accuracy and Precision
The precision and accuracy data of DFX in human plasma measured at LLOQ and all three quality control (LQC, MQC and HQC) concentrations are presented in
Table 2. Within- and between-day variations in precision were ≤10.86% and ≤11.23%, respectively, while the accuracy values ranged between 94.4–106.1% and 92.5–109.0%, respectively. These results ensured the reliability of the method for routine analysis of DFX in human plasma samples.
3.4.4. Recovery and Matrix Effects
The % ER and % ME of DFX and IS in human plasma samples are shown in
Table 3. The mean value of % ER from plasma was 66.6% for DFX over the three QC concentration ranges tested with 7.86% variation (CV, %), whereas for IS it was 83.3%. These data suggest that protein precipitation provides efficient and reproducible recovery for both analyte and IS, and it was consistent and repeatable. Additionally, no significant ME was observed over the three concentration ranges. The mean % ME was 101.8% with ≤8.90% deviation in CV%. Therefore, no oblivious ME was observed under these conditions, suggesting that protein precipitation-based CCs are suitable for accurate quantification of DFX in plasma samples.
3.4.5. Stability Experiments
The results of the stability experiments, including short-term (12 h), freeze-thaw (three cycles), auto-sampler (24 h) and long term (60 days) are shown in
Table 4. The data confirmed that the DFX was stable under all evaluated conditions as the measured concentrations were within the criteria of ± 15% deviation from the nominal concentration. These results confirmed the method’s reliability and can be analyzed without any chance of degradation under various anticipated storage conditions.
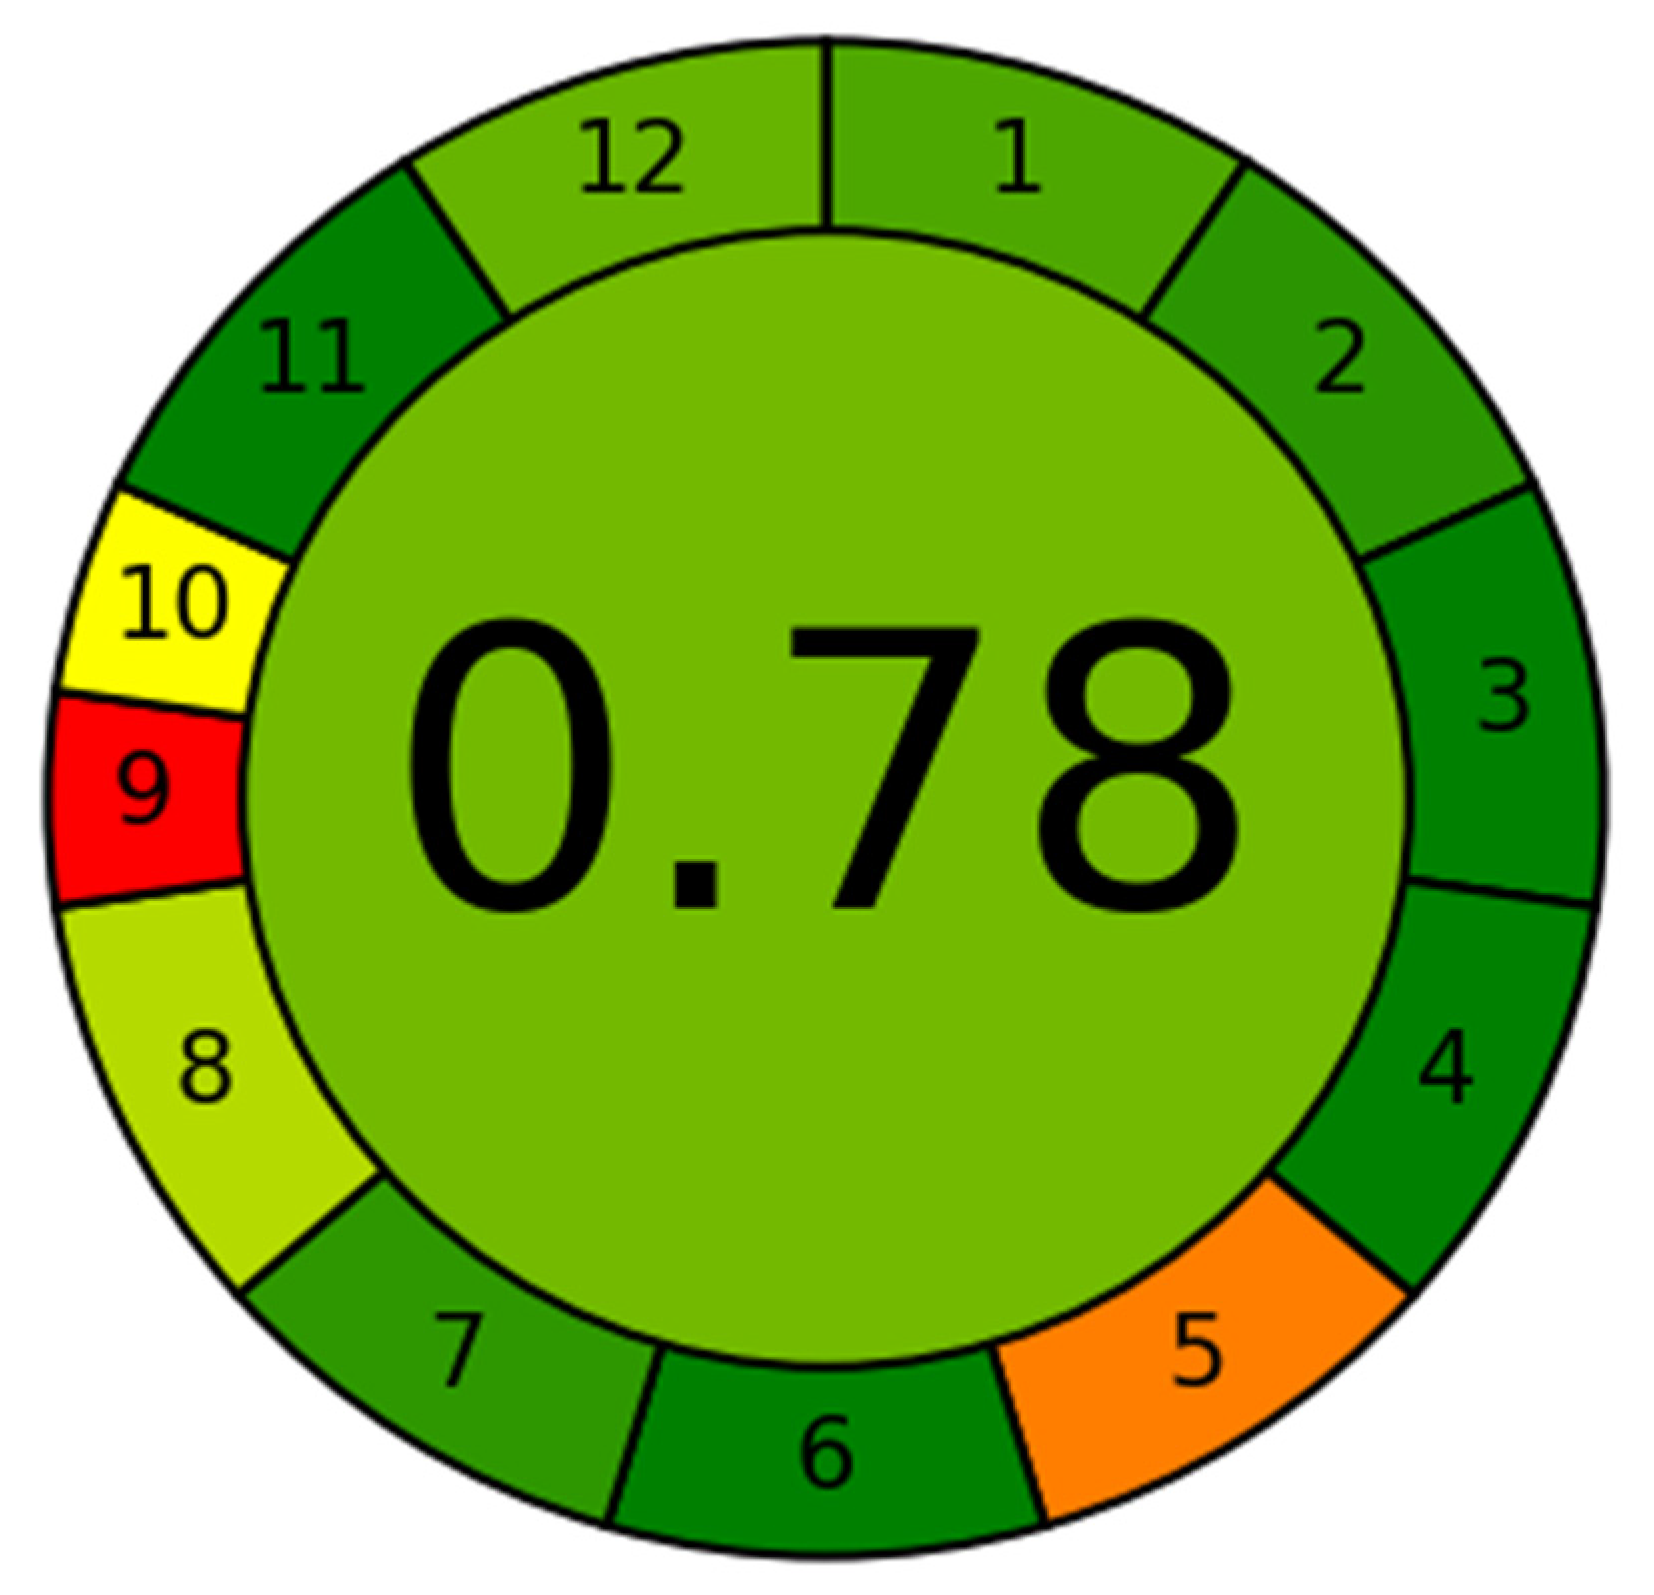
3.5. Greenness Assessment Using AGREE
The greenness assessment of the developed method was performed by newly introduce AGREE software with an eco-scale is based on all 12 principles of GAC [
26]. In this tool, the analytical eco-scales for different principles of GAC are assigned to 0.0–1.0 according to this metric approach. The overall eco-scale profile for this developed method is presented in
Figure 3, whereas the analytical greenness report sheet containing individual scores for all 12 criteria is presented in the
Supplementary Materials Section. The overall eco-scale of the method was found to be 0.78. The eco-scale values in the range of 0.75–1.00 indicated the excellent greenness of the analytical methodology. Therefore, our method can be considered as the excellent green method for quantitative analysis of DFX in plasma samples.
3.6. Correlation with Previous Method
The slope and intercept of Deming regression analysis were 0.967 and 34.31, respectively, with excellent linearity (
Figure S2). The slope value of 0.967 indicates that the drug concentrations in the PPT method were slightly lower than their respective paired LLE method. A high regression coefficient (r = 0.985) indicates that over 98% of data variability was interpreted by the model, and the same results can be estimated by both methods.
3.7. Literature Comparison of the Method
The comparison of this method with previously reported assays are presented in
Table 5. Compared to all previously reported assays, this study offers more sensitivity and a simple and fast one-step sample extraction procedure, which may qualify for high-throughput analysis. However, the HPTLC method [
18] was also performed by the protein precipitation method but had low sensitivity and a narrow calibration range (16–400 ng band
−1); therefore, it is not reliable for a large sampling-based pharmacokinetic study.
3.8. Assay Application in Pharmacokinetic Study in Rats
The developed method was applied in a comparative pharmacokinetic study of newly developed oral SNEDDS formulation of DFX with normal suspension in experimental rats [
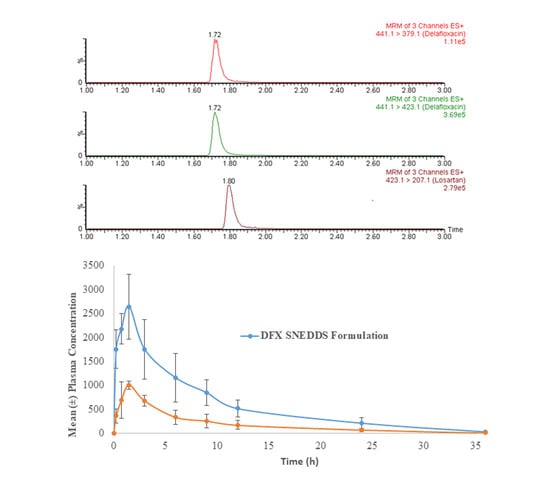
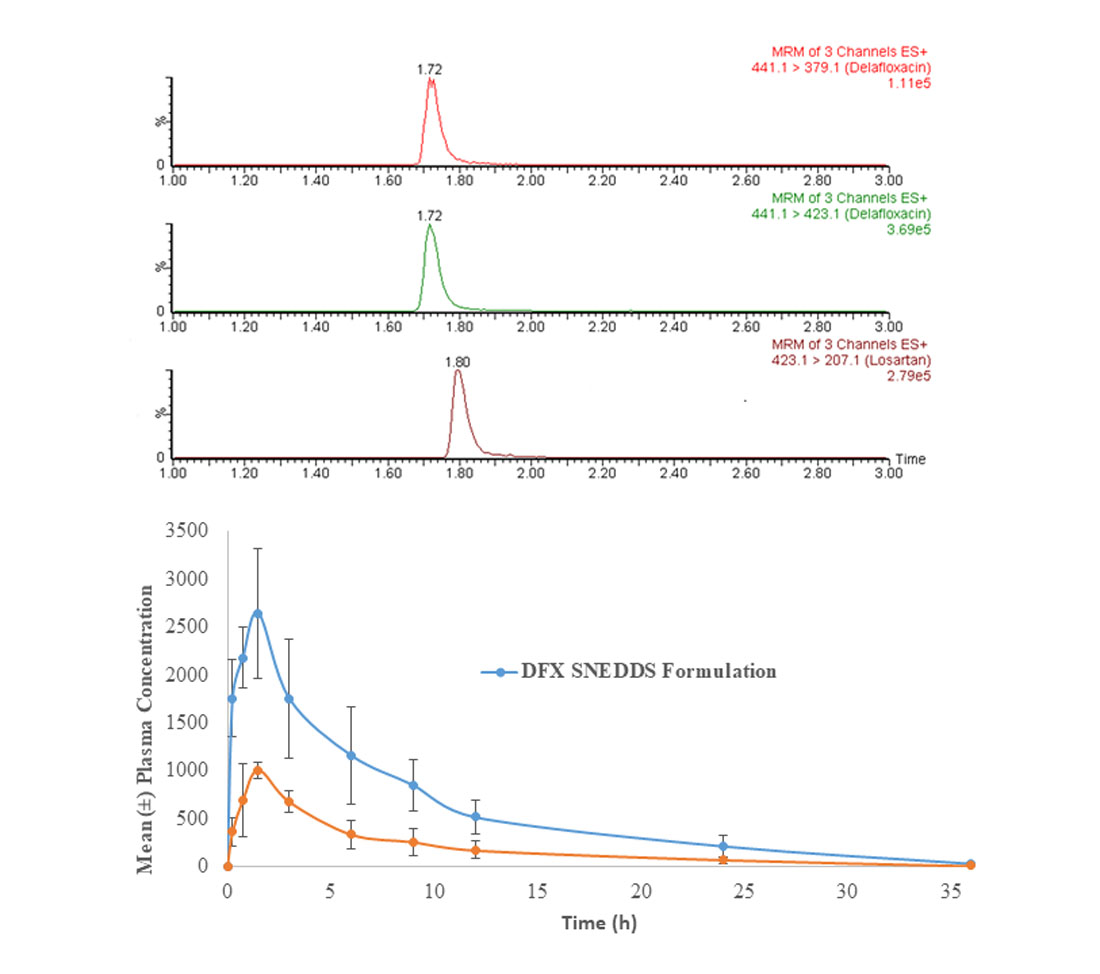
29]. Before application, a partial validation of the method by precision and accuracy parameters was performed in a rat plasma matrix. The comparative plasma drug concentration versus the time of SNEEDS and normal suspension are illustrated in
Figure 4A, whereas representative MRM chromatograms of real rat plasma samples at 1 h after oral administration of SNEDDS formulation of DFX are illustrated in
Figure 4B. As it can be very clearly observed from the graphs, both the maximum plasma concentration (C
max) and the area under curve (AUC) of the novel formulations (SNEDDS) are remarkably higher than the control suspension, which confirms the bioavailability enhancement effects of SNEDDS formulation. The details of comparative pharmacokinetic data have been reported in our previous study [
29].


