Article

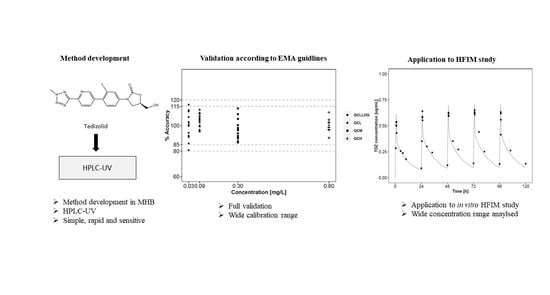
Determination of Tedizolid in Bacterial Growth Medium Mueller-Hinton Broth by High-Performance Liquid Chromatography and Its Application to an In Vitro Study in the Hollow-Fiber Infection Model

Department of Clinical Pharmacy, Institute of Pharmacy, University of Hamburg, Bundesstraße 45, DE-20146 Hamburg, Germany
*
Author to whom correspondence should be addressed.
Separations 2021, 8(9), 141; https://doi.org/10.3390/separations8090141
Submission received: 23 July 2021 / Revised: 25 August 2021 / Accepted: 29 August 2021 / Published: 2 September 2021
(This article belongs to the Section Analysis of Natural Products and Pharmaceuticals)

Abstract

:
Pharmacokinetic/pharmacodynamic (PKPD) studies of anti-infectives are frequently performed in in vitro infection models where accurate quantification of antibiotic concentrations in bacterial growth media is crucial to establish PK/PD relationships. Here, a sensitive and rapid high-performance liquid chromatography (HPLC) method was developed to quantify tedizolid (TDZ) in the bacterial growth medium Mueller-Hinton broth (MHB). Matrix components were separated by direct protein precipitation with methanol (1:1). The chromatographic separation was carried out in a Dionex Ultimate 3000 HPLC system using an Accucore® C-18 RPMS HPLC column (2.6 µm, 100 × 2.1 mm) using isocratic elution with 25% acetonitrile and 75% of 0.1% formic acid. The lower limit of quantification was 0.03 mg/L when measured at 300 nm. Following relevant European Medicine Agency guidelines, the method was successfully validated for linearity, selectivity, recovery, inter- and intra-day precision, and accuracy and stability. When applied to in vitro PKPD studies, the method successfully quantified a range of TDZ concentration (Cmin, 0.09-Cmax, 0.65 mg/L) in MHB. The analyzed concentrations were in line with the planned PK profiles. The application of the developed method to quantify TDZ in MHB in in vitro PKPD studies is warranted.

Graphical Abstract

1. Introduction

The growing concern of antibiotic resistance globally necessitates optimal antibiotic and dosing regimen selection. Tedizolid (TDZ, Figure 1) is a second-generation oxazolidinone that is effective against Methicillin-resistant Staphylococcus aureus (MRSA) and many linezolid- and vancomycin-resistant bacteria [1]. It is currently prescribed in patients with acute bacterial skin and skin structure infections, and it exhibited noninferiority in efficacy when compared to linezolid in phase 3 clinical studies [2]. In vitro pharmacokinetic/pharmacodynamic (PKPD) studies are frequently performed to quantify the concentration–effect relationship of TDZ against various bacteria using a variety of media and experimental settings [3,4,5]. Further PKPD studies are required to evaluate the use of tedizolid in further indications such as lung infections or infections in immunocompromised hosts. Accurate quantification of the pharmacokinetics (PK), the concentration time profile, is a core component in PKPD studies to affirm the mimicked PK profile and quantify any deviation or/and potential degradation of the antibiotic under study during the course of the experiment [6].
Several assays are published to quantify TDZ in human or animal plasma [7,8,9,10,11,12], sputum [13], saline [7], bronchoalveolar lavage [14], macrophages [14,15], rat cerebrospinal fluid [16], and Roswell Park Memorial Institute (RPMI) media/fetal bovine serum [4], using ultraviolet (UV) [7,10,17,18] or mass spectrometer (MS) detection methods [7,8,10,11,12,14,16,19,20]. Mueller-Hinton broth (MHB) is the most frequently used bacterial growth media in in vitro PKPD studies [21,22,23]. However, an analytical method to quantify TDZ in the commonly used bacterial growth medium MHB is lacking.
The aim of the current study was to (i) develop a highly sensitive and reproducible high-performance liquid chromatography (HPLC)-UV assay to quantify TDZ in MHB and fully validate it according to the European Medicine Agency (EMA) bioanalytical method validation guidelines [24]; and (ii) demonstrate its applicability in an in vitro PKPD study (hollow-fiber infection model) to quantify the mimicked PK profiles. TDZ is currently licensed for skin and skin structure infections; however, its high tissue and pulmonary penetration make it a potential candidate for further PKPD studies, particularly in pulmonary infections [10,14]. The current work will provide a simple analytical method to quantify TDZ in MHB in in vitro PKPD studies, which ultimately lends a solid foundation for potential research in TDZ dosing regimen design and the exploration of new clinical applications.

2. Materials and Methods

2.1. Chemicals

Cation-adjusted MHB (Sigma Aldrich, Darmstadt, Germany) was prepared as per the manufacturer manual. TDZ (purity: = 99.46%) was purchased from Hycultic, Beutelsbach, Germany, and antibiotic stock solutions of 1.0 mg/mL were prepared. Deionized water was obtained from a Milli-Q® deionization system (Millipore, Darmstadt, Germany). Acetonitrile (ACN), formic acid, and methanol (MeOH) of super-gradient grade were purchased at VWR, Hannover, Germany.

2.2. Preparation of Calibration and Quality Control Samples

The appropriately diluted TDZ stock solution (20 µL) was spiked into 180 µL of drug-free MHB to generate eight calibration standard solutions covering the relevant concentration range. Four quality control (QC) levels at the lower limit of quantification (QCLLOQ), at three times the LLOQ (QCL), at the medium calibration range (QCM), and at 80% of the highest calibrator (QCH) were separately prepared for each validation run (n = 5 for each QC level). The lowest standard on the calibration curve that could be reliably analyzed and that displayed a peak that was at least five times higher than any peak in the blank sample at the relevant retention time was selected as the LLOQ. Additional sets of quality control samples for each respective quality control level were prepared for in-study validation and measured with each respective run.

2.3. Sample Treatment

Due to the presence of proteins and impurities in the matrix that can affect the analyte recovery and/or clog the HPLC column, the sample treatment was carefully optimized. To find the optimal combination of the analyte-to-solvent ratio for protein precipitation and optimal analyte recovery, the spiked samples were thoroughly mixed with equal (200 µL) or double volumes (400 µL) of MeOH or ACN. The vortexed mixtures were allowed to rest for 5 min to precipitate the matrix constituents before centrifugation at 13,201× g at 4 °C for 20 min.
Alternatively, precipitation followed by solvent evaporation and re-constitution was also evaluated. Therefore, the samples were precipitated as described above, the supernatant was transferred into an evaporator (Vaccubrand, Wertheim, Germany) and treated at 40 °C for ~2 h until dryness. The dry pellets were resuspended in either 200 µL Milli-Q water and ACN mixture (1:1) or 0.1% formic acid and ACN mixture (1:3).
From all samples, 50 µL of the supernatant was transferred to the autosampler. The recoveries were calculated based on the peak areas obtained from respective matrix samples compared to the aqueous samples.
To protect the column from clogging, samples from the hollow-fiber system were pre-vortexed (2000× g, 37 °C, 10 min) to remove potential bacterial debris and were treated as described above before the analysis.

2.4. Instrumentation

The chromatographic separation was performed using an ultra-performance HPLC system Dionex Ultimate 3000 (Thermo Fisher Scientific, Dreieich, Germany), consisting of a WPS-3000 split loop well plate autosampler, an LPG-3400SD binary pump with online solvent degasser, and a DAD-3000 diode array detector (DAD). An Accucore® C-18 RPMS HPLC column (2.6 µm, 100 × 2.1 mm, Thermo Fisher Scientific, Dreieich, Germany) was installed in the TCC-300SD column oven and was used throughout the study. A guard column (Accucore® C-18 100 × 2.1 mm, Thermo Fisher Scientific, Dreieich, Germany) was used to protect the main column. The HPLC runs were managed by the Chromeleon® software (version 7.2 SR5, Thermo Fisher Scientific, Dreieich, Germany).

2.5. Optimization of Chromatographic Conditions

To optimize the chromatographic parameters, a number of preliminary trials were conducted with different solvent combinations, flow rates, and working temperatures to analyze the chromatographic retention time, resolution, peak shape, and any possible matrix interference. Various mobile phases alone or in combinations consisting of ACN/water (v/v, 50%/50%, 30%/70%, 20%/80%, 25%/75%), 25% ACN, and 75% of 0.1% formic acid were investigated by applying isocratic solvent elution. A range of wavelengths for the detection of TDZ were investigated (200, 251, 300, 360 nm). The column oven temperature was 30 °C while the sampler temperature was kept at 4 °C throughout the study. Injection volumes of 2.5, 5, and 10 µL were evaluated.

2.6. Method Validation

The developed method was validated in accordance with the EMA guideline for bioanalytical method validation [24]. Applying least square regression analysis, a linear regression equation was generated to calculate TDZ concentrations of the calibration standards. Different weighting factors (1/x, 1/x2) as well as unweighted regression were explored for calculating the concentrations from the chromatogram peak areas. The correlation coefficient was used to assess the linearity of the standard curve by plotting the experimentally determined versus theoretical concentrations using Chromeleon®. The calibration standards were accepted if 75% of the calibration samples had back-calculated concentrations within ±15% of the nominal concentration (±20% for LLOQ). The peaks were defined to lack matrix interference if the matrix peak relative to the LLOQ was observed at the defined retention time and was <20%. The lack of analyte carryover of the sample injection with high drug concentration to the next blank sample was defined if the resulting peak in the blank sample was <20% of the peak of LLOQ at the particular retention time.
To accurately determine the inter-day and intra-day variations, a series of QC samples were prepared by spiking TDZ in MHB from independent stock solutions. To exclude the carryover, blank samples (matrix, n = 2) were injected between QCH and the subsequent QCLLOQ in each set of five replicates at each validation day.
The mean accuracy at each QC level was to be within 85–115% (80–120% for the QCLLOQ) for an acceptable validation run. Likewise, for inter-day accuracy, similar QC tiers on three different days were evaluated following the same acceptance criteria. For both inter- and intra-day validation, the precision (expressed as coefficient of variation, CV%) was to be ≤15% at all QC levels (≤20% for the QCLLOQ).
To evaluate the stability of TDZ at different experimental conditions, stability studies were performed. The samples were analyzed in triplicate for freeze-thaw stability, room temperature stability (benchtop stability), long-term stability, incubator conditions, and autosampler stability conditions. For freeze-thaw stability the samples were analyzed before and after three freeze-thawing cycles. Therefore, QC samples (QCL, QCM, QCH, n = 3 each) were frozen at −80 °C and thawed after 24 h for three cycles. For room temperature stability, QC samples were analyzed before and after exposure to room temperature (~22 °C) for 6 h. For the autosampler stability, the QC samples were analyzed and kept at the autosampler temperature (4 °C) for 15 h before re-analysis. The stability of the analyte was calculated as the residue obtained, with an independent, freshly prepared calibration curve, after exposure to the respective condition compared to the pre-exposure values.

2.7. Application Study in the Hollow-Fiber Infection Model

The developed HPLC method was applied to determine the PK profile of TDZ in a hollow-fiber infection model (HFIM) of Enterococcus faecalis. The setup of the HFIM is described elsewhere [21,25]. TDZ PK was mimicked at the recommended human dose of 200 mg/day as a 1 h infusion for 5 days. The HFIM was kept at 37 °C during the entire experiment. Extensive sampling (200 µL each) from the bacterial compartment was performed at predefined intervals covering the entire PK profile up to 120 h. Samples were stored at −80 °C until analysis. The developed method was applied to analyze all the collected samples.

3. Results

3.1. Sample Treatment and Recovery

Using the direct precipitation method for analyte recovery, clear peaks were observed in the chromatogram (Figure 2). Using protein precipitation with subsequent evaporation and reconstitution in either the Milli-Q water and ACN mixture (1:1) or 0.1% formic acid and ACN mixture (1:3), no clear peaks were observed at different concentrations (0.03–1 µg/mL). Hence, the direct precipitation was carried forward for the rest of the analysis. With both ACN and MeOH, when used as precipitant solvent at the ratio of 1:1 and 1:2 (sample to solvent ratio), the 1:1 ratio provided clear peaks with good symmetry and low interference of matrix components, while at 1:2, the peaks were lower due to a higher dilution of the analyte. However, the recovery with MeOH tended to be higher (p = 0.12) (66.13%) compared to ACN (52.44%) and, hence, it was used further in the study as the precipitant solvent. The coefficient of variation (CV) was 5.0% when the procedure was repeated twice. The MHB matrix provided no interference at the retention time of ~3 min when peaks of analyte in the matrix were compared to the matrix only (Figure 2).

3.2. HPLC Instrument Method

Among the studied combinations of solvent and flow rate settings, the combination of 25% ACN and 75% of 0.1% formic acid (pH 2.7) resulted in symmetric peaks with a lower limit of quantification of 0.03 mg/L and was taken as the final solvent combination for the validation of the method. Other studied solvent combinations also provided clear peaks but were less sensitive, and TDZ at concentrations lower than 0.1 mg/L could not be detected in the ACN + water (25%:75%) mixture. Other settings resulted in an early (1.05 min, ACN + water 50%:50%, 2.06 min, ACN + water 30%:70%) or a delayed retention time (8.09 min, ACN + water 20%:80%), which either have the potential of interfering with the matrix peak (retention time around matrix peak) or rendering the method inefficient (long retention time). The adopted elution program was applied isocratically with a flow rate of 0.3 mL/min and provided separation of analyte from the MHB matrix at a retention time of 3.3 min. Among the studied UV detector wavelengths (200, 251, 300, 360 nm), the best sensitivity, resolution, and peak area were observed at 300 nm.

3.3. Linearity and Sensitivity

The calibration curves were constructed using the integrated peak area in the analytical run of the spiked samples vs. the nominal standard concentrations. Linearity was observed for the studied range of 0.03–1.0 µg/mL when linear regression analysis was applied. A typical calibration function was; peak area = 0.3230 × c(TDZ) − 0.0063. A high correlation coefficient of R2 > 0.99 was achieved. The LLOQ was 0.03 µg/mL, while the highest concentration level in the calibration study was 1.0 µg/mL.

3.4. Validation of the Bioanalytical Assay

The developed method showed specificity and selectivity with a lack of interference from matrix components and absence of carryover effects of the analyte across runs. The inter- and intra-day precision and accuracy of all the independently quantified QCs (QCLLOQ, QCL, QCM, QCH) samples were within the acceptable limits specified by EMA guidelines (91.6–105.3%). The results of the inter-day and intra-day precision ranged between 3.4% and 8.8%CV (QCLLOQ: 2.8–14.0%CV), which are also in the acceptable limits of the EMA guideline specifications. The results are summarized in Table 1 and Figure 3. No statistical difference (p = 0.91) among the three validation days was observed when a one factor ANOVA (α = 0.05) was applied to the accuracy measurements.
The results of the stability studies are summarized in Table 2. The analyte concentrations before and after exposure to the studied conditions were within the acceptable limit of the EMA guideline (accuracy range of all QCs 89.4–109.0%, precision: 0.8–8.6%CV).

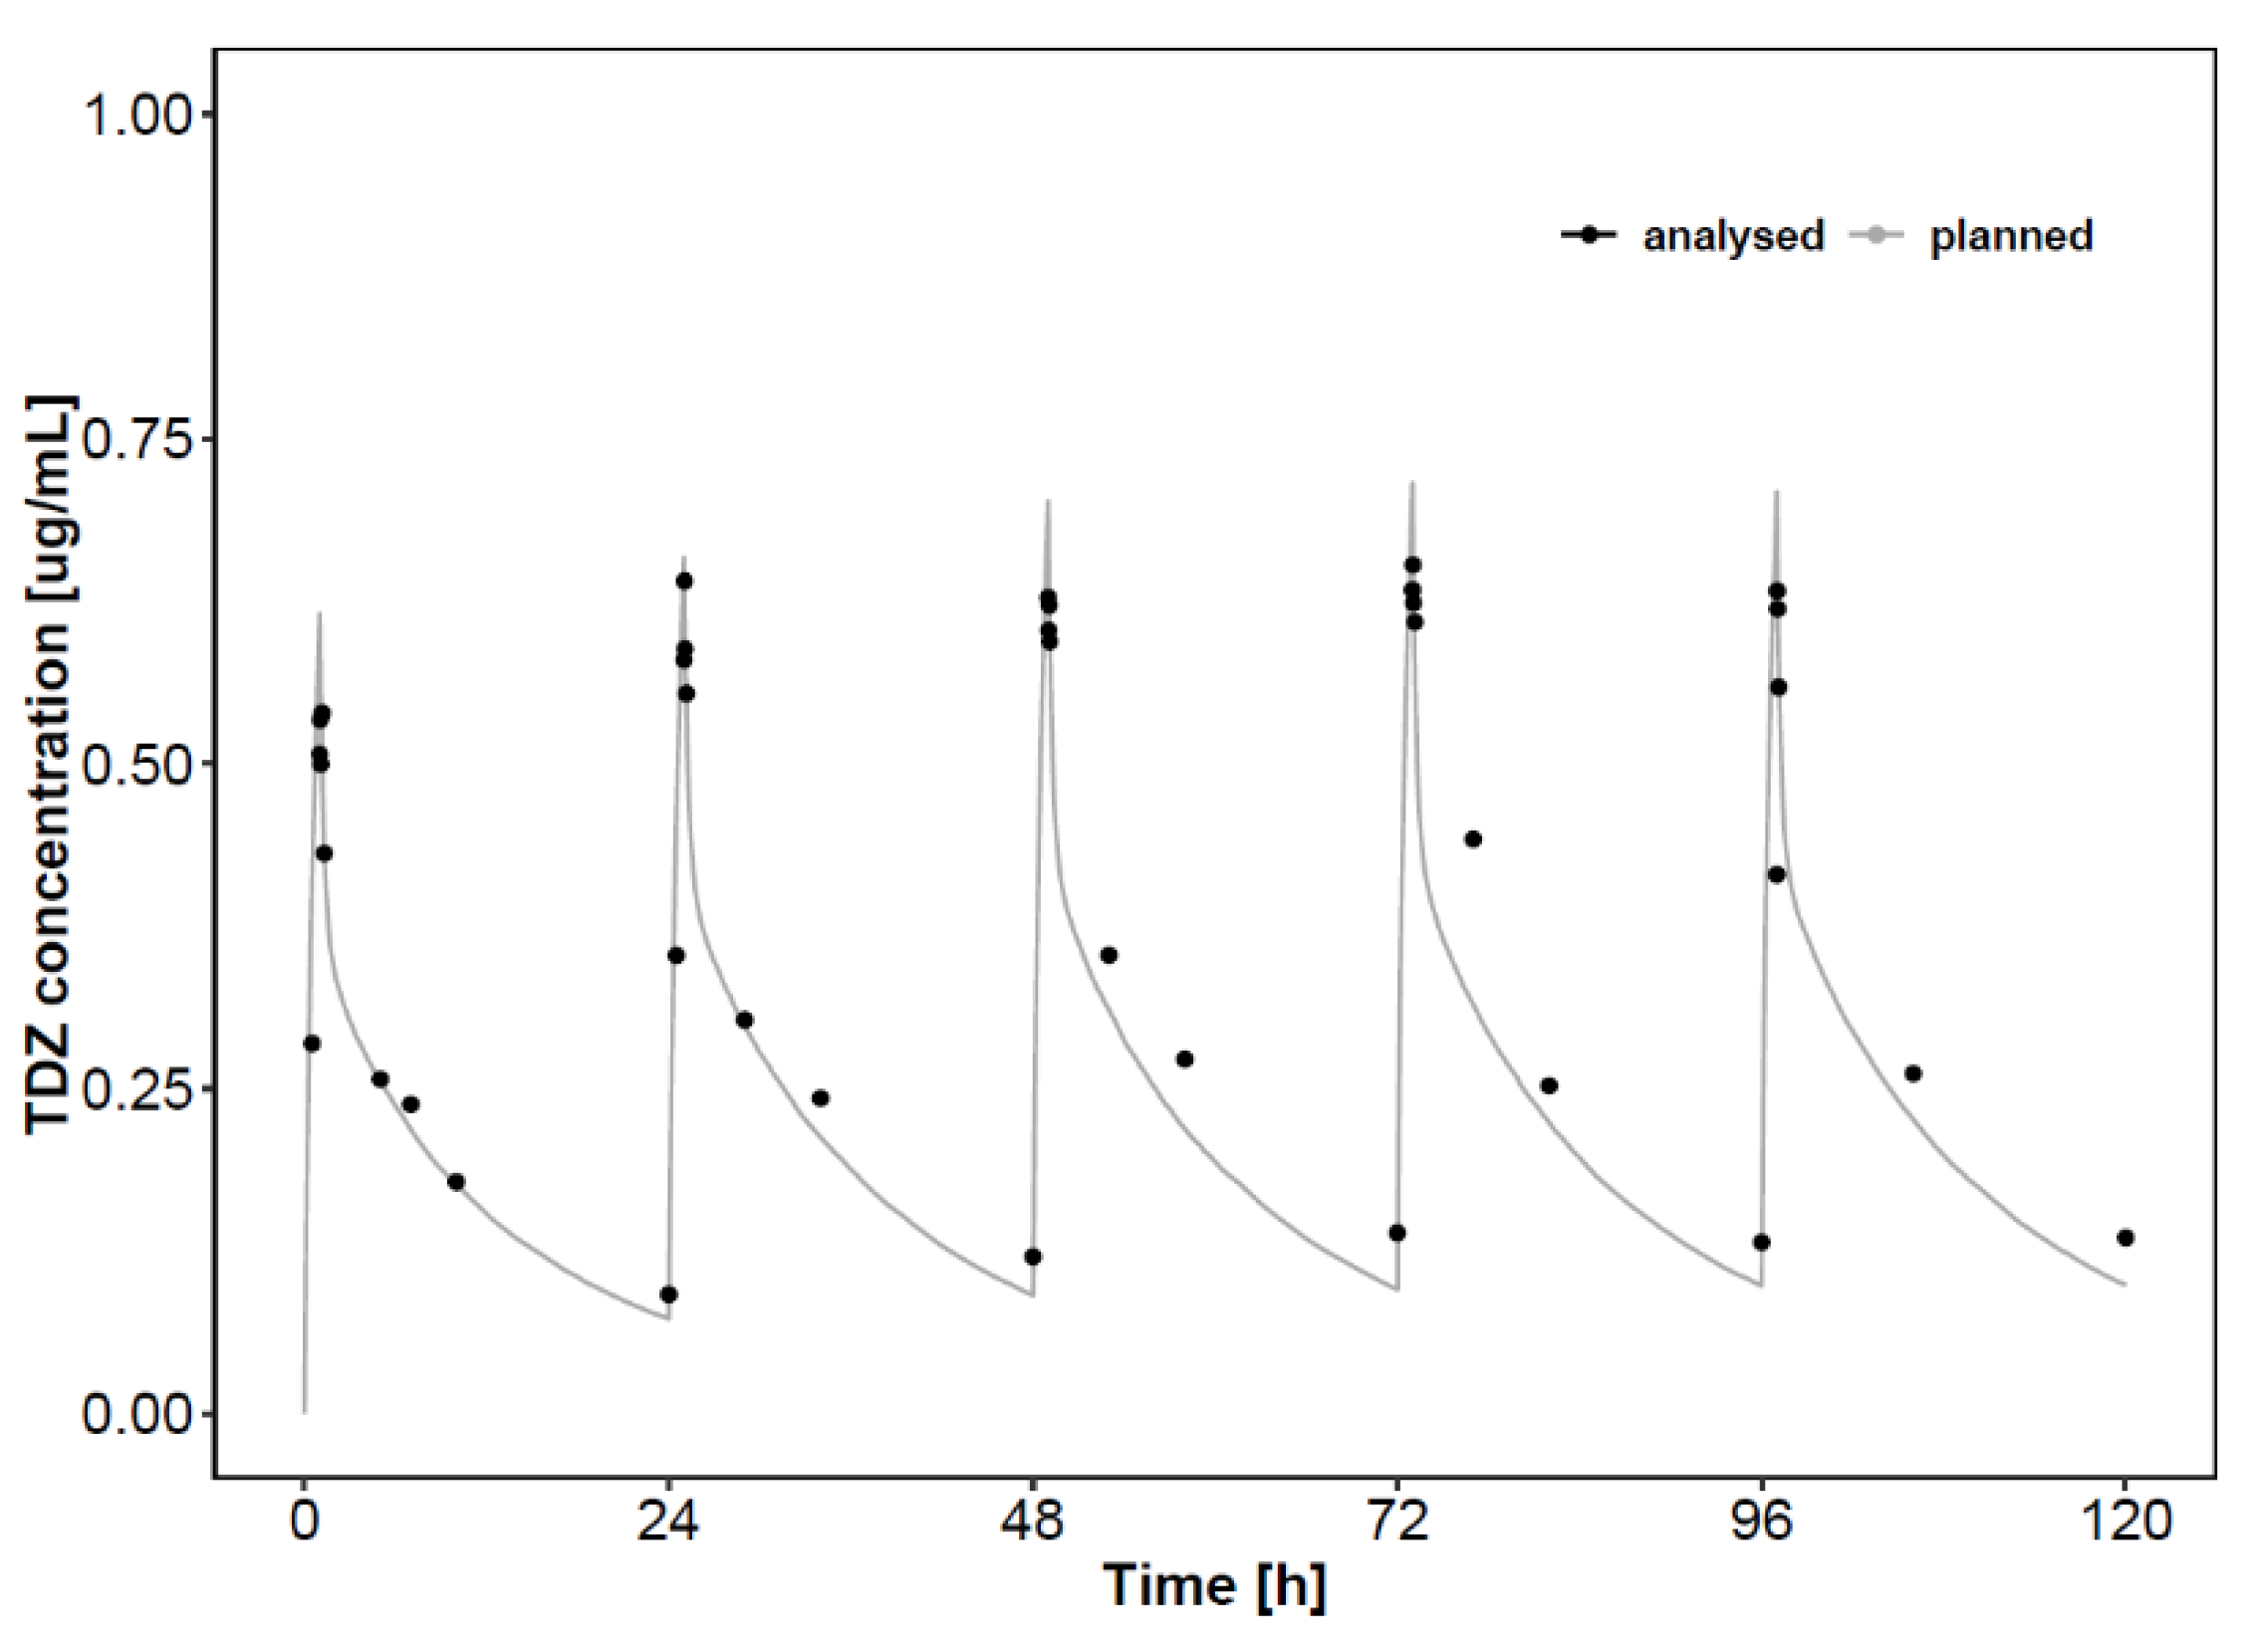
3.5. Application to HFIM PK Study

The method was successfully applied to analyze the planned PK profiles in the bacterial growth medium MHB. The analyzed concentration time profiles after each daily dose were matching the respective planned profiles (Figure 4). The results further support the validation to reliably quantify TDZ in MHB using the developed method.

4. Discussion

A bioanalytical method was successfully developed and validated according to the EMA guideline for bioanalytical method validation [24]. The method was rapid, sensitive, reproducible, utilized simple HPLC-UV separation, and was successfully applied to analyze TDZ in bacterial growth medium (MHB) in a study in an in vitro hollow-fiber infection model.
To enhance the sensitivity and reliability of the developed method, an ideal extraction optimization method ensured high extraction recovery. Obtaining optimal recovery is challenging in samples collected from the HFIM bacterial compartment, which contains high concentrations of protein and inorganic ions originating from the MHB medium, bacterial debris, and bacterial metabolic products. Hence, the efficiency of the precipitation method is critical for a reliable analysis. Although resulting in nearly similar symmetric peak shapes, the sample treatment method with a 1:1 analyte to MeOH ratio resulted in a slightly superior recovery of 66.1% as compared to ACN, where only 52.4% was recovered. In contrast to our finding, in the literature, a lower recovery value of TDZ with MeOH as compared to ACN was observed in the analytical method quantifying TDZ in rat plasma, although no specific values were provided [9]. This difference could be potentially attributed to differences in the matrix (rat plasma vs. MHB) or detection method (MS and UV). Santini et al. used a direct precipitation method in human plasma and serum with trichloro acetic acid, which resulted in slightly higher recovery values of 77–82% as compared to our study. Yet, while the detection method was similar to our study, their LLOQ was higher (0.2 µg/mL) than in our study (0.03 µg/mL) [7]. Similar results were reported for precipitation with perchloric acid, which resulted in approx. 70% recovery in human plasma using HPLC with UV detection [17]. For a direct comparison of the recovery values with direct precipitation using MeOH with HPLC-UV, as was used in our method, no literature data are available. The present study fulfilled all acceptance criteria of EMA guidelines and, hence, the use of an internal standard was not considered. However, for further studies with mass spectrometric detection, the use of an internal standard should be investigated.
To strive for simplicity the isocratic elution method was used. With a 1:1 mixture of water and ACN, the retention time was around 1.05 min, where interference from the matrix peaks was observed. A gradual increase of the retention time (1.05–8.03 min) was noted with the increase of water content from 50% to 80%. With acidification of the eluents (ACN and 0.1% formic acid), which results in 0.03% formic acid in the final solvent mixture, a retention time of ~3 min was observed, which was found to be optimal, i.e., resulted in a fast method, but no interference with the matrix peak was observed. This moderate increase in the retention time may be due to the resulting protonation of the terminal methyl-tetrazole ring of TDZ (Figure 1). This eluent combination was found to be sensitive enough to detect TDZ in the validation study as well as minimal and maximal concentrations (Cmin, 0.09-Cmax, 0.65 mg/L) in the in vitro study in the HFIM. The results of the validation study were within the acceptance limits of the EMA guideline and indicated high reproducibility with statistical indifference of the results at three different validation days. Since the samples in the PKPD study can carry a number of proteins and ions and can potentially clog the column, a minimal injection volume of 2.5 µL was selected, since higher injection volumes of 5 µL did not improve the method. The injection volumes were 1 µL [17], 2 µL [9], 5 µL [8], and 25 µL [19] elsewhere when TDZ was quantified in different matrices with different detection methods.
The stability studies in the investigated experimental conditions indicated no significant degradation: precision and accuracy after exposure were within the acceptable limits of the EMA guideline. The findings are in line with already published results of thermal stability in forced degradation stability evaluations [26] as well as when studied in different media up to 72 h [8,19,27]. High stability of TDZ was further indicated by the in vitro study in the HFIM, where the planned profiles were similar to the analyzed samples at 200 mg/day, while the HFIM was kept constantly at incubation temperatures of 37 °C. Hence, the application of the current method to TDZ analysis in MHB to further in vitro PKPD studies is warranted.

5. Conclusions

An HPLC method was developed, validated, and applied to an in vitro study in the HFIM. The method was sensitive to measuring TDZ with simple UV detection. This study provides an efficient way to analyze TDZ in the frequently used MHB bacterial growth media, particularly in PKPD studies for dose and regimen optimization in in vitro infection models.

Author Contributions

K.I.: conceptualization, methodology, method development, and writing—original draft preparation. A.M.: method validation. E.H.M.: stability studies. S.G.W.: conceptualization, supervision, instrumentation, and reviewing and editing. All authors have read and agreed to the published version of the manuscript.

Funding

This research received no external funding.

Institutional Review Board Statement

Not applicable.

Informed Consent Statement

Not applicable.

Data Availability Statement

Queries regarding the presented data can be forwarded to the corresponding author.

Conflicts of Interest

The authors declare no conflict of interest.

References

  1. Livermore, D.M.; Mushtaq, S.; Warner, M.; Woodford, N. Activity of oxazolidinone TR-700 against linezolid-susceptible and -resistant staphylococci and enterococci. J. Antimicrob. Chemother. 2009, 63, 713–715. [Google Scholar] [CrossRef] [PubMed] [Green Version]
  2. Prokocimer, P.; De Anda, C.; Fang, E.; Mehra, P.; Das, A. Tedizolid phosphate vs linezolid for treatment of acute bacterial skin and skin structure infections: The ESTABLISH-1 randomized trial. JAMA J. Am. Med. Assoc. 2013, 309, 559–569. [Google Scholar] [CrossRef] [PubMed] [Green Version]
  3. Wang, S.; Li, Y.; Xue, F.; Liu, J.; Yang, W.; Zhang, J.; Glenschek-Sieberth, M.; Lyu, Y. Comparative in vitro potency and kill curve activity of tedizolid and linezolid against Gram-positive bacteria isolated from Chinese hospitalized patients in 2013–2016 Antimicrobial Original Research Paper Comparative in vitro potency and kill curve activity of tedizolid and linezolid against Gram-positive bacteria isolated from Chinese hospitalized patients in 2013-2016. J. Chemother. 2013, 31, 313–319. [Google Scholar] [CrossRef] [Green Version]
  4. Deshpande, D.; Srivastava, S.; Nuermberger, E.; Koeuth, T.; Martin, K.R.; Cirrincione, K.N.; Lee, P.S.; Gumbo, T. Multiparameter Responses to Tedizolid Monotherapy and Moxifloxacin Combination Therapy Models of Children with Intracellular Tuberculosis. Clin. Infect. Dis. 2018, 67, S342–S348. [Google Scholar] [CrossRef] [PubMed]
  5. Bayer, A.S.; Abdelhady, W.; Li, L.; Gonzales, R.; Xiong, Y.Q. Comparative efficacies of tedizolid phosphate, linezolid, and vancomycin in a murine model of subcutaneous catheter-related biofilm infection due to methicillin-susceptible and -resistant Staphylococcus aureus. Antimicrob. Agents Chemother. 2016, 60, 5092–5096. [Google Scholar] [CrossRef] [Green Version]
  6. Wicha, S.G.; Kloft, C. Simultaneous determination and stability studies of linezolid, meropenem and vancomycin in bacterial growth medium by high-performance liquid chromatography. J. Chromatogr. B Anal. Technol. Biomed. Life Sci. 2016, 1028, 242–248. [Google Scholar] [CrossRef]
  7. Da, S.; Ca, S.; Dp, N. Development of a High Performance Liquid Chromatography Method for the Determination of Tedizolid in Human Plasma. J. Chromatogr. Sep. Tech. 6 2015, 270. [Google Scholar] [CrossRef] [Green Version]
  8. Iqbal, M. A highly sensitive and efficient UPLC-MS/MS assay for rapid analysis of tedizolid (a novel oxazolidinone antibiotic) in plasma sample. Biomed. Chromatogr. 2016, 30, 1750–1756. [Google Scholar] [CrossRef]
  9. Yu, H.C.; Pan, C.W.; Xie, Q.P.; Zheng, Y.; Hu, Y.Z.; Lin, Y.M. Simultaneous determination of tedizolid and linezolid in rat plasma by ultra performance liquid chromatography tandem mass spectrometry and its application to a pharmacokinetic study. J. Chromatogr. B Anal. Technol. Biomed. Life Sci. 2016, 1011, 94–98. [Google Scholar] [CrossRef]
  10. Sahre, M.; Sabarinath, S.; Grant, M.; Seubert, C.; DeAnda, C.; Prokocimer, P.; Derendorf, H. Skin and soft tissue concentrations of tedizolid (formerly torezolid), a novel oxazolidinone, following a single oral dose in healthy volunteers. Int. J. Antimicrob. Agents 2012, 40, 51–54. [Google Scholar] [CrossRef] [Green Version]
  11. Louie, A.; Liu, W.; Kulawy, R.; Drusano, G.L. In vivo pharmacodynamics of torezolid phosphate (TR-701), a new oxazolidinone antibiotic, against methicillin-susceptible and methicillin-resistant Staphylococcus aureus strains in a mouse thigh infection model. Antimicrob. Agents Chemother. 2011, 55, 3453–3460. [Google Scholar] [CrossRef] [Green Version]
  12. Tanaka, R.; Kai, M.; Goto, K.; Ohchi, Y.; Yasuda, N.; Tatsuta, R.; Kitano, T.; Itoh, H. High-throughput and wide-range simultaneous determination of linezolid, daptomycin and tedizolid in human plasma using ultra-performance liquid chromatography coupled to tandem mass spectrometry. J. Pharm. Biomed. Anal. 2021, 194, 113764. [Google Scholar] [CrossRef]
  13. Park, A.Y.J.; Wang, J.; Jayne, J.; Fukushima, L.; Rao, A.P.; D’Argenio, D.Z.; Beringer, P.M. Pharmacokinetics of tedizolid in plasma and sputum of adults with cystic fibrosis. Antimicrob. Agents Chemother. 2018, 62. [Google Scholar] [CrossRef] [Green Version]
  14. Housman, S.T.; Pope, J.S.; Russomanno, J.; Salerno, E.; Shore, E.; Kuti, J.L.; Nicolau, D.P. Pulmonary disposition of tedizolid following administration of once-daily oral 200-milligram tedizolid phosphate in healthy adult volunteers. Antimicrob. Agents Chemother. 2012, 56, 2627–2634. [Google Scholar] [CrossRef] [Green Version]
  15. Flanagan, S.; Passarell, J.; Lu, Q.; Fiedler-Kelly, J.; Ludwig, E.; Prokocimer, P. Tedizolid population pharmacokinetics, exposure response, and target attainment. Antimicrob. Agents Chemother. 2014, 58, 6462–6470. [Google Scholar] [CrossRef] [PubMed] [Green Version]
  16. Gu, L.; Ma, M.; Zhang, Y.; Zhang, L.; Zhang, S.; Huang, M.; Zhang, M.; Xin, Y.; Zheng, G.; Cheng, S. Comparative pharmacokinetics of tedizolid in rat plasma and cerebrospinal fluid. Regul. Toxicol. Pharmacol. 2019, 107, 104420. [Google Scholar] [CrossRef] [PubMed]
  17. Dorn, C.; Schießer, S.; Wulkersdorfer, B.; Hitzenbichler, F.; Kees, M.G.; Zeitlinger, M. Determination of free clindamycin, flucloxacillin or tedizolid in plasma: Pay attention to physiological conditions when using ultrafiltration. Biomed. Chromatogr. 2020, 34, e4820. [Google Scholar] [CrossRef] [PubMed] [Green Version]
  18. Stainton, S.M.; Monogue, M.L.; Baummer-Carr, A.; Shepard, A.K.; Nugent, J.F.; Kuti, J.L.; Nicolau, D.P. Comparative assessment of tedizolid pharmacokinetics and tissue penetration between diabetic patients with wound infections and healthy volunteers via in vivo microdialysis. Antimicrob. Agents Chemother. 2018, 62. [Google Scholar] [CrossRef] [Green Version]
  19. Milosevic, T.V.; Payen, V.L.; Sonveaux, P.; Muccioli, G.G.; Tulkens, P.M.; Van Bambeke, F. Mitochondrial Alterations (Inhibition of Mitochondrial Protein Expression, Oxidative Metabolism, and Ultrastructure) Induced by Linezolid and Tedizolid at Clinically Relevant Concentrations in Cultured Human HL-60 Promyelocytes and THP-1 Monocytes Downloa. Antimicrob. Agents Chemother. 2018, 62, 2021. [Google Scholar] [CrossRef] [PubMed] [Green Version]
  20. Flanagan, S.; Fang, E.; Muñoz, K.A.; Minassian, S.L.; Prokocimer, P.G. Single- and multiple-dose pharmacokinetics and absolute bioavailability of tedizolid. Pharmacotherapy 2014, 34, 891–900. [Google Scholar] [CrossRef] [Green Version]
  21. Landersdorfer, C.B.; Rees, V.E.; Yadav, R.; Rogers, K.E.; Kim, T.H.; Bergen, P.J.; Cheah, S.E.; Boyce, J.D.; Peleg, A.Y.; Oliver, A.; et al. Optimization of a meropenem-tobramycin combination dosage regimen against hypermutable and nonhypermutable pseudomonas aeruginosa via mechanism-based modeling and the hollow-fiber infection model. Antimicrob. Agents Chemother. 2018, 62. [Google Scholar] [CrossRef] [PubMed] [Green Version]
  22. Heffernan, A.J.; Sime, F.B.; Sarovich, D.S.; Neely, M.; Guerra-Valero, Y.; Naicker, S.; Cottrell, K.; Harris, P.; Andrews, K.T.; Ellwood, D.; et al. Pharmacodynamic Evaluation of Plasma and Epithelial Lining Fluid Exposures of Amikacin against Pseudomonas aeruginosa in a Dynamic In Vitro Hollow-Fiber Infection Model. Antimicrob. Agents Chemother. 2020, 64, e00879-20. [Google Scholar] [CrossRef]
  23. Iqbal, K.; Broeker, A.; Nowak, H.; Rahmel, T.; Nussbaumer-Pröll, A.; Österreicher, Z.; Zeitlinger, M.; Wicha, S.G. A pharmacometric approach to define target site-specific breakpoints for bacterial killing and resistance suppression integrating microdialysis, time–kill curves and heteroresistance data: A case study with moxifloxacin. Clin. Microbiol. Infect. 2020. [Google Scholar] [CrossRef]
  24. Bioanalytical method validation|European Medicines Agency. Available online: https://www.ema.europa.eu/en/bioanalytical-method-validation#current-effective-version-section (accessed on 24 February 2021).
  25. Drusano, G.L.; Shields, R.K.; Mtchedlidze, N.; Nguyen, M.H.; Clancy, C.J.; Vicciarelli, M.; Louie, A. Pharmacodynamics of ceftazidime plus avibactam against KPC-2-bearing isolates of klebsiella pneumoniae in a hollow fiber infection model. Antimicrob. Agents Chemother. 2019, 63. [Google Scholar] [CrossRef] [PubMed] [Green Version]
  26. Lei, Y.; Jin, B.; Ma, C.; Zhang, T.; Li, T. Identification of forced degradation products of tedizolid phosphate by liquid chromatography/electrospray ionization tandem mass spectrometry. J. Pharm. Biomed. Anal. 2017, 139, 221–231. [Google Scholar] [CrossRef]
  27. Deshpande, D.; Srivastava, S.; Pasipanodya, J.G.; Lee, P.S.; Gumbo, T. Tedizolid is highly bactericidal in the treatment of pulmonary Mycobacterium avium complex disease. J. Antimicrob. Chemother. 2017, 72, ii30–ii35. [Google Scholar] [CrossRef] [PubMed] [Green Version]
Figure 1. The chemical structures of the analyte, tedizolid.
Separations 08 00141 g001
Figure 2. Chromatograms for tedizolid (TDZ) at 300 nm (at 3.3 min, 0.5 mg/L) (solid line) and matrix (dashed line) obtained during the method validation. Eluents (25% acetonitrile, 75% of 0.1% formic acid, isocratically).
Separations 08 00141 g002
Figure 3. Inter-day and intra-day (n = 15, 5 replicates per QC tier at each validation day) accuracy of the developed method in MHB bacterial growth medium determined from QC samples; QCLLOQ = QC tier LLOQ, QCL = QC tier at 3× LLOQ, QCM = QC tier in the medium calibration range, QCH = QC tier higher at 80% of highest concentrator, crossbar = mean (n = 15).
Separations 08 00141 g003
Figure 4. PK results of the HFIM study: concentration time profiles of the planned and analyzed TDZ at a dose of 200 mg/day.
Separations 08 00141 g004
Table 1. Intra-day (n = 5) and inter-day (n = 15) accuracy and precision of QC samples for the validation of the HPLC method for the quantification of TZD in Meuller-Hinton Broth (MHB) bacterial growth medium with accuracy (Acc.) and precision (Prec.).
Inter-DayIntra-Day
Day 1Day 2Day 3
QC tierTDZ (mg/L)Acc. (%)Prec. % CVAcc. (%)Prec. % CVAcc. (%)Prec. % CVAcc. (%)Prec. % CV
QCLLOQ0.0399.99.0100.87.997.814.098.52.8
QCL0.09104.84.0105.14.8101.26.2105.34.4
QCM0.391.64.6103.78.894.73.696.76.3
QCH0.8100.73.6102.95.096.24.099.93.4
Table 2. Stability study of TZD under different experimental conditions in MHB bacterial growth media (n = 3, per QC tier in each condition) with accuracy (Acc.) and precision (Prec.).
Freeze/Thaw
(3 Cycles)
Bench Top
(20 °C, 6 h)
Autosampler
(15 h, 4 °C)
Incubator
(37 °C, 24 h)
Long-Term Stability
(3 months, −80 °C)
QC tierTDZ (mg/L)Acc. (%)Prec. % CVAcc. (%)Prec. % CVAcc. (%)Prec. % CVAcc. (%)Prec. % CVAcc. (%)Prec. %CV
QCL0.0999.67.895.87.8102.97.8104.37.099.18.6
QCM1.095.01.294.28.595.30.8109.00.794.85.9
QCH3.2103.22.294.66.0104.84.3107.32.189.48.4
Publisher’s Note: MDPI stays neutral with regard to jurisdictional claims in published maps and institutional affiliations.

