
Determination of the Toxic and Nutrient Element Content of Almonds, Walnuts, Hazelnuts and Pistachios by ICP-AES


Abstract
1. Introduction
2. Materials and Methods
2.1. Materials and Reagents
2.2. Instrumentation
2.3. Sample Pretreatment
2.4. Statistical Analysis
3. Results and Discussion
3.1. Selection of the Optimum Emission Line
3.2. Figures of Merit
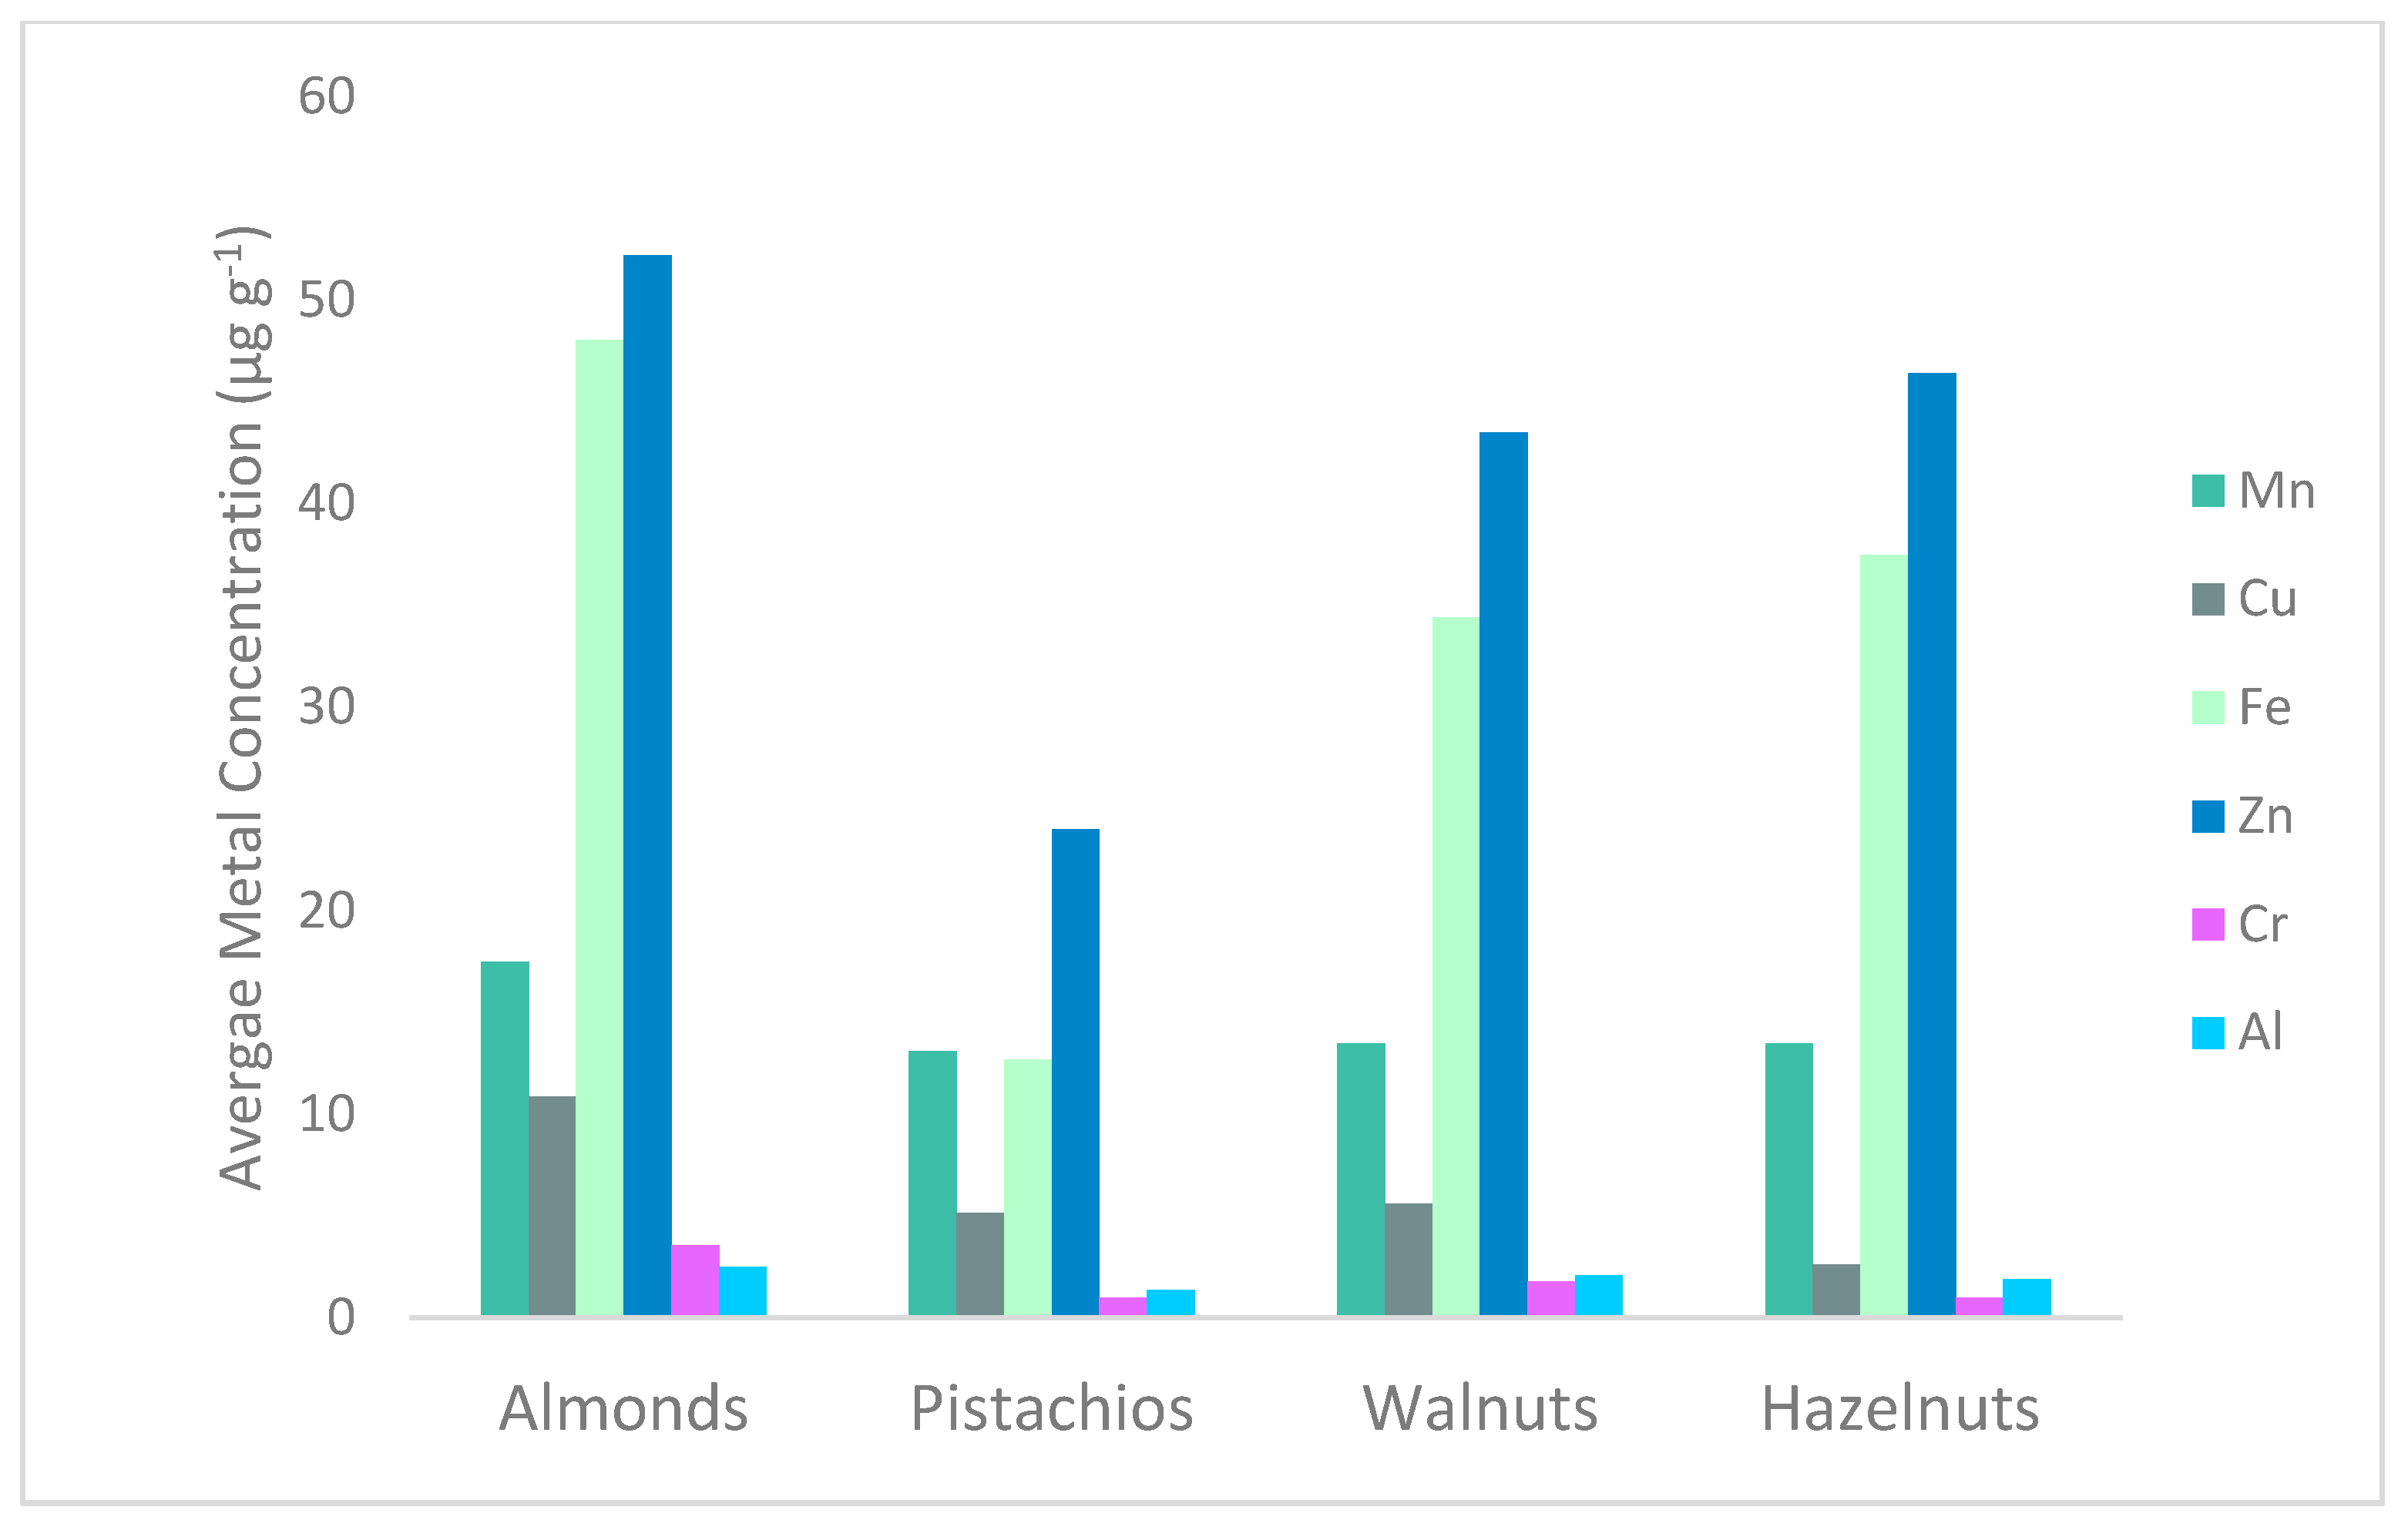
3.3. Real Samples Analysis
4. Conclusions
Author Contributions
Funding
Institutional Review Board Statement
Informed Consent Statement
Conflicts of Interest
References
- Kalogiouri, N.; Samanidou, V. Advances in the Optimization of Chromatographic Conditions for the Separation of Antioxidants in Functional Foods. Rev. Sep. Sci. 2019, 1, 17–33. [Google Scholar] [CrossRef]
- Kalogiouri, N.P.; Manousi, N.; Rosenberg, E.; Zachariadis, G.A.; Samanidou, V.F. Advances in the Chromatographic Separation and Determination of Bioactive Compounds for Assessing the Nutrient Profile of Nuts. Curr. Anal. Chem. 2020, 16, 1–17. [Google Scholar] [CrossRef]
- Naozuka, J.; Carvalho Vieira, E.; Nascimento, A.N.; Oliveira, P.V. Elemental analysis of nuts and seeds by axially viewed ICP OES. Food Chem. 2011, 124, 1667–1672. [Google Scholar] [CrossRef]
- Kafaoglu, B.; Fisher, A.; Hill, S.; Kara, D. Determination and evaluation of element bioaccessibility in some nuts and seeds by in-vitro gastro-intestinal method. J. Food Compos. Anal. 2016, 45, 58–65. [Google Scholar] [CrossRef]
- Fabani, M.P.; Luna, L.; Baroni, M.V.; Monferran, M.V.; Ighani, M.; Tapia, A.; Wunderlin, D.A.; Feresin, G.E. Pistachio (Pistacia vera var Kerman) from Argentinean cultivars. A natural product with potential to improve human health. J. Funct. Foods 2013, 5, 1347–1356. [Google Scholar] [CrossRef]
- Barreca, D.; Laganà, G.; Leuzzi, U.; Smeriglio, A.; Trombetta, D.; Bellocco, E. Evaluation of the nutraceutical, antioxidant and cytoprotective properties of ripe pistachio (Pistacia vera L., variety Bronte) hulls. Food Chem. 2016, 196, 493–502. [Google Scholar] [CrossRef]
- Kalogiouri, N.P.; Pritsa, A.; Kabir, A.; Furton, K.G.; Samanidou, V.F. A green molecular imprinted solid phase extraction protocol for Bisphenol A monitoring with HPLC- UV to guarantee the quality and safety of walnuts under different storage conditions. J. Sep. Sci. 2021, 1–26. [Google Scholar] [CrossRef]
- Momen, A.A.; Zachariadis, G.A.; Anthemidis, A.N.; Stratis, J.A. Use of fractional factorial design for optimization of digestion procedures followed by multi-element determination of essential and non-essential elements in nuts using ICP-OES technique. Talanta 2007, 71, 443–451. [Google Scholar] [CrossRef] [PubMed]
- Gopalani, M.; Shahare, M.; Ramteke, D.S.; Wate, S.R. Heavy metal content of potato chips and biscuits from Nagpur City, India. Bull. Environ. Contam. Toxicol. 2007, 79, 384–387. [Google Scholar] [CrossRef]
- Momen, A.A.; Zachariadis, G.A.; Anthemidis, A.N.; Stratis, J.A. Investigation of four digestion procedures for multi-element determination of toxic and nutrient elements in legumes by inductively coupled plasma-optical emission spectrometry. Anal. Chim. Acta 2006, 556, 81–88. [Google Scholar] [CrossRef]
- Santos, E.E.; Lauria, D.C.; Porto Da Silveira, C.L. Assessment of daily intake of trace elements due to consumption of foodstuffs by adult inhabitants of Rio de Janeiro city. Sci. Total Environ. 2004, 327, 69–79. [Google Scholar] [CrossRef] [PubMed]
- Inaudi, P.; Giacomino, A.; Malandrino, M.; Gioia, C.L.; Conca, E.; Karak, T.; Abollino, O. The inorganic component as a possible marker for quality and for authentication of the hazelnut’s origin. Int. J. Environ. Res. Public Health 2020, 17, 447. [Google Scholar] [CrossRef]
- Kannamkumarath, S.S.; Wuilloud, R.G.; Caruso, J.A. Studies of various elements of nutritional and toxicological interest with different molecular weight fractions in Brazil nuts. J. Agric. Food Chem. 2004, 52, 5773–5780. [Google Scholar] [CrossRef] [PubMed]
- Gülfen, M.; Özdemir, A. Analysis of dietary minerals in selected seeds and nuts by using ICP-OES. Nutr. Food Sci. 2016, 46, 282–292. [Google Scholar]
- Anderson, K.A.; Smith, B.W. Use of chemical profiling to differentiate geographic growing origin of raw pistachios. J. Agric. Food Chem. 2005, 53, 410–418. [Google Scholar] [CrossRef] [PubMed]
- Rodushkin, I.; Ruth, T.; Huhtasaari, Å. Comparison of two digestion methods for elemental determinations in plant material by ICP techniques. Anal. Chim. Acta 1999, 378, 191–200. [Google Scholar] [CrossRef]
- Tošić, S.B.; Mitić, S.S.; Velimirović, D.S.; Stojanović, G.S.; Pavlović, A.N.; Pecev-Marinković, E.T. Elemental composition of edible nuts: Fast optimization and validation procedure of an ICP-OES method. J. Sci. Food Agric. 2015, 95, 2271–2278. [Google Scholar] [CrossRef]
- Zachariadis, G.A.; Anthemidis, A.N.; Bettas, P.G.; Stratis, J.A. Determination of lead by on-line solid phase extraction using a PTFE micro-column and flame atomic absorption spectrometry. Talanta 2002, 57, 919–927. [Google Scholar] [CrossRef]
- Francisco, B.B.A.; Brum, D.M.; Cassella, R.J. Determination of metals in soft drinks packed in different materials by ETAAS. Food Chem. 2015, 185, 488–494. [Google Scholar] [CrossRef]
- Sarakatsianos, I.; Manousi, N.; Georgantelis, D.; Goula, A.; Adamopoulos, K.; Samanidou, V. Detection of mechanically deboned meat in cold cuts by inductively coupled plasma-mass spectrometry. Pak. J. Anal. Environ. Chem. 2018, 19, 115–121. [Google Scholar]
- Aceto, M.; Abollino, O.; Bruzzoniti, M.C.; Mentasti, E.; Sarzanini, C.; Malandrino, M. Determination of metals in wine with atomic spectroscopy (flame-AAS, GF-AAS and ICP-AES); a review. Food Addit. Contam. 2010, 19, 126–133. [Google Scholar] [CrossRef]
- Samanidou, V.F.; Pechlivanidou, A.P.; Papadoyannis, I.N. Development of a validated HPLC method for the determination of four 1,4-benzodiazepines in human biological fluids. J. Sep. Sci. 2007, 30, 679–687. [Google Scholar] [CrossRef] [PubMed]
- Plessi, M.; Bertelli, D.; Monzani, A.; Simonetti, M.S.; Neri, A.; Damiani, P. Dietary Fiber and Some Elements in Nuts and Wheat Brans. J. Food Compos. Anal. 1999, 12, 91–96. [Google Scholar] [CrossRef]
- Cabrera, C.; Lloris, F.; Giménez, R.; Olalla, M.; López, M.C. Mineral content in legumes and nuts: Contribution to the Spanish dietary intake. Sci. Total Environ. 2003, 308, 1–14. [Google Scholar] [CrossRef]
- Cardoso, B.R.; Duarte, G.B.S.; Reis, B.Z.; Cozzolino, S.M.F. Brazil nuts: Nutritional composition, health benefits and safety aspects. Food Res. Int. 2017, 100, 9–18. [Google Scholar] [CrossRef] [PubMed]


| Element | Emission Line (nm) | Slope | Intercept | r 2 | LOD 1 (μg g−1) | LOQ 2 (μg g−1) |
|---|---|---|---|---|---|---|
| Ba | 230.425 | 64.34 | +936.22 | 0.9998 | 0.50 | 1.66 |
| Cd | 226.502 | 40.52 | +607.75 | 0.9999 | 0.33 | 1.11 |
| Cu | 324.752 | 2375.00 | +74,996.00 | 0.9999 | 2.52 | 8.40 |
| Fe | 238.204 | 105.91 | +1036.10 | 0.9970 | 0.89 | 2.96 |
| Pb | 217.000 | 3.95 | −61.61 | 0.9999 | 1.17 | 3.90 |
| Ni | 232.003 | 20.41 | −240,l97 | 0.9999 | 0.95 | 3.16 |
| Mn | 257.61 | 857.99 | +7192.3l | 0.9999 | 0.23 | 0.78 |
| Zn | 213.857 | 32.33 | +32.33 | 0.9999 | 0.42 | 1.40 |
| Al | 308.215 | 233.08 | +2654.20 | 0.9998 | 2.40 | 7.99 |
| Cr | 357.869 | 1480.30 | −18,850.00 | 0.9999 | 0.16 | 0.54 |
| Mg | 280.271 | 1820.00 | +76,096.00 | 0.9990 | 0.01 | 0.02 |
| Ca | 317.933 | 104.66 | +5696.90 | 0.9993 | 0.83 | 2.76 |
| Element (μg g−1) | Almond | Pistachio | Walnut | Hazelnut |
|---|---|---|---|---|
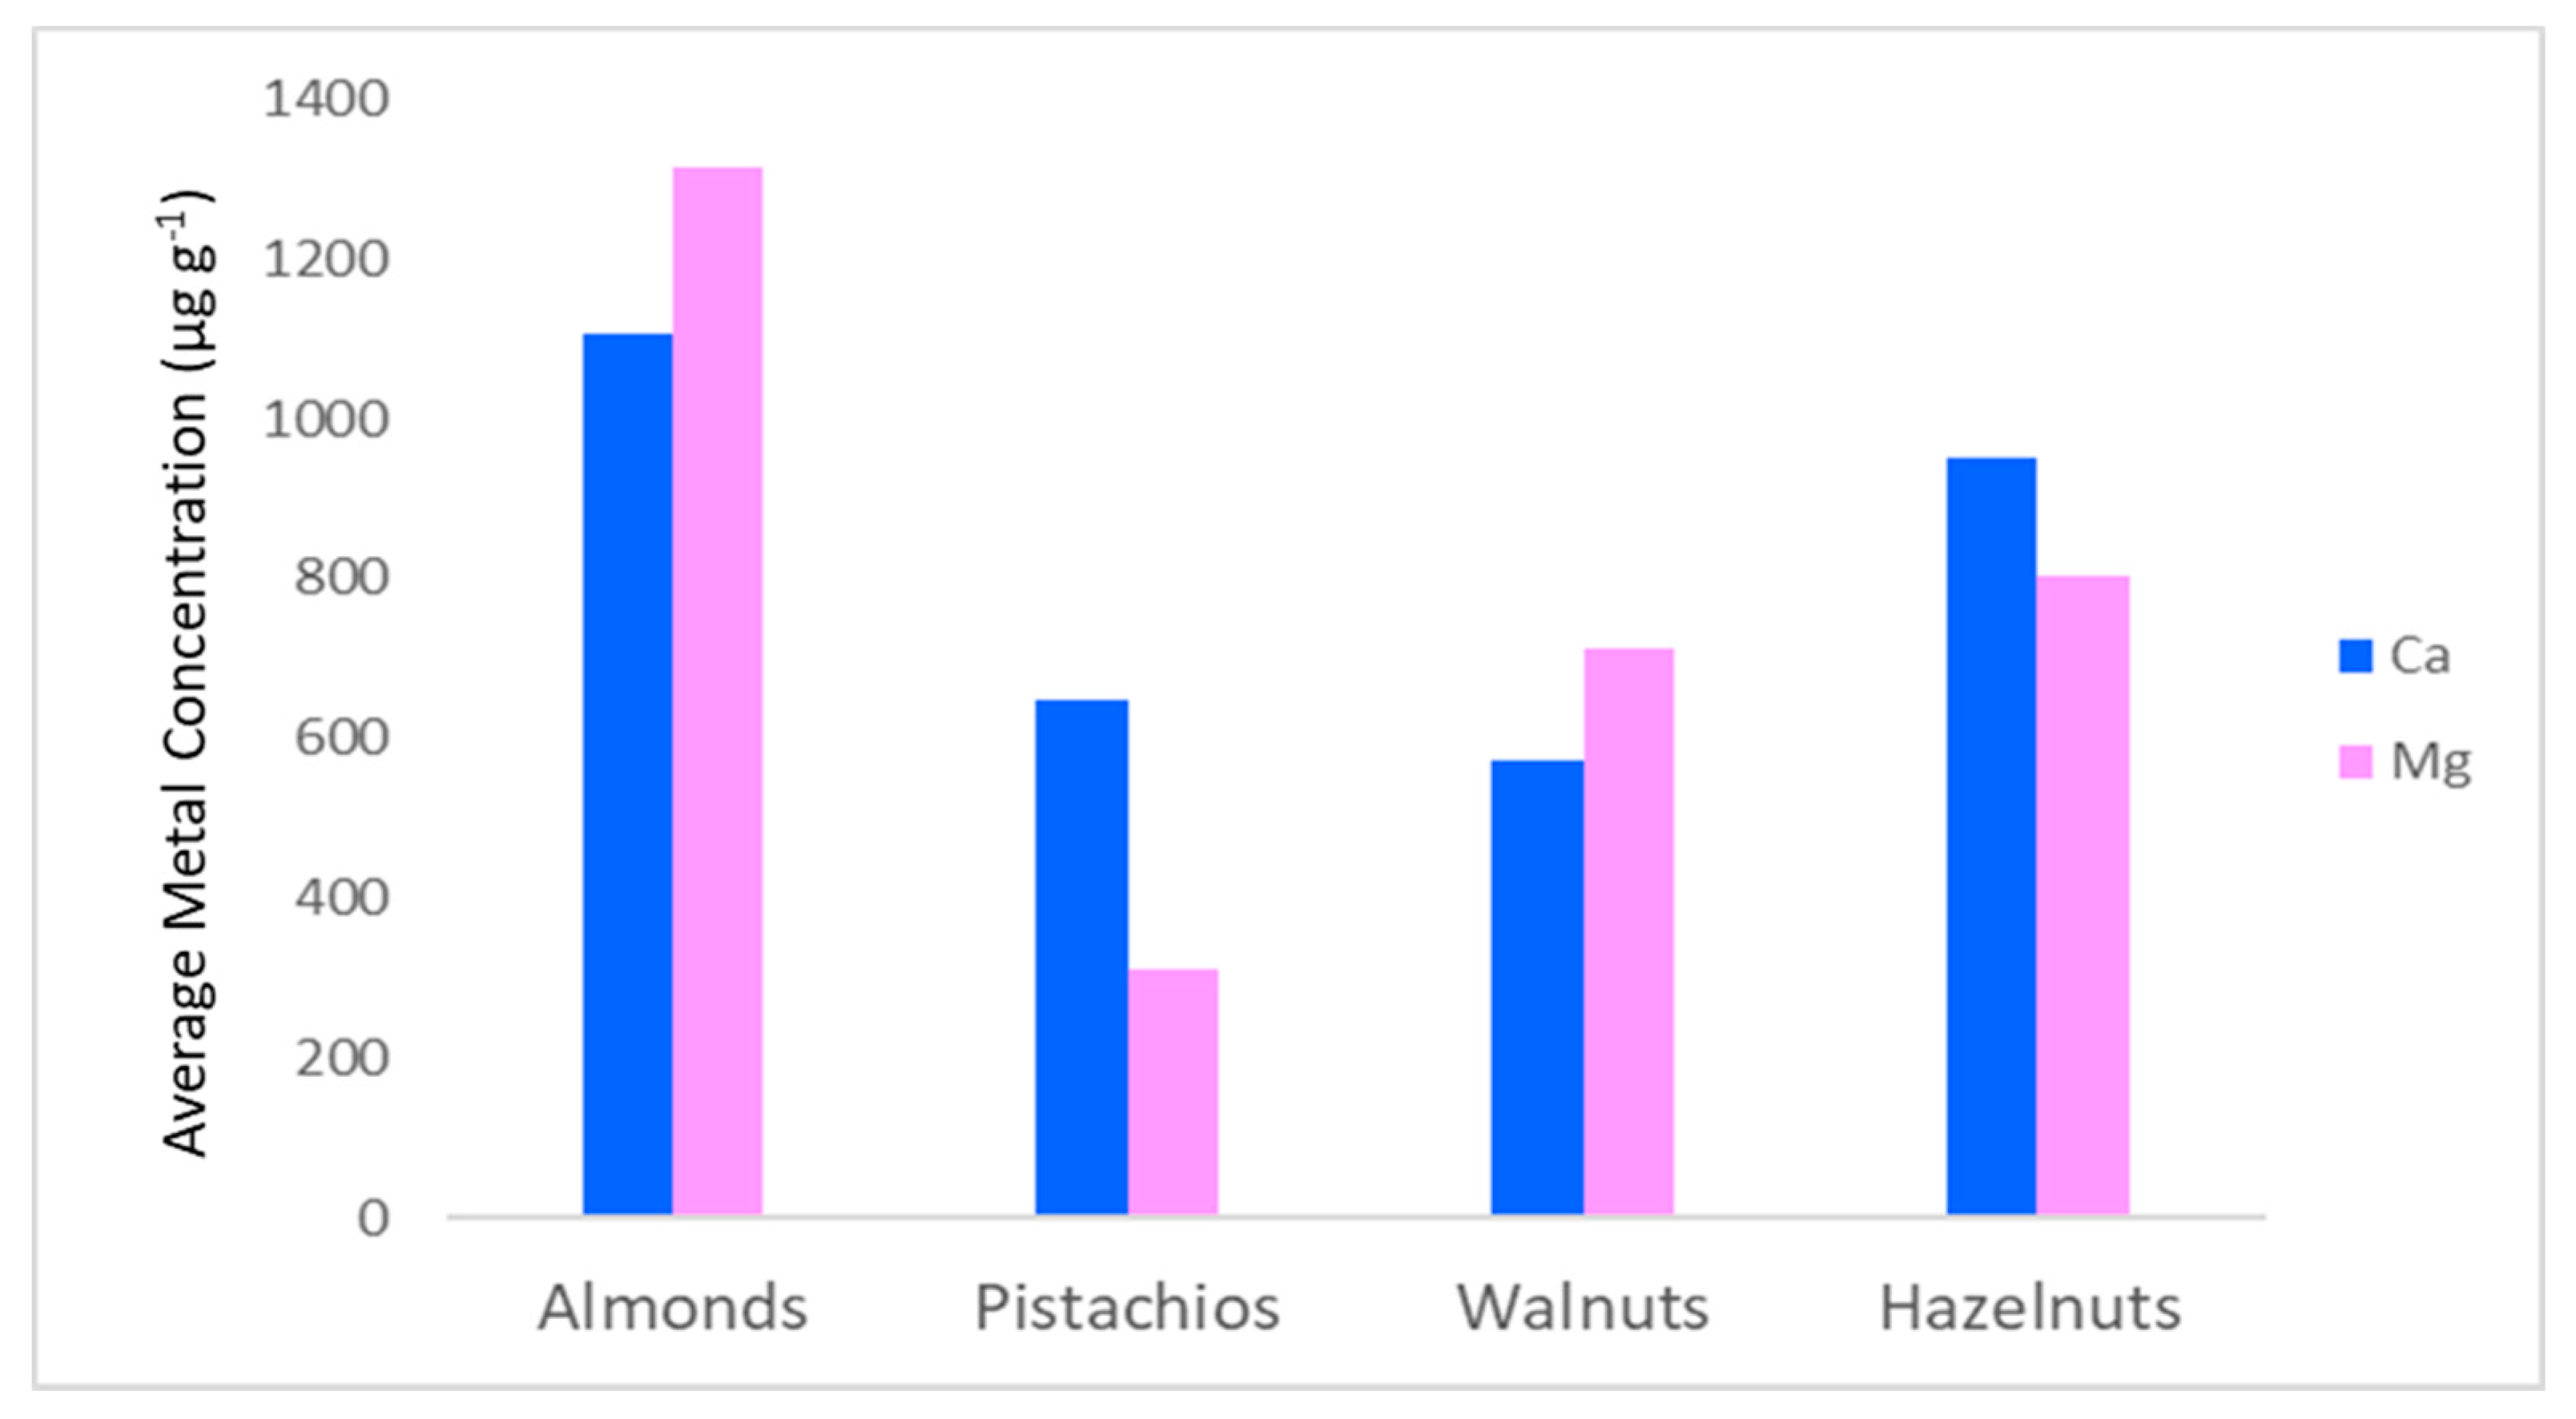
| Ca | 817–1439 | 86.9–787 | 328–932 | 738–1265 |
| Mg | 1150–1681 | 112–718 | 573–901 | 688–883 |
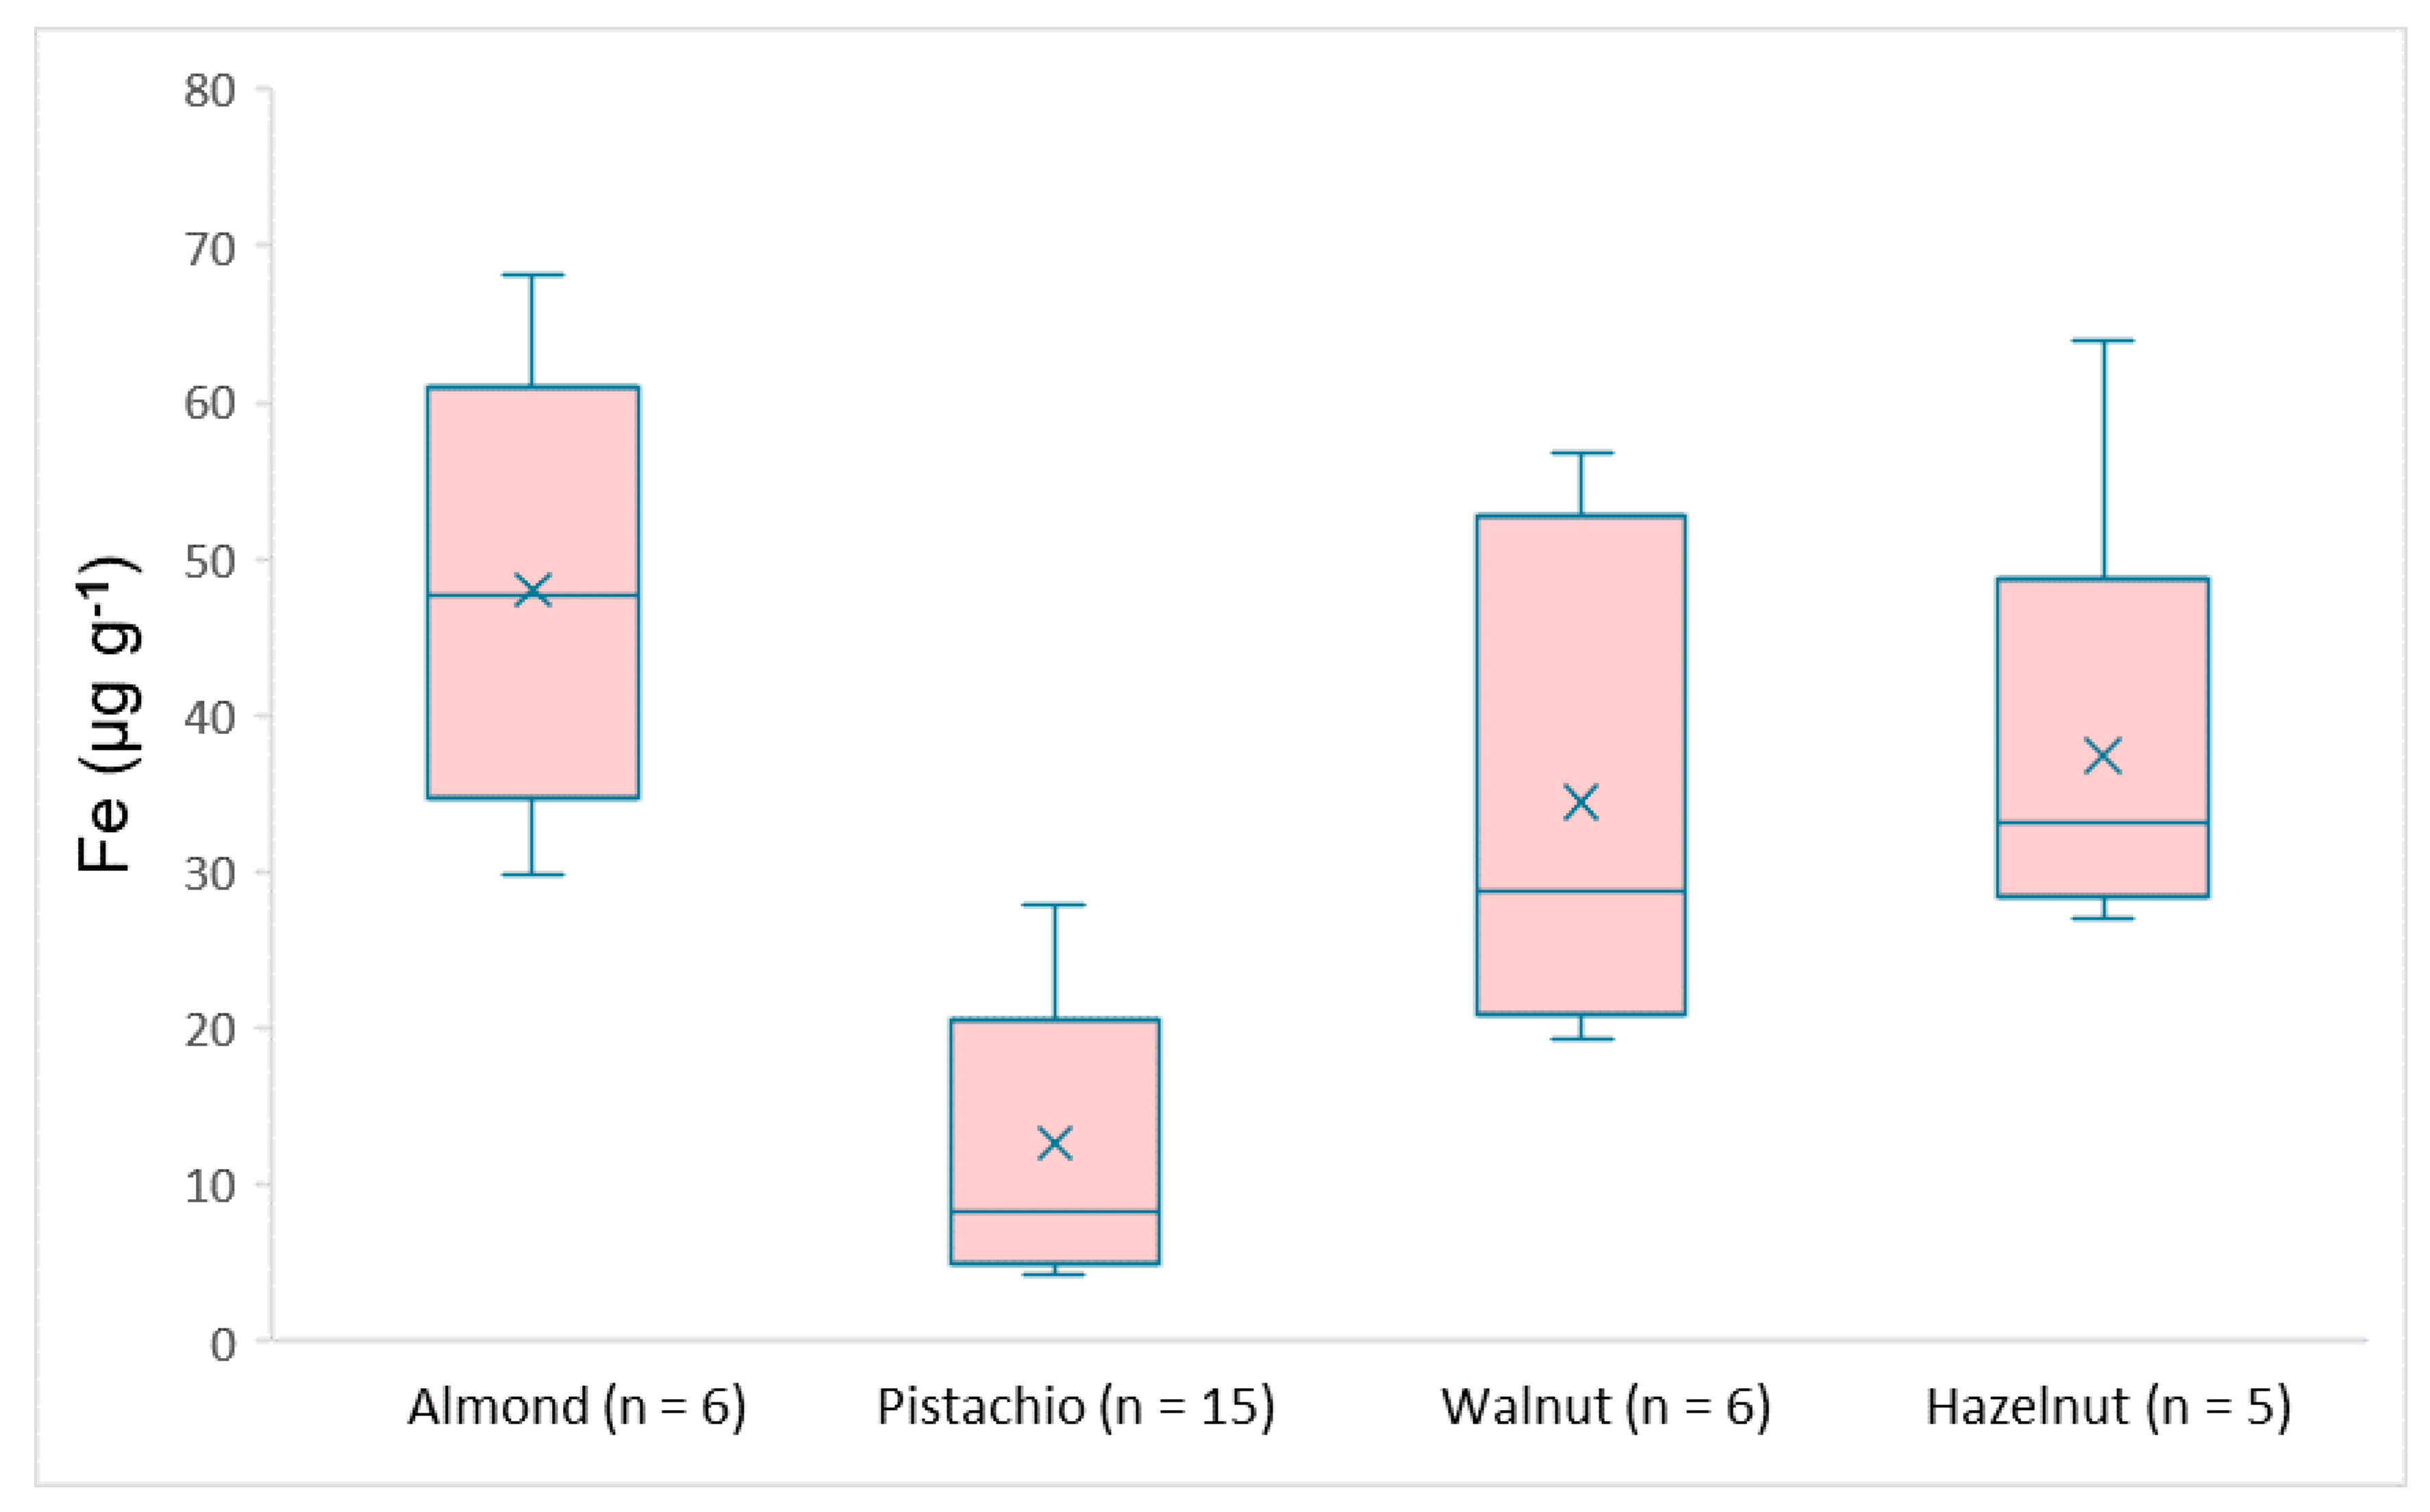
| Fe | 29.8–68.2 | 4.25–26.6 | 19.3–56.8 | 27.0–64.0 |
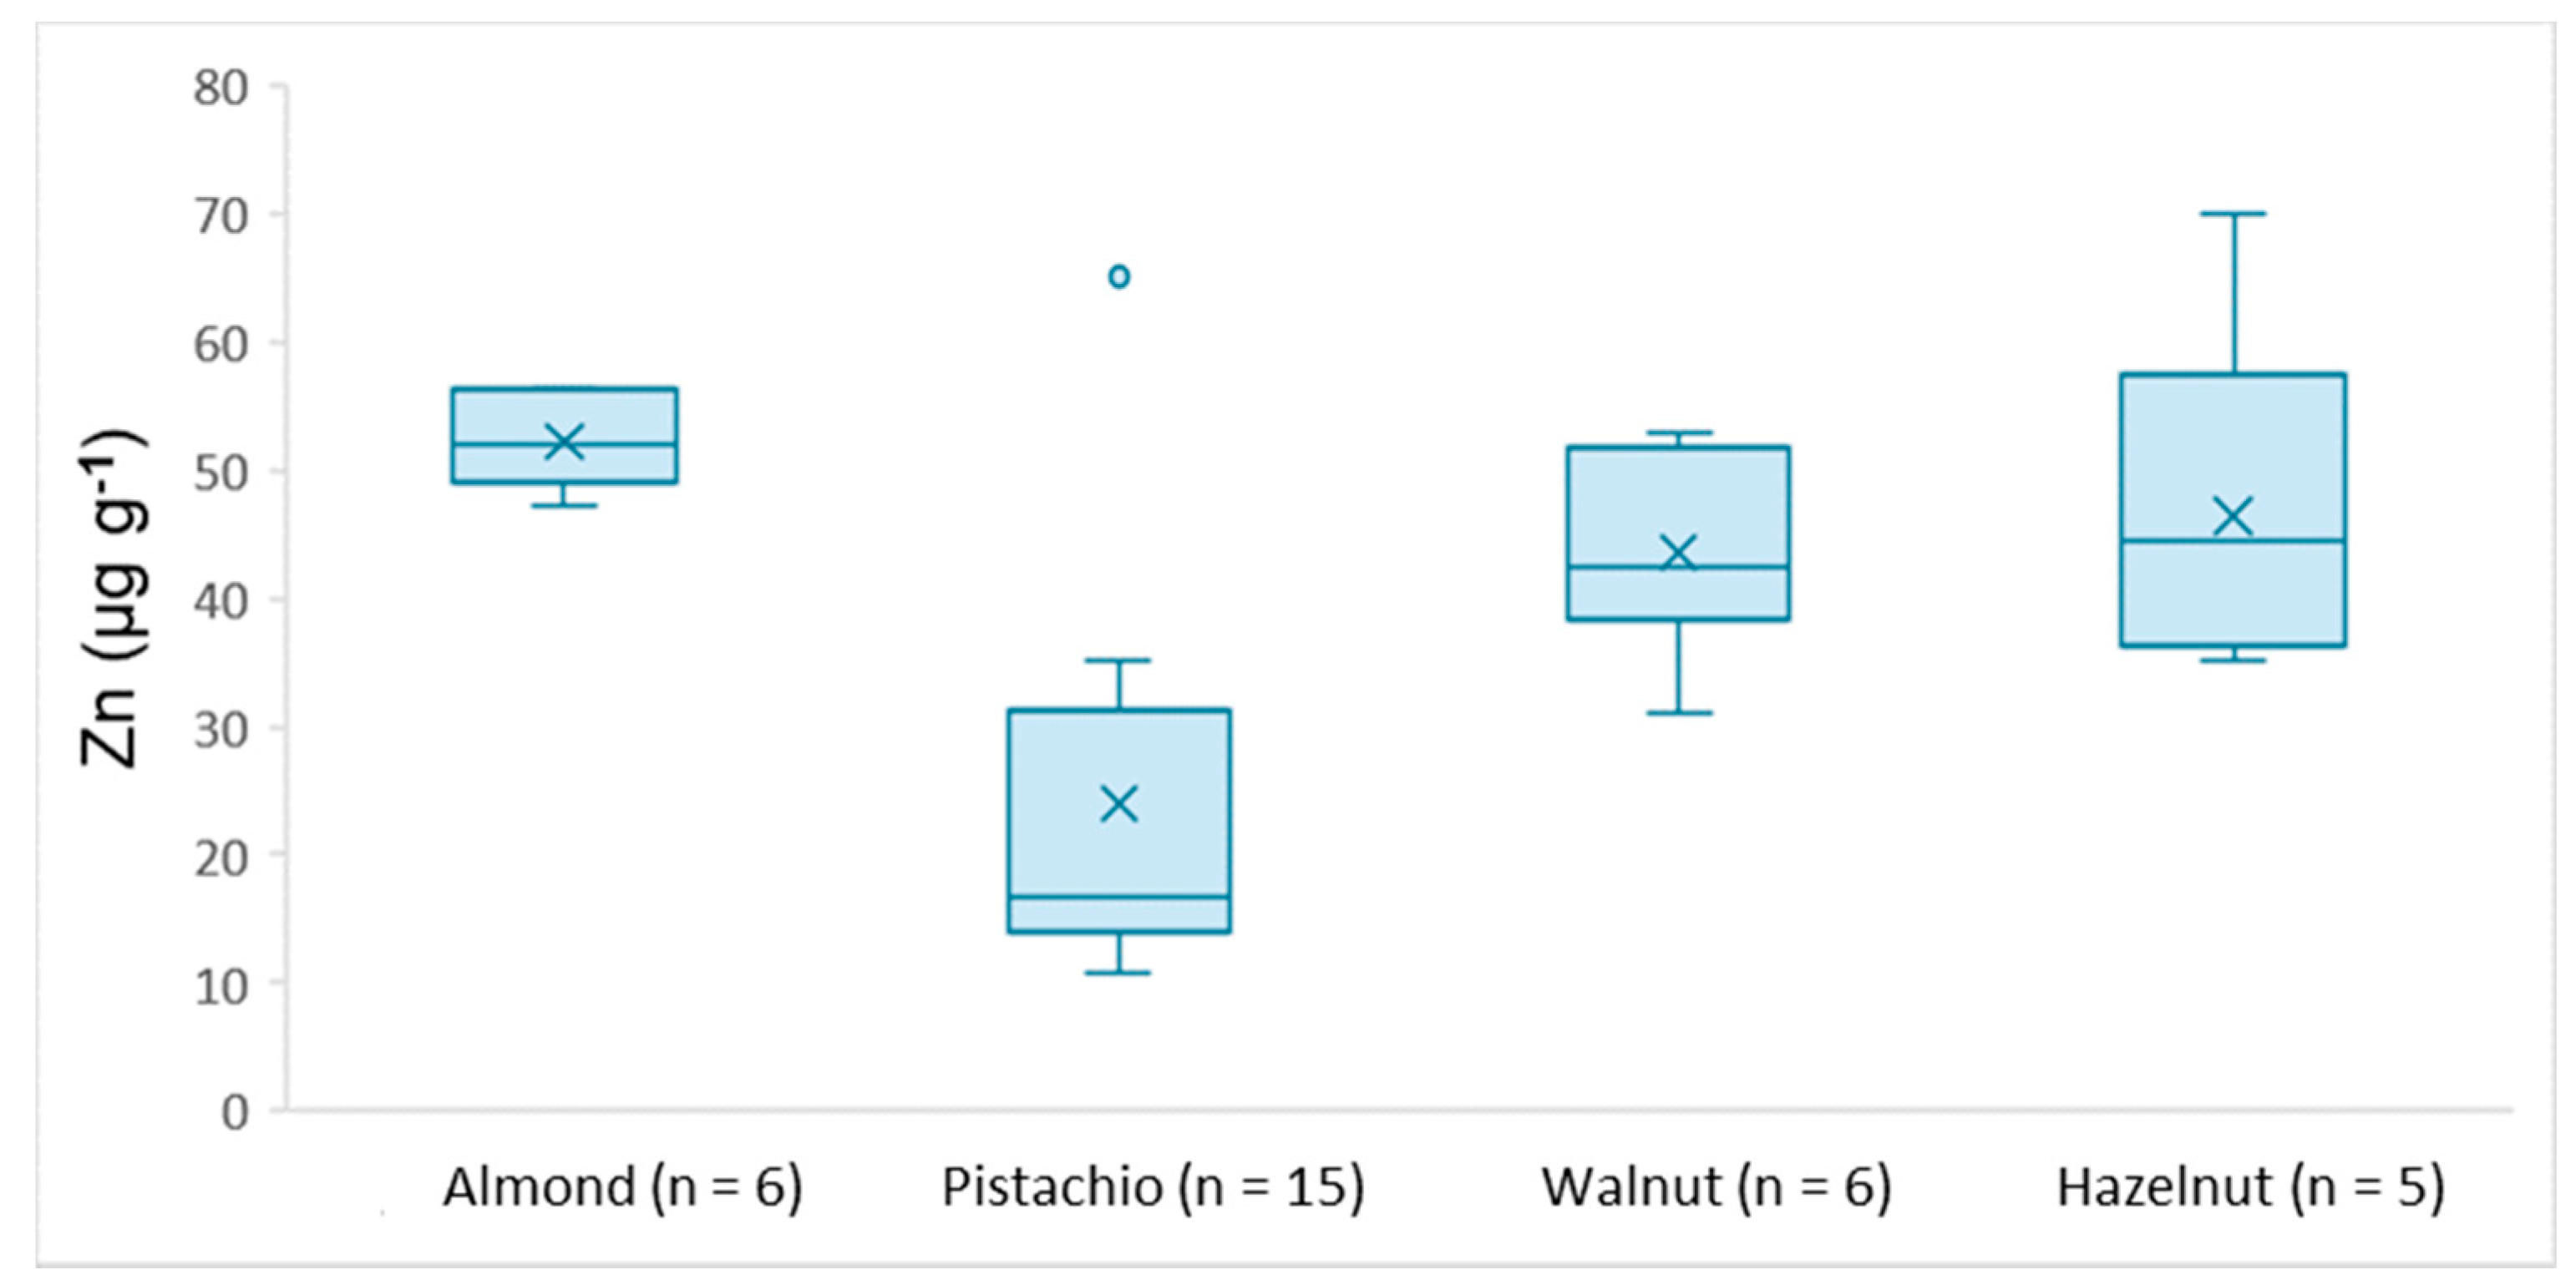
| Zn | 49.7–56.4 | 8.51–35.1 | 31.1–52.9 | 35.2–70.1 |
| Al | 1.17–3.82 | 0.85–3.00 | 1.50–2.98 | 1.28–3.04 |
| Mn | 9.21–31.5 | 6.98–19.4 | 5.86–23.1 | 0.57–33.2 |
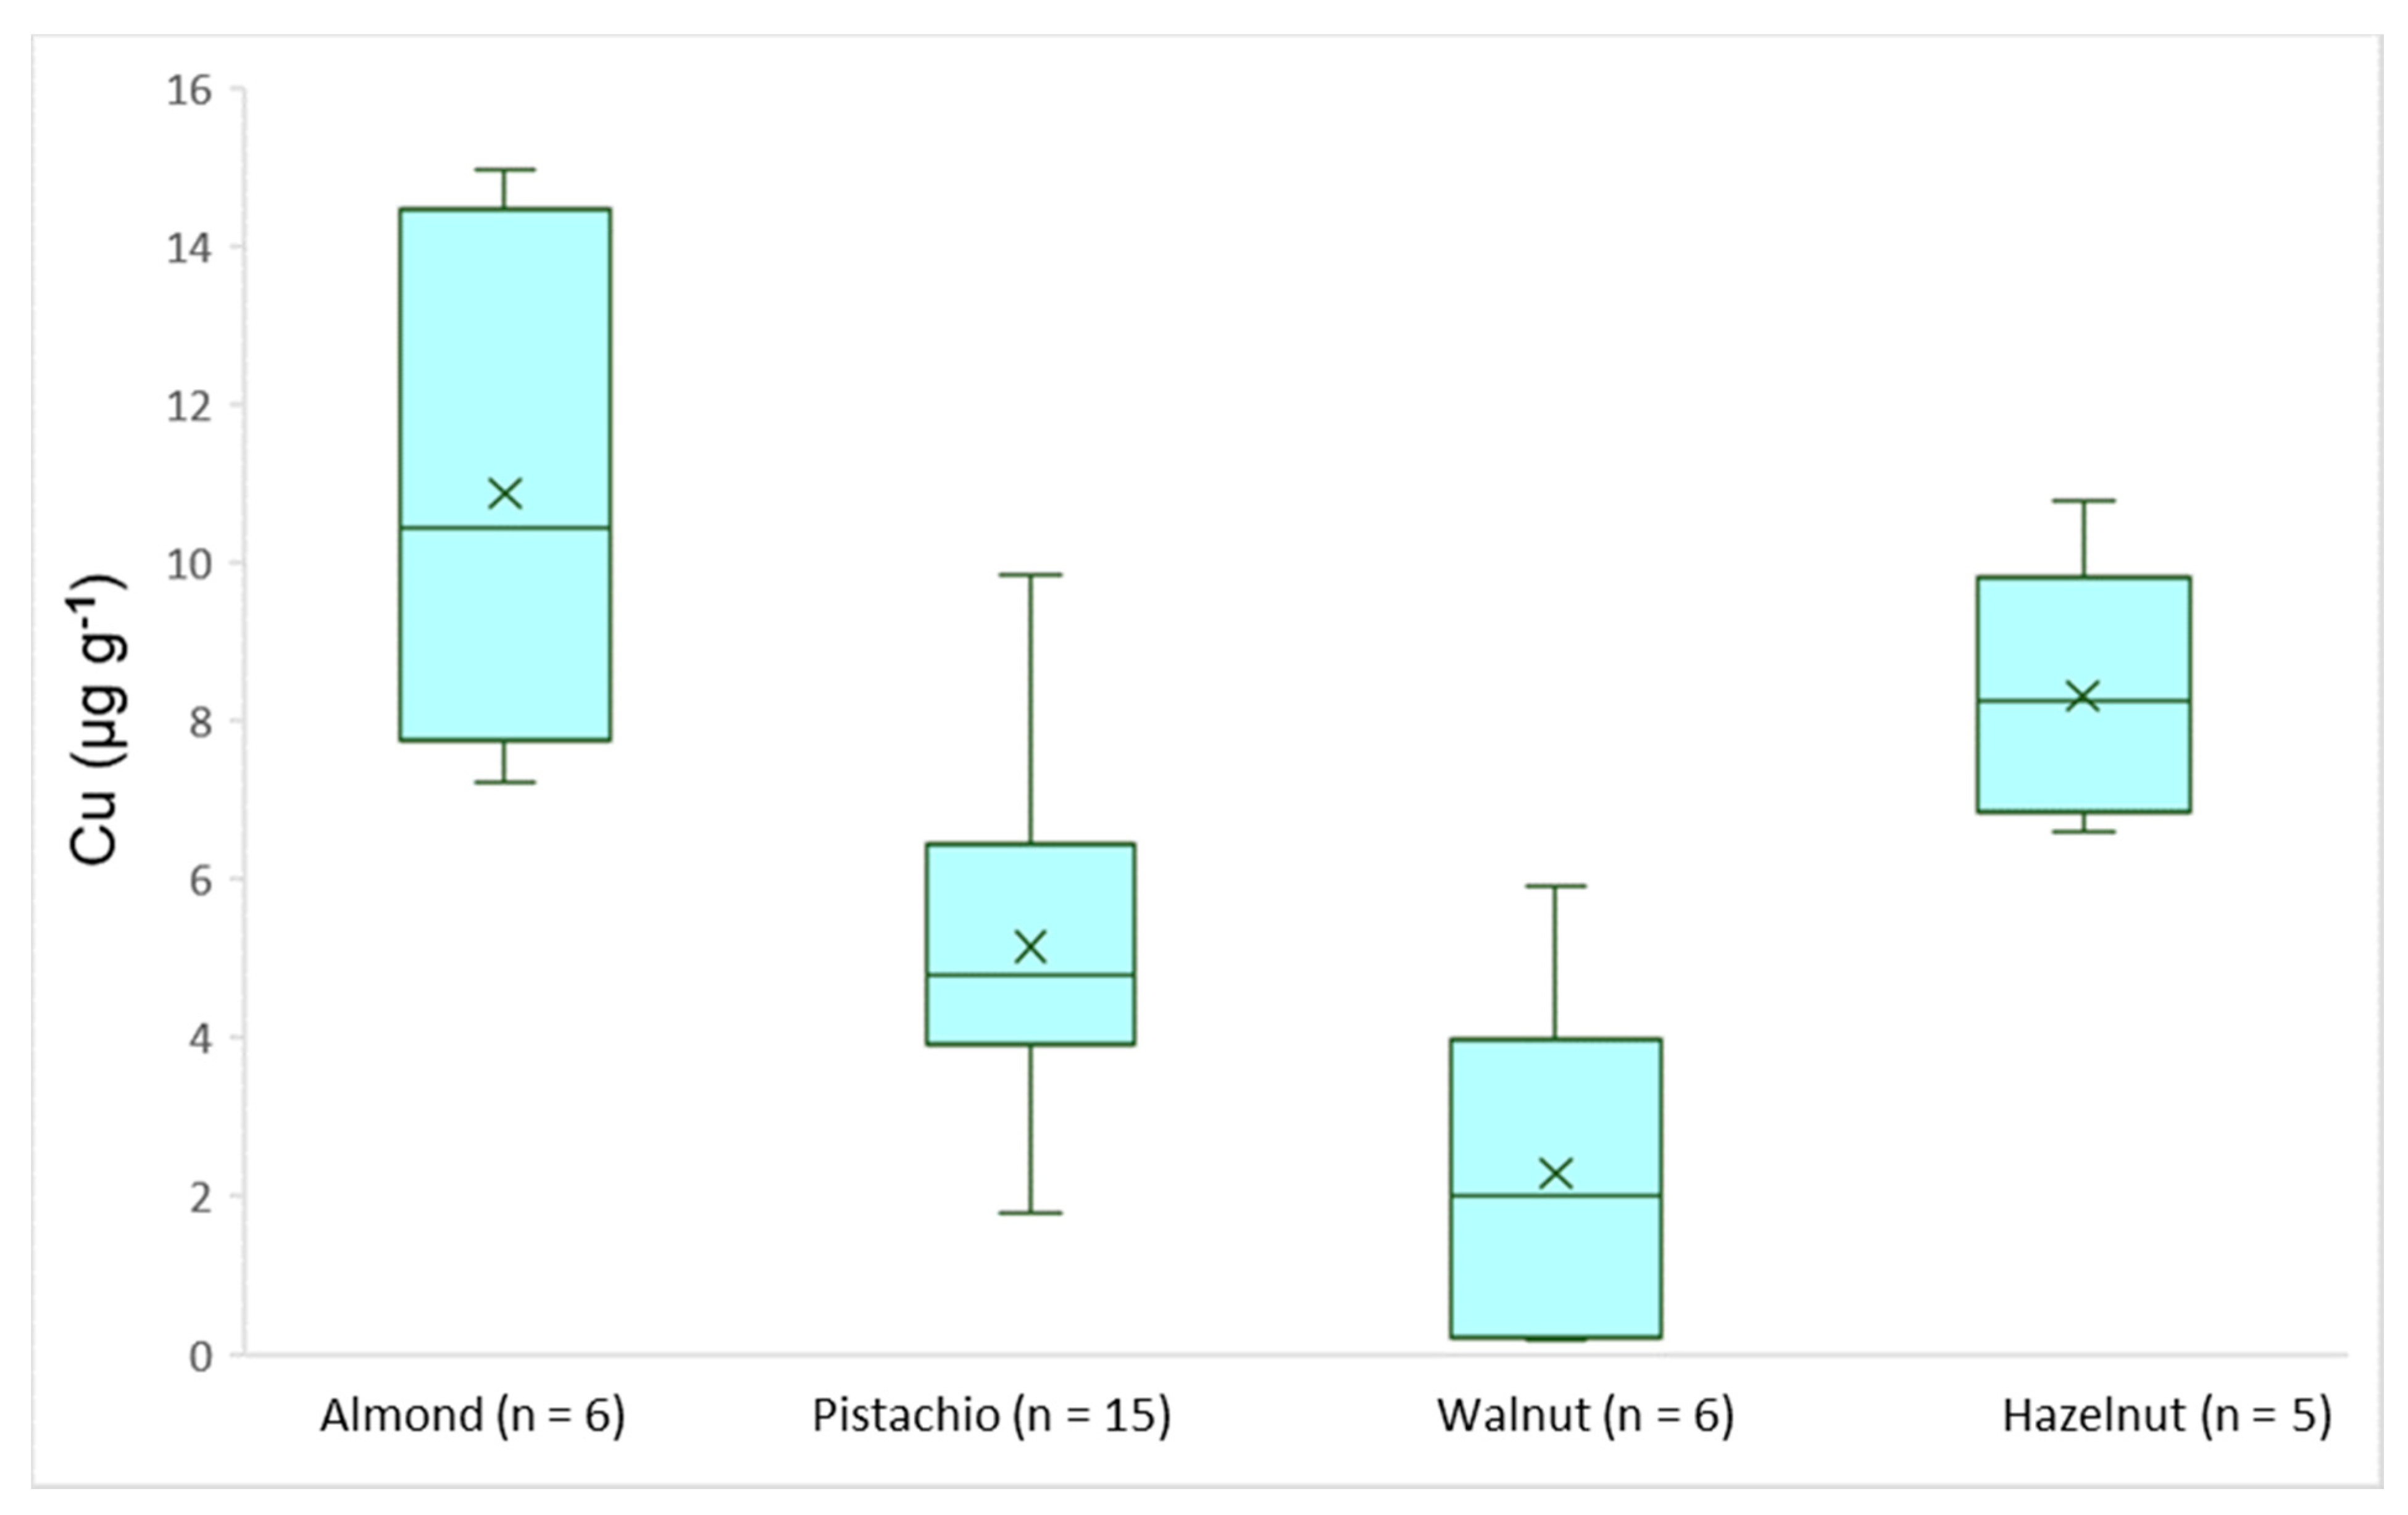
| Cu | 7.24–15.0 | 1.77–9.85 | 0.19–5.92 | 6.61–10.8 |
| Cr | 0.85–3.64 | 0.90–3.29 | 0.79–2.52 | 0.03–3.64 |
Publisher’s Note: MDPI stays neutral with regard to jurisdictional claims in published maps and institutional affiliations. |
© 2021 by the authors. Licensee MDPI, Basel, Switzerland. This article is an open access article distributed under the terms and conditions of the Creative Commons Attribution (CC BY) license (http://creativecommons.org/licenses/by/4.0/).
Share and Cite
Kalogiouri, N.P.; Manousi, N.; Zachariadis, G.A. Determination of the Toxic and Nutrient Element Content of Almonds, Walnuts, Hazelnuts and Pistachios by ICP-AES. Separations 2021, 8, 28. https://doi.org/10.3390/separations8030028
Kalogiouri NP, Manousi N, Zachariadis GA. Determination of the Toxic and Nutrient Element Content of Almonds, Walnuts, Hazelnuts and Pistachios by ICP-AES. Separations. 2021; 8(3):28. https://doi.org/10.3390/separations8030028
Chicago/Turabian StyleKalogiouri, Natasa P., Natalia Manousi, and George A. Zachariadis. 2021. "Determination of the Toxic and Nutrient Element Content of Almonds, Walnuts, Hazelnuts and Pistachios by ICP-AES" Separations 8, no. 3: 28. https://doi.org/10.3390/separations8030028
APA StyleKalogiouri, N. P., Manousi, N., & Zachariadis, G. A. (2021). Determination of the Toxic and Nutrient Element Content of Almonds, Walnuts, Hazelnuts and Pistachios by ICP-AES. Separations, 8(3), 28. https://doi.org/10.3390/separations8030028