Article

Quality Distinguish of Red Ginseng from Different Origins by HPLC–ELSD/PDA Combined with HPSEC–MALLS–RID, Focus on the Sugar-Markers

1
College of Pharmaceutical Engineering of Traditional Chinese Medicine, Tianjin University of Traditional Chinese Medicine, Tianjin 301617, China
2
State Key Laboratory of Component-Based Chinese Medicine, Tianjin University of Traditional Chinese Medicine, Tianjin 301617, China
*
Authors to whom correspondence should be addressed.
Both these authors contribute equally to this work.
Separations 2021, 8(11), 198; https://doi.org/10.3390/separations8110198
Submission received: 14 September 2021 / Revised: 5 October 2021 / Accepted: 19 October 2021 / Published: 27 October 2021

Abstract

:
Red ginseng (RG) has been extensively utilized in Asian countries due to its pharmacological effects. For the quality evaluation of RG, small molecules, such as ginsenosides, have been widely considered as candidates of its quality markers (Q-markers), and various analytical techniques have been developed in order to identify these compounds. However, despite the efforts to analyze the hydrophobic constituents, it is worth pointing out that about 60% of the mass of RG is made of carbohydrates, including mono-, oligo- and polysaccharides. Consequently, the quality differentiation and identification of RG from the perspective of sugar-markers should be focused. High performance liquid chromatography and evaporative light scattering detector (HPLC–ELSD) method for the determination of disaccharides in RG was established. Furthermore, high performance size exclusion chromatography–multi-angle laser light scattering–refractive index detector (HPSEC–MALLS–RID) for the determination of molecular weight and high performance liquid chromatography photodiode array (HPLC–PDA) for the determination of compositional monosaccharides in RG polysaccharides were also established. HPLC–ELSD/PDA combined with HPSEC–MALLS–RID could be used to determine the contents of disaccharides, molecular weights, and compositional monosaccharides of RG polysaccharides, which could be used for quality control, and this is a new view on the sugar marker to quality differentiation of various origins of RG.

1. Introduction

Red ginseng (RG) is steamed dried root and rhizome of the cultivated product of Panax ginseng Meyer. It is a mild Chinese medicine that tastes sweet and smells light and has the effects of replenishing the vital qi, restoring pulse, and relieving collapse syndrome, supplementing qi, and activating blood. It is used for shallow breathing, shortness of breath, coldness of limbs, profuse sweating, or weakness [1]. Modern research shows that RG has antitumor [2], anti-aging [3,4], antioxidant [5,6], and other physiological activities. The chemical components isolated from RG include mainly ginsenosides, sugars, volatile oils, amino acids, and trace elements [7,8]. Among these, ginsenosides and sugars are the main chemical constituents and are also recognized as the main active ingredients [9,10,11,12,13].
In the meantime, since the chemical ingredients of RG can fluctuate dramatically in response to the environmental variations (e.g., climate, cultivating conditions, etc.), a reasonable and effective strategy of quality control of this herbal product is greatly required in the community. In this respect, the hydrophobic constituents of RG, such as ginsenosides and saponins, have been widely considered as candidates of quality markers (Q-markers), and various analytical techniques have been developed in order to identify these compounds. For instance, Jeong et al. developed an effective high performance liquid chromatography–photodiode array detector (HPLC–PDA) method and demonstrated that the method was useful for the quantification of maltol in various ginseng products [14]. In et al. reported an HPLC-based method for simultaneous quantification of twelve ginsenosides in RG powder and extract and found the method suitable for quality control of ginseng products [15]. Zhou and his coworkers proposed an ultra-fast liquid chromatography coupled with electrospray ionization triple quadrupole tandem mass spectrometry (UFLC–MS/MS) method to evaluate the quality of RG, which could quantify sixty-six saponins and their six aglycones [16]. Kim et al. investigated the time-dependent changes in the crude saponin and the major natural and artifact ginsenosides contents during simmering and recommended (20S)- and (20R)-ginsenoside Rg3 as new reference materials to complement ginsenoside Rb1 and Rg1 [17]. Lee and his colleagues applied ultra-performance liquid chromatography coupled to quadrupole time-of-flight mass spectrometry (UPLC–QTOF/MS)-based metabolomics for the quality evaluation of four types of ginsengs, and their results indicated that the approach was useful for the quality control of processed ginseng products [18]. Wu et al. performed UPLC–QTOF/MS analysis to detect ginsenosides in white ginseng and RG and assigned several chemical markers with the help of multivariate statistical analysis [19].
However, despite the researchers’ efforts to analyze the hydrophobic constituents, it is worth pointing out that ca. 60% [20] of the mass of RG is made of carbohydrates, including mono-, oligo- and polysaccharides [21]. Meanwhile, relevant studies have revealed the pharmacological effects of the polysaccharides of RG, such as immune activity [22,23,24,25] and anti-aging effects [26]. Most recently, Shin et al. found that RG polysaccharides could inhibit tau aggregation and promote the dissociation of tau aggregates [27]. Hence, it is quite reasonable to include the sugars in the Q-markers of RG.
In addition, polysaccharide is one of the active components in traditional Chinese medicine (TCM). The activity of polysaccharides is closely related to its structure. The molecular weight and compositional monosaccharides of polysaccharides are also the major factors affecting the therapeutic action of polysaccharides. Therefore, the establishment of determination methods for molecular weight and compositional monosaccharides of polysaccharides can provide the reference for the study of polysaccharides.
Hence, it is quite reasonable to include the sugars in the Q-markers of RG. Based on these considerations, we established a methodology combining evaporative light-scattering detector–photodiode array (HPLC–ELSD/PDA) and high performance size exclusion chromatography (HPSEC)–multi-angle laser light scattering (MALLS)–refractive index detector (RID) to identify and characterize the RG disaccharides and polysaccharides. With the help of principle component analysis (PCA) and cluster analysis, we further showed that RG polysaccharides could be used for the quality control of RG products. In short, this is a novel view of sugar marker to distinguish the different origins of RG.

2. Materials and Methods

2.1. Plant Materials and Reagents

Eight batches of RG from different origins were purchased from Anhui Yishengyuan traditional Chinese medicine decoction pieces Technology Co., Ltd. (bozhou, China). The details of the samples are as follows: Jilin Tonghua (batch number: 190301), Liaoning Xinbin (batch number: 190201), Liaoning Huanren (batch number: 190201), Jilin Jingyu (batch number: 190401), Jilin Huichun (batch number: 190101), Jilin Antu (batch number: 190401), Jilin Fusong (batch number: 190501), and Jilin Dunhua (batch number: 190101). All samples were identified by Dr. Chun-Hua Wang, Tianjin University of Traditional Chinese Medicine, and these samples were kept at the College of Pharmaceutical Engineering of TCM, Poyanghu Road, Jinghai, Tianjin, China.
Sucrose (batch number: S02S6G1, content ≥98%), maltose (batch number: RM0331FC14, content ≥98%), D-galactose (batch number: Z22J9H64187, content ≥98%), D-anhydrous glucose (batch number: S10S9I69833, content ≥98%), L-arabinose (batch number: T05J6C1, content ≥98%), and 1-phenyl-3-methyl-5-pyrazolone (PMP) reagent were purchased from Shanghai Yuanye Biotechnology Co., Ltd. Acetonitrile and methanol (HPLC grade) were purchased from Fisher (Fair Lawn, NJ, USA). Other reagents were analytically pure grade. Na2SO4 (anhydrous sodium sulphate) was purchased from Tianjin North Tianyi Chemical Reagent Factory. Proclin 300 and ammonium acetate were purchased from Beijing Solebo Technology Co., Ltd.

2.2. Instrumentation

HPLC–ELSD data were detected on a Waters ACQUITY HPLCTM System (Waters, Milford, MA, USA) and ELSD detector 2424 (Waters, Milford, MA, USA). The HPLC–RID–MALLS system consisted of the HPLC instrument LC-20AD (Shimadzu, Kyoto, Japan), RID detector RID-20A (Shimadzu, Kyoto, Japan), and MALLS DAWN8 (Wyatt Technology Co., Santa Barbara, CA, USA). HPLC–PDA analyses were performed using the HPLC ACQUITY Arc instrument (Waters, Milford, MA, USA) and the PDA detector 2998 (Waters, Milford, MA, USA). In addition, we used the 5-digit Analytical Balance AB 135 S and the 4-digit Analytical Balance AL 204 electronic analytical balance (Mettler Toledo instruments Co., Ltd., Shanghai, China), the ultrasonic cleaner KQ2200DB (Kunshan Ultrasonic Instrument Co., Ltd., Kunshan, Jiangsu, China), the vacuum freezing dryer FDU-2110 (EYELA, Tokyo, Japan) and the Q-POD ultrapure water machine (Millipore, Illkirch-Graffenstaden, France).

2.3. Simultaneous Determination of Disaccharides in Rg Using the Hplc–Elsd Method

2.3.1. Preparation of Samples

RG samples were pulverized and passed through a 40-mesh sieve. The sample powders (2.0 g) were added to 20 mL of ultrapure water then sonicated for 30 min in an ultrasonic bath.
The mixed samples contain 16.37 mg of sucrose and 26.30 mg of maltose per 1 mL.

2.3.2. Chromatographic Conditions on the Determination of Disaccharides

Chromatographic column: YMC Pack NH2/S-5 μm/12 nm (250 × 4.6 mm I.D.); flow rate: 1.0 mL/min; mobile phase: acetonitrile-water (79:21); column temperature: 30 °C; ELSD: gain 10; drift tube temperature: 60 °C; air pressure: 35 psi; sprayer heating power level: 60%; injection volume: 10 µL.

2.3.3. Methodological Study on the Determination of Disaccharides

In order to verify the feasibility of the method, we have conducted some method validation experiments, including linearity, precision, repeatability, stability, and recovery.

2.3.4. Content Determination of Disaccharides

Eight batches of RG were collected from Jilin Tonghua, Liaoning Xinbin, Liaoning Huanren, Jilin Jingyu, Jilin Huichun, Jilin Antu, Jilin Fusong, and Jilin Dunhua. RG samples were prepared and were determined according to the chromatographic conditions on the determination of disaccharides (10 µL per injection) [28].

2.4. Determination of Molecular Weight and Compositional Monosaccharides of Rg Polysaccharides

2.4.1. Molecular Weight Analysis of Rg Polysaccharides

Extraction of Polysaccharides

RG powders from different areas were weighed (approximately 1.0 g) and heated to reflux for 3 h after adding 10 mL of pure water. The resulting solution was centrifuged (3750 r/min, 10 min) and the supernatant was evaporated to 10 mL, at which point four volumes of 95% ethanol were added. The solution was left overnight at 4 °C and centrifuged (3750 r/min, 10 min) again; the precipitate was retained and the residual ethanol was removed by heating. The dried precipitate was dissolved in 10 mL of hot water, vortexed, and centrifuged. The supernatant was centrifuged (2220 r/min, 22 min) in an ultrafiltration centrifuge tube (molecular weight cut-off of 3 kDa). Finally, the solution was freeze-dried to obtain the RG polysaccharide’s samples.

Preparation of the RG Polysaccharide’s Samples

The RG polysaccharides dissolved in the mobile phase were configured into a 1 mg/mL solution through 0.22 μm microporous filter membrane filtration in order to obtain the subsequent filtrate.

Preparation of the Glucan Solution

The MALLS is normalized with a 3 mg/mL control solution of glucan (40 kDa).

Chromatographic Conditions on the Determination of Molecular Weight

Chromatographic column: TSKgel GMPWXL (7.8 mm I.D. × 30 cm, 13 μm); flow rate: 0.6 mL/min; mobile phase: 0.7% Na2SO4 (contains 0.02% Proclin 300 antibacterial agent); column temperature: 35 °C; detector: MALLS combined with RID; injection volume: 100 µL.

2.4.2. Analysis of Compositional Monosaccharides of RG Polysaccharides

Preparation of Hydrolyzed Polysaccharides

The polysaccharide was completely dissolved in 2 mol/L TFA (trifluoroacetic acid) in the sealed tube (m polysaccharide: v TFA = 2:1). The tube was kept in boiling water for 6 h to hydrolyze the polysaccharides to monosaccharides. The acid was removed through co-distillation with methanol. The dried products were dissolved in distilled water (m polysaccharides: v H2O = 2:1) to obtain the hydrolyzed products [29]. The hydrolyzed products were modified with PMP. The monosaccharide aqueous solution (200 μL) was mixed with 200 μL of 0.3 mol/L NaOH, and then 200 μL of 0.5 mol/L PMP methanol solution was added. The reaction was allowed to run for 1 h at 70 °C and then cooled to room temperature and neutralized with a 200 μL 0.3 mol/L HCl solution. The sample solution was extracted with 1 mL of chloroform; the process was repeated three times. Finally, the sample solution was centrifuged (8000 r/min, 10 min) and the supernatant was injected for analysis.

Preparation of the Mixed Monosaccharides Solution

Amounts of 5.42 mg D-mannose, 10.36 mg D-galactose, 25.72 mg D-anhydrous glucose, 5.60 mg L-arabinose, and 4.97 mg D-galacturonic acid were placed in a 10 mL brown volumetric flask. The solution was then diluted with pure water and the method referred to in Preparation of Hydrolyzed Polysaccharides was used for derivation in order to obtain the mixed reference solution.

Chromatographic Conditions on the Determination of Compositional Monosaccharides

Chromatographic column: Kromasil 100-5-C18 (4.6 × 250 mm, 5 μm); flow rate: 1.0 mL/min; mobile phase: 0.1 mol/L Ammonium acetate solution-acetonitrile (79:21); column temperature: 35 °C; detective wave: 250 nm; injection volume: 20 µL.

Methodological Study on the Determination of Compositional Monosaccharides of Polysaccharides

In order to verify the feasibility of the method, we have conducted some method validation experiments, including linearity, precision, repeatability, stability, and recovery.

2.4.3. Content Determination of Molecular Weights and Compositional Monosaccharides of Rg Polysaccharides

Determination of Molecular Weights of Polysaccharides

The RG samples from different origins were weighed for the preparation of hydrolyzed polysaccharides and 100 μL were injected according to the chromatographic conditions on the determination of molecular weights of polysaccharides.

Determination of Compositional Monosaccharides of Polysaccharides

The RG samples from different origins were weighed for the preparation of hydrolyzed polysaccharides and 20 μL were injected according to the chromatographic conditions on the determination of compositional monosaccharides.

3. Results and Discussion

3.1. Conditions Optimization

The extraction solvent (including water, 55%, 75%, 95% ethanol), extraction method (including ultrasonic extraction, reflux extraction), and ultrasonic extraction time were optimized in this experiment. The results showed that the optimal extraction process was extracted with water and ultrasonic for 30 min.
The experiment examines the effect of filter membrane adsorption on the determination of sample solution by filter membrane adsorption test. The RG reference sample solution was collected and centrifuged (4000 r/min, 10 min) to determine the peak area (A1) of the sample, and 0.1 mL was discarded to obtain the peak area (A2) of the continued filtrate sample to calculate the sample recovery (A2/A1 × 100%). The results show that the recoveries of sucrose and maltose were 102.08% and 103.18%, respectively. Additionally, he recoveries were 95–105%, which indicated that the membrane has less adsorption on the samples and less interference on the determination results.
Monosaccharides and disaccharides cannot be directly detected by the UV detector, and the process of derivatization of monosaccharides and disaccharides needs to be converted into substances with UV absorption, and sample derivatization may in turn introduce impurities, causing errors. Therefore, in this experiment, the HPLC–ELSD method was established to directly detect disaccharides, and this method is simple and rapid, which does not need the derivatization treatment of samples. However, the amino column has a large column loss, which easily leads to a decrease in column efficiency and poor durability. In order to achieve a better separation, the parameters were optimized in this experiment, and finally, 79% v/v acetonitrile-water isocratic elution was used with a column temperature of 30 °C.

3.2. Results on the Determination of Sucrose and Maltose

The chromatograms showed that the peak separation of sucrose and maltose was good and easy to be distinguished, thus this method could be used for the determination of disaccharides in RG (Figure 1A,B). Therefore, we performed method validation, and the results are shown in Table S1. We can see from the table that the results of the determination of sucrose and maltose were good, which indicated that this method was suitable for the determination of sucrose and maltose. The results of the contents are shown in Table 1.

3.3. Quantitative Analysis Results

PCA (principal component analysis) can simply express the multivariate information about the samples and makes it intuitive to see the correlation and variability among different samples [30,31,32].
PCA was performed on the contents of sucrose and maltose present in the eight batches of RG using MATLAB 2018a, and the PCA scatter plots of the eight batches of RG polysaccharide’s samples were obtained with principal components 1 and 2, whose cumulative proportion in ANOVA reached 100% (Figure 1C). The distribution of eight batches of RG samples from different areas was relatively scattered, indicating that the contents of sucrose and maltose in RG from different producing regions was quite different.

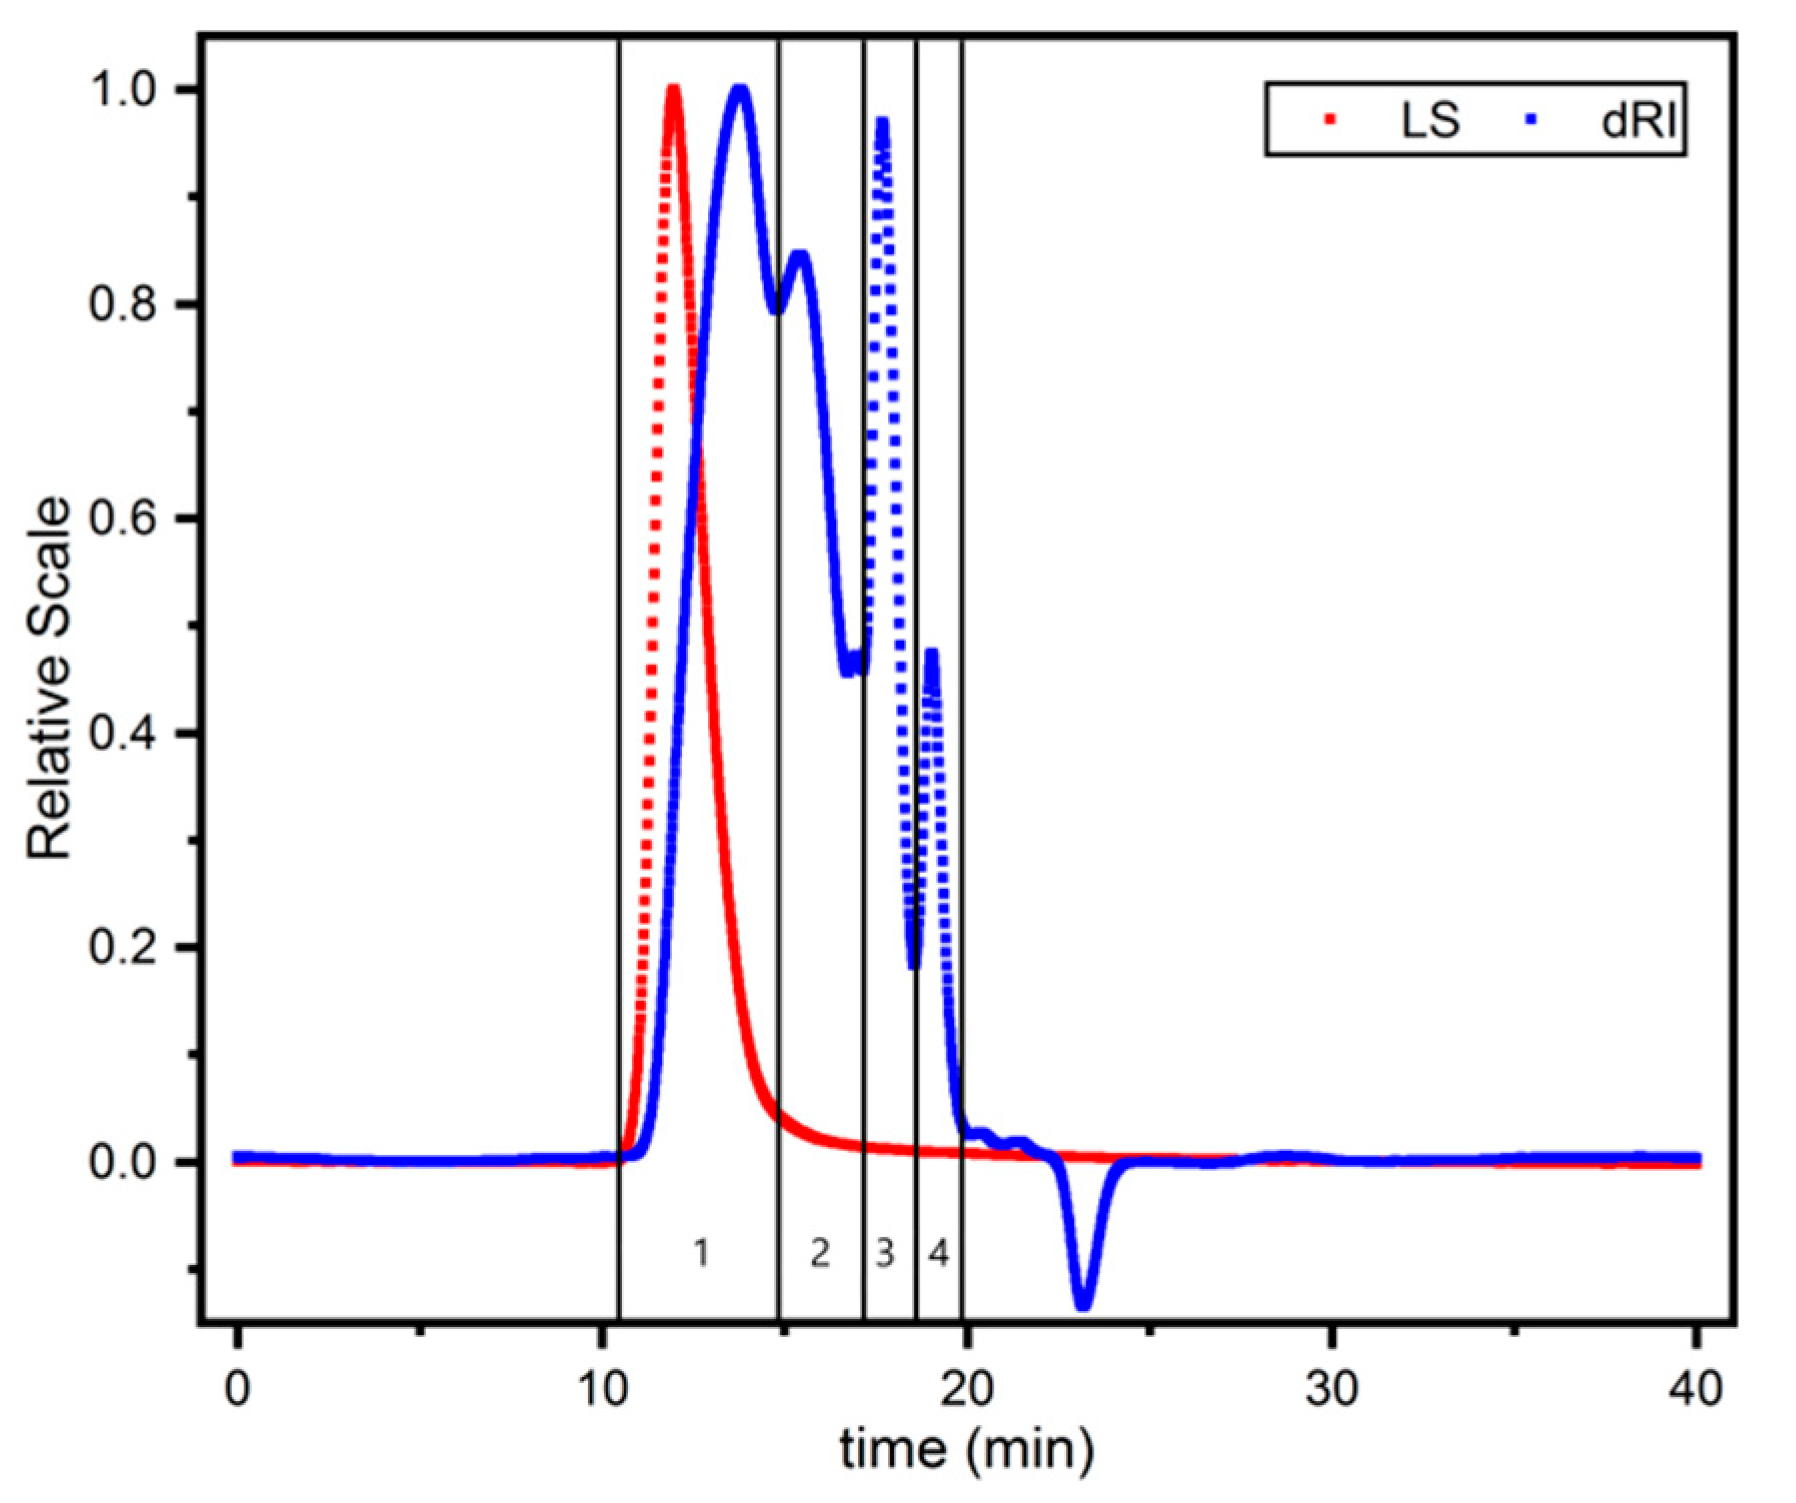
3.4. Analysis on the Polysaccharides Molecular Weight Determination

HPSEC–MALLS–RID is an efficient and high-quality analysis technique for the molecular weight and distribution of natural polymers [33,34]. In this experiment, the molecular weight and distribution of samples were investigated by HPSEC–MALLS–RID, and dextran standards (40 kDa) were used to verify the accuracy of it. Because the molecular weight of polysaccharides is large, the molecular weight distribution is wide, the separation of gel column is poor, and the samples were washed out of various molecules between 16.65 min and 20 min, the Mws of 3 and 4 could not be precisely determined (Figure 2). Table 2 summarizes the Mw and polydispersity index of polysaccharide fractions (peak 1 and peak 2). The Mws (peak 1 and 2) of the RG polysaccharide fractions of different origins ranged from 7.851 × 10²–3.8091 × 10³ kDa to 18.7–4.752 × 10² kDa, among which the Mws of the RG polysaccharide fractions (peak 1 and peak 2) from Jilin Jingyu were significantly lower than the others.

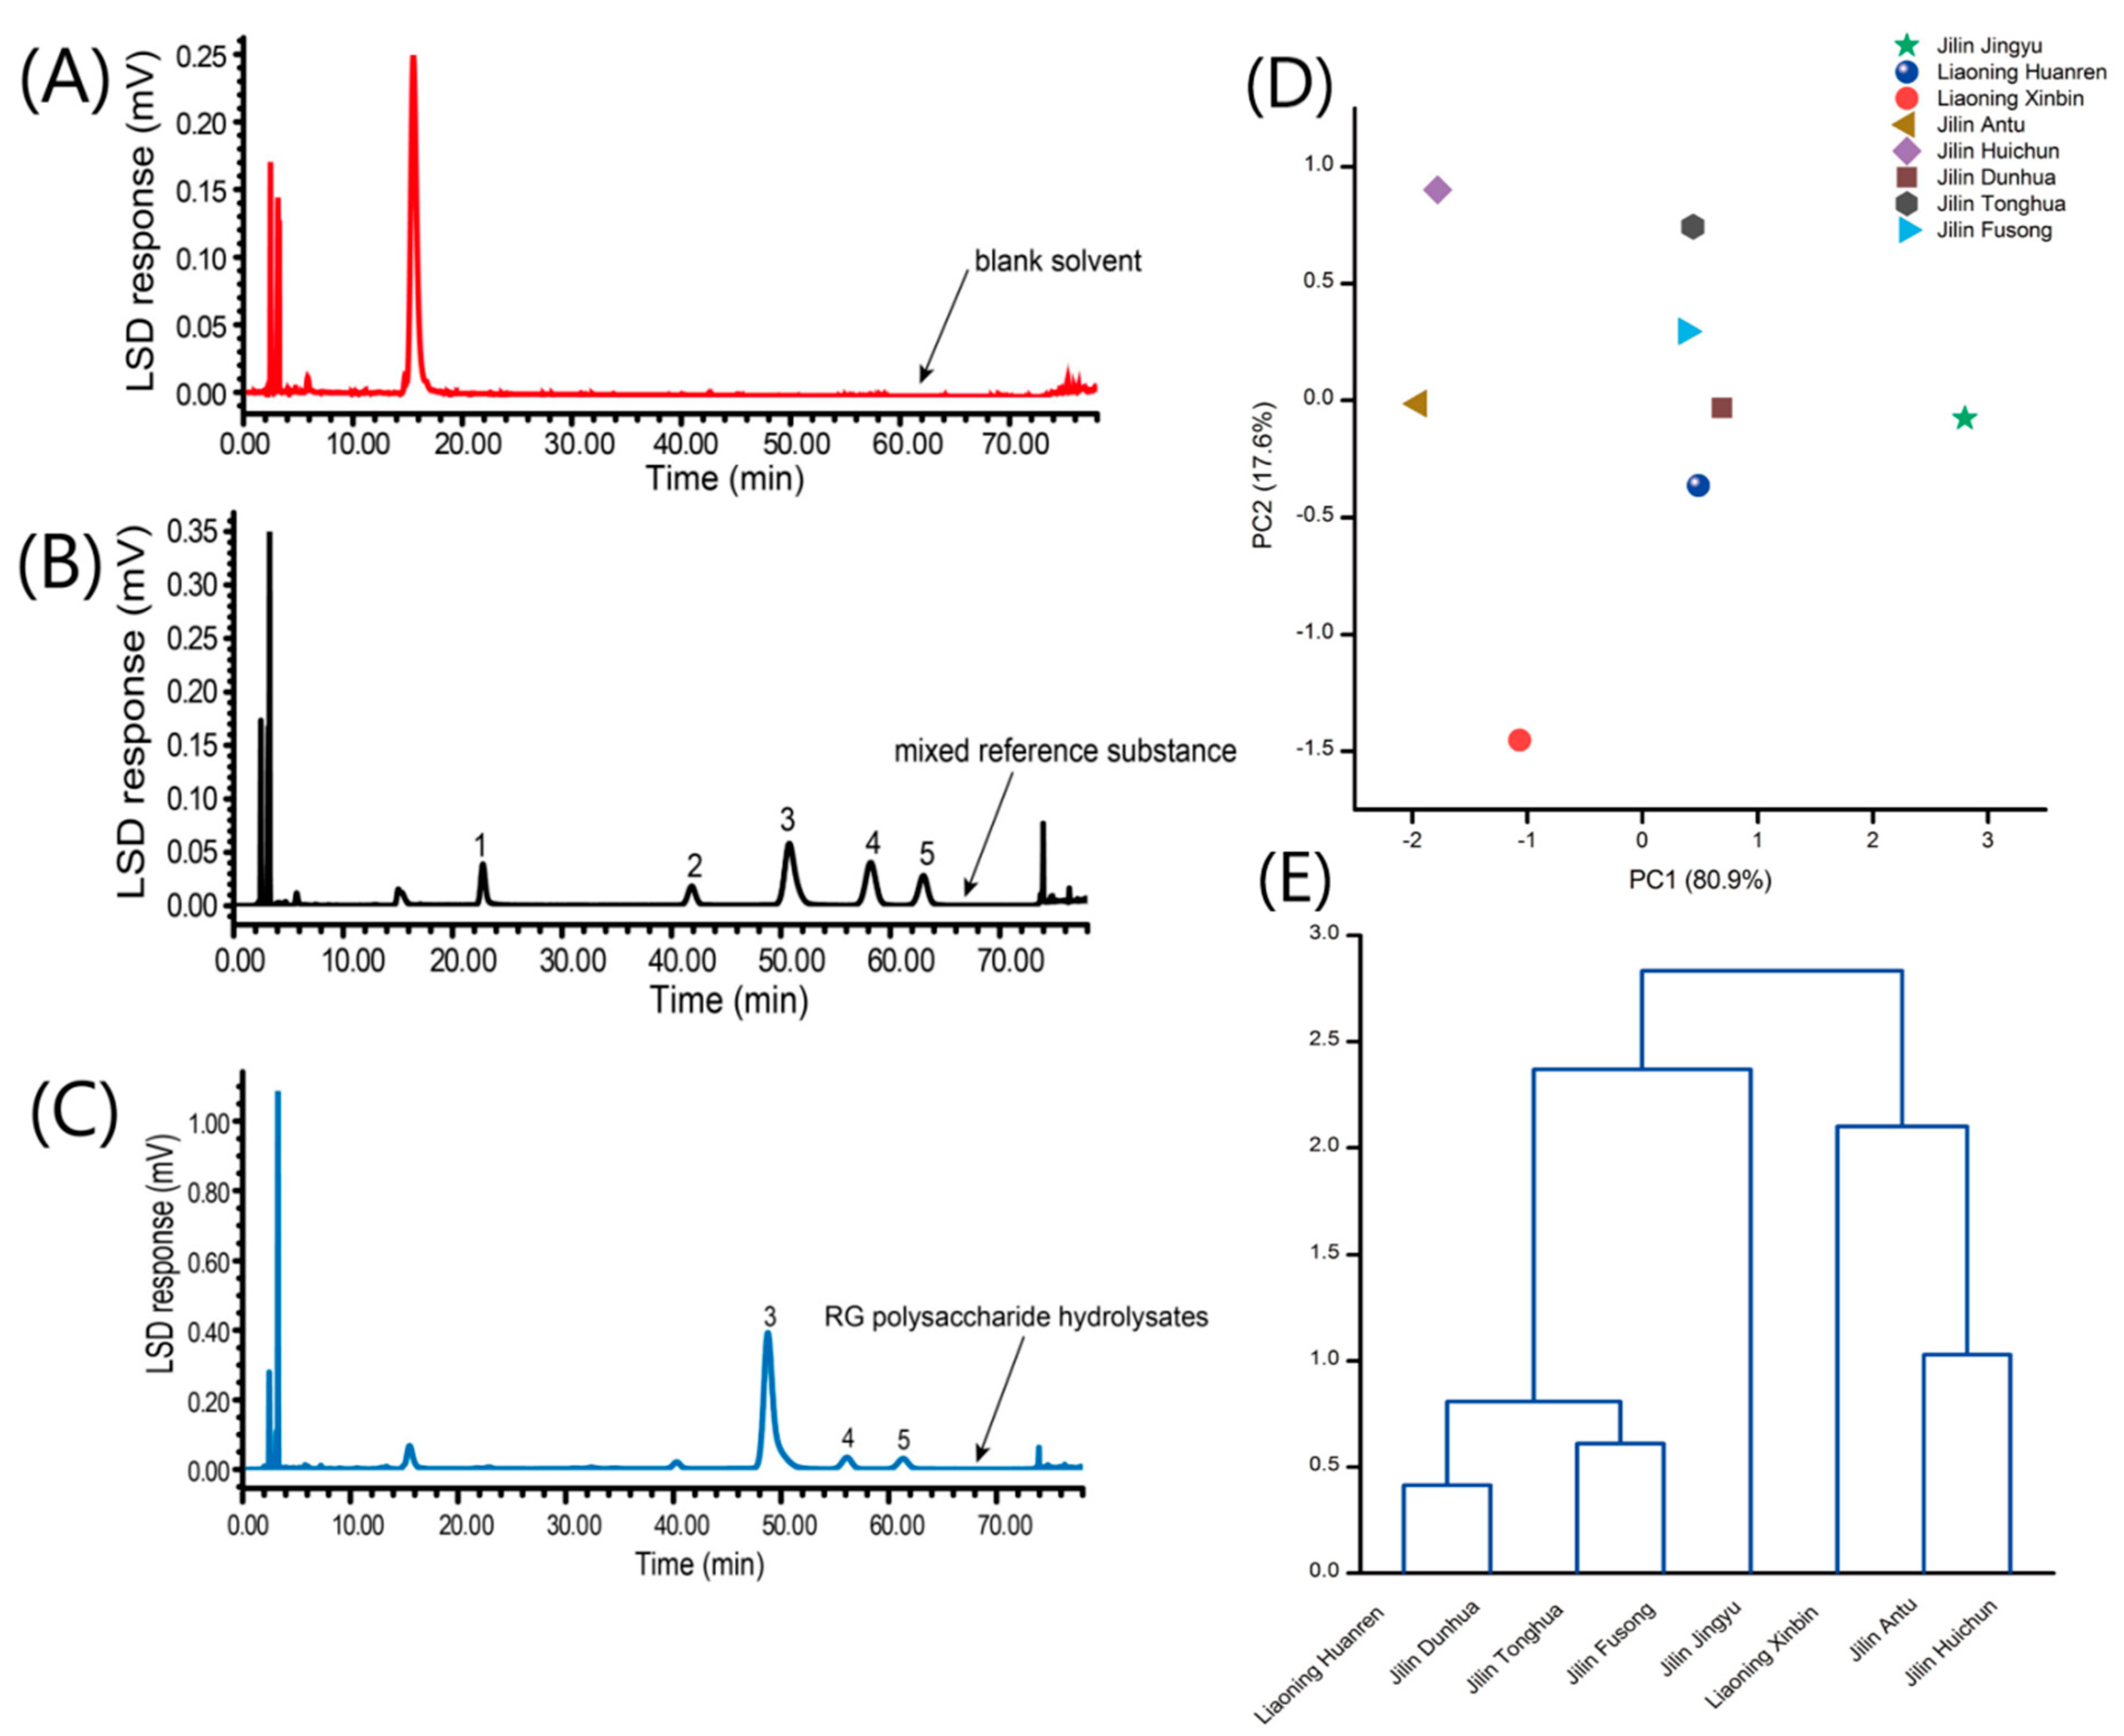
3.5. Results of Determinations of the Compositional Monosaccharides of Polysaccharides

The chromatogram showed that the peak separation of monosaccharides was good and easy to distinguish, thus this method could be used for the determination of compositional monosaccharides of polysaccharides (Figure 3A–C). Therefore, we performed method validation, and the results are shown in Table S2. We can see from the table that the results of the determination of compositional monosaccharides were good, which indicated that this method was suitable for the determination of compositional monosaccharides. The results of the contents are shown in Table 3.

3.6. Analysis on the Monosaccharide Composition Determination of Polysaccharides

3.6.1. PCA Results

The similarity and difference between different samples can be studied by the PCA analysis. On PCA plots, the more clustered the sample distribution, the more similar the samples are to each other, and the more discrete the sample distribution points are, the greater the variation among samples [35]. PCA was performed on the content of the monosaccharide in the eight batches of RG using MATLAB 2018a. For its dimension-reducing processing, two principal components were obtained whose cumulative proportion in ANOVA reached 100% (Figure 3D). The distribution points of RG samples from different origins are quite discrete.

3.6.2. Results of Systematic Cluster Analysis

The results of compositional monosaccharides determination of polysaccharides were clustered using MATLAB 2018a by the connection method between groups, averaging Euclidean distances. The contents of glucose, galactose, and arabinose were regarded as variables (Figure 3E). The samples from Liaoning Huanren, Jilin Dunhua, Jilin Tonghua, Jilin Fusong, and Jilin Jingyu were included are of a kind. The monosaccharide composition of polysaccharides in RG from these five areas are similar. The samples from Liaoning Xinbin, Jilin Antitu and Jilin Huichun are of another kind. The results of this analysis were identical to the PCA results.

4. Conclusions

In this experiment, the quantitative analysis of disaccharides in RG was established based on the HPLC–ELSD method and its methodology was investigated. The precision of the instrument, the stability, and the repeatability of the sample determination were less than 5%. It is indicated that this method is accurate and reproducible and can be used for the determination of disaccharides in RG. The quantitative results were obtained by PCA analysis, which can intuitively see the similarities and differences of the contents of disaccharides in different sources of RG. The results showed that there are large variations in disaccharides in RG from different areas. This method can be used for the quality control and quality evaluation of raw medicinal materials. In particular, this method is very suitable for the quality control of TCM preparations with high sugar content, such as ginseng products.
Meanwhile, we established the HPSEC–MALLS–RID method to determine the molecular weights of RG polysaccharides from different origins, which can directly measure the molecular weights of polysaccharides without a standard curve. Then, it can provide a reference for other herbal polysaccharides. The PMP pre-column derivatization HPLC method was developed to determine the compositional monosaccharides of RG polysaccharides, and methodological study was carried out. This method is suitable for the analysis of the compositional monosaccharides of RG polysaccharide. RG polysaccharides are mainly composed of glucose, galactose, and arabinose. The experimental results used PCA and cluster analysis to compare the similarities and differences in the compositional monosaccharides of polysaccharides from the RG, and the compositional monosaccharides of the RG samples from Liaoning Xinbin, Jilin Antu, and Jilin Huichun showed marked differences from other locations; thus this study can provide methods and references for the quality control and development and utilization of polysaccharides.
As the literature reported, it is worth pointing out that about 60% of the mass of RG is made of carbohydrates. Our results showed that sugar can be used as a Q-marker to distinguish different origins of RG. However, due to our limited sampling, we have not formed a good cluster analysis. We will continue to collect abundant RG samples according to different places of origins to improve the control system of sugar markers of RG from the perspective of sugars.

Supplementary Materials

The following are available online at https://www.mdpi.com/article/10.3390/separations8110198/s1, Table S1: Results of methodological investigation on the determination of sucrose and maltose; Table S2: Results of methodological investigation on compositional monosaccharides determination of polysaccharides; Table S3: Linear results of content determination of disaccharides. Linear relationship of sucrose; Table S4: Linear relationship of maltose; Figure S1: Linear relationship of sucrose; Figure S2: Linear relationship of maltose.

Author Contributions

Conceptualization, C.W., Z.L., F.L., T.S. and Y.H.; methodology, Q.C., S.P. and C.Z.; software, Q.C. and P.C.; validation, Q.C., S.P. and F.L.; data curation, Q.C. and S.P.; writing—original draft preparation, Q.C. and S.P.; writing—review and editing, C.W., Z.L., F.L., X.Y., T.S. and Y.H.; funding acquisition, Z.L. and X.Y. All authors have read and agreed to the published version of the manuscript.

Funding

This work was supported by the National Key R&D Program of China, Synthetic Biology Research (No. 2019YFA0905300) and the National Natural Science Foundation of China (No. 82074276).

Institutional Review Board Statement

The study did not require ethical approval.

Informed Consent Statement

The study did not require an Informed Consent Statement.

Data Availability Statement

All data is contained within the article.

Conflicts of Interest

The authors have declared no conflict of interest.

References

  1. Chinese Pharmacopoeia Commission. Pharmacopoeia of the People’s Republic of China; China Medical Science Press: Beijing, China, 2020.
  2. Zheng, X.; Zhou, Y.; Chen, W.; Chen, L.; Lu, J.; He, F.; Li, X.; Zhao, L. Ginsenoside 20(S)-Rg3 Prevents PKM2-Targeting miR-324-5p from H19 Sponging to Antagonize the Warburg Effect in Ovarian Cancer Cells. Cell. Physiol. Biochem. 2018, 51, 1340–1353. [Google Scholar] [CrossRef] [PubMed]
  3. Park, M.Y.; Han, S.J.; Moon, D.; Kwon, S.; Lee, J.W.; Kim, K.S. Effects of Red Ginseng on the Elastic Properties of Human Skin. J. Ginseng Res. 2020, 44, 738–746. [Google Scholar] [CrossRef] [PubMed]
  4. Sun, J.; Jiao, C.; Ma, Y.; Chen, J.; Wu, W.; Liu, S. Anti-Ageing Effect of Red Ginseng Revealed by Urinary Metabonomics Using RRLC-Q-TOF-MS. Phytochem. Anal. 2018, 29, 387–397. [Google Scholar] [CrossRef] [PubMed]
  5. Kim, M.H.; Lee, E.J.; Cheon, J.M.; Nam, K.J.; Oh, T.H.; Kim, K.S. Antioxidant and Hepatoprotective Effects of Fermented Red Ginseng against High Fat Diet-Induced Hyperlipidemia in Rats. Lab. Anim. Res. 2016, 32, 217–223. [Google Scholar] [CrossRef] [Green Version]
  6. Liu, J.W.; Yue, C.Y.; Wu, S.; Zhao, X.Q.; Zhang, Y.; Gong, L.H. Study on Antioxidant Ability of Red Ginseng Polysaccharide in Mice. China Food Addit. 2019, 30, 68–71. [Google Scholar]
  7. Zhou, Q.L.; Xu, W.; Yang, X.W. Chemical constituents of Chinese red ginseng. Chin. J. Chin. Mater. Med. 2016, 41, 233–249. [Google Scholar]
  8. Zhou, Q.Q.; Ren, W.M.; Wang, Y.H.; Yang, D.; Wang, G.M.; Li, Y.R. Research Progress on Processing Drugs Methods, Chemical Composition and Pharmacological Activity of Red Ginseng. Shanghai J. Tradit. Chin. Med. 2016, 50, 97–100. [Google Scholar]
  9. Liu, C.L.; Xie, Q.S.; Li, Q.Y.; Gao, T.Y.; Liu, H.X.; Jiang, H. Determination of Total Ginsenosides, Ginsenosides Rg1, Re and Rb1 in Red Ginseng. J. Pharm. Res. 2021, 40, 87–90. [Google Scholar]
  10. Gao, T.Y.; Jiang, Y.Q.; Li, Q.Y.; Hu, F.D.; Xie, Q.S.; Wang, H. Determination of 12 Ginsenosides in Red Ginseng by High Performance Liquid Chromatography. J. Food Saf. Food Qual. 2021, 12, 175–181. [Google Scholar]
  11. Da, J.; Wang, Q.R.; Wang, Y.; Yao, S.; Huang, Y.; Wei, W.L.; Liang, J.; Shen, Y.; Franz, G.; Guo, D.A. Quantitative Analysis of Eight Ginsenosides in Red Ginseng Using Ginsenoside Rg1 as Single Reference Standard. World J. Tradit. Chin. Med. 2021, 7, 1–5. [Google Scholar] [CrossRef]
  12. Lee, D.H.; Cho, H.J.; Kang, H.Y.; Rhee, M.H.; Park, H.J. Total Saponin from Korean Red Ginseng Inhibits Thromboxane A2 Production Associated Microsomal Enzyme Activity in Platelets. J. Ginseng Res. 2012, 36, 40–46. [Google Scholar] [CrossRef] [PubMed] [Green Version]
  13. Abashev, M.; Stekolshchikova, E.; Stavrianidi, A. Quantitative Aspects of the Hydrolysis of Ginseng Saponins: Application in HPLC-MS Analysis of Herbal Products. J. Ginseng Res. 2021, 45, 246–253. [Google Scholar] [CrossRef]
  14. Jeong, H.C.; Hong, H.D.; Kim, Y.C.; Rhee, Y.K.; Choi, S.Y.; Kim, K.T.; Kim, S.S.; Lee, Y.C.; Cho, C.W. Quantification of Maltol in Korean Ginseng (Panax Ginseng) Products by High-Performance Liquid Chromatography-Diode Array Detector. Pharmacogn. Mag. 2015, 11, 657–664. [Google Scholar] [CrossRef] [Green Version]
  15. In, G.; Ahn, N.G.; Bae, B.S.; Han, S.T.; Noh, K.B.; Kim, C.S. New Method for Simultaneous Quantification of 12 Ginsenosides in Red Ginseng Powder and Extract: In-House Method Validation. J. Ginseng Res. 2012, 36, 205–210. [Google Scholar] [CrossRef] [Green Version]
  16. Zhou, Q.L.; Zhu, D.N.; Yang, X.W.; Xu, W.; Wang, Y.P. Development and Validation of a UFLC-MS/MS Method for Simultaneous Quantification of Sixty-Six Saponins and Their Six Aglycones: Application to Comparative Analysis of Red Ginseng and White Ginseng. J. Pharm. Biomed. Anal. 2018, 159, 153–165. [Google Scholar] [CrossRef]
  17. Kim, I.W.; Cha, K.M.; Wee, J.J.; Ye, M.B.; Kim, S.K. A New Validated Analytical Method for the Quality Control of Red Ginseng Products. J. Ginseng Res. 2013, 37, 475–482. [Google Scholar] [CrossRef] [PubMed] [Green Version]
  18. Lee, J.W.; Ji, S.H.; Choi, B.R.; Choi, D.J.; Lee, Y.G.; Kim, H.G.; Kim, G.S.; Kim, K.; Lee, Y.H.; Baek, N.I.; et al. UPLC-QTOF/MS-Based Metabolomics Applied for the Quality Evaluation of Four Processed Panax ginseng products. Molecules 2018, 23, 2062. [Google Scholar] [CrossRef] [Green Version]
  19. Wu, W.; Sun, L.; Zhang, Z.; Guo, Y.; Liu, S. Profiling and Multivariate Statistical Analysis of Panax Ginseng Based on Ultra-High-Performance Liquid Chromatography Coupled with Quadrupole-Time-of-Flight Mass Spectrometry. J. Pharm. Biomed. Anal. 2015, 107, 141–150. [Google Scholar] [CrossRef] [PubMed]
  20. Qi, B.; Liu, L.; Zhao, D.Q.; Zhao, Y.; Bai, X.Y.; Zhang, H.M.; Guan, Y.Y.; Zhao, S.N. Comparative Study of Sugar Content in Panax Ginseng, P. quinquefolium and Red Ginseng. J. China Pharm. 2013, 24, 616–618. [Google Scholar]
  21. Li, L.; Ma, L.; Guo, Y.; Liu, W.; Wang, Y.; Liu, S. Analysis of Oligosaccharides from Panax Ginseng by Using Solid-Phase Permethylation Method Combined with Ultra-High-Performance Liquid Chromatography-Q-Orbitrap/Mass Spectrometry. J. Ginseng Res. 2020, 44, 775–783. [Google Scholar] [CrossRef]
  22. Lee, S.J.; In, G.; Han, S.T.; Lee, M.H.; Lee, J.W.; Shin, K.S. Structural Characteristics of a Red Ginseng Acidic Polysaccharide Rhamnogalacturonan I with Immunostimulating Activity from Red Ginseng. J. Ginseng Res. 2020, 44, 570–579. [Google Scholar] [CrossRef] [PubMed]
  23. Lee, Y.Y.; Kim, S.W.; Youn, S.H.; Hyun, S.H.; Kyung, J.S.; In, G.; Park, C.K.; Jung, H.R.; Moon, S.J.; Kang, M.J.; et al. Biological Effects of Korean Red Ginseng Polysaccharides in Aged Rat Using Global Proteomic Approach. Molecules 2020, 25, 3019. [Google Scholar] [CrossRef] [PubMed]
  24. Youn, S.H.; Lee, S.M.; Han, C.K.; In, G.; Park, C.K.; Hyun, S.H. Immune Activity of Polysaccharide Fractions Isolated from Korean Red Ginseng. Molecules 2020, 25, 3569. [Google Scholar] [CrossRef] [PubMed]
  25. Park, D.H.; Han, B.; Shin, M.S.; Hwang, G.S. Enhanced Intestinal Immune Response in Mice after Oral Administration of Korea Red Ginseng-Derived Polysaccharide. Polymers 2020, 12, 2186. [Google Scholar] [CrossRef] [PubMed]
  26. Shin, S.J.; Nam, Y.; Park, Y.H.; Kim, M.J.; Lee, E.; Jeon, S.G.; Bae, B.S.; Seo, J.; Shim, S.L.; Kim, J.S.; et al. Therapeutic Effects of Non-Saponin Fraction with Rich Polysaccharide from Korean Red Ginseng on Aging and Alzheimer’s Disease. Free Radic. Biol. Med. 2021, 164, 233–248. [Google Scholar] [CrossRef]
  27. Shin, S.J.; Park, Y.H.; Jeon, S.G.; Kim, S.; Nam, Y.; Oh, S.M.; Lee, Y.Y.; Moon, M. Red Ginseng Inhibits Tau Aggregation and Promotes Tau Dissociation in Vitro. Oxid. Med. Cell. Longev. 2020, 7829842, 1–12. [Google Scholar] [CrossRef] [PubMed]
  28. Wang, J.; Li, J.X.; Zhang, H.Z.; Xu, P.Y.; Chen, Z.Q.; Yan, Y.Y. Ethanol Fractional Purification and Antioxidant Activities of Polysaccharides from Polygonum Cuspidatum. Sci. Technol. Food Ind. 2019, 40, 92–95. [Google Scholar]
  29. Ying, X. Purification and Structural Analysis of Polysaccharides from Red Ginseng; Northeast Normal University: Changchun, China, 2018. [Google Scholar]
  30. Aa, J. Analysis of Metabolomic Data: Principal Component Analysis. Chin. J. Clin. Pharm. Ther. 2010, 15, 481–489. [Google Scholar]
  31. Tai, Y.N.; Wu, X.; Fan, L.M.; Wu, Z.N.; Weng, Y.H.; Lin, Q.Q.; Chu, K.D.; Xie, R.H. Simultaneous Determination of Sixteen Components in Alismatis Rhizoma by UPLC-MS/MS. Chin. J. Pharm. Anal. 2018, 38, 1337–1350. [Google Scholar]
  32. Wu, D.T.; Li, W.Z.; Chen, J.; Zhong, Q.X.; Ju, Y.J.; Zhao, J.; Anton, B.; Li, S.P. An Evaluation System for Characterization of Polysaccharides from the Fruiting Body of Hericium Erinaceus and Identification of ITS Commercial Product. Carbohydr. Polym. 2015, 124, 201–207. [Google Scholar] [CrossRef]
  33. Xia, Y.G.; Yu, L.S.; Liang, J.; Yang, B.Y.; Kuang, H.X. Chromatography and Mass Spectrometry-Based Approaches for Perception of Polysaccharides in wild and Cultured Fruit Bodies of Auricularia Auricular-Judae. Int. J. Biol. Macromol. 2019, 137, 1232–1244. [Google Scholar] [CrossRef] [PubMed]
  34. Cheong, K.L.; Wu, D.T.; Deng, Y.; Leong, F.; Zhao, J.; Zhang, W.J.; Li, S.P. Qualitation and Quantification of Specific Polysaccharides From Panax Species Using GC-MS, Saccharide Mapping and HPSEC-RID-MALLS. Carbohydr. Polym. 2016, 153, 47–54. [Google Scholar] [CrossRef] [PubMed]
  35. Lv, P.; Yu, S.Q.; Zhang, F.; Xiao, L.; Nie, J. Determination and PCA Analysis of 10 Chemical Components in Chysanthemi Flos by UPLC-UV. China Pharm. 2018, 21, 1374–1378. [Google Scholar]
Figure 1. HPLC–ELSD chromatograms of blank solvent, mixed references (A) RG sample; (B) PCA of RG samples from different origins; (C) 1, sucrose; 2, maltose.
Separations 08 00198 g001
Figure 2. HPSEC–MALLS–RID chromatogram of RG polysaccharides sample.
Separations 08 00198 g002
Figure 3. HPLC–PDA chromatograms of PMP derivatized blank solvent (A), mixed reference (B), RG polysaccharide hydrolysates (C); PCA (D) and cluster analysis (E) results of RG polysaccharide’s Scheme 1. mannose; 2, galacturonic acid; 3, glucose; 4, galactose; 5, arabinose.
Separations 08 00198 g003
Table 1. Results of determination of sucrose and maltose in RG.
LocalitiesSucrose (mg/g)Maltose (mg/g)
Jilin Tonghua50.37186.12
Liaoning Xinbin57.8992.02
Liaoning Huanren56.29162.39
Jilin Jingyu70.78145.96
Jilin Huichun52.46172.92
Jilin Antu70.07179.93
Jilin Fusong78.22155.05
Jilin Dunhua84.10194.62
Table 2. Results of molecular weight determination of RG polysaccharides.
LocalitiesMw a (kDa) and
Error of Peak 1
Mw/Mn b and Error
of Peak 1
Mw (kDa) and
Error of Peak 2
Mw/Mn and Error
of Peak 2
Jilin Tonghua2996.6 (±1.2%)2.943 (±1.584%)235.9 (±2.0%)1.027 (±2.900%)
Liaoning Xinbin3708.5 (±1.3%)2.886 (±1.679%)322.0 (±1.8%)1.019 (±2.546%)
Liaoning Huanren3502.4 (±1.5%)3.158 (±2.097%)126.3 (±7.6%)- c
Jilin Jingyu785.1 (±1.9%)3.577 (±5.558%)18.7 (±9.2%)-
Jilin Huichun3157.7 (±1.1%)3.187 (±1.305%)238.0 (±1.2%)1.020 (±1.681%)
Jilin Antu3809.1 (±1.3%)2.532 (±1.645%)475.2 (±1.7%)1.016 (±2.417%)
Jilin Fusong2351.0 (±1.3%)3.299 (±1.779%)81.4 (±4.6%)-
Jilin Dunhua2463.4 (±1.3%)3.147 (±1.978%)83.9 (±6.4%)-
a Mw: molecular weight. b Mw/Mn: molecular weight distribution coefficient of polymer. c “-”means uncertainty.
Table 3. Results of composition determination of RG polysaccharide.
LocalitiesGlucose (mg/mL)Galactose (mg/mL)Arabinose (mg/mL)
Jilin Tonghua1.09990.05090.0410
Liaoning Xinbin0.78160.05190.0382
Liaoning Huanren0.98760.05480.0430
Jilin Jingyu1.16360.06640.0497
Jilin Huichun0.98330.04100.0314
Jilin Antu0.88390.04540.0302
Jilin Fusong1.05530.05420.0396
Jilin Dunhua1.03660.05530.0426
Publisher’s Note: MDPI stays neutral with regard to jurisdictional claims in published maps and institutional affiliations.

