Article

Separation and Purification of ω-6 Linoleic Acid from Crude Tall Oil

Biorefining Research Institute, Lakehead University, 1294 Balmoral Street, Thunder Bay, ON P7B 5Z5, Canada
*
Author to whom correspondence should be addressed.
Separations 2020, 7(1), 9; https://doi.org/10.3390/separations7010009
Submission received: 28 November 2019 / Revised: 28 December 2019 / Accepted: 22 January 2020 / Published: 2 February 2020

Abstract

:
Crude tall oil (CTO) is the third largest by-product at kraft pulp and paper mills. Due the large presence of value-added fatty and resin acids, CTO has a huge valorization potential as a biobased, readily available, non-food, and low-cost biorefinery feedstock. The objective of this work was to present a method for the isolation of high-value linoleic acid (LA), an omega (ω)-6 essential fatty acid, from CTO using a combination of pretreatment, fractionation, and purification techniques. Following the distillation of CTO to separate the tall oil fatty acids (TOFAs) from CTO, LA was isolated and purified from TOFAs by urea complexation (UC) and low-temperature crystallization (LTC) in the temperature range between −7 and −15 °C. The crystallization yield of LA from CTO in that range was 7.8 w/w at 95.2% purity, with 3.8% w/w of ω-6 γ-linolenic acid (GLA) and 1.0% w/w of ω-3 α-linolenic (ALA) present as contaminants. This is the first report on the isolation of LA from CTO. The approach presented here can be applied to recover other valuable fatty acids. Furthermore, once the targeted fatty acid(s) are isolated, the rest of the TOFAs can be utilized for the production of biodiesel, biobased surfactants, or other valuable bioproducts.

Graphical Abstract

1. Introduction

The pulp and paper industry has joined the global movement toward cleaner and greener products in their effort to transition to forest biorefineries. This transition is based on the circular bioeconomy concept, which implies the most efficient recycling of wastes, co-products, and residues as a strategy to preserve our bio-based resources and minimize the use of fossil fuel-derived products of environmental concern. As bio-based fuels and products are carbon-neutral, they do not result in net green-house gas (GHG) emissions due to the balance between CO2 emitted and CO2 trapped back by biomass.
After lignin and hemicellulose, CTO is the third largest chemical by-product in a kraft pulp and paper mill, with a yield from highly resinous coniferous species in the range of 30–50 kg per ton pulp [1]. CTO is extracted from the partially concentrated black liquor, derived from kraft pulping of softwoods, by skimming off the kraft oil soap. CTO has a complex composition of saponified fatty acids (30–60%), resin acids (40–60%), and unsaponifiables (5–10%) [2]. However, the exact yield and composition of CTO depend on a number of factors such as pulping conditions, wood species, and their length of storage prior to pulping, geographical location, climate conditions, etc. [3]. If not used internally as a lime kiln hoq fuel, mills most commonly sell CTO at a profit of 1–1.5% of their total revenue to chemical companies for further refining to various products. For example, CTO is applied in producing metal-working fluids for metal-rolling and metal-working operations, in producing drill fluids and separating fluids for the concrete products industry as well as to obtain corrosion inhibitors [4]. The TOFAs are primarily used in the production of soaps, detergents, paints, coatings, plastic additives, fuel additives, lubricants, and adhesives [5,6,7,8,9,10]. Alkyd resins account for the largest demand among all intermediates manufactured from TOFAs, whereas soaps, detergents, and coatings hold the largest market share of TOFAs in terms of volume. More recently, TOFAs have been investigated for the production of biofuels including drop-in hydrocarbon fuels [11] and biodiesel [12,13] The market for TOFAs is expected to reach USD 1 billion in 2022 [14]. In the U.S., CTO has a floor price the equivalent of the value of natural gas as CTO can be used as a substitute to fossil fuels as a pulp mill lime kiln process fuel. The current global annual production of CTO is approximately 1.8–2 million tons (t), however, the 320 chemical pulp mills worldwide have the potential to produce 2.6 million t per year [15]. About 65% of the total CTO production is concentrated in North America. In Canada, 12 kraft mills currently generate 75,000 t CTO, whereas in the U.S., two thirds of the TOFA supplied to the chemical industry are derived from CTO, with another 100,000 t of CTO expected to become available by 2020 [16].
The main TOFAs in CTO are LA (C18:2n6) (Figure 1), oleic acid (C18:1), GLA (C18:3n6), and palmitic acid (C16:0) [17]. Typically, the TOFAs consist of 75–85% unsaturated fatty acids (UFAs), mainly polyunsaturated fatty acids (PUFAs), with LA comprising about half the total TOFAs [13,18]. LA is an 18 carbon polyunsaturated fatty acid with the two double bonds at C9 and C12 in a cis-configuration (all-cis-9,12-octadecadienoic acid) (Figure 1). LA is denoted as an omega (ω)-6 fatty acid and together with ALA ω-3 acid (18:3n3) (Figure 1) form the two essential fatty acids that mammals (humans and animals) cannot synthesize and must be acquired through their diet. Another ω-6 fatty acid of health importance is GLA (18:3n6), which is classified as a conditionally essential fatty acid that can become essential under developmental or disease conditions (Figure 1). LA as an essential fatty acid plays an important role in metabolic processes related to human health and nutrition, and may be a factor in a number of degenerative illnesses such as cancer, atherosclerosis, osteoporosis, and cardiovascular disease [19,20,21]. Nowadays, the public awareness of the nutritional and health benefits of LA is growing, and the market demand is expected to rise in the future. Aside from its health benefits, LA is used in making oil paints and varnishes, in cosmetics, and as a surfactant [22,23]. Sources of LA include fish and shellfish, vegetable oils, nuts, and seeds. However, most of these sources are food-based, seasonal, of limited availability, and fairly expensive. In addition, fish may be contaminated with methyl mercury and lead, which are heavy metals with high environmental and human toxicity [24].
Despite the well-documented uses of LA and the growing markets for CTO and TOFAs, there are no reports on the isolation of LA from CTO to date. LA has mainly been extracted from vegetable oil seeds by applying extraction techniques such as supercritical CO2 [25,26], cold pressing alone, and in conjunction with enzymatic extraction and/or solvent extraction [27,28,29]. For example, Mario et al. [27] extracted 62% of LA from sunflower seeds using a single screw extruder, whereas cold pressing of oil seeds followed by extraction with iso-hexane was used to separate LA from other UFAs [29].
The objective of this work was to present a method for the isolation of LA from CTO, an alternative, readily available, non-food, and low-cost feedstock by using a combination of fractionation, separation, and purification techniques. Following fractional distillation of CTO to the major CTO components, the LA in TOFAs was separated by UC and LTC. The approach presented here can be applied to the isolation of other essential fatty acids such as ω-3 ALA and ω-6 GLA. Furthermore, once the targeted fatty acid(s) are isolated, the rest of the TOFAs including the remaining PUFAs, saturated fatty acids (SFAs), and monounsaturated fatty acids (MUFAs) can be utilized for the production of biodiesel, biobased surfactants, or other value-added bioproducts (Figure 2).

2. Materials and Methods

2.1. Materials

CTO was sourced from a pulp and paper mill in Canada and stored in a refrigerator at a temperature below 4 °C until use. Urea, ethanol, hexane (ACS grade), LA, sodium chloride, sodium hydrogen carbonate, methanol, and acetone (HPLC-grade) were purchased from Sigma-Aldrich (Oakville, ON, Canada). Sulfuric acid (99.9%) was obtained from Fisher Scientific (Ottawa, ON, Canada).

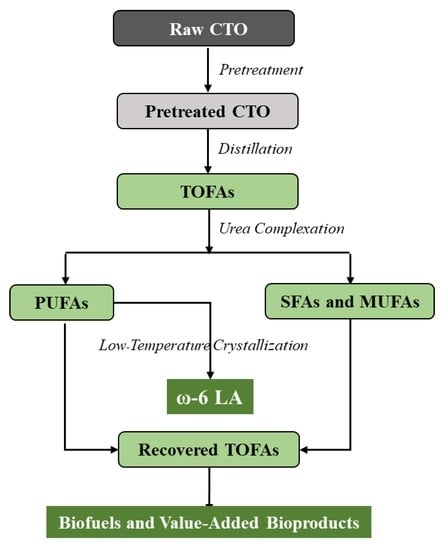
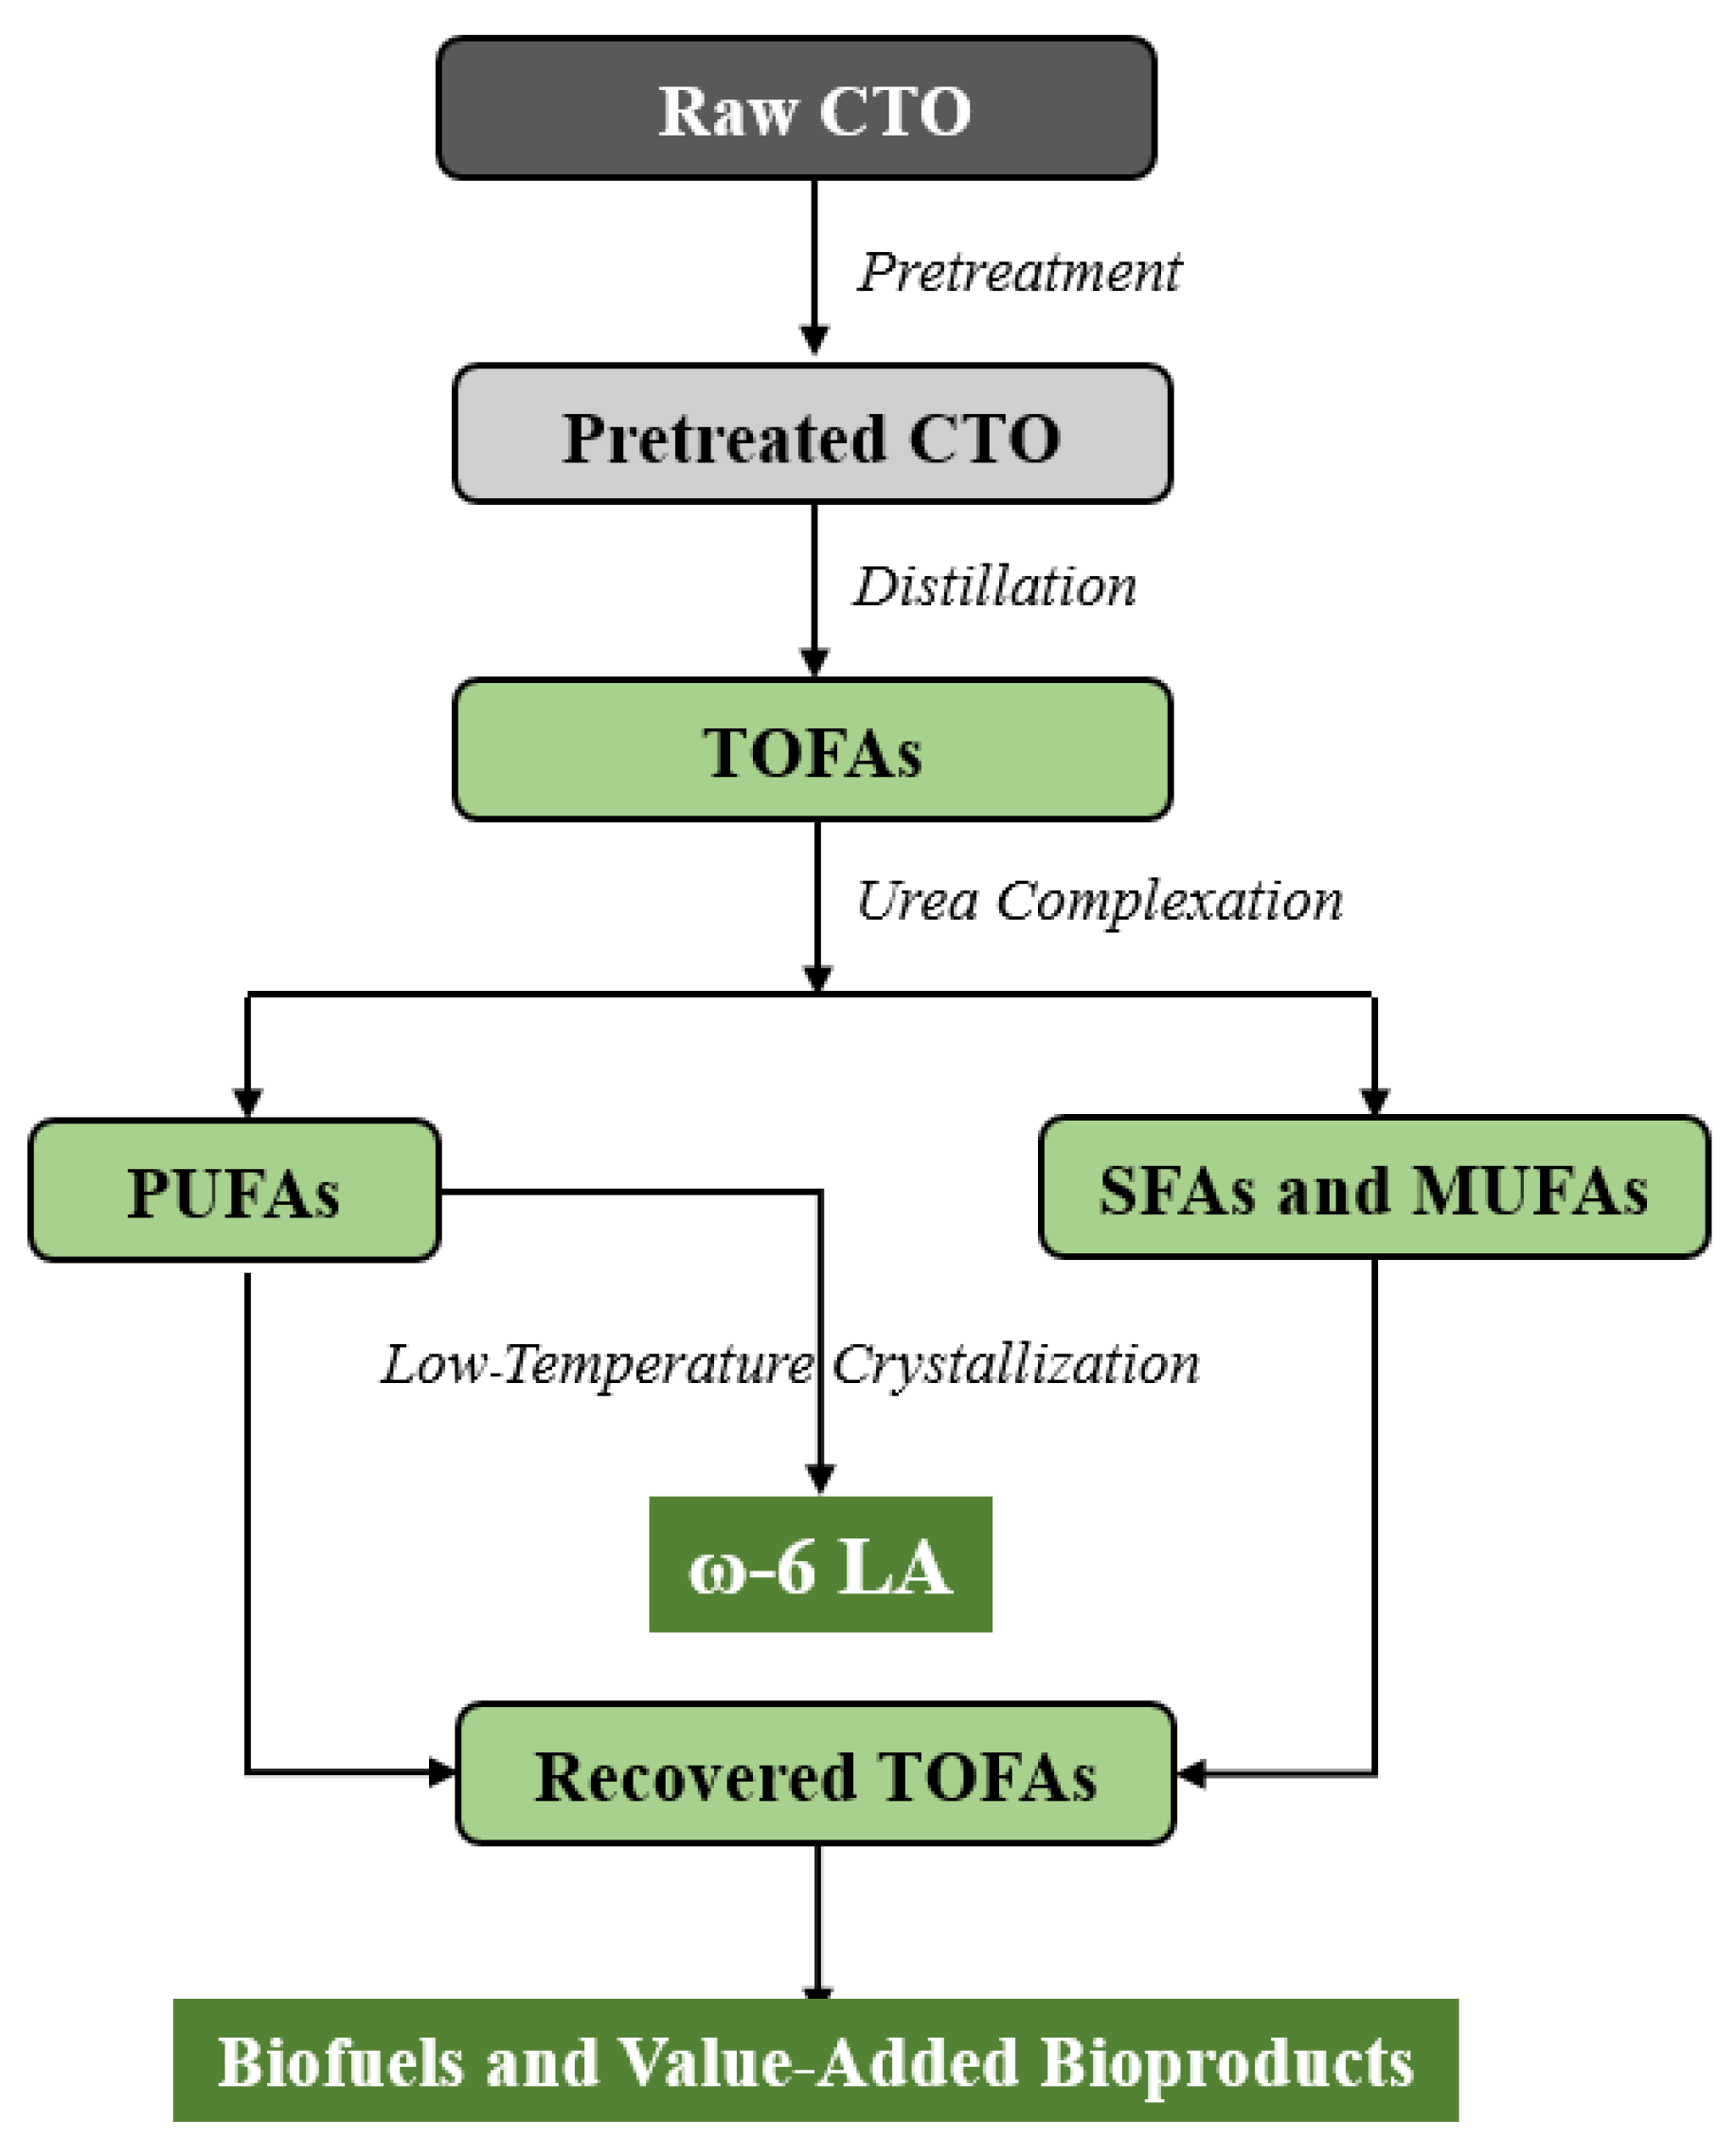
2.2. CTO Pretreatment

Prior to distillation, CTO was pretreated with 1% w/v NaCl solution to remove any unwanted impurities from the raw CTO (residual pulping chemicals, sulfuric acid, etc.) that may affect the distillation process. A total of 40% v/v of a 1% w/v NaCl solution and 60% v/v of raw CTO were vigorously mixed together in a separating funnel for 10 min. Two distinct layers were formed: a bottom layer of aqueous salt solution containing dust matters, and a top layer of non-aqueous CTO. The aqueous bottom layer was discarded whereas the upper layer was centrifuged (Sorvall RT1 Centrifuge, ThermoFisher Scientific, Germany) at 10,000 rpm for 10 min. The yield of the pretreated CTO was 93% w/w.

2.3. CTO Distillation

The pretreated CTO was then subjected to fractional distillation to separate the TOFA from the rest of the CTO components. A 5000 mL round-bottom flask containing 200 g of pretreated CTO was placed on a heating mantle and covered with glass wool to prevent heat dissipation. The temperature was controlled at 130–265 °C with a temperature sensor that was introduced from the top of the flask. A vacuum pressure of 10 mm Hg was maintained in the flask by air compressor (Vaccuubrand, Model-MZ2CNT, Werthelm, Germany). The fatty acid vapors that were produced under the above temperature and pressure conditions were collected in a condenser. The TOFA composition was analyzed by HPLC as described in Section 2.6.

2.4. UC of PUFAs

UC was employed to separate the PUFAs from the SFAs and MUFAs [30,31]. Ethanoic urea was used at a ratio of ethanol:urea of 96:4. The TOFAs were mixed with the ethanoic:urea solution at a 20:80 volume ratio. The mixture was kept at 60 °C and stirred until a clear homogeneous solution was formed. Next, this solution was kept at room temperature until urea crystals precipitated. The crystals settled at the bottom, while the PUFAs remained soluble in the ethanol solution. The precipitate was filtered with a Buchner funnel using 70 mm (𝜙) Whatman filter paper. The filtrate containing the PUFAs was dried at 60 °C to remove the ethanol. The solid UC residue, retained on the Buchner funnel, was extracted with hexane to recover the fraction of SFAs and MUFAs, and with water to solubilize the urea. The residual SFAs and MUFAs can be used for biodiesel production, whereas the urea can be recycled in the UC process.

2.5. PUFAs Separation by LTC

A 5 g sample of PUFAs was mixed with 45 g acetone. The temperature of crystallization of the resultant acetone-PUFAs mixtures was monitored in the temperature range from −30 °C to 4 °C (Table 1). Before collection, each PUFA-acetone fraction (A–E) was kept for 24 h at the temperature indicated in Table 1. Thereafter, fractions were centrifuged at 4100 rpm for 7.5 min. The crystallized portion of each fraction was filtered out from the remaining liquid solution whereas acetone was recovered by evaporation and recycled in the LTC process.

2.6. TOFA Identification and Quantification

2.6.1. High-performance liquid chromatography (HPLC) Analysis

Each LTC fraction (A–E) was analyzed using high-performance liquid chromatography (HPLC) with an Agilent Technology 1260 Infinity Series equipped with a refractive index (RI) detector, and a C18 main column (ZORBAX Eclipse XDB-C18, 4.6 × 150 mm, 5 μm). In a 2 mL vial, 100 μL of each fraction and 900 μL of HPLC-grade hexane were mixed, and then 10 μL of sample was automatically injected into the HPLC. The mobile phase was 100% ACS-grade hexane, the column temperature was set at 50 °C, and the flow rate was fixed at 0.8 mL/min. The total processing time through the column was 20 min. The results from the HPLC-RI detector were sent to a PC-controlled data acquisition system for analysis.

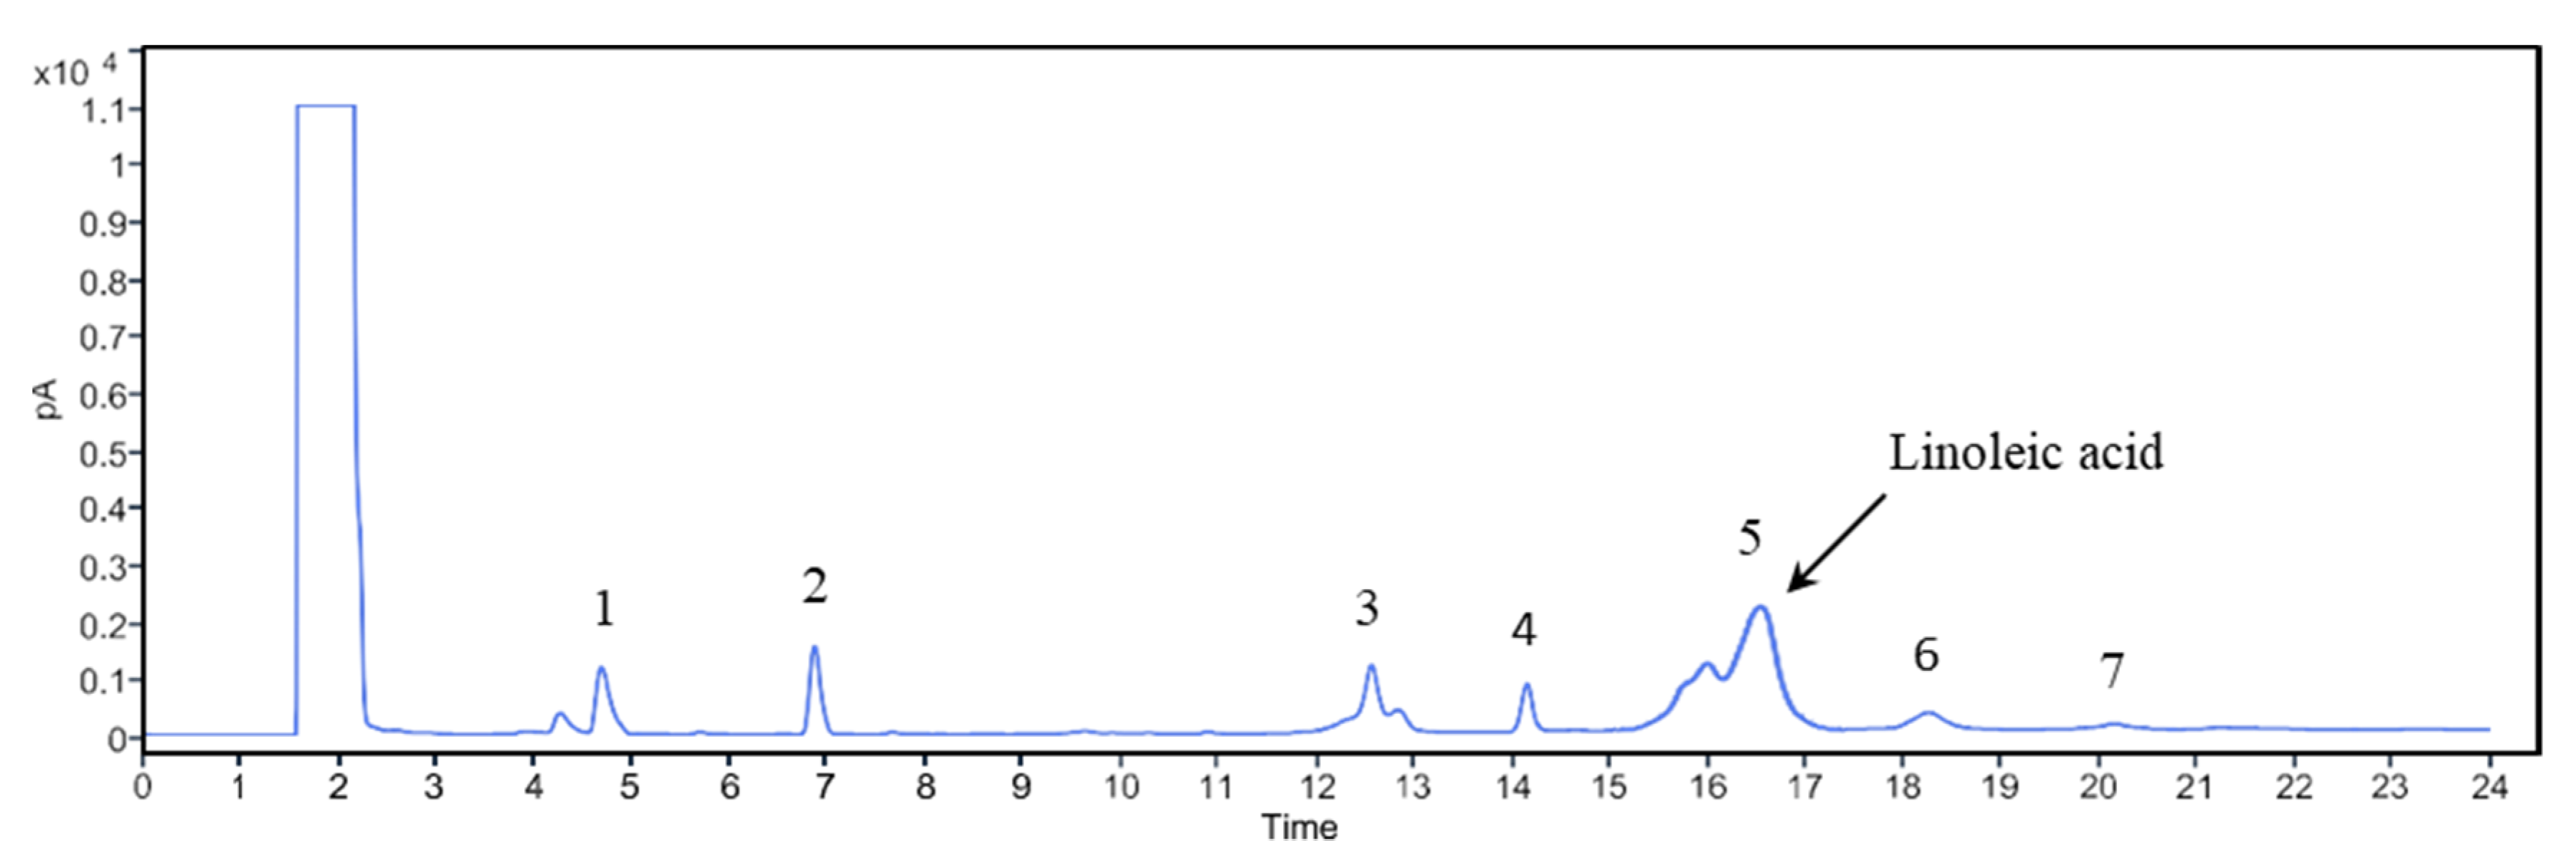
2.6.2. Gas chromatography (GC) Analysis

The HPLC results from fraction C (Table 1) were verified using gas chromatography (GC) (Model 6850, Agilent Technologies) equipped with a HP-FFAP column (25 m). In a 2 mL vial, 200 μL of the fraction and 800 μL of isopropyl alcohol were mixed together and then a 20 μL sample was injected manually into the GC. The total time through the column was 24 min. The temperature was increased at 20 °C/min up to 240 °C, and then held at 240 °C for the remainder of the analysis. The outputs were collected by a computer-controlled data acquisition system and the output signal was integrated manually.

3. Results and Discussion

3.1. CTO Pretreatment and TOFAs Separation

CTO is extracted from the spent kraft pulping liquor (black liquor) in three processing steps: (1) black liquor is first partially concentrated to 20–30% solids w/v and allowed to settle; (2) the top layer of the partially concentrated black liquor, known as tall oil soap, is skimmed off; and (3) the tall oil soap is acidified with sulfuric acid to form CTO and remove impurities such as sodium salts, dissolved lignin, unreacted soap or acid, residual pulping chemicals, etc. [4]. However, some impurities (0.2–0.4% w/v) still remain in CTO, which affects its further processing [32,33]. For this reason, a pretreatment step with 1% w/v NaCl was applied to CTO prior to fractional distillation. Due to its salting-out effect, NaCl increases the polarity of the water molecules, which facilitates the separation of the hydrophobic dust particles from CTO [32]. Due to the lower density of CTO of 700–870 kg/m3 at 25 °C [34] than water (997 kg/m3), CTO formed a top layer and was collected for distillation, whereas the aqueous bottom layer containing most of the CTO impurities was removed. The yield of the pretreated CTO from the raw CTO was 93% w/w.
Although the TOFA boiling points at 10 mm Hg were all between 210 °C and 230 °C, a broader temperature range (130–265 °C) was used for distillation to ensure a more complete recovery of all TOFAs. As we reported previously [13], the TOFA content in CTO was 53.4% w/w. After distillation, the yield of the collected TOFA fraction was 48% w/w, which represented a 89.9% recovery of all TOFAs contained in CTO. Increasing the temperature above 265 °C resulted in the co-distillation of resin acids, which complicated the LA purification process and was therefore undesirable for the purpose of this investigation.
Figure 3 represents the GC chromatogram of the TOFA composition. Due to the high polarity of the column (HP-FFAP), the most polar ALA containing three double bonds (Figure 1) was eluted last. Compared to ALA, LA has two double bonds (Figure 1), which makes it less polar, hence, LA was detected at a retention time (RT) of 15.5 min. Palmitic acid has no double bonds (C16:0), and as the least polar TOFA, it eluted first. It is well known that the presence of double bonds increases the polarity of compounds [35]. In addition, alkanes have only 25% of ‘s’ character in their sp hybridization compared to 33% of the ‘s’ character of alkenes, which makes alkanes less polar than alkenes [36].
Table 2 presents the composition of TOFAs as extracted from CTO. LA comprised almost half the total TOFAs with 42.6% w/w, followed by stearic and palmitic acid. These results confirm previous findings. For example, TOFAs from Farmchem Oy (Finland) contained 49% w/w LA [18]. CTO from Stora Enzo Oyj Mills (Finland) contained 19.1% w/w LA corresponding to 40% w/w LA in the TOFA fraction of CTO [37], and in another report, 27.6% of CTO [38]. Based on the high content and the high value of this ω-6 essential fatty acid, it was decided to isolate LA from the rest of the TOFAs.

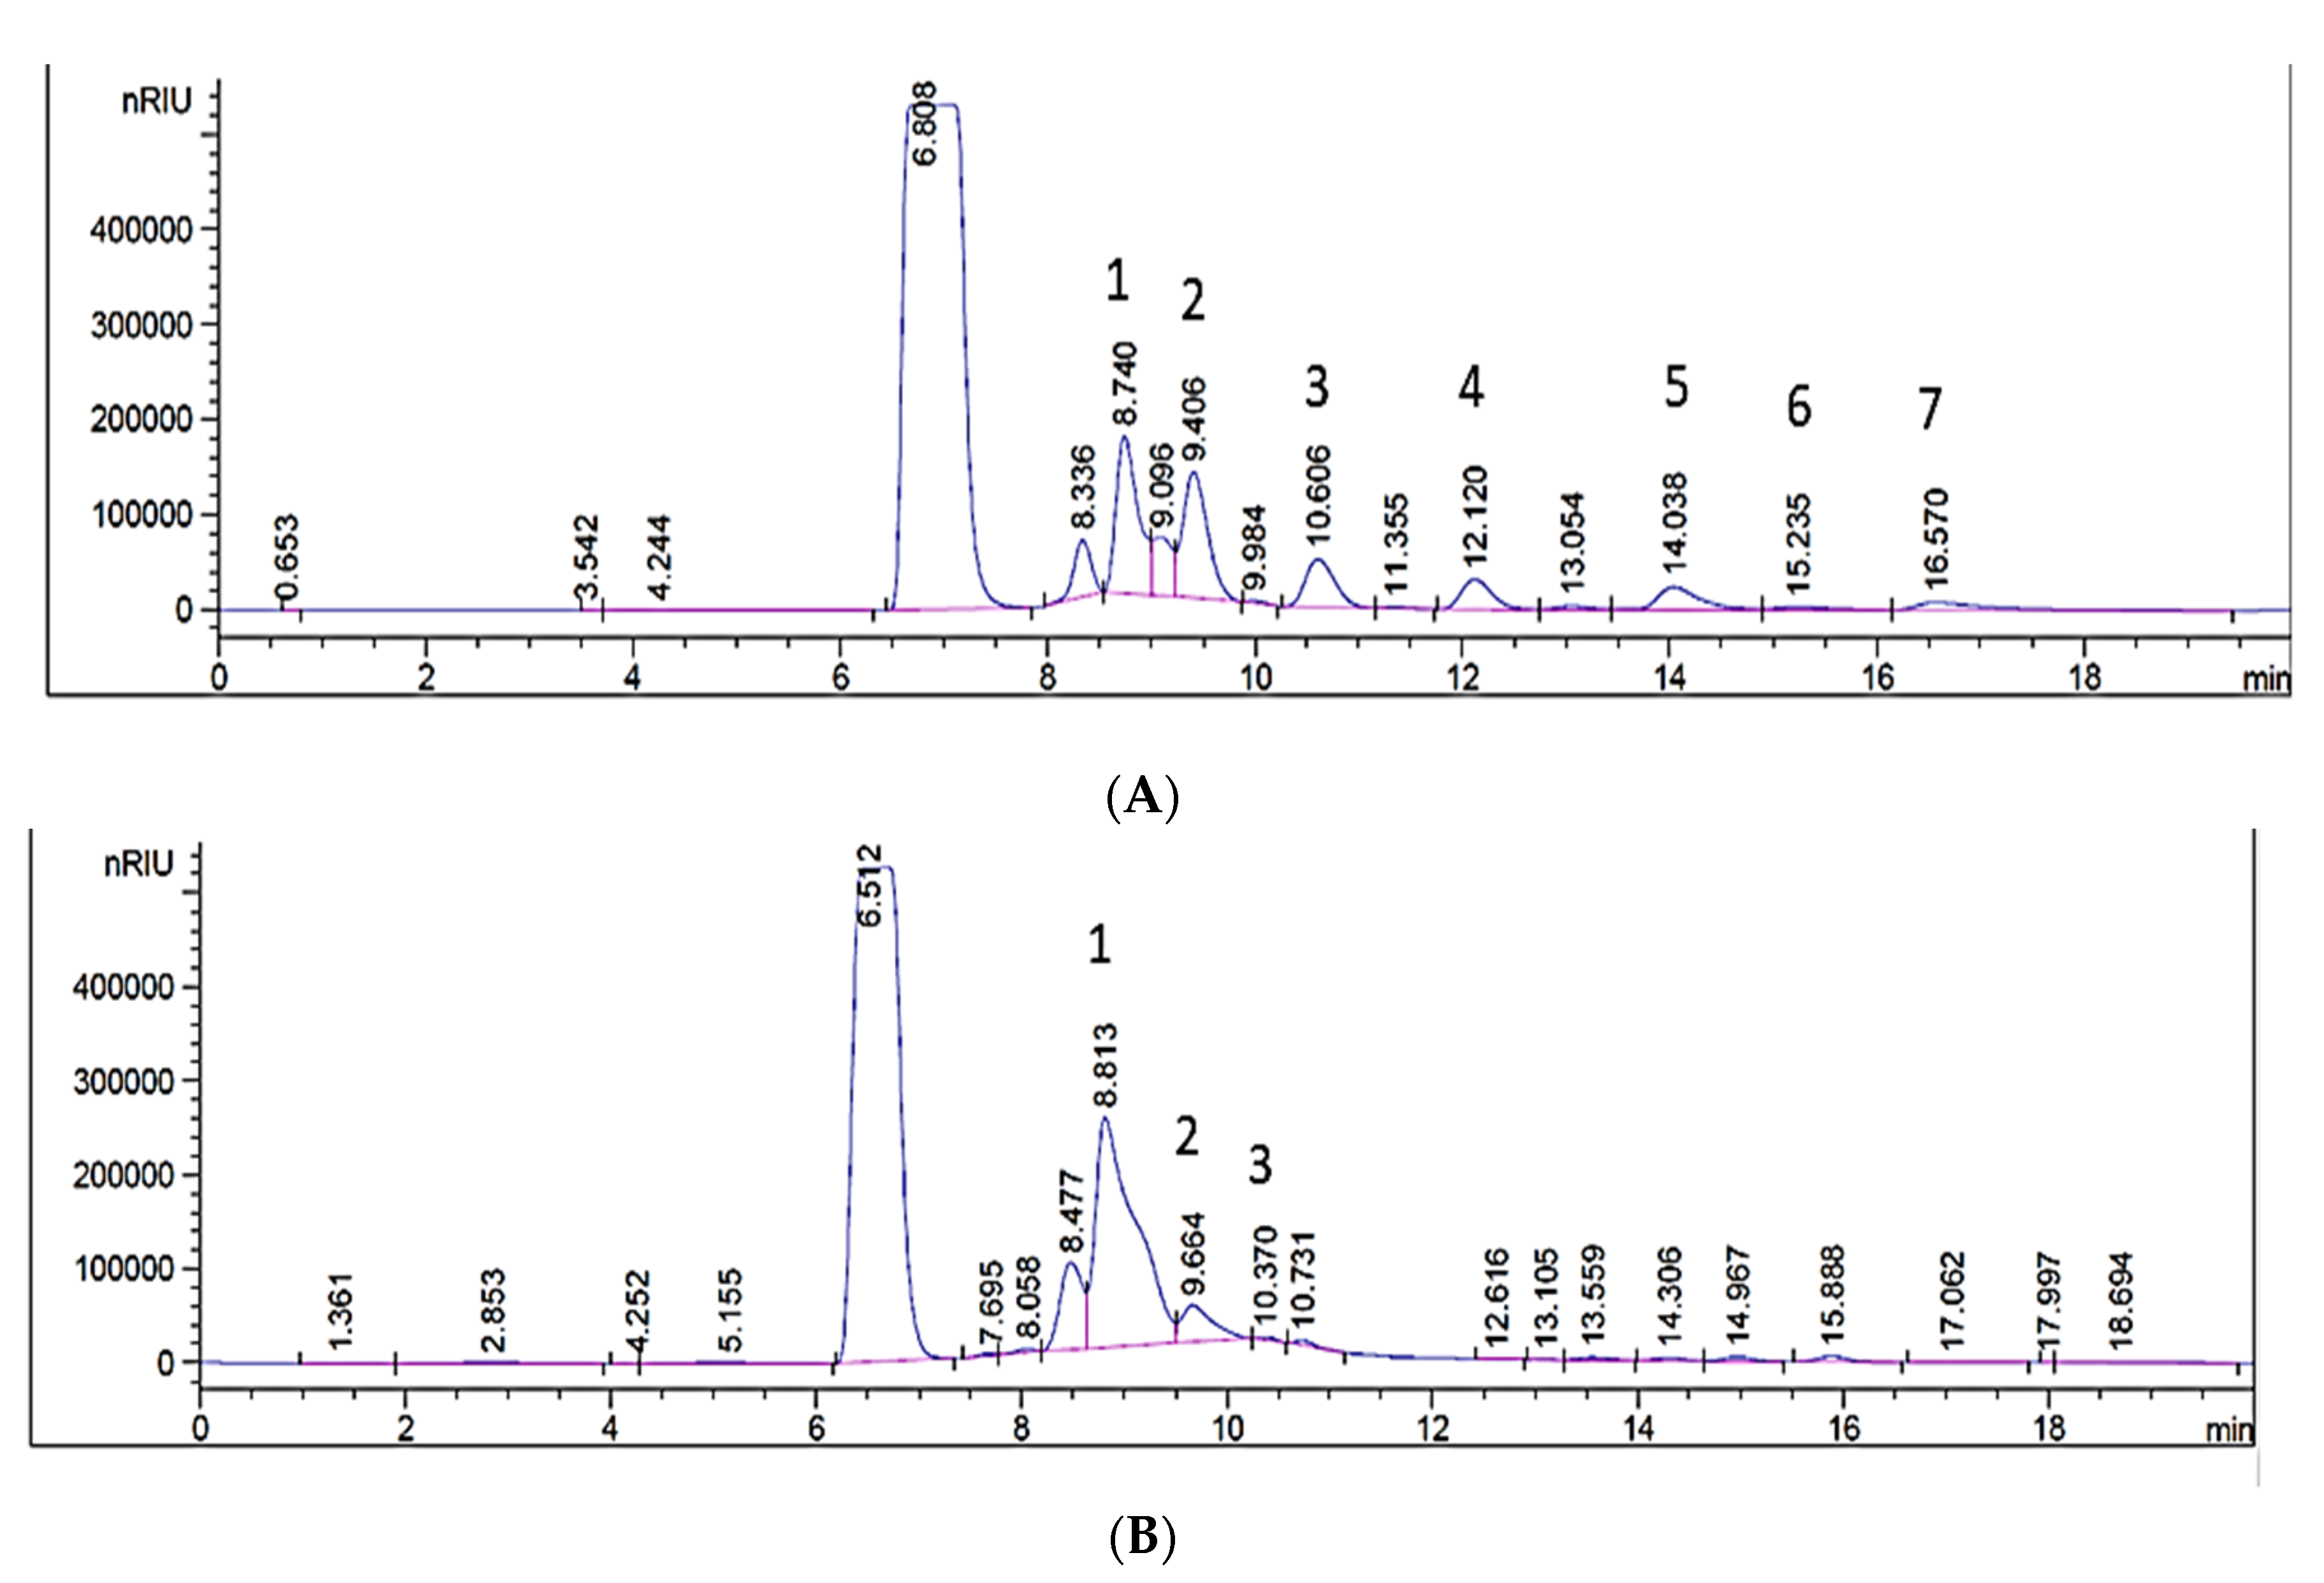
3.2. Separation of PUFAs

The PUFAs were separated from the rest of the TOFAs by UC [30]. In this method, the SFAs and MUFAs create a physical complex with urea whereas the PUFAs remain unbound. SFAs like palmitic and stearic acid and MUFAs such as palmitoleic and oleic acid form a hexagonal crystal structure with urea at 8–12 °A. Due to the presence of multiple double bonds, however, the PUFAs including LA, ALA, and GLA twist to form compacted tetragonal structures that are bulky in space, which prevents their complexation with urea. As a result, the non-complexed PUFAs remain in solution, whereas the urea-complexed SFAs and MUFAs precipitate. The urea-complexed SFAs and MUFAs were separated from the PUFAs by filtration. The filtrate containing PUFAs was collected and analyzed by HPLC. The RT of the TOFAs before and after UC complexation are shown in Table 2. Figure 4 presents the HPLC chromatograms of the TOFAs before and after UC. It can be seen from Figure 4B and Table 3 that after UC, only PUFAs were detected in the mixture, which is indicative of a successful separation. The small fluctuations in the RT may be because of variations in the operational parameters such as temperature variation of the solvent in the stationary phase, elution solvent composition, or concentration of the samples in the mixture.

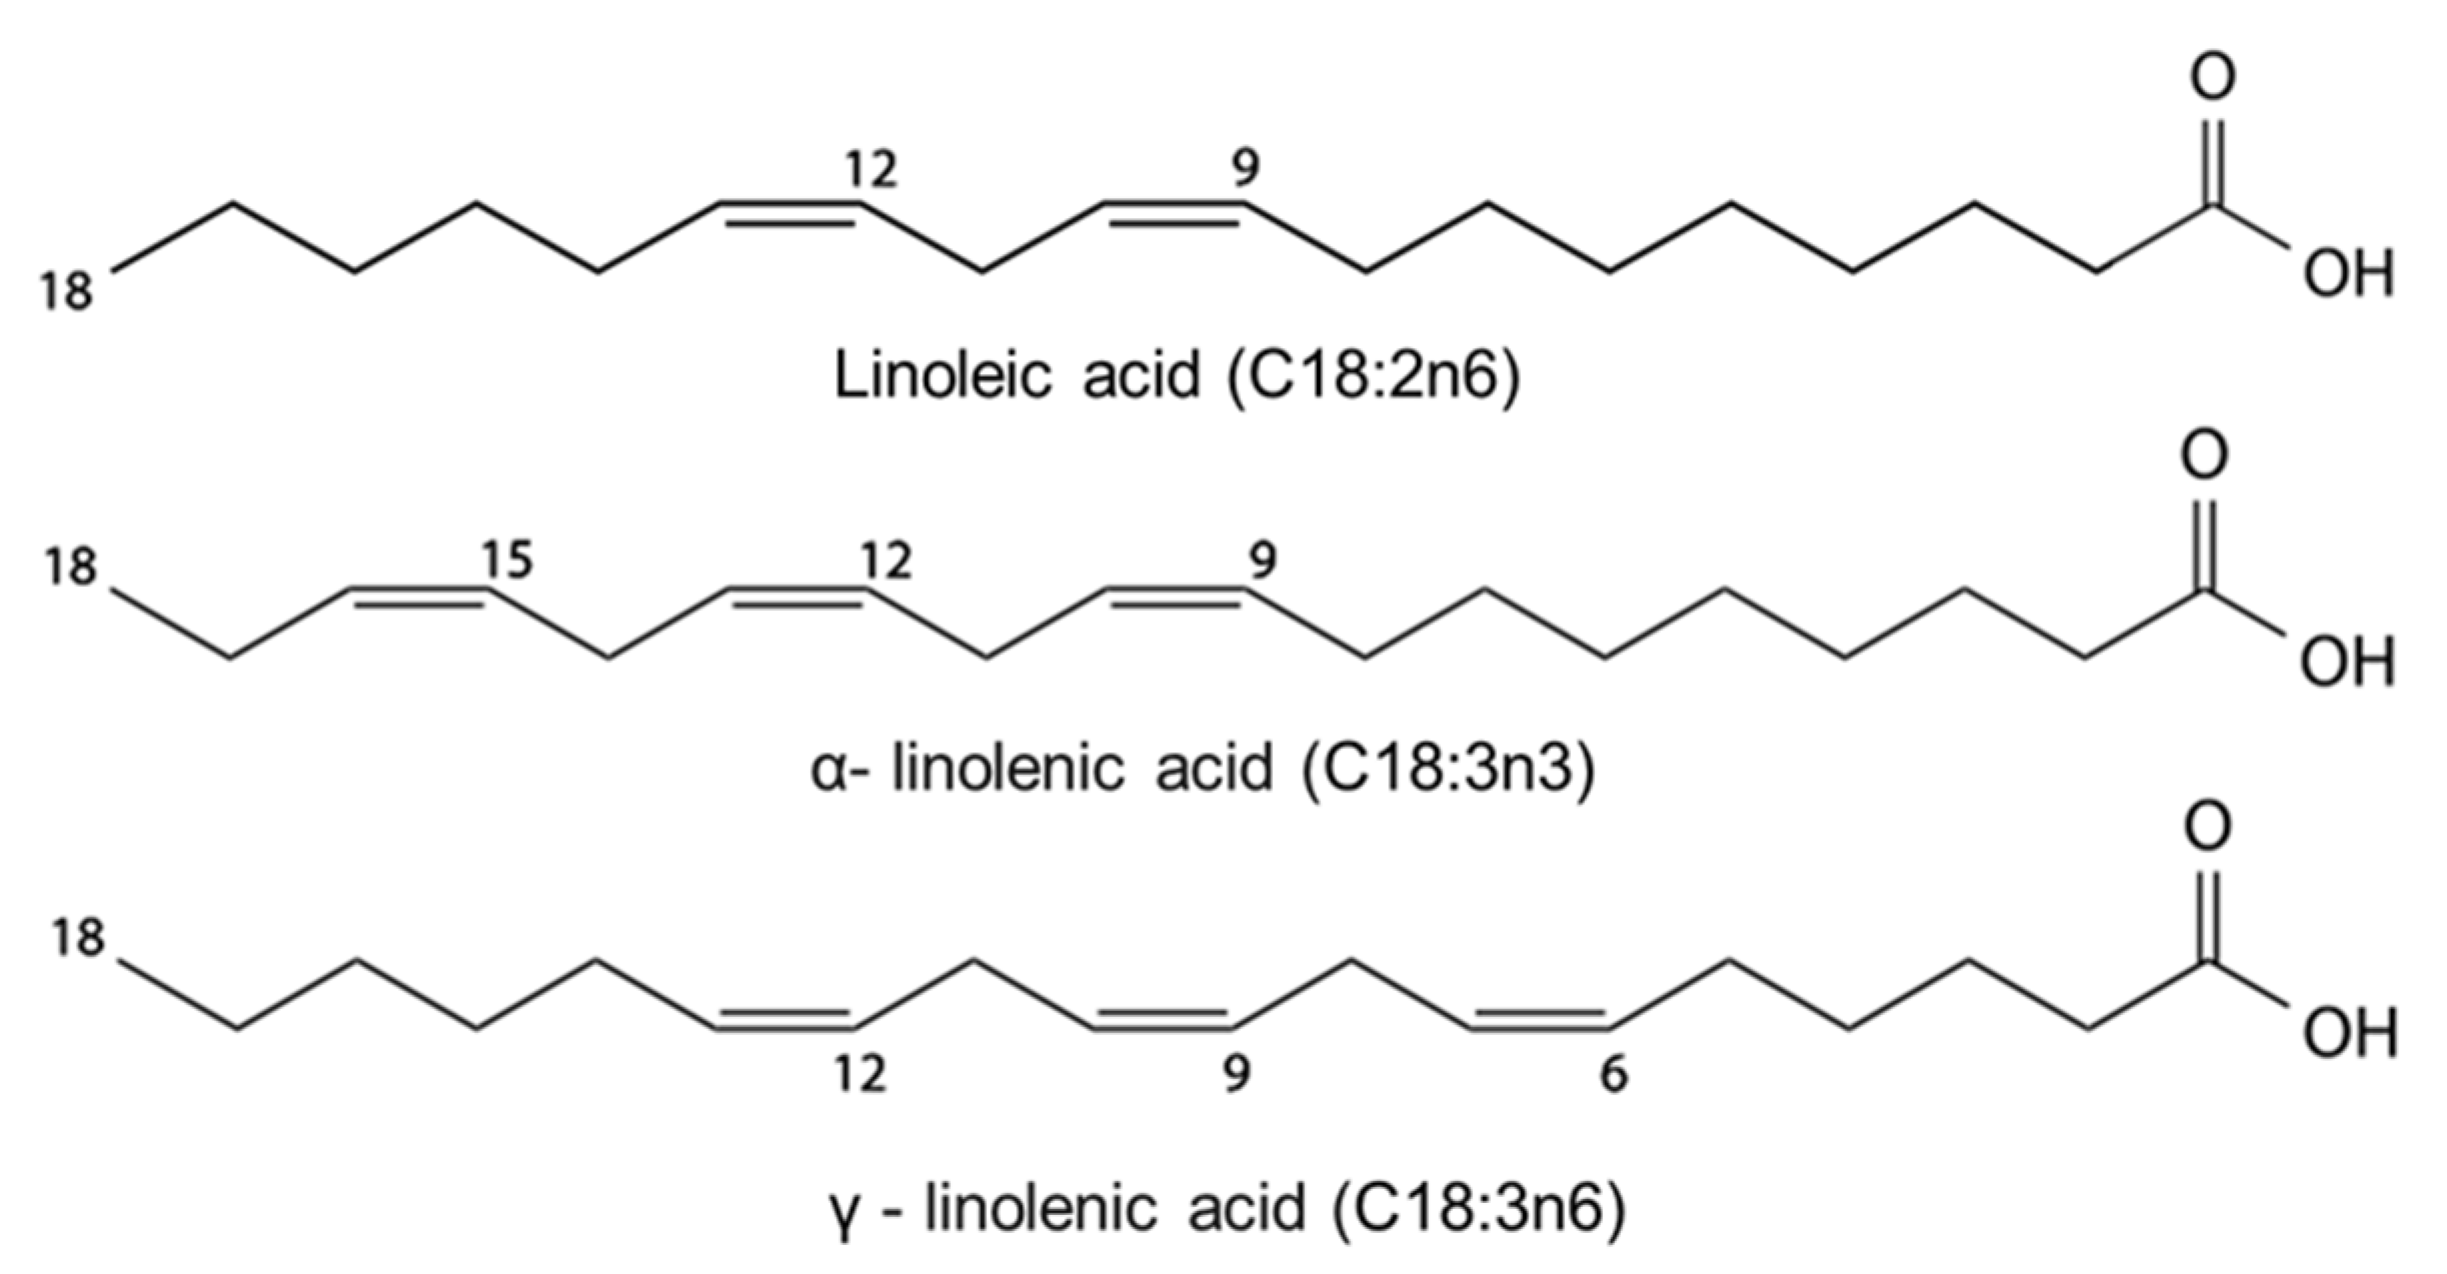
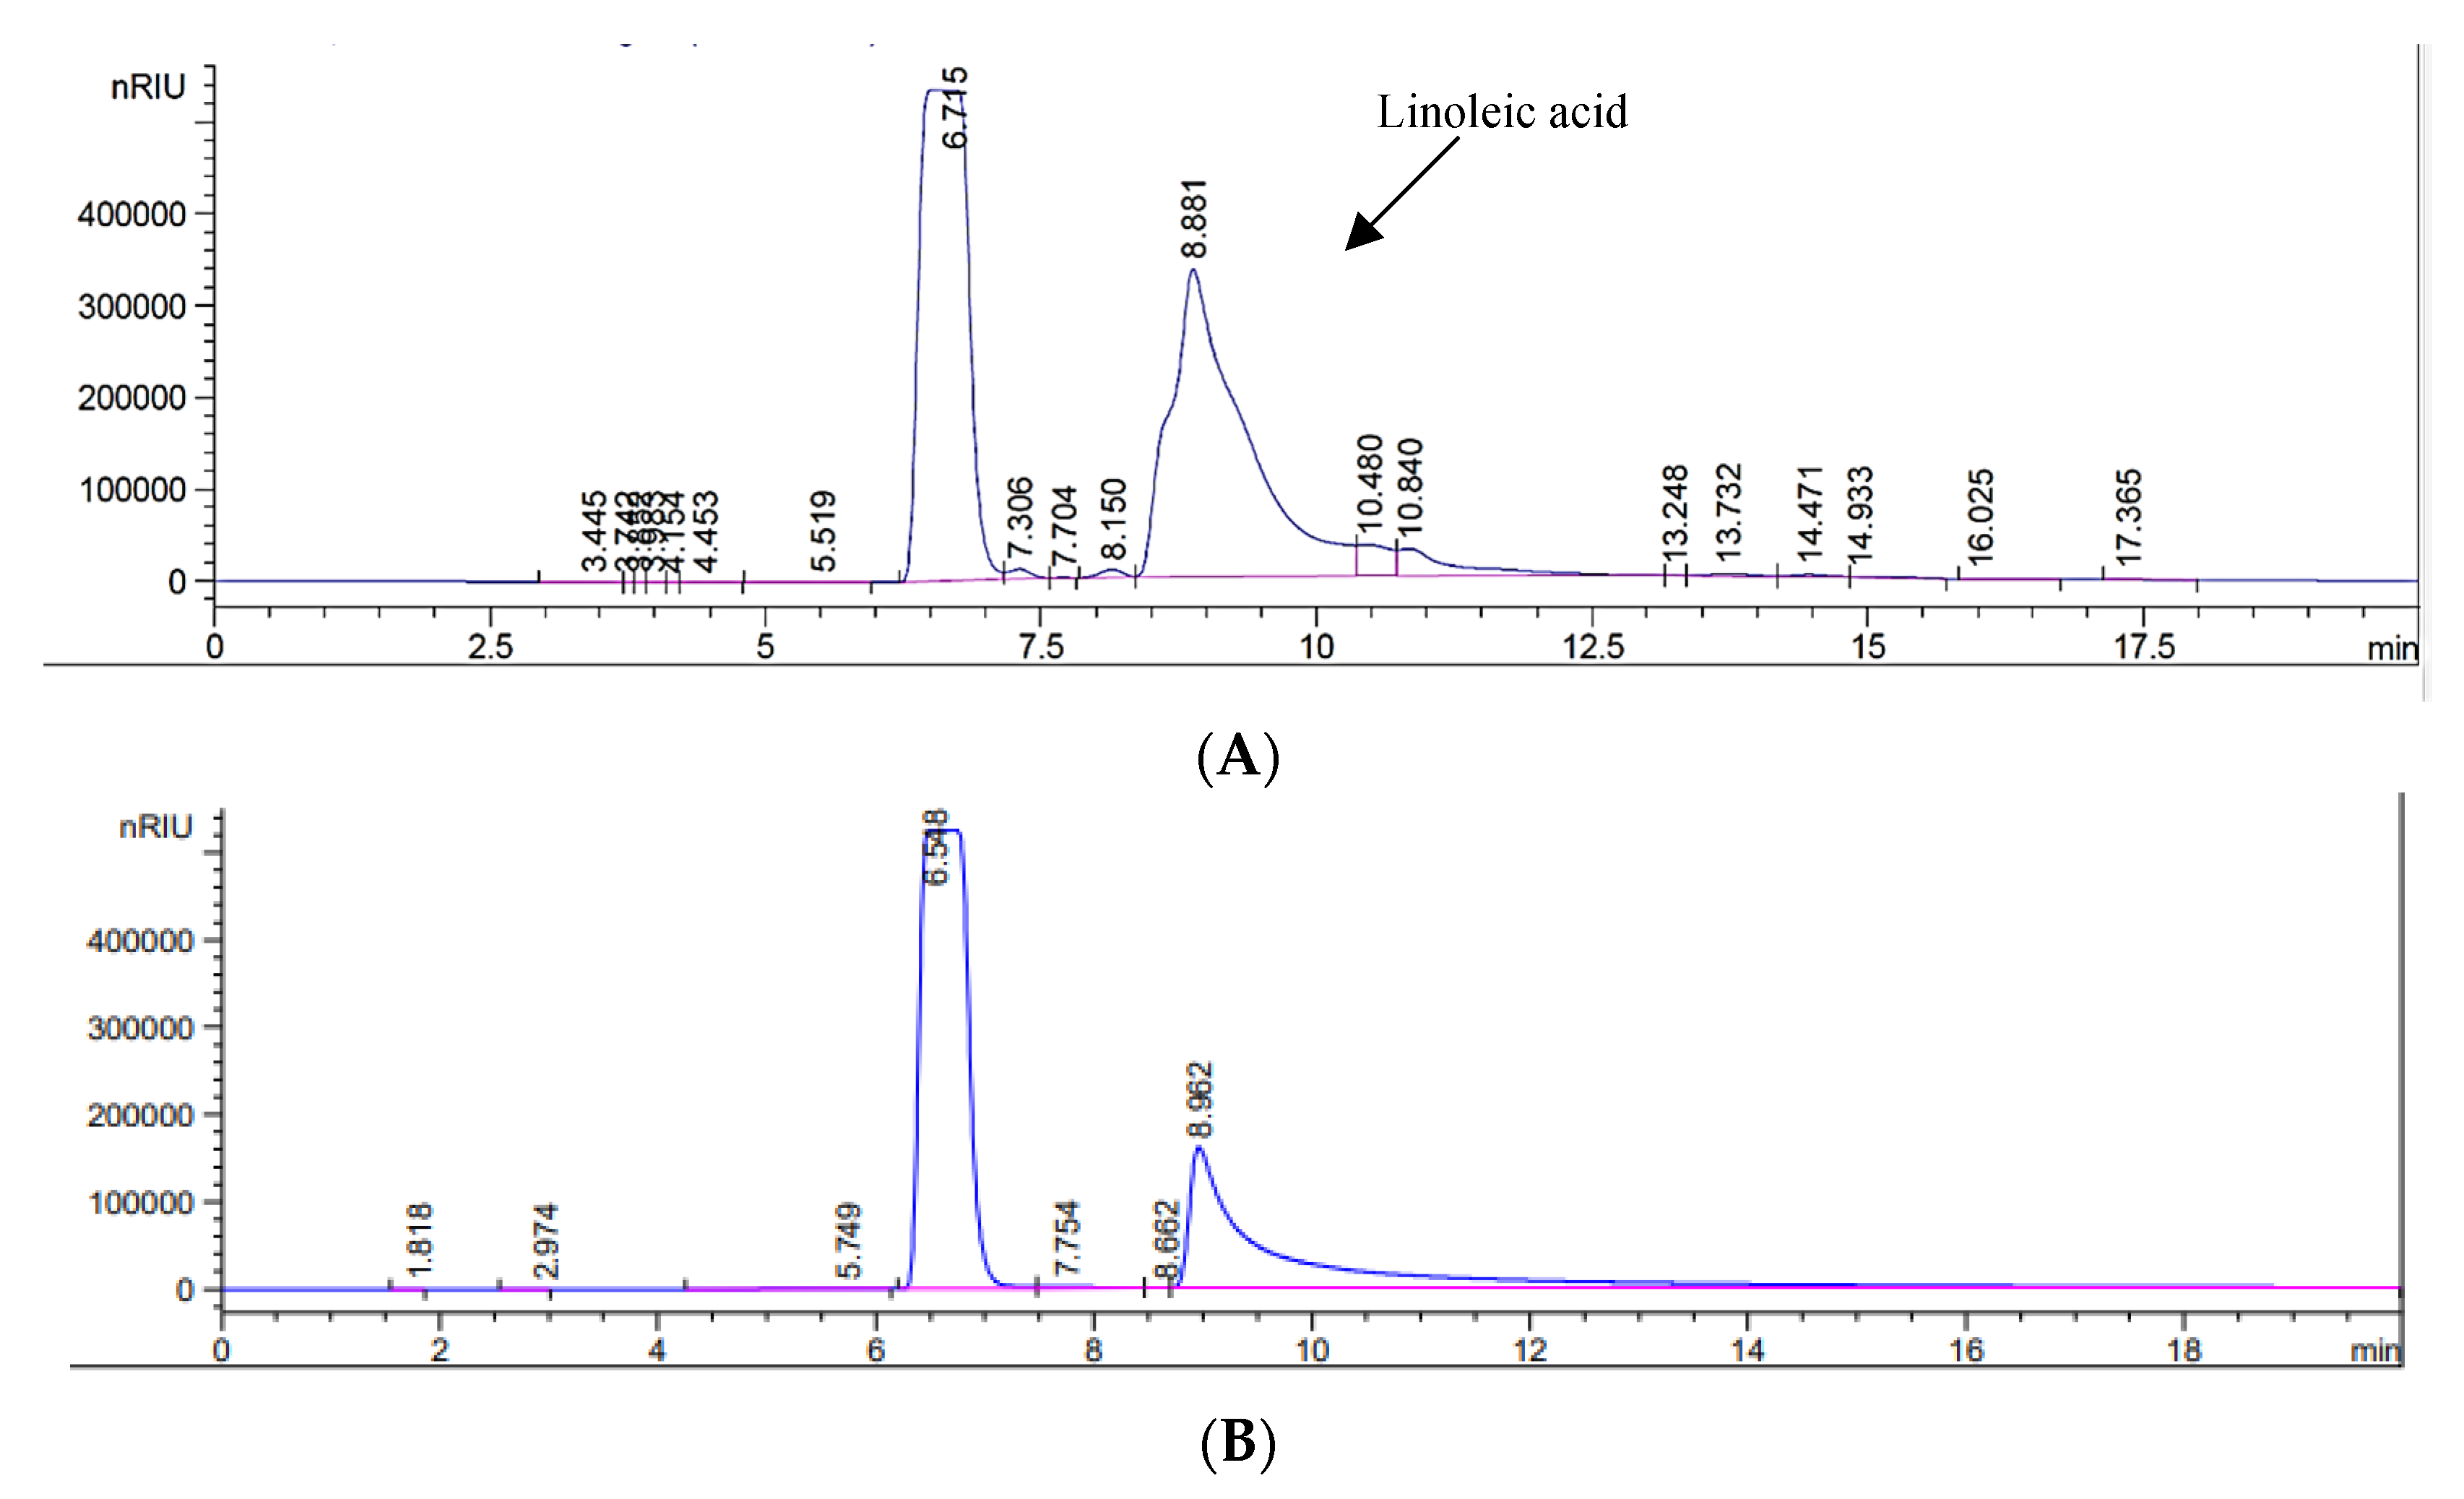
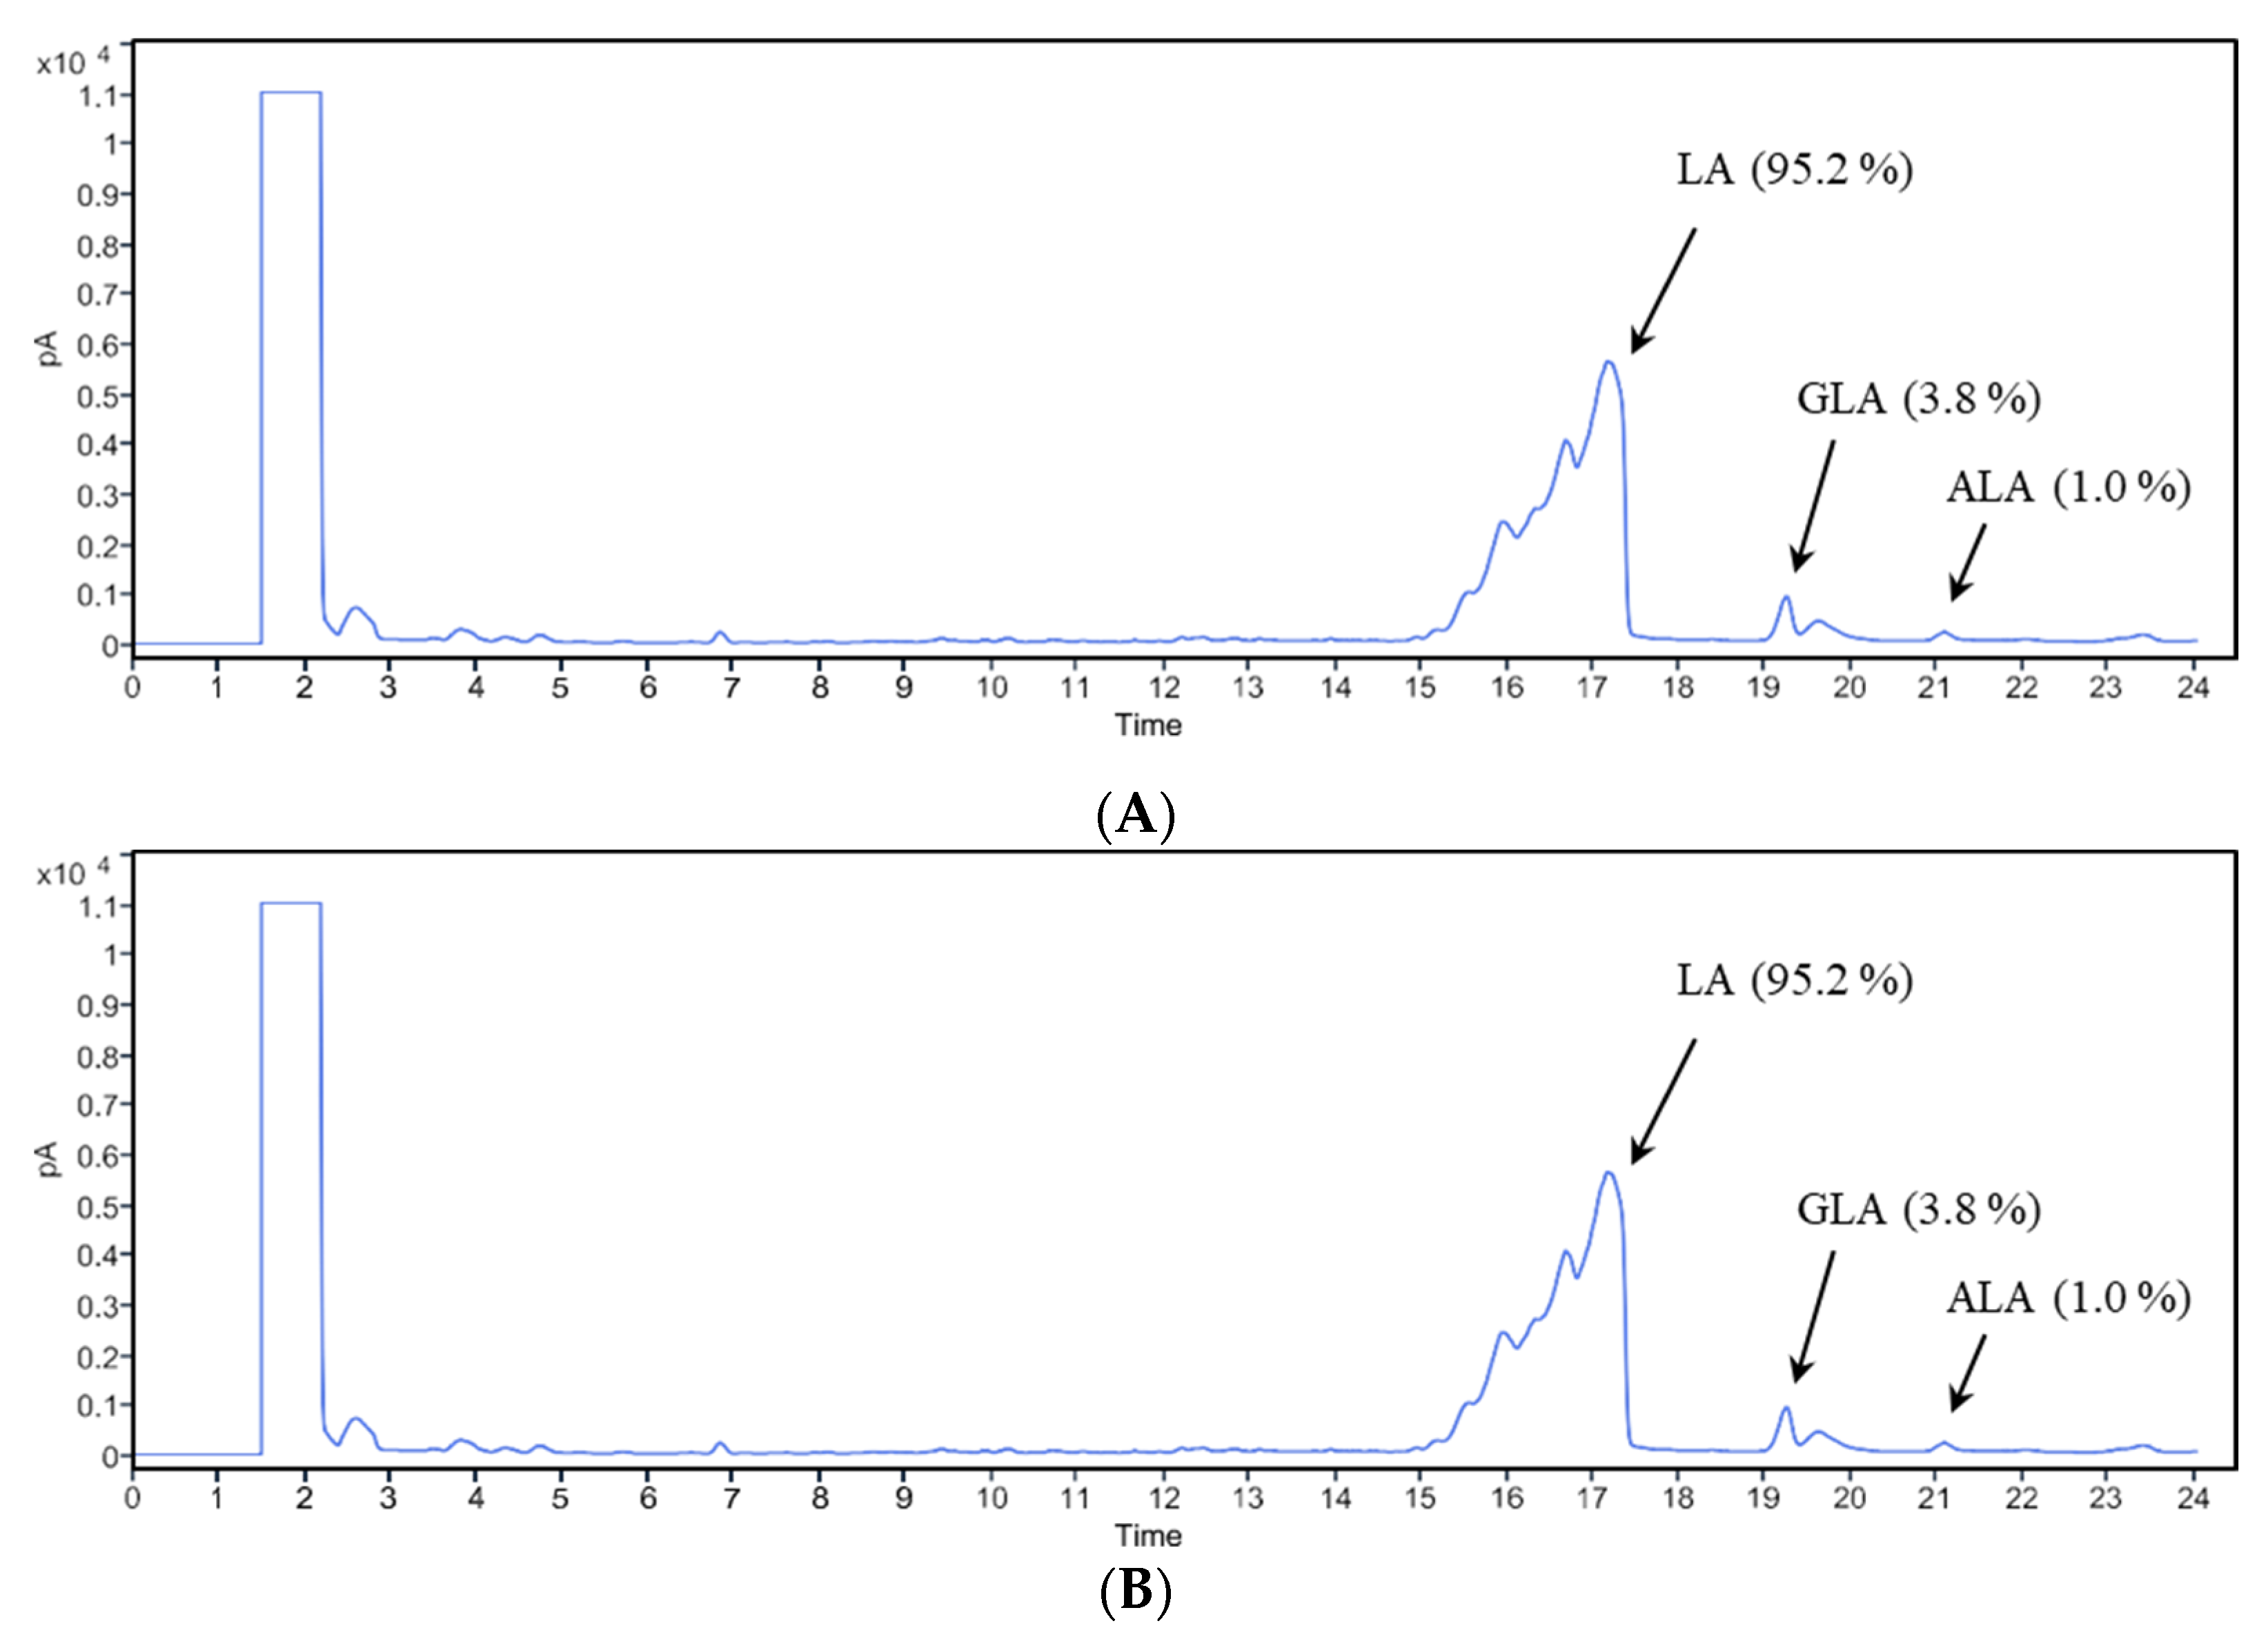
3.3. Separation and Identification of LA

Finally, the mixture of PUFAs obtained by UC was further separated using LTC. We decided to use LTC rather than fractional distillation. The reason for this decision was based on the differences in the freezing and boiling points of the three main fatty acids [39,40] present in the PUFA fraction after UC: LA, GLA, and ALA (Figure 4B). As can be seen from Table 4, the difference between the freezing points of LA (−6.5 °C) and those of GLA-ALA (−11 °C) was 4.5 °C, whereas the boiling points of the three fatty acids differed only by 1 °C. The numbers shown in Table 4 apply for the acids in their pure form, and a shift in their respective freezing points can be expected for acid mixtures [41]. However, this info provides a useful guideline and evidence for the choice of LTC as the preferred separation method for LA.
The selection of acetone as a solvent for LTC was based on the following: (1) acetone has a low freezing temperature (−95 °C); (2) TOFAs are highly soluble in acetone; and (3) due to its low density (0.784 g/cm3) and boiling temperature (56 °C), acetone is easy to recover and recycle. Table 5 presents the LTC yield for each fraction following LTC in the specified temperature range, while Figure 5 displays the HPLC chromatograms for crystallized fraction C (Figure 5A) and the LA standard (Figure 5B).
Figure 6 represents the GC chromatograms of fraction C and the HPLC-grade LA standard. The purity of LA was about 95%, with some GLA and ALA present in the crystallized fraction C (Figure 6A). In Figure 3, the LA in the TOFA fraction (post-distillation of CTO) was identified at a RT of 15.5 min. In comparison, the GC chromatogram of fraction C (Figure 6A), following UC and LTC of the PUFAs, displayed a LA peak area in the same RT region of 15–16 min, however, the LA peak had some tailing and distortion, which may be due to contamination in the GC column. During GC separation, inert, non-active compounds that are relatively non-volatile tend to accumulate in the column over time. As evident from Figure 6B, the RT of a standard LA was between 18 and 19 min, which represents a shift of about 2 min, compared to Figure 6A. The deviation in the RT could be due to the presence of impurities such as ALA and GLA (Figure 6A), which co-crystallized with LA during LTC at −15 °C. In addition, the RT may be affected by differences in the LA concentration between the HPLC-grade LA and the fraction C samples.
In summary, the separation of LA from CTO was based on differences in the boiling points of fatty acids and the remaining CTO components (distillation), freezing points (LTC), solvent solubility, and fatty acid degree of unsaturation (UC and LTC). Fractional distillation at 130–265 °C under 10 mm Hg vacuum yielded 48% w/w of TOFAs from CTO. Next, UC separated the TOFAs into 62.5% w/w PUFAs and 37.5% w/w SFAs and MUFAs. The PUFAs were then further fractionated by LTC in the temperature range of 4 °C to −30 °C. The −7 °C to −15 °C fraction yielded 26% w/w LA from the PUFAs or 7.8% w/w from CTO. The purity of LA was 95.2% w/w, with 3.8% w/w GLA and 1.0% ALA present as contaminants. This mixture of essential fatty acids may be applied as is, or LA can be further purified using the above-described method. The approach presented here can be applied to recover other valuable fatty acids. Furthermore, once the targeted fatty acid(s) are isolated, the rest of the TOFAs can be utilized for the production of biodiesel, biobased surfactants, or other valuable bioproducts.

4. Conclusions

This study presents an example that demonstrates how the circular bioeconomy concept can be applied to upgrade low-value industry by-products such as CTO. The valorization of CTO at pulp and paper mills provides a route toward product and market diversification that can render the forest industry more competitive and bring about additional revenue. It also offers more flexibility that allows the industry to adequately react to product and market fluctuations by adjusting their product range. The economics of CTO-based technologies would certainly benefit from the increased number of cost-competitive CTO-derived products that become an integral part in the value-chain of the forest products ecosystem.

Author Contributions

The manuscript was written through the contributions of all authors. All authors have read and agreed to the published version of the manuscript.

Funding

This research was funded by the Natural Science and Engineering Council of Canada (NSERC), grant number EGP 490582-15 (L.P. Christopher) and grant number RGPIN-2017-05355 (Md Nur Alam), and the article processing charge (APC) was funded by RGPIN-2017-05355.

Acknowledgments

The authors wish to thank Shrikanta Sutradhar at the Biorefining Research Institute, Lakehead University, Canada, for his assistance with the GC data analysis and the manuscript revision.

Conflicts of Interest

The authors declare no conflicts of interest.

References

  1. Norlin, L.H. Tall Oil. In Ullmann’s Encyclopedia of Industrial Chemistry; John Wiley and Sons, Inc.: Somerset, NJ, USA; Wiley-VCH Verlag GmbH & Co. KGaA: Weinheim, Germany, 2000; pp. 583–596. [Google Scholar]
  2. Biermann, C.J. Essentials of Pulping and Papermaking; Academic Press Inc.: San Diego, CA, USA, 1993; p. 107. [Google Scholar]
  3. Stenius, P. Forest Products Chemistry. Paperm. Sci. Technol. 2000, 3, 73–76. [Google Scholar]
  4. Gullichsen, J.; Paulapuro, H.; Fogelholm, C.J. Chemical Pulping; Papermaking Science and Technology: Fapet Oy, Finland, 2000; pp. B378–B388. [Google Scholar]
  5. McSweeney, E.E.; Arlt, H.G., Jr.; Russel, J. Tall Oil and Its Uses-II; Pulp Chemicals Association: New York, NY, USA, 1987; p. 13. [Google Scholar]
  6. Murillo, E.A.; Vallejo, P.P.; López, B.L. Effect of tall oil fatty acids content on the properties of novel hyperbranched alkyd resins. J. Appl. Polym. Sci. 2011, 120, 3151–3158. [Google Scholar] [CrossRef]
  7. Ikladious, N.E.; Mansour, S.H.; Asaad, J.N.; Emira, H.S.; Hilt, M. Synthesis and evaluation of new hyperbranched alkyds for coatings. Prog. Org. Coat. 2015, 89, 252–259. [Google Scholar] [CrossRef]
  8. Liu, K.; Madbouly, S.A.; Schrader, J.A.; Kessler, M.R.; Grewell, D.; Graves, W.R. Biorenewable polymer composites from tall oil-based polyamide and lignin-cellulose fiber. J. Appl. Polym. Sci. 2015, 132, 1–9. [Google Scholar] [CrossRef] [Green Version]
  9. Coll, R.; Udas, S.; Jacoby, W.A. Conversion of the Rosin Acid Fraction of Crude Tall Oil into Fuels and Chemicals. Energy Fuels 2001, 15, 1166–1172. [Google Scholar] [CrossRef]
  10. Yakushin, V.; Stirna, U.; Bikovens, O.; Misane, M.; Sevastyanova, I.; Vilsone, D. Synthesis and characterization of novel polyurethanes based on tall oil. Mater. Sci. 2013, 19, 390–396. [Google Scholar] [CrossRef] [Green Version]
  11. Mikulec, J.; Kleinova, A.; Cvengros, J.; Joríková, L.; Banić, M. Catalytic transformation of tall oil into biocomponent of diesel fuel. Int. J. Chem Eng. 2011, 2012, 1–9. [Google Scholar] [CrossRef] [Green Version]
  12. Mkhize, N.M.; Sithole, B.B.; Ntunka, M.G. Heterogeneous acid-catalyzed biodiesel production from crude tall oil: A low-grade and less expensive feedstock. J. Wood Chem. Technol. 2015, 35, 374–385. [Google Scholar] [CrossRef]
  13. Adewale, P.; Vithanage, L.N.; Christopher, L.P. Optimization of enzyme-catalyzed biodiesel production from crude tall oil using Taguchi method. Energy Convers. Manag. 2017, 154, 81–91. [Google Scholar] [CrossRef]
  14. Hegde, A. Tall Oil Fatty Acid Market – Global Industry Analysis Report, Share, Size, Growth, Price Trends and Forecast, 2017 – 2024; Global Market Insights: Delaware, DE, USA, 2017. [Google Scholar]
  15. Peters, D.; Stojcheva, V. Crude tall oil low ILUC risk assessment; ECOFYS Netherlands, B.V.: Kanaalweg, The Netherlands, 2017; SISNL17494. [Google Scholar]
  16. Chatterjee, S.G.; Omori, S.; Marda, S.; Shastri, S. Process for making biodiesel from crude tall oil. U.S. Patent 7,695,532, 2010. [Google Scholar]
  17. Valto, P.; Knuutinen, J.; Alén, R. Overview of analytical procedures for fatty and resin acids in the papermaking process. BioResources 2012, 7, 6041–6076. [Google Scholar] [CrossRef]
  18. Kumar, H.; Alen, R. Microwave-assisted esterification of tall oil fatty acids with methanol using lignin-based solid catalyst. Energy Fuels 2016, 30, 9451–9455. [Google Scholar] [CrossRef] [Green Version]
  19. Harris, W.S.; Mozaffarian, D.; Rimm, E.; Etherton, P.K.; Rudel, L.L.; Appel, L.J.; Engler, M.M.; Engler, M.B.; Sacks, F. Omega-6 fatty acids and risk for cardiovascular disease. Am. Heart Assoc. 2009, 119, 902–907. [Google Scholar] [CrossRef] [PubMed] [Green Version]
  20. Kinsella, J.E. Food components with potential therapeutic benefits: The n-3 polyunsaturated fatty acids of fish oil. Food Tech. 1986, 40, 89–97. [Google Scholar]
  21. Mehta, L.; Lopez, L.M.; Lowton, D.; Wargovich, T. Dietary supplementation with omega-3 polyunsaturated fatty acids in patients with stable coronary diseases: Effects on indices of platelet and neutrophil function and exercise performance. Am. J. Med. 1988, 84, 45–52. [Google Scholar] [CrossRef]
  22. Ando, H.; Ryu, A.; Hashimoto, A.; Oka, M.; Ichihashi, M. Linoleic acid and α-linolenic acid lightens ultraviolet-induced hyperpigmentation of the skin. Arch. Dermat. Res. 1998, 290, 375–381. [Google Scholar] [CrossRef]
  23. Boonhua, T.; Grijpma, D.W.; Nabuurs, T.; Feijen, J. Crosslinkable surfactants based on linoleic acid-functionalized block copolymers of ethylene oxide and ε-caprolactone for the preparation of stable PMMA lattices. Polymer 2005, 46, 1347–1357. [Google Scholar]
  24. Bronsgeest-Schoute, H.C.; Van Gent, C.M.; Luten, J.B.; Ruiter, A. The effect of various intakes of ω-3 fatty acids on the lipid composition in healthy human subjects. Am. J. Clin. Nut. 1981, 34, 1752–1757. [Google Scholar] [CrossRef] [Green Version]
  25. Chia-cheng, C.; Chien-ming, C.; Po-wen, Y. Vapor-liquid equilibria of carbon dioxide with linoleic acid, α-tocopherol and triolein at elevated pressures. Fluid Phase Equib. 2000, 175, 107–115. [Google Scholar]
  26. Maheshwari, P.; Nikolov, Z.L.; White, T.M.; Hartel, R. Solubility of fatty acids in supercritical carbon dioxide. JAOCS 1992, 69, 1069–1076. [Google Scholar] [CrossRef]
  27. Mario, B.; Elena, B.; Claudio, F. Seed processing and oil quality of Jatropha curcasL. on farm scale: A comparison with other energy crops. Energy Sust. Develop. 2014, 19, 7–14. [Google Scholar]
  28. Castejónet, N.; Luna, P.; Senorans, F.J. Alternative oil extraction methods from Echium plantagineum L. seeds using advanced techniques and green solvents. Food Chem. 2018, 244, 75–82. [Google Scholar] [CrossRef]
  29. Josephine, K.; Colin, W. Extraction of omega-6 fatty acids from speciality seeds. Lipid Tech. 2014, 26, 107–110. [Google Scholar]
  30. Hayes, D.G. Effect of temperature programming on the performance of urea inclusion compound-based free fatty acid fractionation. JAOCS 2006, 83, 253–259. [Google Scholar] [CrossRef]
  31. Chawla, P.; deMan, J.M. Measurement of the size distribution of fat crystals using a laser particle counter. JAOCS 1990, 67, 329–332. [Google Scholar] [CrossRef]
  32. Endo, S.; Pfennigsdorff, A.; Goss, K.U. Salting-out effect in aqueous NaCl solutions: Trends with size and polarity of solute molecules. Environ. Sci. Technol. 2012, 46, 1496–1503. [Google Scholar] [CrossRef]
  33. Adewale, P.; Christopher, L.P. Thermal and rheological properties of crude tall oil for use in biodiesel production. Processes 2017, 5, 59. [Google Scholar] [CrossRef]
  34. Stigsson, L.; Naydenov, V.; Lundback, J. Biorefining of crude tall oil. International Patent PCT/SE2013/051605 (WO 2014/098763 A1), 2014. [Google Scholar]
  35. Larsson, K.; Quinn, P.; Sato, K.; Tiberg, F. Lipids: Structure, Physical Properties and Functionality, 1st ed.; The Oily Press: Bridgwater, UK, 2006; pp. 1–288. [Google Scholar]
  36. Wilkes, H.; Schwarzbauet, J. Hydrocarbons: An introduction to structure, physico-chemical properties and natural occurrence. In Handbook of Hydrocarbon and Lipid Microbiology; Timmis, K.N., Ed.; Springer: Berlin/Heidelberg, Germany, 2010; pp. 1–48. [Google Scholar]
  37. Anthonykutty, J.M.; Linnekoski, J.; Harlin, A.; Laitinen, A.; Lehtonen, J. Catalytic upgrading of crude tall oil into a paraffin-rich liquid. Biomass. Convers. Bioref. 2014, 5, 149–159. [Google Scholar] [CrossRef]
  38. De Bruycker, R.; Anthonykutty, J.M.; Linnekoski, J.; Harlin, A.; Lehtonen, J.; Van Geem, K.M.; Räsänen, J.; Marin, G.B. Assessing the potential of crude tall oil for the production of green-base chemicals: An experimental and kinetic modeling study. Ind. Eng. Chem. Res. 2014, 53, 18430–18442. [Google Scholar] [CrossRef]
  39. Cermak, S.C.; Evangelista, R.L.; Kenar, J.A. Distillation of natural fatty acids and their chemical derivatives. In Distillation; Zereshki, S., Ed.; INTECH Open Access Publisher: London, UK, 2012; Chapter 5; pp. 109–135. [Google Scholar]
  40. Bhagavan, N.V. Lipids I: Fatty acids and Eicosanoids. Medical Biochemistry, 4th ed.; Wood, E.J., Ed.; Academic Press: New York, NY, USA, 2002; Chapter 18; pp. 365–399. [Google Scholar]
  41. Hunnicutt, S.S.; Grushow, A.; Whitnell, R. How is the freezing point of a binary mixture of liquids related to the composition? A guided inquiry experiment. J. Chem. Educ. 2017, 94, 1983–1988. [Google Scholar] [CrossRef]
Figure 1. Chemical structures of essential (LA, ALA) and conditionally essential (GLA) fatty acids.
Separations 07 00009 g001
Figure 2. Separation of ω-6 LA from CTO.
Separations 07 00009 g002
Figure 3. GC chromatogram of TOFAs. (1) Palmitic acid (C16:0), (2) Palmitoleic acid (C16:1), (3) Oleic acid (C18:1), (4) Stearic acid (C18:0), (5) LA (C18:2n6), (6) GLA (C18:3n6), (7) ALA (C18:3n3).
Separations 07 00009 g003
Figure 4. HPLC chromatogram of the TOFAs. Before UC (A): (7) Palmitic acid; (6) Palmitoleic acid; (5) Oleic acid; (4) Stearic acid; (1) LA; (3) ALA; (2) GLA. After UC (B): (1) LA; (2) ALA; (3) GLA.
Separations 07 00009 g004
Figure 5. HPLC chromatograms of fraction C (A) and HPLC-grade LA standard (B).
Separations 07 00009 g005
Figure 6. GC chromatogram of fraction C (A) and HPLC-grade LA standard (B).
Separations 07 00009 g006
Table 1. PUFAs fractionation by LTC.
LTC FractionLTC Temperature
A4 °C
B−7 °C
C−15 °C
D−20 °C
E−30 °C
Table 2. Composition of the TOFAs.
LTC FractionLTC Temperature
A4 °C
B−7 °C
C−15 °C
D−20 °C
E−30 °C
Table 3. HPLC RT of TOFAs before and after UC.
TOFAThis Work (% w/w)Literature [2,4,33] (% w/w)
Palmitic acid12.34–15
Palmitoleic acid7.52–10
Oleic acid4.51–6
Stearic acid14.86–20
LA42.625–53
GLA2.952–10
ALA1.751–3
Table 4. Boiling and freezing points of LA, GLA, and ALA.
PUFAFreezing Point (°C) [38,39]Boiling Point (°C) at 10 mm Hg [38]
LA−6.5224
GLA−11225
ALA−11226
Table 5. Separation of PUFAs by LTC.
LTC FractionLTC RangeLTC Yield (% w/w)
AUp to 4 °C10.6
B4 °C to −7 °C12.4
C−7 °C to −15 °C26
D−15 °C to −20 °C13.8
E−20 °C to −30 °C37.2

