Determination of N-Nitrosamines by Gas Chromatography Coupled to Quadrupole–Time-of-Flight Mass Spectrometry in Water Samples


 and
and
Abstract
:
1. Introduction
2. Materials and Methods
2.1. Chemicals
2.2. Samples
2.3. Sample Preparation
2.4. Determination Conditions
2.5. Method Validation
3. Results and Discussion
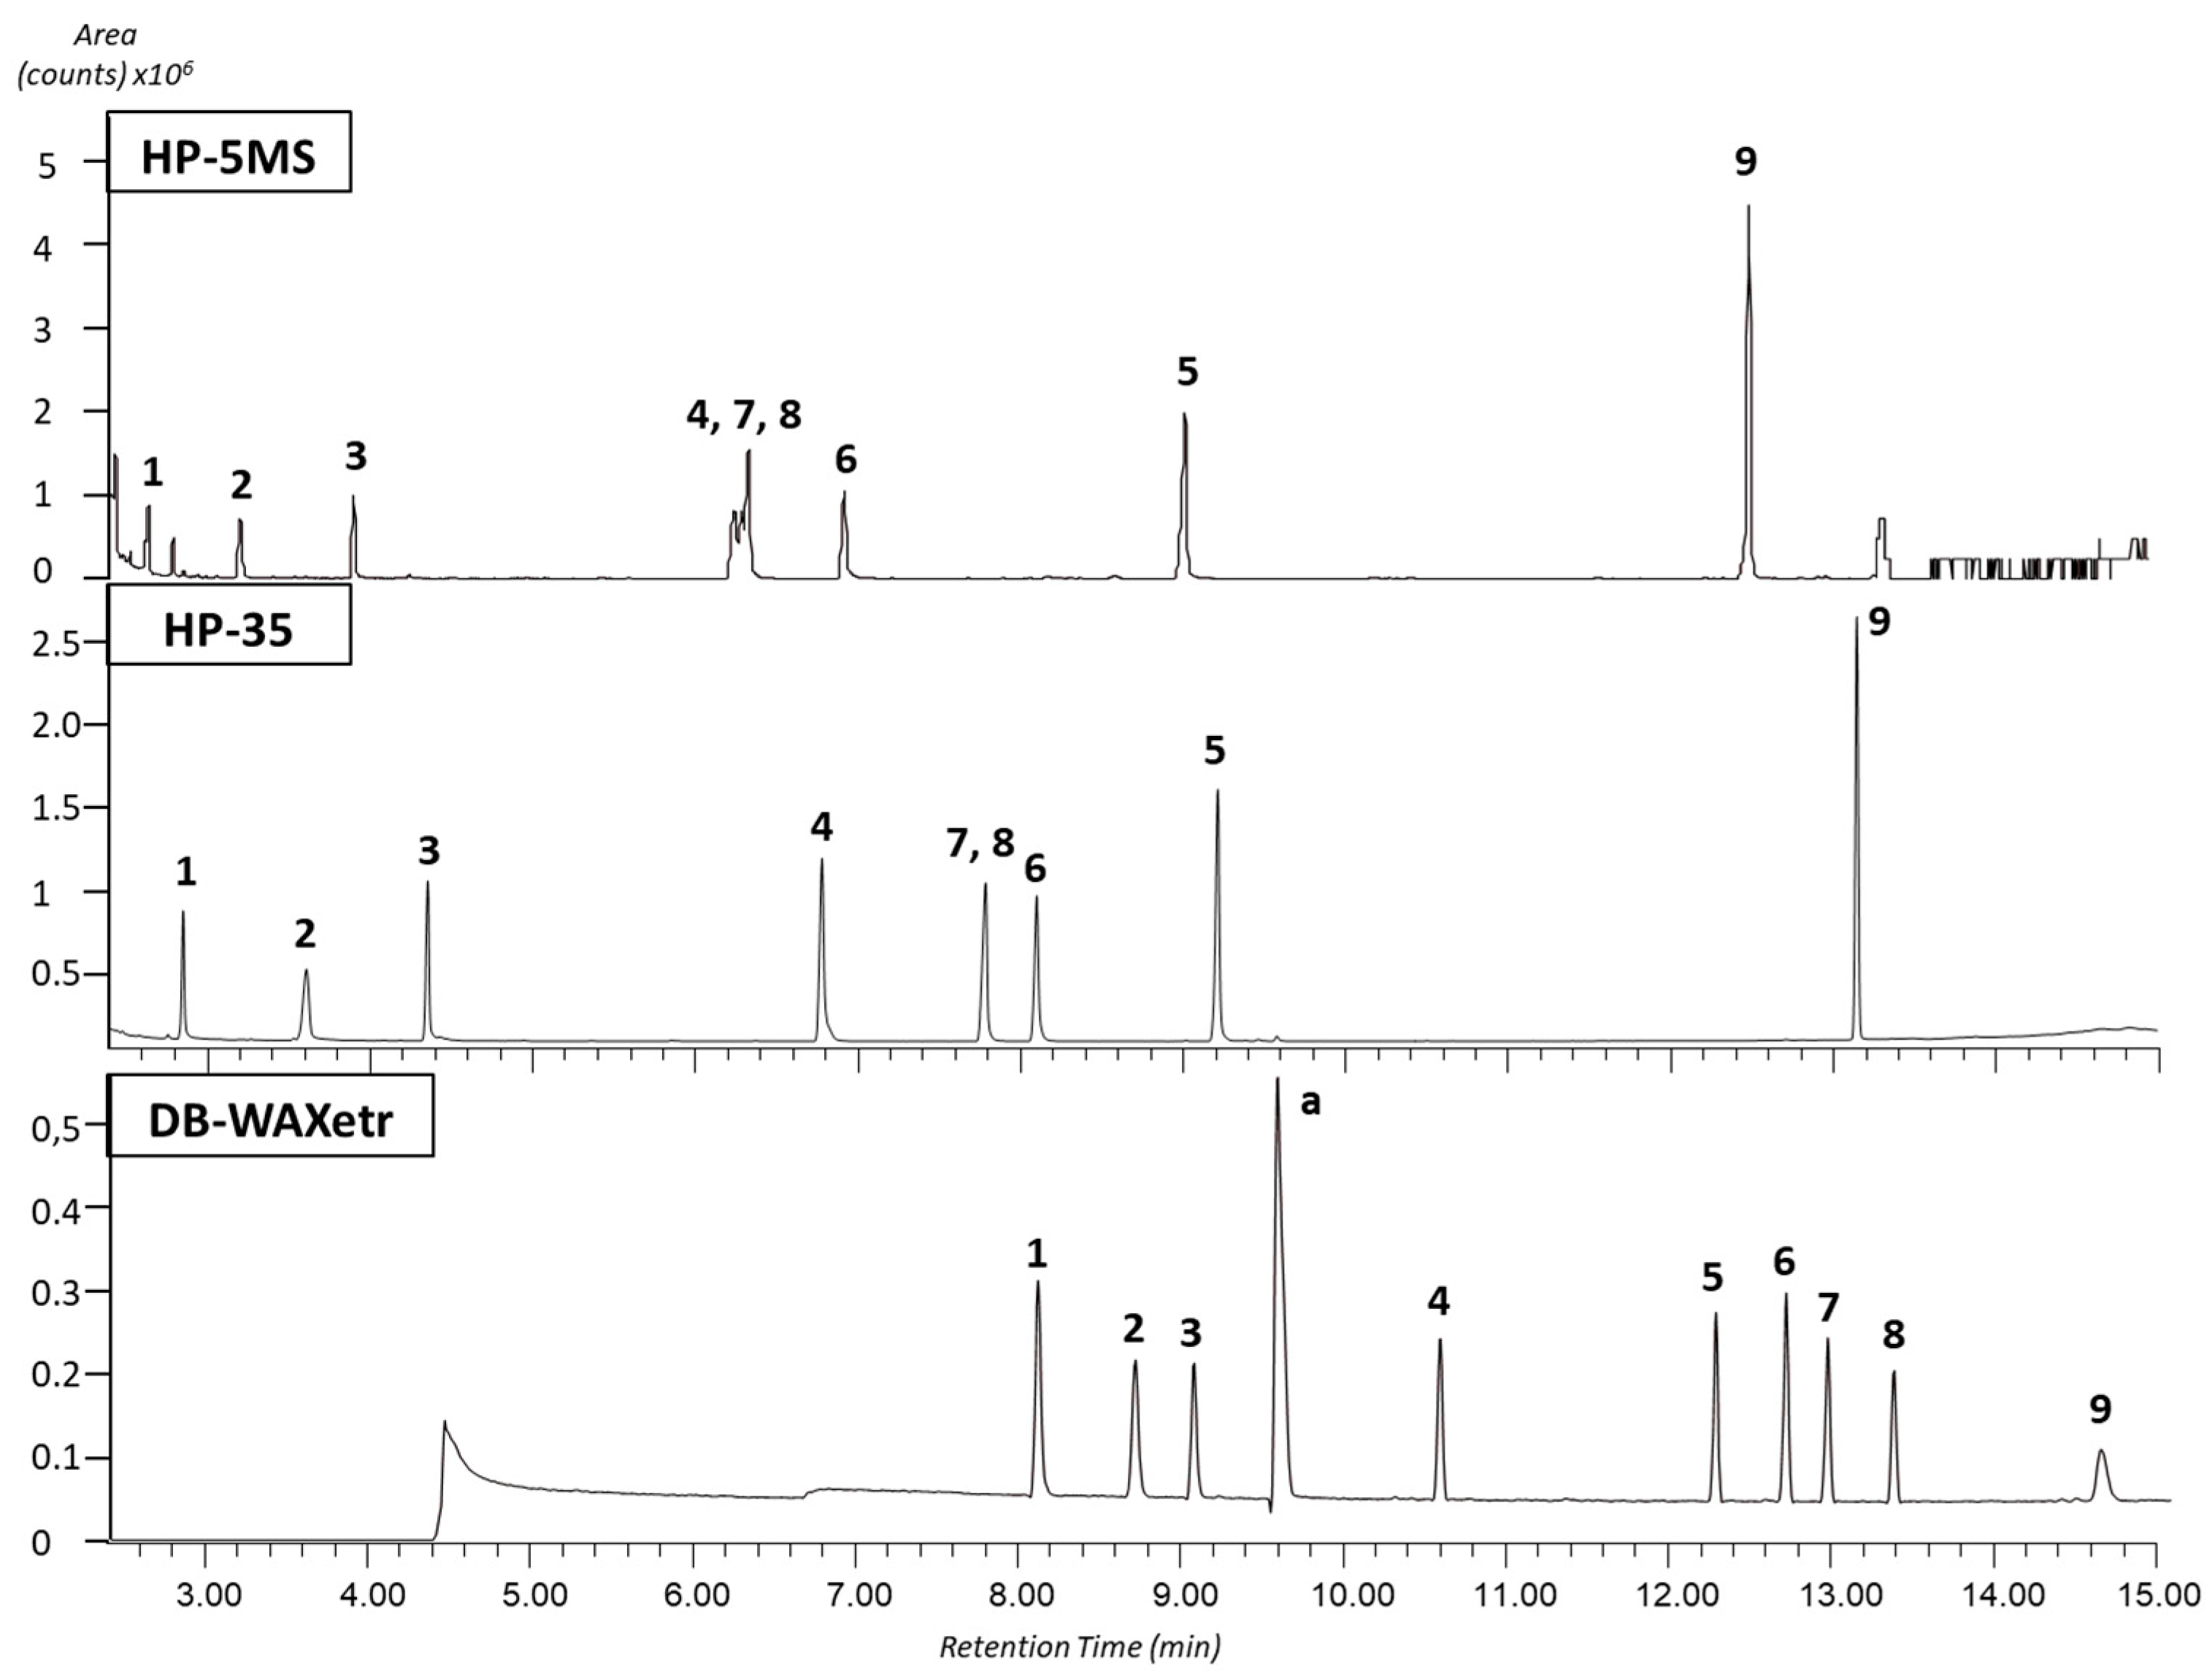
3.1. Capillary Column Selection
3.2. Mass Spectrometry
3.3. Instrumental Performance
3.4. Performance with Real Samples after SPE
3.5. Analysis of Real Samples
4. Conclusions
Supplementary Materials
Author Contributions
Funding
Conflicts of Interest
References
- Choi, J.; Valentine, R.L. Formation of N-nitrosodimethylamine (NDMA) from reaction of monochloramine: A new disinfection by-product. Water Res. 2002, 36, 817–824. [Google Scholar] [CrossRef]
- Nawrocki, J.; Andrzejewski, P. Nitrosamines and water. J. Hazard. Mater. 2011, 189, 1–18. [Google Scholar] [CrossRef] [PubMed]
- Mitch, W.A.; Sedlak, D.L. Formation of N -Nitrosodimethylamine (NDMA) from Dimethylamine during Chlorination. Environ. Sci. Technol. 2002, 36, 588–595. [Google Scholar] [CrossRef] [PubMed]
- Mitch, W.A.; Gerecke, A.C.; Sedlak, D.L. A N-Nitrosodimethylamine (NDMA) precursor analysis for chlorination of water and wastewater. Water Res. 2003, 37, 3733–3741. [Google Scholar] [CrossRef]
- Le Roux, J.; Gallard, H.; Croue, J. Chloramination of nitrogenous contaminants (pharmaceuticals and pesticides): NDMA and halogenated DBPs formation. Water Res. 2011, 45, 3164–3174. [Google Scholar] [CrossRef]
- Chen, B.; Qian, Y.; Wu, M.; Zhu, L.; Hu, B.; Li, X. Identification of Precursors and Mechanisms of Tobacco-Specific Nitrosamine Formation in Water during Chloramination. Environ. Sci. Technol. 2015, 49, 459–466. [Google Scholar] [CrossRef]
- Park, S.H.; Padhye, L.P.; Wang, P.; Cho, M.; Kim, J.-H.; Huang, C.-H. N-nitrosodimethylamine (NDMA) formation potential of amine-based water treatment polymers: Effects of in situ chloramination, breakpoint chlorination, and pre-oxidation. J. Hazard. Mater. 2015, 282, 133–140. [Google Scholar] [CrossRef]
- Krasner, S.W.; Shirkhani, R.; Westerhoff, P.; Hanigan, D.; Mitch, W.A.; McCurry, D.L.; Chen, C.; Skadsen, J.; Von Gunten, U. Controlling the Formation of Nitrosamines During Water Treatment; Report No 4370; Water Research Foundation: Denver, CO, USA, 2015. [Google Scholar]
- World Health Organization. Guidelines for Drinking Water Quality; WHO: Geneva, Switzerland, 2004; Volume 3, ISBN 978-92-4-154815-1. [Google Scholar]
- Boards, C.W. NDMA and Other Nitrosamines—Drinking Water Issues. Available online: https://www.waterboards.ca.gov/drinking_water/certlic/drinkingwater/NDMA.html (accessed on 11 June 2018).
- Munch, J.; Bassett, M. Solid Phase Extraction and Capillary Column Gas Chromatography with Large Volume Injection and Chemical Ionization Tandem Mass Spectrometry (MS/MS). EPA Rep. 2004, 182, 1–47. [Google Scholar]
- Pozzi, R.; Bocchini, P.; Pinelli, F.; Galletti, G.C. Determination of nitrosamines in water by gas chromatography/chemical ionization/selective ion trapping mass spectrometry. J. Chromatogr. A 2011, 1218, 1808–1814. [Google Scholar] [CrossRef]
- Grebel, J.E.; Young, C.C.; Suffet, I.H. (Mel) Solid-phase microextraction of N-nitrosamines. J. Chromatogr. A 2006, 1117, 11–18. [Google Scholar] [CrossRef]
- Fu, S.C.; Tzing, S.H.; Chen, H.C.; Wang, Y.C.; Ding, W.H. Dispersive micro-solid phase extraction combined with gas chromatography-chemical ionization mass spectrometry for the determination of N-nitrosamines in swimming pool water samples. Anal. Bioanal. Chem. 2012, 402, 2209–2216. [Google Scholar] [CrossRef] [PubMed]
- Chen, W.; Li, X.; Huang, H.; Zhu, X.; Jiang, X.; Zhang, Y.; Cen, K.; Zhao, L.; Liu, X.; Qi, S. Comparison of gas chromatography-mass spectrometry and gas chromatography-tandem mass spectrometry with electron ionization for determination of N-nitrosamines in environmental water. Chemosphere 2017, 168, 1400–1410. [Google Scholar] [CrossRef] [PubMed]
- Zhao, Y.; Boyd, J.; Hrudey, S.E.; Li, X. Characterization of New Nitrosamines in Drinking Water Using Liquid Chromatography Tandem Mass Spectrometry. Environ. Sci. Technol. 2006, 40, 7636–7641. [Google Scholar] [CrossRef] [PubMed]
- Cheng, R.C.; Hwang, C.J.; Andrews-Tate, C.; Yingbo, G.; Carr, S.; Suffet, I.H. Alternative methods for the analysis of NDMA and other nitrosamines in water. Am. Water Work. Assoc. 2006, 98, 82–96. [Google Scholar] [CrossRef]
- Llop, A.; Borrull, F.; Pocurull, E. Fully automated determination of N-nitrosamines in environmental waters by headspace solid-phase microextraction followed by GC-MS-MS. J. Sep. Sci. 2010, 33, 3692–3700. [Google Scholar] [CrossRef]
- Yurchenko, S.; Mölder, U. N-nitrosodimethylamine analysis in Estonian beer using positive-ion chemical ionization with gas chromatography mass spectrometry. Food Chem. 2005, 89, 455–463. [Google Scholar] [CrossRef]
- Yurchenko, S.; Mölder, U. Volatile N-nitrosamines in various fish products. Food Chem. 2006, 96, 325–333. [Google Scholar] [CrossRef]
- Yurchenko, S.; Mölder, U. The occurrence of volatile N-nitrosamines in Estonian meat products. Food Chem. 2007, 100, 1713–1721. [Google Scholar] [CrossRef]
- Planas, C.; Palacios, Ó.; Ventura, F.; Rivera, J.; Caixach, J. Analysis of nitrosamines in water by automated SPE and isotope dilution GC/HRMS. Occurrence in the different steps of a drinking water treatment plant, and in chlorinated samples from a reservoir and a sewage treatment plant effluent. Talanta 2008, 76, 906–913. [Google Scholar] [CrossRef]
- Moschet, C.; Lew, B.M.; Hasenbein, S.; Anumol, T.; Young, T.M. LC-and GC-QTOF-MS as Complementary Tools for a Comprehensive Micropollutant Analysis in Aquatic Systems. Environ. Sci. Technol. 2017, 51, 1553–1561. [Google Scholar] [CrossRef]
- Wang, Y.; Gao, W.; Wang, Y.; Jiang, G. Suspect screening analysis of the occurrence and removal of micropollutants by GC-QTOF MS during wastewater treatment processes. J. Hazard. Mater. 2019, 376, 153–159. [Google Scholar] [CrossRef] [PubMed]
- Abushareeda, W.; Lyris, E.; Kraiem, S.; Al Wahaibi, A.; Alyazidi, S.; Dbes, N.; Lommen, A.; Nielen, M.; Horvatovich, P.L.; Alsayrafi, M.; et al. Gas chromatographic quadrupole time-of-flight full scan high resolution mass spectrometric screening of human urine in antidoping analysis. J. Chromatogr. B Anal. Technol. Biomed. Life Sci. 2017, 1063, 74–83. [Google Scholar] [CrossRef] [PubMed]
- Charrois, J.W.A.; Boyd, J.M.; Froese, K.L.; Hrudey, S.E. Occurrence of N-nitrosamines in Alberta public drinking-water distribution systems. J. Environ. Eng. Sci. 2007, 6, 103–114. [Google Scholar] [CrossRef]
- Krauss, M.; Longrée, P.; Dorusch, F.; Ort, C.; Hollender, J. Occurrence and removal of N-nitrosamines in wastewater treatment plants. Water Res. 2009, 43, 4381–4391. [Google Scholar] [CrossRef]
- Jurado-Sánchez, B.; Ballesteros, E.; Gallego, M. Comparison of the sensitivities of seven N-nitrosamines in pre-screened waters using an automated preconcentration system and gas chromatography with different detectors. J. Chromatogr. A 2007, 1154, 66–73. [Google Scholar] [CrossRef]
- Krasner, S.W.; Mitch, W.A.; Mccurry, D.L.; Hanigan, D.; Westerhoff, P. Formation, precursors, control, and occurrence of nitrosamines in drinking water: A review. Water Res. 2013, 47, 4433–4450. [Google Scholar] [CrossRef]
- Luo, Q.; Wang, D.; Wang, Z. Occurrences of nitrosamines in chlorinated and chloraminated drinking water in three representative cities, China. Sci. Total Environ. 2012, 437, 219–225. [Google Scholar] [CrossRef]
- Zhou, Q.; McCraven, S.; Garcia, J.; Gasca, M.; Johnson, T.A.; Motzer, W.E. Field evidence of biodegradation of N-Nitrosodimethylamine (NDMA) in groundwater with incidental and active recycled water recharge. Water Res. 2009, 43, 793–805. [Google Scholar] [CrossRef]

| m/z (Relative Abundance) | |||||
|---|---|---|---|---|---|
| Compound | Retention Time (min) | GC-IT-MS | GC-QToF-MS | ||
| EI | PCI | EI | PCI | ||
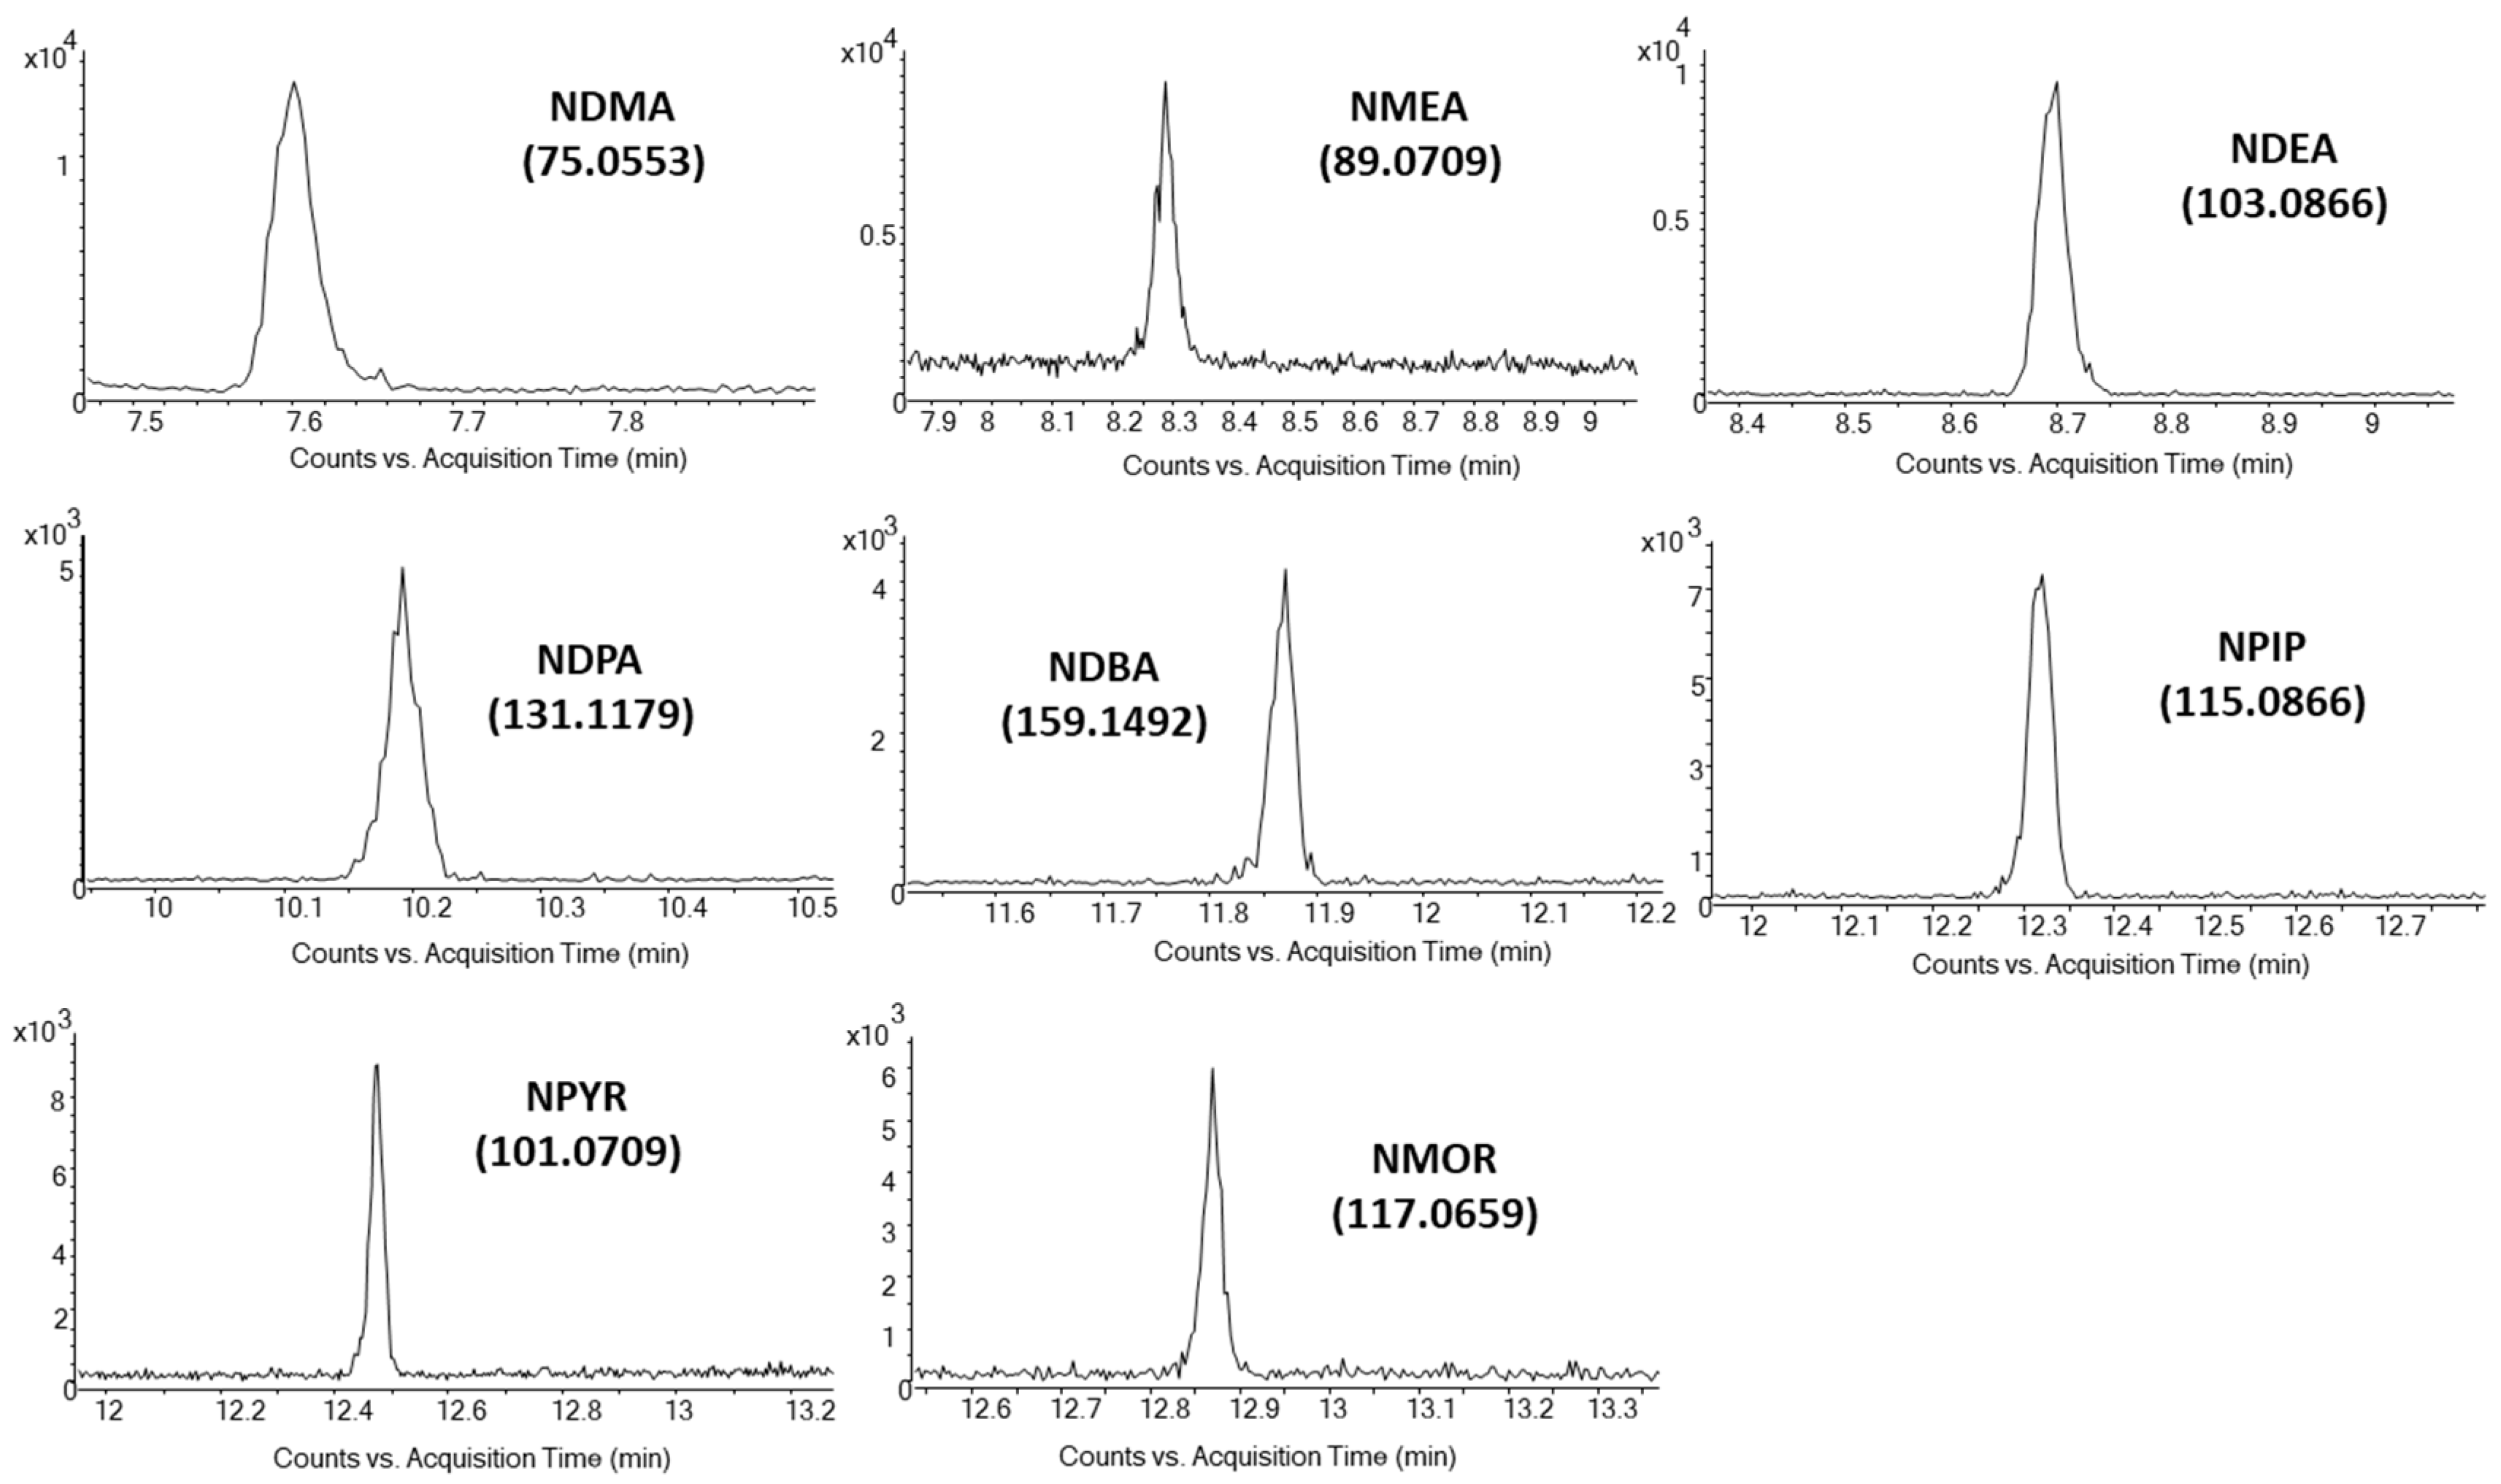
| NDMA | 7.6 | 74 (100), 42 (229), 44 (85) | 75 (100), 43 (10), 115 (3) | 74.0475 (100), 44.0495 (24) | 75.0553 (100), 115.0866 (2) |
| NMEA | 8.3 | 88 (100), 42 (400), 71 (105) | 89 (100), 61 (35), 117 (15) | 88.0631 (100), 71.0604 (65) | 89.0709 (100), 129.1022 (3) |
| NDEA | 8.7 | 102 (100), 42 (280), 56 (90) | 103 (100), 131 (28), 75 (5) | 102.0788 (100), 85.0760 (32) | 103.0866 (100), 143.1179 (5) |
| NDPA | 10.2 | 113 (100), 70 (430), 41 (250) | 131 (100), 159 (30), 89 (4) | 113.1073 (100), 70.0655 (380) | 131.1179 (100), 159.1492 (10) |
| NDBA | 11.9 | 99 (100), 84 (240), 41 (180) | 159 (100), 187 (28), 103 (2) | 99.0920 (100), 84.0812 (240) | 159.1492 (100), 187.1805 (15) |
| NPIP | 12.3 | 114 (100), 42 (97), 84 (40) | 115 (100), 143 (26), 84 (3) | 114.0788 (100), 84.0808 (35) | 115.0866 (100), 155.1179 (4) |
| NPYR | 12.5 | 100 (100), 41 (92), 68 (37) | 101 (100), 129 (19), 70 (5) | 100.0631 (100), 68.0493 (16) | 101.0709 (100), 141.1022 (4) |
| NMOR | 12.9 | 86 (100), 56 (155), 116 (6) | 117 (100), 145 (24), 86 (11) | 86.0600 (100), 116.0580 (15) | 117.0659 (100), 87.0679 (12) |
| NDEA-d10 | 8.7 | 112 | 113 | 112.1415 | 113.1494 |
| NPYR-d8 | 12.5 | 108 | 109 | 108.1133 | 109.1212 |
| GC-IT-MS | GC-QToF-MS | |||||||||||||||
|---|---|---|---|---|---|---|---|---|---|---|---|---|---|---|---|---|
| EI | PCI | EI | PCI | |||||||||||||
| R2 a | %RSD b | IDL c (ng mL−1) | IQL c (ng mL−1) | R2 a | %RSD b | IDL c (ng mL−1) | IQL c (ng mL−1) | R2 a | %RSD b | IDL c (ng mL−1) | IQL c (ng mL−1) | R2 a | %RSD b | IDL c (ng mL−1) | IQL c (ng mL−1) | |
| NDMA | 1.0000 | 4/6 | 3 | 10 | 0.9997 | 3/5 | 3 | 8 | 0.9997 | 2/10 | 1.3 | 4 | 0.9995 | 1.6/6 | 1.6 | 4.9 |
| NMEA | 0.9835 | 15/15 | 15 | 50 | 0.9984 | 8/11 | 15 | 50 | 0.9993 | 11/13 | 5.6 | 19 | 0.9996 | 1.8/10 | 4 | 11 |
| NDEA | 1.0000 | 5/4 | 3 | 8 | 0.9998 | 7/4 | 5 | 17 | 0.9991 | 1/2 | 2.0 | 5.9 | 0.9994 | 1.5/10 | 0.3 | 0.9 |
| NDPA | 1.0000 | 5/5 | 2 | 7 | 0.9986 | 4/2 | 3 | 8 | 0.9998 | 4/2 | 4.8 | 16 | 0.9998 | 1.7/10 | 0.2 | 0.6 |
| NDBA | 0.9997 | 5/11 | 1 | 9 | 0.9997 | 8/5 | 15 | 50 | 0.9992 | 5/8 | 8.8 | 29 | 0.9992 | 1.4/7 | 1 | 2 |
| NPIP | 0.9995 | 4/5 | 1 | 3 | 0.9991 | 6/3 | 1 | 3 | 0.9992 | 4/1 | 1.1 | 3.4 | 0.9993 | 1.7/12 | 1 | 1.2 |
| NPYR | 0.9998 | 7/5 | 1 | 4 | 0.9986 | 8/3 | 1 | 3 | 0.9986 | 5/10 | 1.3 | 4 | 0.9994 | 1.1/6 | 0.3 | 0.8 |
| NMOR | 0.9999 | 9/16 | 3 | 8 | 0.9992 | 3/3 | 2 | 6 | 0.9979 | 3/6 | 19 | 63 | 0.9995 | 2.2/8 | 1 | 2.8 |
| average | 0.9978 | 7/8 | 3.6 | 12.4 | 0.9991 | 6/5 | 5.6 | 18.1 | 0.9991 | 4/7 | 5.4 | 17.5 | 0.9995 | 1.6/9 | 1.2 | 3.0 |
| MDLs (ng L−1) | MQLs (ng L−1) | R% | RSD | Mass Accuracy (mDa) | ||||||||||
|---|---|---|---|---|---|---|---|---|---|---|---|---|---|---|
| 10 ng L−1 | 200 ng L−1 | 10 ng L−1 | 200 ng L−1 | 10 ng L−1 | 200 ng L−1 | |||||||||
| GC-IT-MS | GC-QToF-MS | GC-IT-MS | GC-QToF-MS | GC-QToF-MS | ||||||||||
| EI | PCI | EI | PCI | EI | PCI | EI | PCI | PCI | ||||||
| NDMA | 7.2 | 1.3 | 1.7 | 0.4 | 21.6 | 3.9 | 5.1 | 1.2 | 119 | 62 | 3.2 | 5.2 | 0.20 | 0.15 |
| NMEA | 20 | 24 | 2.2 | 1.3 | 60 | 72 | 6.6 | 3.9 | 65 | 66 | 0.75 | 6.5 | 0.35 | 0.90 |
| NDEA | 2.0 | 1.8 | 1.2 | 0.2 | 6 | 5.4 | 3.6 | 0.6 | 119 | 89 | 2.1 | 5.2 | 0.20 | 0.10 |
| NDPA | 5.8 | 7.6 | 3.9 | 0.4 | 17.4 | 22.8 | 11.7 | 1.2 | 101 | 109 | 5.6 | 4.2 | 0.32 | 0.13 |
| NDBA | 12 | 6.7 | 5.4 | 0.6 | 36 | 20.1 | 16.2 | 1.8 | 107 | 113 | 5.1 | 4.6 | 0.35 | 0.35 |
| NPIP | 3.6 | 1.2 | 1.0 | 0.4 | 10.8 | 3.6 | 3 | 1.2 | 117 | 106 | 2.1 | 2.5 | 0.20 | 0.55 |
| NPYR | 4.8 | 1.2 | 3.9 | 0.4 | 14.4 | 3.6 | 11.7 | 1.2 | 118 | 105 | 4.5 | 6.7 | 0.65 | 0.45 |
| NMOR | 10 | 3.9 | 22 | 0.6 | 30 | 11.7 | 66 | 1.8 | 92 | 106 | 0.97 | 5.0 | 0.52 | 0.70 |
| average | 8.2 | 6.0 | 5.2 | 0.5 | 24.5 | 17.9 | 15.5 | 1.6 | 105 | 95 | 3.0 | 5.0 | 0.35 | 0.42 |
| NDMA | NMEA | NPYR | NDEA | NPIP | NMOR | NDPA | NDBA | |
|---|---|---|---|---|---|---|---|---|
| Influent wastewater (1) | 4.6 ± 0.5 | <LOD | <LOD | <LOD | <LOD | <LOD | <LOD | <LOD |
| Influent wastewater (2) | 27 ± 2 | <LOD | <LOD | 15.1 ± 0.6 | <LOD | <LOD | <LOD | <LOD |
| Effluent wastewater (1) | 4.4 ± 0.1 | <LOD | <LOD | 2.8 ± 0.2 | <LOD | 2.7 ± 0.5 | <LOD | 3.1 ± 0.4 |
| Effluent wastewater (2) | 2.6 ± 0.3 | <LOD | <LOD | 3.35 ± 0.05 | <LOD | 3.0 ± 0.2 | <LOD | 8 ± 1 |
| Tap water (8:45 h) | 2.2 ± 0.2 | <LOD | <LOD | 2.8 ± 0.1 | <LOD | 1.72 ± 0.01 | <LOD | 7.1 ± 0.2 |
| Tap water (12:30 h) | 5 ± 1 | <LOD | <LOD | 4.5 ± 0.7 | 2.7 ± 0.3 | 2.4 ± 0.3 | <LOD | 9 ± 1 |
| Tap water (15:45 h) | 1.5 ± 0.2 | <LOD | <LOD | <LOD | 1.8 ± 0.1 | 1.8 ± 0.3 | <LOD | 4.3 ± 0.7 |
© 2020 by the authors. Licensee MDPI, Basel, Switzerland. This article is an open access article distributed under the terms and conditions of the Creative Commons Attribution (CC BY) license (http://creativecommons.org/licenses/by/4.0/).
Share and Cite
Sieira, B.J.; Carpinteiro, I.; Rodil, R.; Quintana, J.B.; Cela, R. Determination of N-Nitrosamines by Gas Chromatography Coupled to Quadrupole–Time-of-Flight Mass Spectrometry in Water Samples. Separations 2020, 7, 3. https://doi.org/10.3390/separations7010003
Sieira BJ, Carpinteiro I, Rodil R, Quintana JB, Cela R. Determination of N-Nitrosamines by Gas Chromatography Coupled to Quadrupole–Time-of-Flight Mass Spectrometry in Water Samples. Separations. 2020; 7(1):3. https://doi.org/10.3390/separations7010003
Chicago/Turabian StyleSieira, Benigno José, Inmaculada Carpinteiro, Rosario Rodil, José Benito Quintana, and Rafael Cela. 2020. "Determination of N-Nitrosamines by Gas Chromatography Coupled to Quadrupole–Time-of-Flight Mass Spectrometry in Water Samples" Separations 7, no. 1: 3. https://doi.org/10.3390/separations7010003
APA StyleSieira, B. J., Carpinteiro, I., Rodil, R., Quintana, J. B., & Cela, R. (2020). Determination of N-Nitrosamines by Gas Chromatography Coupled to Quadrupole–Time-of-Flight Mass Spectrometry in Water Samples. Separations, 7(1), 3. https://doi.org/10.3390/separations7010003