Article

A Zwitterionic Hydrophilic Interaction Liquid Chromatographic Photo Diode Array Method as a Tool to Investigate Oxalic Acid in Bees: Comparison with Mass Spectrometric Methods

by
Konstantinos M. Kasiotis
*,
Electra Manea-Karga
and
Kyriaki Machera
Laboratory of Pesticides’ Toxicology, Department of Pesticides Control and Phytopharmacy, Benaki Phytopathological Institute, 8 St. Delta Street, Athens, 14561 Kifissia, Greece
*
Author to whom correspondence should be addressed.
Separations 2019, 6(4), 48; https://doi.org/10.3390/separations6040048
Submission received: 24 June 2019 / Revised: 31 July 2019 / Accepted: 12 September 2019 / Published: 5 October 2019

Abstract

:
Background: Oxalic acid constitutes beekeepers′ leading choice for the battle of the parasitic mite Varroa destructor considering its efficacy, low cost, and easy application. Nevertheless, its broad use and reported synergistic effects prompted us to explore analytical methodologies for its determination in honeybees, especially after death incidents. Methods: The extraction of oxalic acid from bees was conducted by applying a simplified water extraction protocol. Oxalic acid′s content in honeybees was investigated through a novel zwiterionic hydrophilic interaction liquid chromatographic coupled to photo diode array (ZIC-HILIC-PDA) method and paralleled to gas/liquid chromatographic mass spectrometric methods. Results: The analytical method was validated, exhibiting a sufficient limit of quantification (LOQ) of 1.46 μg/g bee bw and precision and accuracy within the acceptable statistical limits as expressed by the relative standard deviation (RSD%) obtained from repeatability-reproducibility and recovery studies <12.5%. The application of the analytical method to 45 real honeybee samples demonstrated a fluctuation of oxalic acid’s concentrations from 1.6 to 1202.4 μg/g bee bw, verifying its frequent use in apiculture, exemplified by an overall 19% of positive samples. Conclusions: ZIC-HILIC-PDA proves a pivotal and alternative method to mass spectrometry tools in the determination of oxalic acid and other organic acids in honeybees and pertinent commodities.

1. Introduction

Oxalic acid (OA) is a simple non-aromatic organic acid naturally occurring in several food commodities (including honey) and possessing a plethora of applications. It is among beekeepers′ top choices for the battle of the parasitic mite Varroa destructor considering its efficacy [1], low cost, and easy application in the beehive environment [2]. That fact led to the development of several OA formulations that are efficacious even in the presence of bee brood [3]. In the same context, its proven efficacy has prompted researchers to extend its applications to combat other bee health threats such as Nosema ceranae [4].
Radenmacher and coworkers studied the effects of OA in bees. In their work, it was demonstrated that the lowest observed adverse effect level (LOAEL) after oral administration (72 h) was determined at 750 μg/g bee bw [5]. The same group reported that OA can provoke sublethal effects such as decreased longevity, although its mode of action is yet unknown. Martin-Hernández and coworkers reported that bee deaths in OA treated Apis mellifera iberiensis honeybees were significantly higher than in control bees [6], justifying an LD50 (48 h, contact) value of 5300 μg/g bee bw, while adult bee mortality was reported by other research groups [2,7] concomitantly with undesirable effects on brood development [8]. Despite OA′s relatively low toxicity to bees, malpractice and excessive use can potentially implicate it in the weakening of the bee colony [9], bee death incidents, or in toxicological effects through synergistic effects [10], leading to complaints by beekeepers about its effects. Thus, even though OA is one of the key options to control Varroa, and its extensive and broad use in apiculture is well documented, to our knowledge, there is only one report on the determination of OA in some anatomic structures of bees utilizing ion exclusion chromatography [11]. This prompted us to develop analytical methodologies to robustly determine it in bee bodies while also considering that single analyte (residue) methods still hold a substantial share of the portfolio of applications in chemical analysis. In this context, two principal methodologies were investigated and developed. The first one was an HPLC-photo diode array (PDA) method encompassing direct determination of OA using a zwitterionic (ZIC)- hydrophilic interaction liquid chromatographic (HILIC) column, and the second was a GC-MS method where OA was determined after derivatization with N, O-Bis(trimethylsilyl)trifluoroacetamide (BSTFA). With regard to other commodities, there is literature related to the determination of OA utilizing several analytical methods. LC-MS was used in root exudation [12], HPLC-UV in grapefruit pulps [13], ion chromatography and GC-MS in atmospheric particulates [14], and LC-MS in comparison with capillary electrophoresis in urine [15]. Concerning honey, which belongs to the matrices investigated by our group, it was not studied for OA residues due to the non-requirement of established maximum residue limit (MRL). The latter was an outcome of careful evaluation of dossier data by the Committee for Veterinary Medicinal Products (CVMP) of the European Agency for the Evaluation of Medicinal Products (EMEA) [16].
Consequently, in this work, the development and the validation of a ZIC-HILIC-PDA method for the determination of oxalic acid in bees is reported along with a comparative method utilizing GC-MS after derivatization. A similar ZIC-HILIC-PDA-electrospray ionization (ESI)/MS method was also exploited, assisted by a confirmatory HILIC tandem mass spectrometric method. In the end, the ZIC-HILIC-PDA method was applied in honeybee samples after reported death incidents in the context of elucidating OA occurrence in honeybees.

2. Materials and Methods

2.1. Chemicals

Oxalic acid (reagent plus, >99%) and the derivatization agent N, O-bis(trimethylsilyl)trifluoroacetamide (BSTFA) with 1% of trimethylchlorosilane were purchased from Sigma-Aldrich (St. Louis, MO, USA). Lactic acid (85% purity, food chemicals codex, FCC) was also obtained from Sigma-Alrdich (St. Louis, MO, USA). Acetonitrile and water were of HPLC-MS grade (Merck, Darmstadt, Germany), as was dichloromethane (DCM) (Fisher Scientific, Hampton, NH, USA). Anhydrous magnesium sulfate (MgSO4, extra pure) and ammonium acetate (HPLC grade) were purchased from Scharlau (Barcelona, Spain). Phosphate buffer was prepared from sodium phosphate dibasic and sodium phosphate monobasic monohydrate (both of analytical reagent grade obtained from Merck, Darmstadt, Germany) adjusting the pH to 6.5 using aqueous HCl (HCl 37%, obtained from Merck, Darmstadt, Germany) and NaOH (1 M) solutions (NaOH pellets purchased from Merck, Darmstadt, Germany). Chromafil® syringe Nylon filters (0.22 μm) were obtained from Macherey Nagel GmbH & Co. KG (Düren, Germany).

2.2. Stock and Working Standard Solutions

Stock standard solution of OA at 1000 μg/mL was prepared in water. For lactic acid, a respective solution was prepared in acetonitrile. Both solutions were stored at −18 °C. The working standard solutions were prepared after appropriate dilutions of the stock standard solutions and kept stored at −18 °C for 1 month.

2.3. Sample Preparation for HILIC Analysis

Honeybees (1 g) were crushed with 4 mL of water. The resulting slurry was homogenized for 5 min using a homogenizer at a rotation speed range of 20,500 rpm (Ultra-Turrax T25, Janke & Kunkel, IKA® Labortechnik, Staufen, Germany). Consequently, the mixture was subjected to ultrasonication at room temperature (Grant Instruments, Shepreth, Cambridgeshire, UK) for 20 min. Then, the mixture was centrifuged at 4500 rpm for 15 min (10 °C); the supernatant was decanted, dried using anhydrous MgSO4, and filtered (0.22 μm, Nylon filters) to provide the final extract that was injected into the chromatographic system.

2.4. High-Performance Liquid Chromatography Coupled to Photo Diode Array

A Shimadzu (Kyoto, Japan) LCMS-2010 EV Liquid Chromatograph Mass Spectrometer instrument was used with the LabSolutions LCMS solution version 3.41 software (Shimadzu, Kyoto, Japan) consisting of an SIL-20A prominence autosampler and an SPD-M20A diode array detector. The latter was coupled in a series with a mass selective detector equipped with an atmospheric pressure ionization source utilizing the ESI interface. The LC separation was achieved on a ZIC®-HILIC, 3.5 μm (100 Å), 150 × 4.6 mm i.d. chromatographic column (Merck, Darmstadt, Germany). The mobile phase consisted of two channels, channel (A) pure acetonitrile and channel (B) phosphate buffer (pH = 6.5). The flow rate was set at 0.8 mL min−1 using an isocratic system of 70% A, 30% B. The overall runtime was set at 25 min. Photodiode array monitored wavelengths from 190 to 800 nm. Peak identification was accomplished by comparing the retention times of samples with those of standard and spike solutions.

2.5. Liquid Chromatography Mass Spectrometry

ESI in the negative mode (ESI) was utilized when MS was investigated as a tool to detect OA. MS parameters were the following: curved desolvation line (CDL) temperature 200 °C, heat block temperature 200 °C, nebulizing gas flow rate 1.5 L/min, and detector voltage 2.3 kV. Selected ion monitoring mode (SIM) was chosen, monitoring the [M-H] ion of OA at 89 m/z (quantitation ion) and the negatively charged molecular ion at 90 m/z (confirmation ion, event time for OA was set at 1 s). In that case, the mobile phase consisted of two channels, channel (A) pure acetonitrile and channel (B) ammonium acetate buffer, 40 mM (pH = 6.5). The rest of the chromatographic conditions were identical to those of the HILIC-PDA method. Acquisition and subsequent processing of data were performed using the software mentioned in Section 2.4.

2.6. Liquid Chromatography Tandem Mass Spectrometry

An Agilent Technologies 6410 Triple Quad LC/MS system was used (Santa Clara, CA, USA), equipped with a nitrogen gas generator (Parker, Cleveland, OH, USA). The LC separation was achieved after injecting 10 μL of the sample. Two multiple reaction monitoring (MRM) transitions (precursor to product ion) at specific fragmentor/collision energies were designated for OA (precursor ion at 89.1 m/z, quantitation ion at m/z 61.2, confirmation at m/z 45.3, see also Figures S5–S6 and Table S1). Mobile phase and chromatographic conditions were identical to those mentioned in Section 2.5, though a lower flow rate at 0.5 mL/min was applied. Nitrogen was used as nebulizer and collision gas. For instrument control, Agilent Mass Hunter data acquisition Triple Quad B.01.04 was used (Agilent Technologies, Santa Clara, CA, USA), and for data processing, Agilent MassHunter Workstation Qualitative Analysis B.01.04. was used (Agilent Technologies, Santa Clara, CA, USA).

2.7. GC-MS Derivatization

The derivatization procedure was as follows. (a) Spiking: OA (1 equivalent) was spiked in 0.5 g of relatively dry honeybees (bees were folded with paper towel, medium pressure applied, and then positioned inside a jar where additional heat was applied). Consequently, 1 mL of acetonitrile was added, and the resulting mixture was homogenized for 1 min (Ultra-Turrax). Then, in this slurry, BSTFA was added (5 equivalent), and the mixture was heated and agitated for 4 h at 60 °C and then for 14 h under room temperature. Then, the reaction was diluted with DCM (1 mL), and the resulting mixture was filtered (0.22 μm, Nylon filters) and then subjected to GC-MS analysis (full scan and SIM mode; for chromatographic conditions and GC-MS instrumentation, see Supplementary material); (b) Real samples: the same with (a) but using a higher excess of BSTFA (50 equivalent).

2.8. Validation of the Present Method

The developed method was validated mainly following the International Conference on Harmonization guidelines [17]. Validation study was performed regarding recovery, linearity, intra-day, and inter-day precision. The linearity was assessed by calculating the correlation coefficient r, which should have been ≥0.99, and the back calculated concentrations in respect to the true concentrations with an acceptable deviation of ≤±20%. The calibration curve was established using the dilute standard solution of OA ranging from 1–1000 μg/mL. The selected range was decided considering principally the analytical performance of the method and the reported toxicological endpoints of OA for bees. Blank experiments were also conducted (complete procedure without matrix extract). Accuracy was determined via the conduction of a recovery study at three concentration levels (n = 3).
In the same context, the precision of the chromatographic method was expressed as the relative standard deviation (RSD) percentage of the repeatability (intra-day) and the intermediate precision (inter-day) analyses (n = 3) over 1, 2, and 3 days. Repeatability and intermediate precision were considered acceptable when relative standard deviation values (RSD%) were <20%.
For the calculation of the limit of detection (LOD) and the limit of quantification (LOQ), a calibration plot for OA was established at the above reported range using matrix matched calibration standards prepared from blank bees corresponding extract. The LOD was defined as 3.3(Sy/x)/b and the LOQ as 10(Sy/x)/b, where Sy/x was the residual standard deviation of the response, and b was the slope of the calibration curve.
To estimate if the matrix considerably impacted the peak area and therefore the sensitivity of OA, the slopes of the calibration lines obtained for honeybees after standard addition (bmatrix) and the solvent (bsolvent) were divided to determine the matrix factor and the percentage of matrix effect (ME) calculated by Equation (1).
% M E = ( 1 b m a t r i x b s o l v e n t ) × 100

2.9. Statistical Analysis

Regression analysis was performed using XLSTAT premium software 19.03 version (Addinsoft inc, Long Island City, NY, USA).

3. Results and Discussions

3.1. Analytical Method

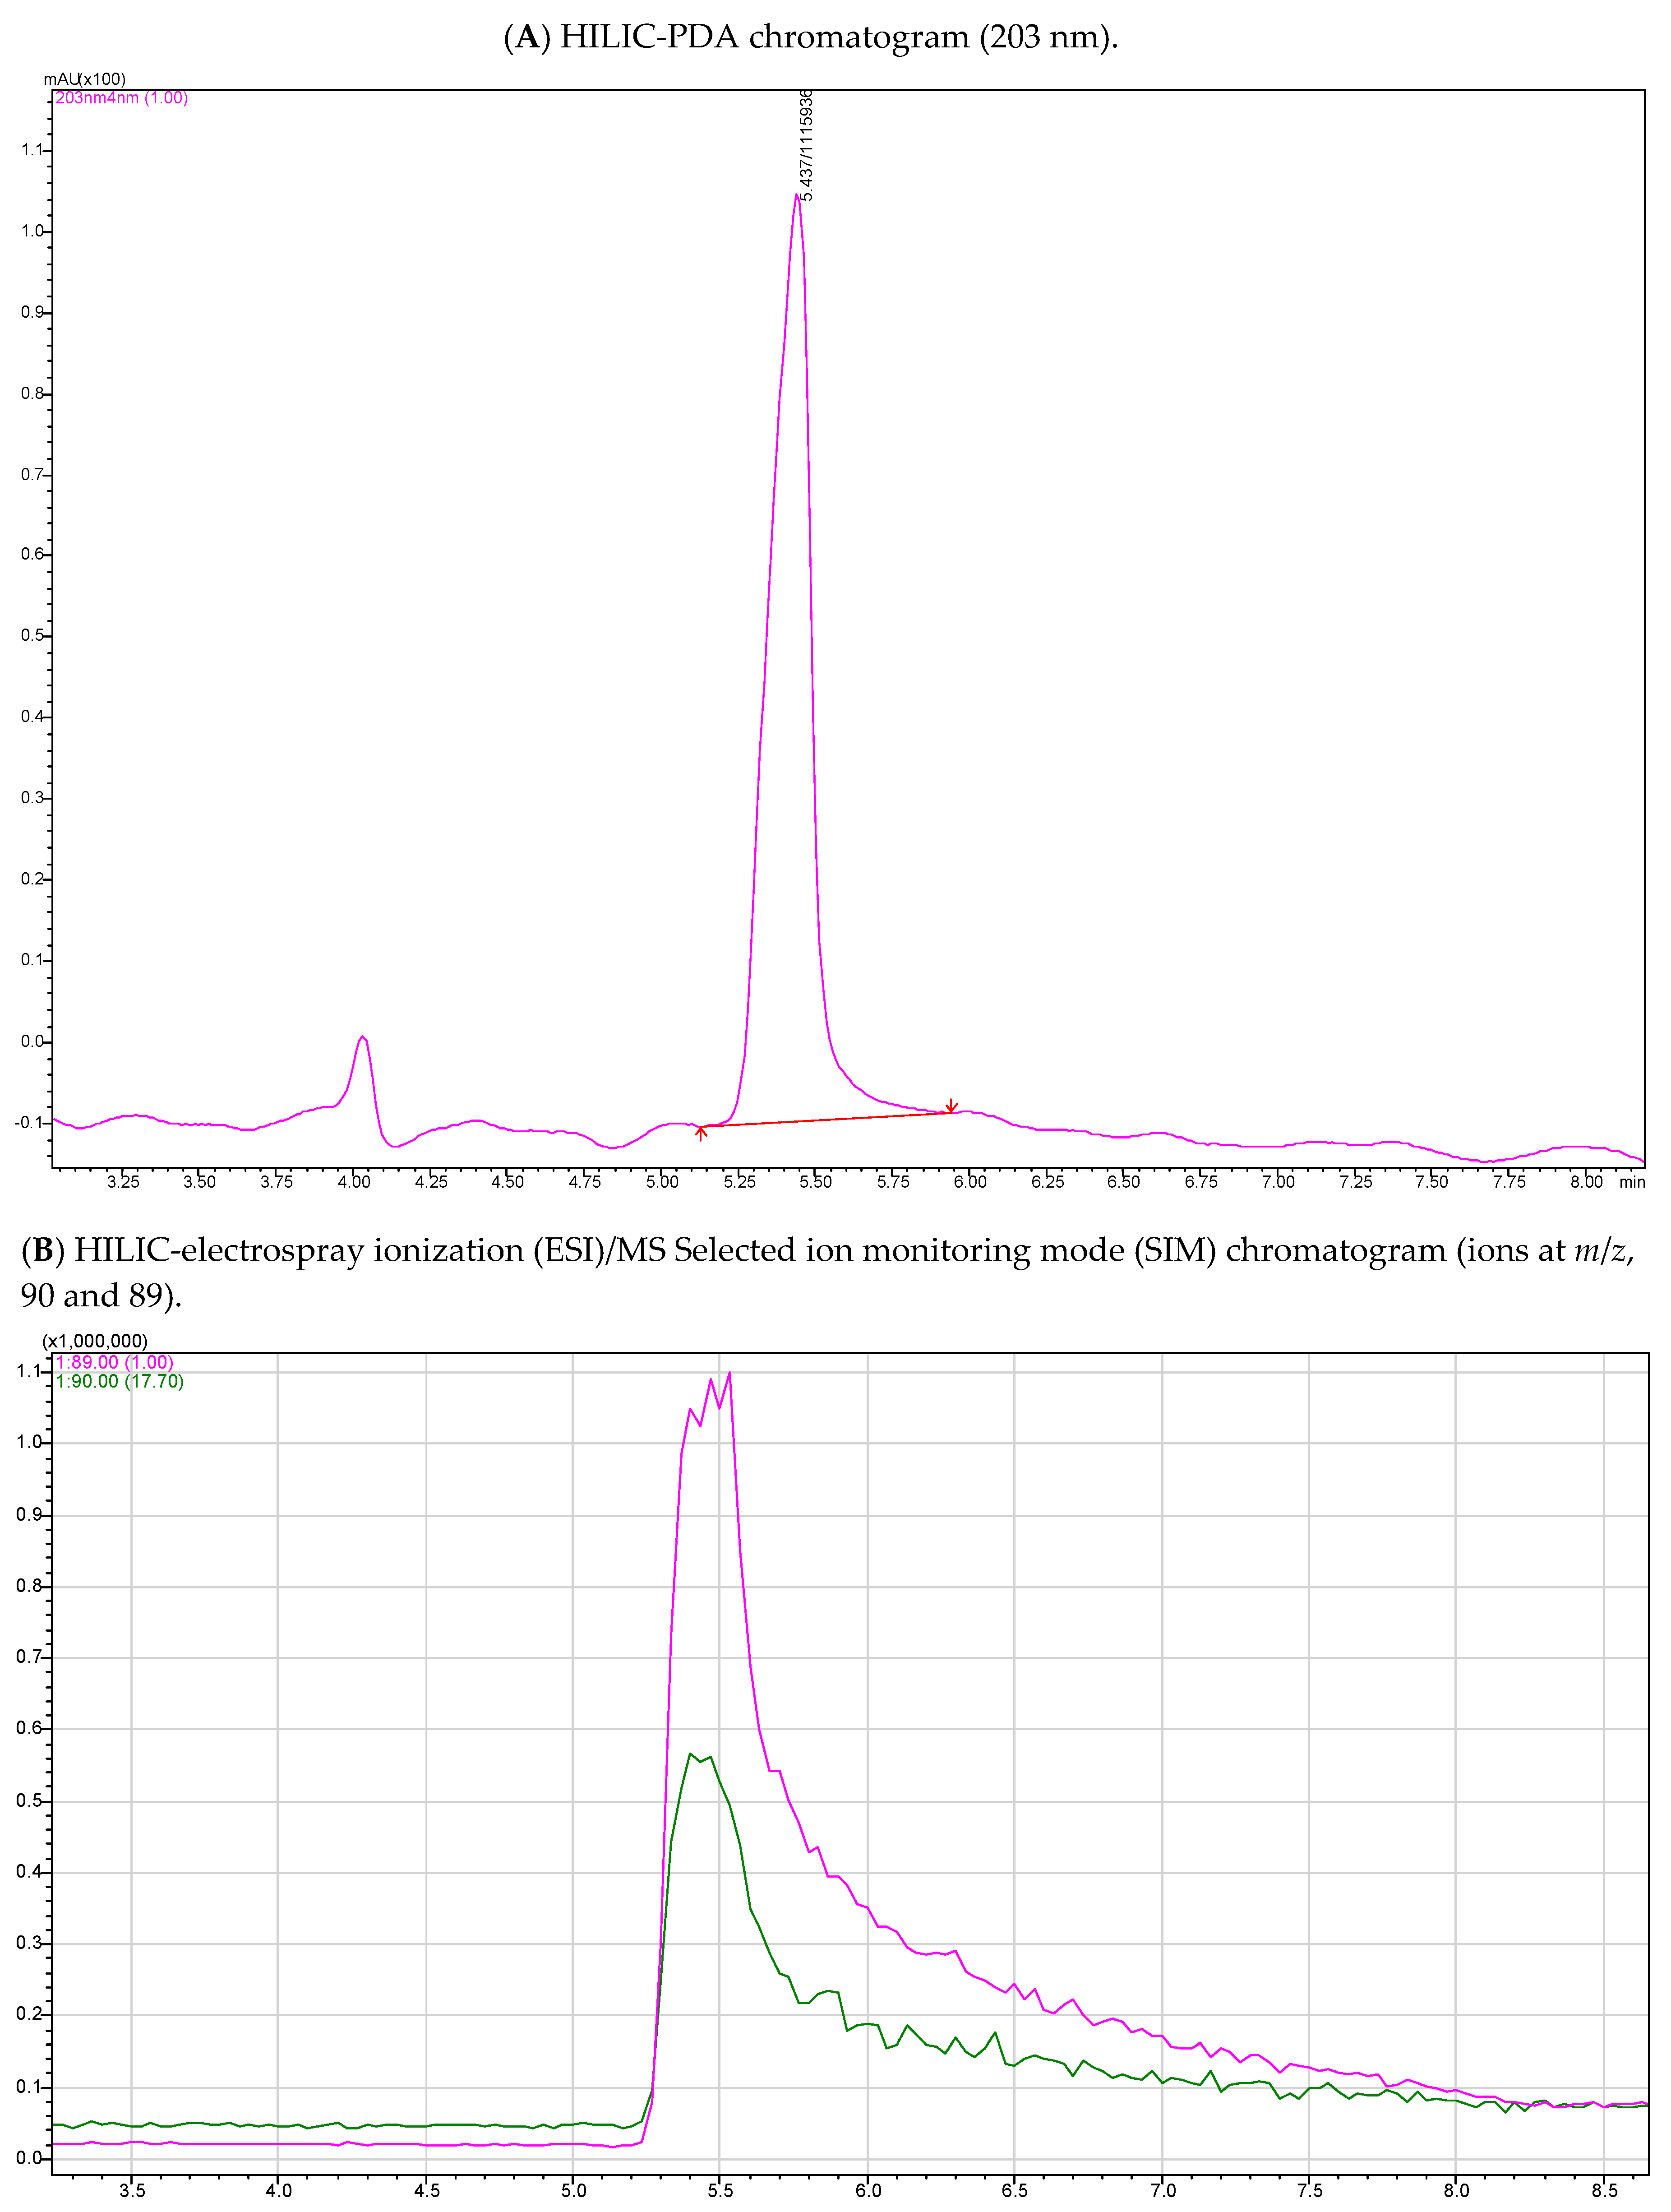
HILIC chromatography is gaining ground in the field of analysis of highly polar compounds. Multiresidue schemes include HILIC conditions due to the unambiguous benefits in the high resolution separation of polar compounds and the respective chromatographic performance [18]. Besides, the exploitation of the photo diode array (PDA) in routine chemical analysis still constitutes an essential tool that can meet both sensitivity and selectivity requirements of modern chemical analysis, even for demanding matrices [19]. The latter was verified in this work, where PDA managed to detect OA with fit for purpose LOD and LOQ with a retention time of 8.5 min (see Figure 1 for respective chromatogram, and Table 1 for regression parameters, LOD and LOQ values). Two optimum UV wavelengths were selected at 203 and 220 nm, with the first providing better LODs and LOQs and the second delivering more smooth chromatograms (better baseline). The LOD was determined at 0.48 µg/g and the LOQ at 1.46 µg/g (calculated using values obtained at 203 nm).
The method was linear in the range of 1–1000 μg/mL with a correlation coefficient value r = 0.99959 (at 203 nm) and back calculated concentrations in the calibration curves not exceeding 5.2% of the nominal values. To ensure that no interference of the control bees extracts occurred in the designated retention time of OA, several control bee samples were extracted and injected in the chromatographic system, verifying the absence of interfering peaks in the retention time of OA (see Figures S1 and S2). With regard to the ME, it was negligible (calculated at −2.4%).
Although not definitive, the peak purity index (spectra peak purity) as furnished by the HPLC software indicated that the peak eluting in the retention time of OA comprised a homogenous peak (see Supplementary Material Figure S4 for a peak purity curve). Since MS is the golden standard technique to detect and quantify residues of a plethora of chemicals, it was assessed in the current work. In this direction, an HILIC-PDA-ESI/MS was concurrently developed following the chromatographic conditions of the HILIC-PDA method. The only modification was the substitution of the phosphate buffer by an ammonium acetate based buffer, since phosphate salts are non-volatile and tend to clog the MS, building up around the ESI cone. Even if they need to be used to function under MS conditions, they need specific interfaces that can counteract such problems, though not streamlined [20].
Nevertheless, the HILIC-PDA-ESI/MS method provided comparable LOD-LOQ with the HILIC-PDA method (with phosphate buffer). The latter was mostly attributed to the relatively difficult ionization of OA under the single quadrupole electrospray conditions. In this context, the use of ammonium acetate buffer provided a shorter retention time for OA at 5.5 min (see Figure 2) [21], and a second confirmation ion (at m/z, 90) apart from the deprotonated ion at m/z 89, which constitutes an advantage of this method, since there were works in which OA failed to ionize even under triple quadrupole conditions using ESI [22]. A third diagnostic ion that some guidelines [23] require for mass spectrometric confirmation in SIM mode could not be generated. Although there are published works [24,25] in which SIM with up to two diagnostic ions was applied, additional fragmentation using tandem HILIC-MS/MS conditions was pursued only for extra confirmation (this method exhibited an almost identical LOQ at 1.3 μg/g), since the LOD and the LOQ of the proposed method were deemed sufficient, and insignificant ME and high selectivity were encountered.
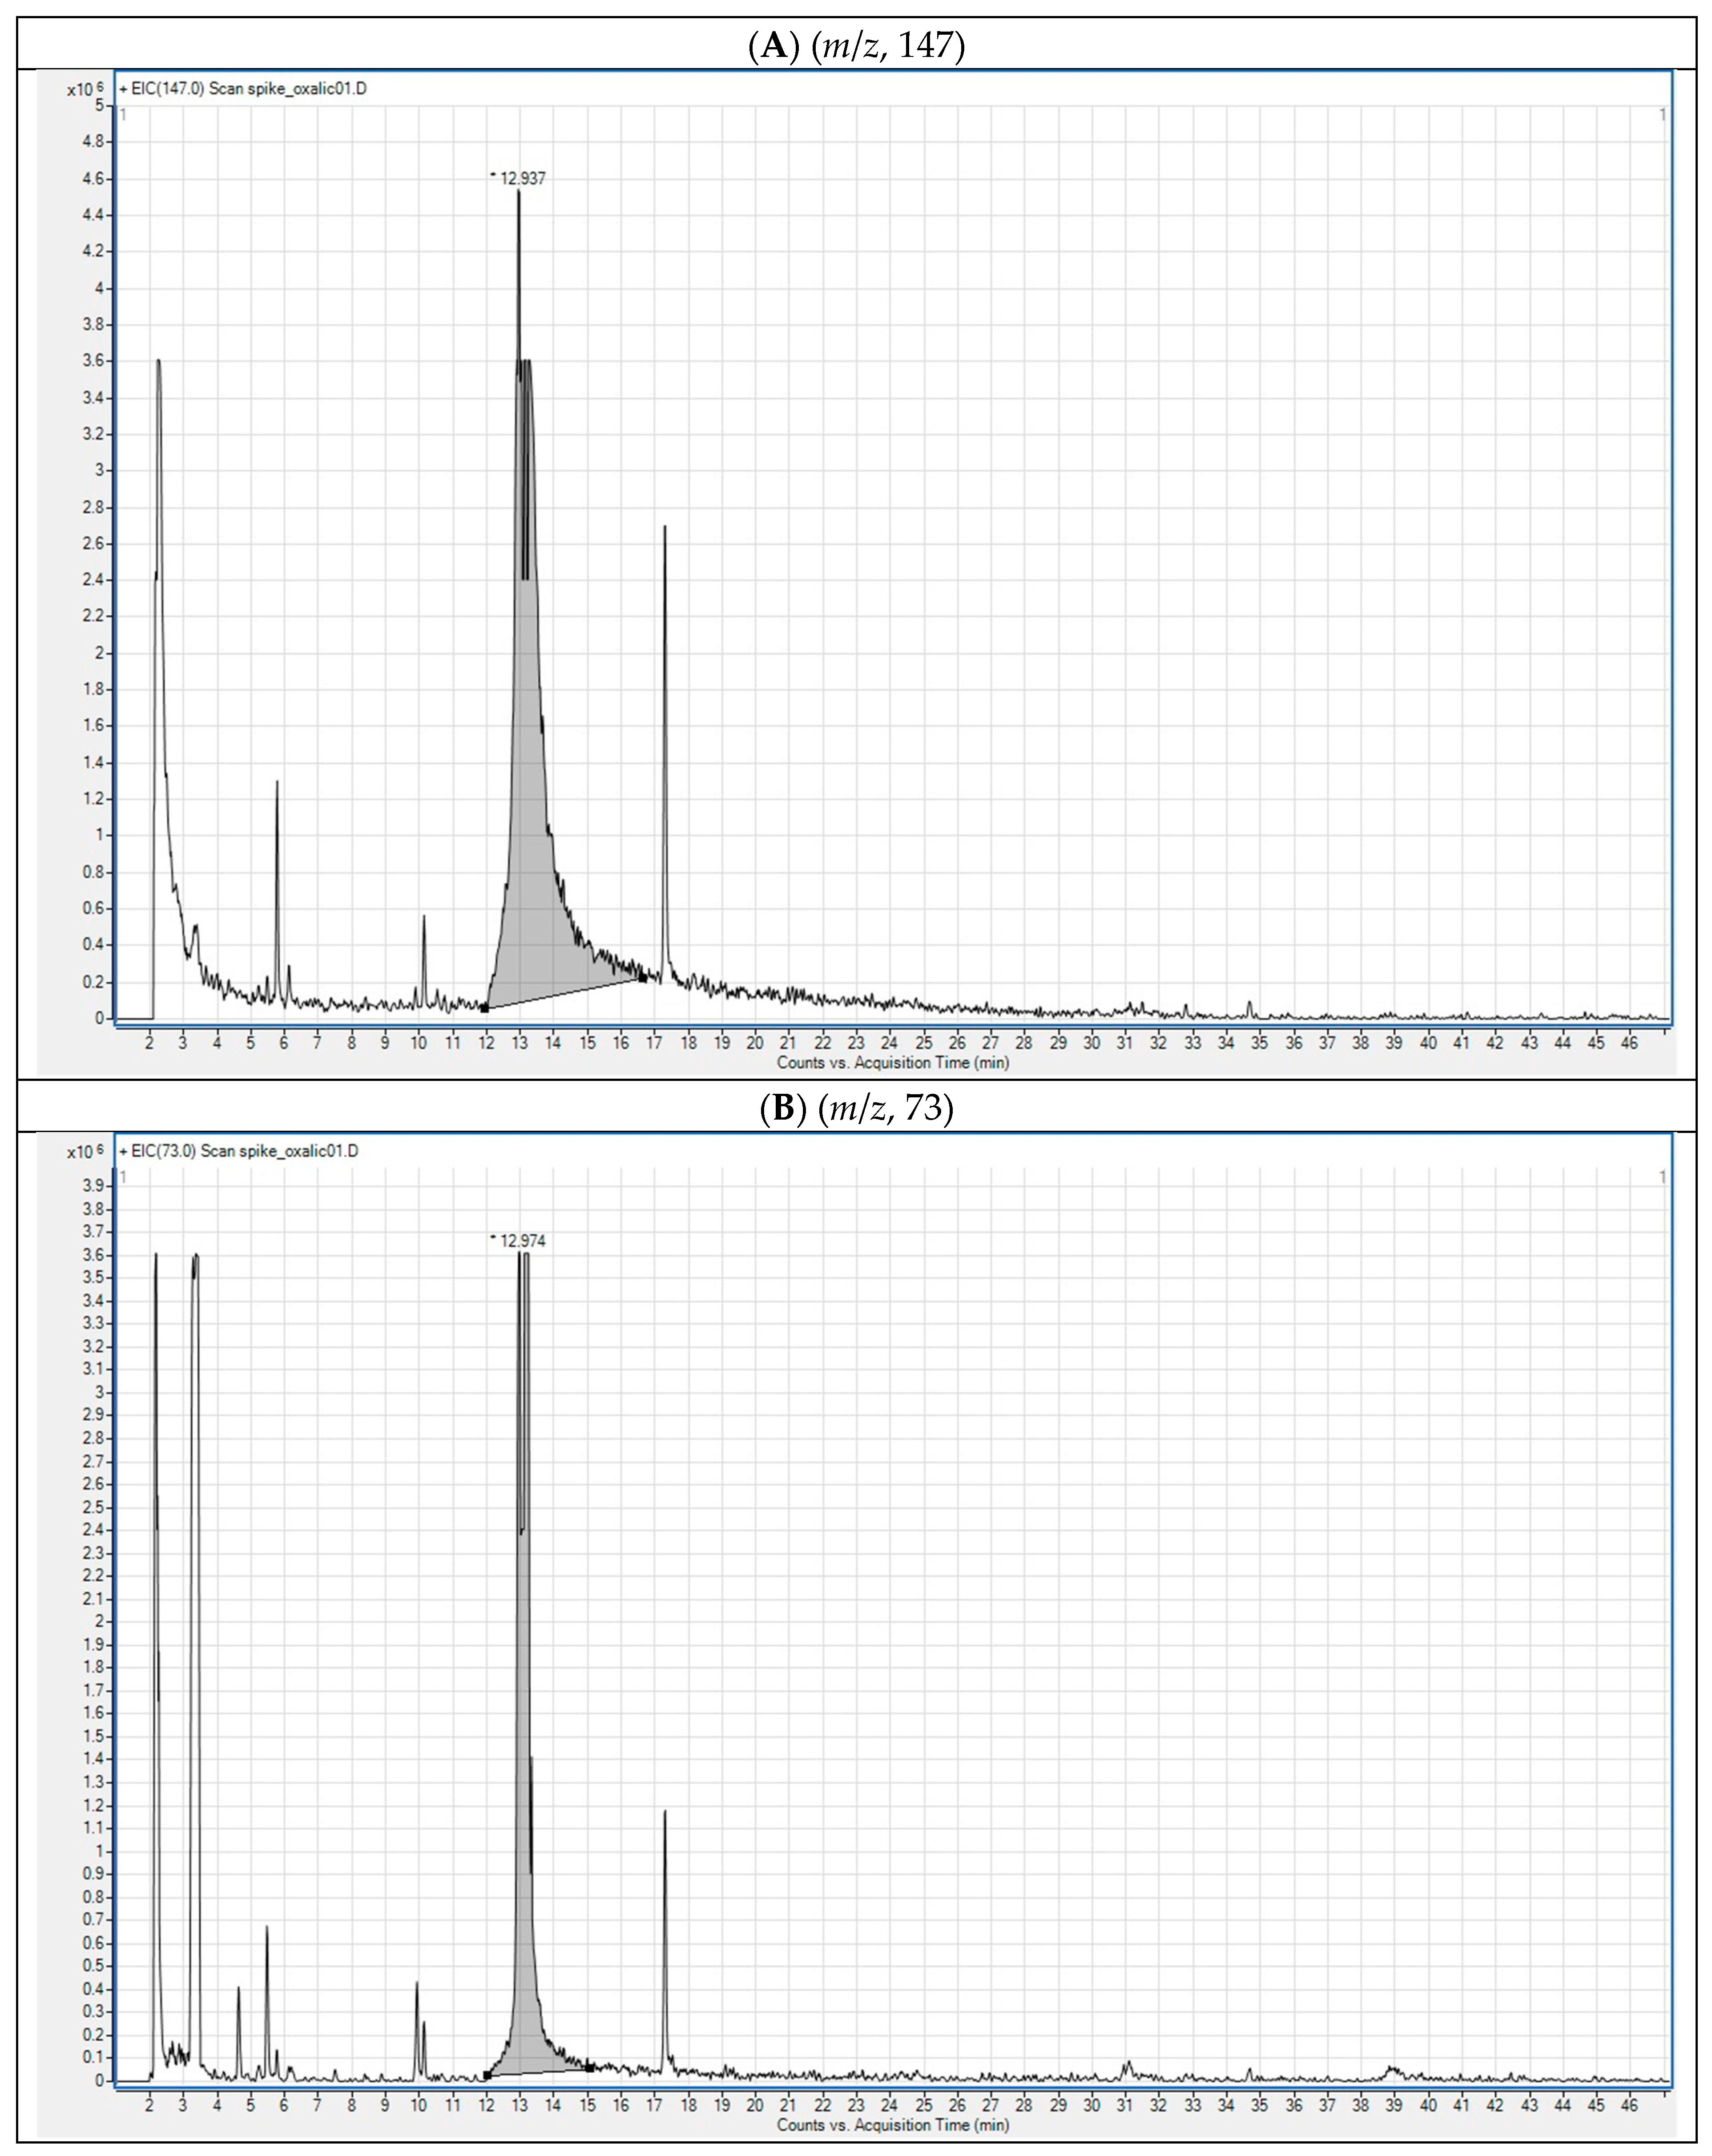
With regard to GC-MS applicability for the scope of this work (see Figure 3 for indicative extracted ion chromatograms), it was finally not selected to be used on a routine basis due to the less straightforward sample preparation step and the analogous sensitivity compared to the HILIC-PDA method [26].
Consequently, the presented HILIC-PDA and HILIC-PDA-ESI/MS methodologies exhibit certain advantages compared to methods developed for OA in other commodities. More specifically, the extraction protocol is simplified with no need to proceed with laborious derivatization under liquid chromatography conditions, which was an approach applied by some groups when such conditions were embraced [12]. In addition, the detection of OA without the interference of common background ions is also a major advantage of this work, considering that the latter was an obstacle in previously published works in the frame of elucidating instrumental LODs for mono- and dicarboxylic acids using GC, LC-MS [27].
Last but not least, within the presented liquid chromatography methods—and to avoid any misinterpretation in the results—lactic acid was also evaluated. The latter was decided upon since it is a molecule that shares the same molecular weight and common mass fragments with OA [28] and was reported to be used for the same scope against Varroa destructor with far less frequency [29]. Lactic acid’s chromatographic profile verified the absence of any overlapping OA (a fact expected due to the different polarities of the two molecules), demonstrating discrete retention times at 2.8 and 3.3 min in the HILIC-PDA and the HILIC-PDA-ESI/MS systems, respectively (see Figures S6–S8). Preliminary attempts to further clean up the extracts using solid-phase extraction (SPE, with C18 material) did not substantially suppress the peaks eluting prior to 4 min; however, the latter did not impact OA analysis.

3.2. Application of the Method to Real Samples

The ZIC-HILIC-PDA analytical method was applied to real honeybee samples in the effort to screen OA in honeybees after death incidents. Out of the total 45 samples examined, 19% were positive with OA residues, verifying its broad use in apiculture. In the samples, the concentrations varied from 1.5 to 1202.4 μg/g bee bw. In only three cases, a surplus of the ascribed benchmark dose of LOAEL (after oral administration) was evidenced, indicating possible misuse or excessive use of the OA inside the hive. Comparison with the reported contact LD50, [6] did not unveil exceedance of this value. Overall, the detection of OA inside the hive should not be neglected, considering that OA is among the compounds reported for synergistic effects (along with other acaricides) against honeybees [10]. Such synergies can further be reinforced, considering that OA was simultaneously detected with the pyrethroid acaricide, tau-fluvalinate (using a multiresidue method), [30] whose toxicity is reported to be augmented by the presence of OA.

4. Conclusions

Oxalic acid was efficiently determined in honeybees after death incidents by applying a novel ZIC-HILIC-PDA method, which was fully validated and presented acceptable analytical figures of merit. A substantial range of concentrations was evidenced in real honeybee samples, from 1.6 to 1202.4 μg/g bee bw, with 19% positive samples. These results combined with the previous results of our group (from the same bee samples) add a pillar to the synergies between active substances with acaricidal activity and other classes of substances. The next steps will involve further exploitation of the method by incorporating other organic acids and consideration for further improvements on the sensitivity of mass spectrometric features of this work by encompassing additional purification strategies.

Supplementary Materials

The following are available online at https://www.mdpi.com/2297-8739/6/4/48/s1, GC-MS system and operating conditions, Figure S1: HILIC-UV chromatogram of a blank honeybee sample extract, Figure S2: Magnified HILIC-UV chromatogram of a blank honeybee sample, Figure S3: HPLC-UV chromatogram of a standard solution of oxalic acid at 20 μg/mL, Figure S4: Peak purity curve obtained for a positive bee sample in OA, Figure S5: TIC, MRM chromatograms of a OA positive bee sample, Figure S6: TIC, MRM chromatograms of a control bee sample, Figure S7: Full scan GC-MS total ion chromatogram of derivatized OA standard in ACN at 1 μg/mL, Figure S8: HILIC-PDA chromatogram of a standard mixture of OA and LA at 10 μg/mL (using phosphate buffer), Figure S9: HILIC-PDA chromatogram of LA and OA in standards solution mix (using ammonium acetate buffer), Figure S10: HILIC-ESI/MS SIM chromatogram of LA and OA in standards solution mix (using ammonium acetate buffer).

Author Contributions

Conceptualization, K.M.K. and K.M.; Methodology, K.M.K.; Sample preparation-analysis, K.M.K. and E.M.-K.; Investigation, K.M.K. and E.M.-K.; Data curation, K.M.K. and E.M.-K.; Writing—original draft preparation, K.M.K.; Writing—review and editing, K.M.K. and K.M.

Funding

This research received no external funding.

Conflicts of Interest

The authors declare no conflict of interest.

References

  1. Imdorf, A.; Charriere, J.D.; Bachofen, B. De l’utilisation de l’acide oxalique comme varroacide. Apiacta 1997, 32, 89–91. [Google Scholar]
  2. Coffey, M.F.; Breen, J. The efficacy and tolerability of api-bioxal as a winter varroacide in a cool temperate climate. J. Apicult. Res. 2016, 55, 65–73. [Google Scholar] [CrossRef]
  3. Maggi, M.; Tourn, E.; Negri, P.; Szawarski, N.; Marconi, A.; Gallez, L.; Medici, S.; Ruffinengo, S.; Brasesco, C.; De Feudis, L.; et al. A new formulation of oxalic acid for varroa destructor control applied in apis mellifera colonies in the presence of brood. Apidologie 2016, 47, 596–605. [Google Scholar] [CrossRef]
  4. Nanetti, A.; Rodriguez-Garcia, C.; Meana, A.; Martin-Hernandez, R.; Higes, M. Effect of oxalic acid on nosema ceranae infection. Res. Vet. Sci. 2015, 102, 167–172. [Google Scholar] [CrossRef]
  5. Rademacher, E.; Harz, M.; Schneider, S. Effects of oxalic acid on apis mellifera (hymenoptera: Apidae). Insects 2017, 8, 84. [Google Scholar] [CrossRef]
  6. Martin-Hernandez, R.; Higes, M.; Perez, J.L.; Nozal, M.J.; Gomez, L.; Meana, A. Short term negative effect of oxalic acid in apis mellifera iberiensis. Span. J. Agric. Res. 2007, 5, 474–480. [Google Scholar] [CrossRef]
  7. Al Toufailia, H.; Scandian, L.; Ratnieks, F.L.W. Towards integrated control of varroa: 2 comparing application methods and doses of oxalic acid on the mortality of phoretic varroa destructor mites and their honey bee hosts. J. Apicult. Res. 2015, 54, 108–120. [Google Scholar] [CrossRef]
  8. Higes, M.; Meana, A.; Suarez, M.; Llorente, J. Negative long-term effects on bee colonies treated with oxalic acid against varroa jacobsoni oud. Apidologie 1999, 30, 289–292. [Google Scholar] [CrossRef]
  9. Charriere, J.D.; Imdorf, A. Nouveaux résultats des essais de traitements à l’acide oxalique par dégouttement. Santé de l’Abeille 1999, 174, 335–343. [Google Scholar]
  10. Johnson, R.M.; Dahlgren, L.; Siegfried, B.D.; Ellis, M.D. Acaricide, fungicide and drug interactions in honey bees (apis mellifera). PLoS ONE 2013, 8, e54092. [Google Scholar] [CrossRef]
  11. Nozal, M.J.; Bernal, J.L.; Gomez, L.A.; Higes, M.; Meana, A. Determination of oxalic acid and other organic acids in honey and in some anatomic structures of bees. Apidologie 2003, 34, 181–188. [Google Scholar] [CrossRef] [Green Version]
  12. Jaitz, L.; Mueller, B.; Koellensperger, G.; Huber, D.; Oburger, E.; Puschenreiter, M.; Hann, S. LC-MS analysis of low molecular weight organic acids derived from root exudation. Anal. Bioanal. Chem. 2011, 400, 2587–2596. [Google Scholar] [CrossRef] [PubMed]
  13. Zheng, H.; Zhang, Q.; Quan, J.; Zheng, Q.; Xi, W. Determination of sugars, organic acids, aroma componenets, and carotenoids in grapefruit pulps. Food Chem. 2016, 205, 112–121. [Google Scholar] [CrossRef] [PubMed]
  14. Yang, L.; Yu, L.E. Measurement of oxalic acid, oxalates, malonic acid and malonates in atmospheric paticulates. Environ. Sci. Technol. 2008, 42, 9268–9275. [Google Scholar] [CrossRef] [PubMed]
  15. Ortega Madueño, I.; Illana Cámara, F.J.; Torrejón Martínez, M.J.; Díaz González, M.C.; Arroyo Fernández, M. Development and validation of an HPLC-MS method for a simultaneous measurement of oxalate and citrate in urine. Rev. Lab. Clin. 2016, 9, 93–97. [Google Scholar] [CrossRef]
  16. Rademacher, E.; Imdorf, A. Legalization of the use of oxalic acid in varroa control. Bee World 2004, 85, 70–72. [Google Scholar] [CrossRef]
  17. ICH. Validation of Analytical Procedures: Text and Methodology q2(r1). 2005. Available online: http://www.ich.org/fileadmin/Public_Web_Site/ICH_Products/Guidelines/Quality/Q2_R1/Step4/Q2_R1__Guideline.pdf (accessed on 10 February 2019).
  18. Danezis, G.P.; Anagnostopoulos, C.J.; Liapis, K.; Koupparis, M.A. Multi-residue analysis of pesticides, plant hormones, veterinary drugs and mycotoxins using hilic chromatography-ms/ms in various food matrices. Anal. Chim. Acta 2016, 942, 121–138. [Google Scholar] [CrossRef]
  19. Morales-Trejo, F.; Leon, S.V.Y.; Escobar-Medina, A.; Gutierrez-Tolentino, R. Application of high-performance liquid chromatography-uv detection to quantification of clenbuterol in bovine liver samples. J. Food Drug Anal. 2013, 21, 414–420. [Google Scholar] [CrossRef]
  20. WATERS. Available online: http://www.waters.com/webassets/cms/library/docs/amd09.Pdf (accessed on 20 April 2019).
  21. Buffer. Available online: https://www.sielc.com/wp-content/uploads/2015/11/sielc_august_2004.Pdf (accessed on 10 May 2019).
  22. Moldoveanu, S.C.; Poole, T. An LC-MS method for the analysis of some organic acids in tobacco leaf, snus and wet snuff. Beitr. Tabakforsch Int. 2018, 1, 30–41. [Google Scholar] [CrossRef]
  23. SANTE/11813/2017. Guidance Document on Analytical Quality Control and Method Validation Procedures for Pesticides Residues Analysis in Food and Feed; DG Sante, European Commission: Brussels, Belgium, 2017. [Google Scholar]
  24. Ji, W.; Zhang, Q.; Hu, L. Development of a simple LC-MS assay for determination of regorafenib in rat plasma and its application to a pharmacokinetic study. Lat. Am. J. Pharm. 2014, 33, 607–612. [Google Scholar]
  25. Sun, J.; Zhang, F.; Peng, Y.; Liu, J.; Zhong, Y.; Wang, G. Quantitative determination of diterpenoid alkaloid Fuziline by hydrophilic interaction liquid chromatography (HILIC)–electrospray ionization mass spectrometry and its application to pharmacokinetic study in rats. J. Chromatogr. B Anal. Technol. Biomed. Life Sci. 2013, 913–914, 55–60. [Google Scholar] [CrossRef] [PubMed]
  26. Simal-Gandara, J.; Paseiro-Losada, P.; Rodriguez, V.G.; Romero-Rodriguez, A. Comparison of gc-ms and hplc-uv for determination of procymidone in wine. J. Agric. Food Chem. 1993, 41, 674–677. [Google Scholar] [CrossRef]
  27. Šťávová, J.; Beránek, J.; Nelson, E.P.; Diep, B.A.; Kubátová, A. Limits of detection for the determination of mono- and dicarboxylic acids using gas and liquid chromatographic methods coupled with mass spectrometry. J. Chromatogr. B Anal. Technol. Biomed. Life Sci. 2011, 879, 1429–1438. [Google Scholar] [CrossRef] [PubMed] [Green Version]
  28. Schriewer, A.; Brink, M.; Gianmoena, K.; Cadenas, C.; Hayen, H. Oxalic acid quantification in mouse urine and primary mouse hepatocyte cell culture samples by ion exclusion chromatography-mass spectrometry. J. Chromatogr. B Anal. Technol. Biomed. Life Sci. 2017, 1068–1069, 239–244. [Google Scholar] [CrossRef] [PubMed]
  29. Kraus, B.; Berg, S. Effect of a lactic-acid treatment during winter in temperate climate upon varroa-jacobsoni oud and the bee (apis-mellifera l) colony. Exp. Appl. Acarol. 1994, 18, 459–468. [Google Scholar] [CrossRef]
  30. Kasiotis, K.M.; Tzouganaki, Z.D.; Machera, K. Chromatographic determination of monoterpenes and other acaricides in honeybees: Prevalence and possible synergies. Sci. Total Environ. 2018, 625, 96–105. [Google Scholar] [CrossRef] [PubMed]
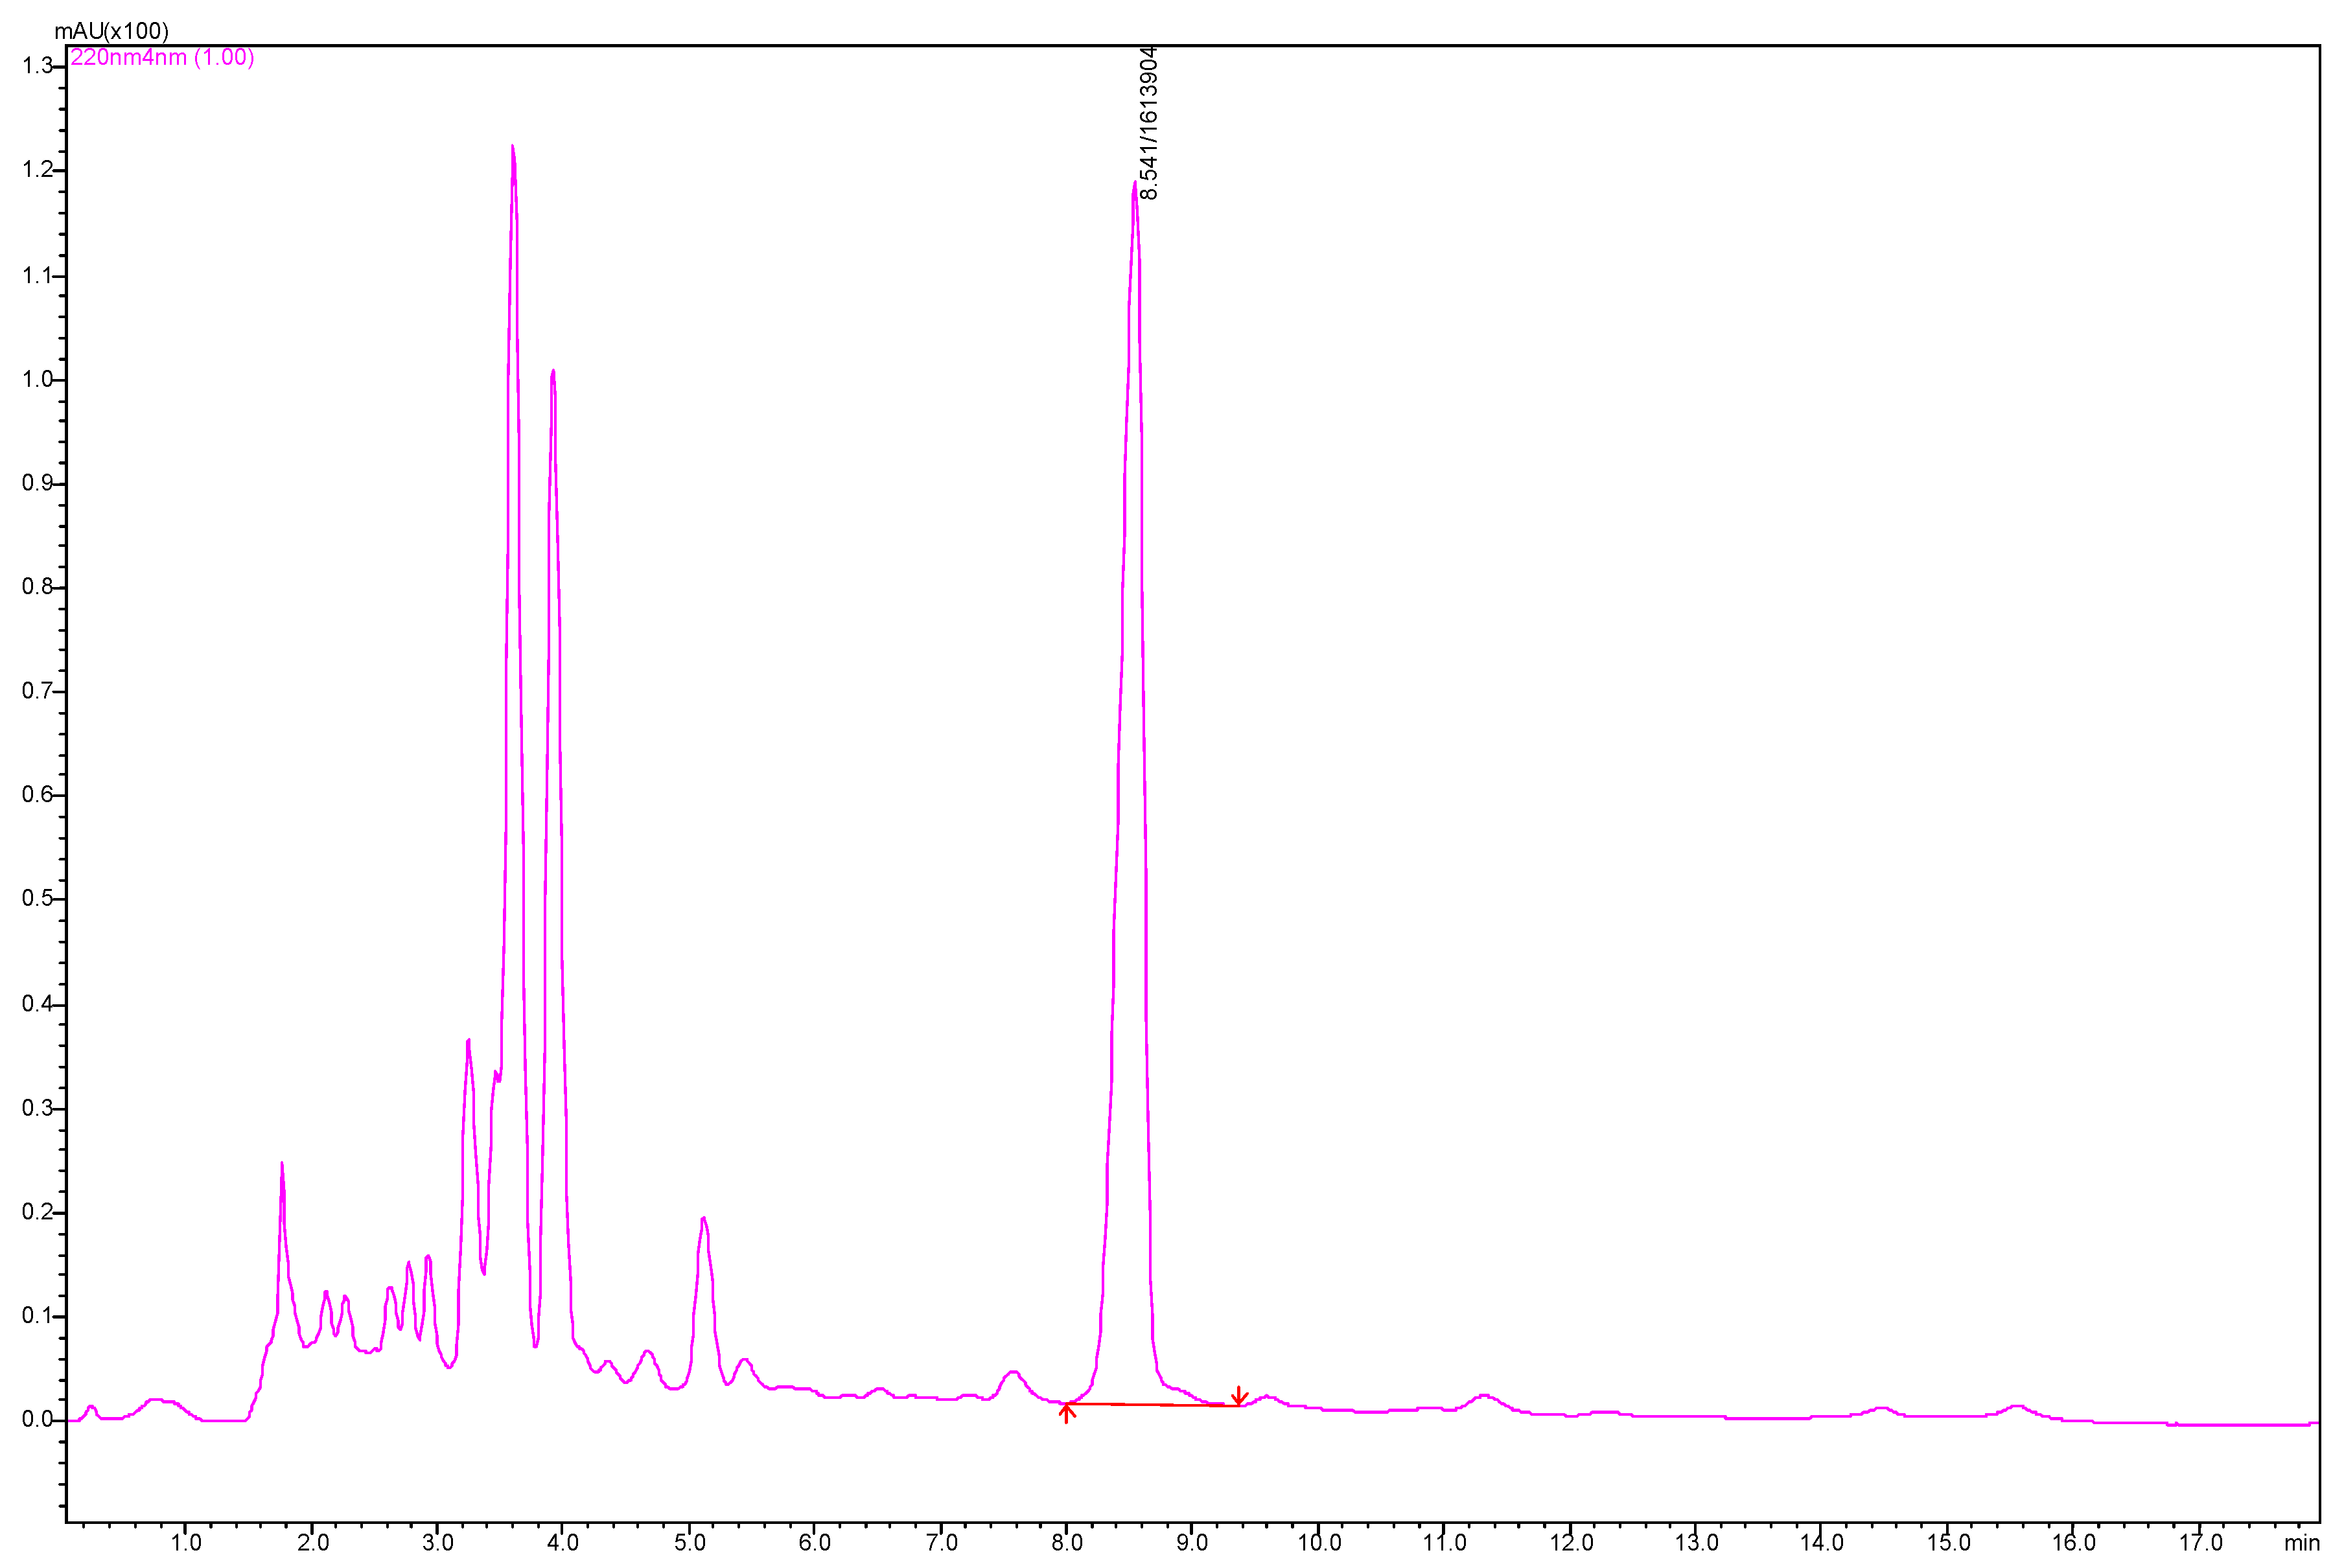
Figure 1. HILIC-photo diode array (PDA) chromatogram (220 nm) of a bee sample positive to oxalic acid (OA).
Separations 06 00048 g001
Figure 2. Magnified HILIC-PDA (A) and HILIC-ESI/MS SIM (B) chromatograms of a standard OA solution at 40 μg/mL.
Separations 06 00048 g002
Figure 3. GC-MS extracted ion chromatograms (A,B) of a spiked derivatized OA bee sample at 1 μg/mL.
Separations 06 00048 g003
Table 1. Regression parameters, limit of detection (LOD), limit of quantification (LOQ), recovery and repeatability validation results.
(a ± Sa)(b ± Sb)rLOD (μg/g)LOQ (μg/g)
5826.8 ± 655.713546.1 ± 91.80.999590.481.46
SamplesSpiking level (μg/g)Recovery % ± RSD, n = 3Repeatability
Intra-d (RSD%)Inter-d (RSD%)
Honeybees188.9 ± 12.58.210.4
1091.4 ± 9.26.99.2
10083.2 ± 5.96.35.9
RSD: relative standard deviation.