Abstract
Activated carbons (ACs) are employed in the nuclear industry to mitigate the emission of potential radioactive iodine species. Their retention performances towards iodine are mainly dependent on the relative humidity due to the competitive effect induced by adsorbed water molecules. Thus, this work will focus on the prediction of AC behavior toward the capture of water vapor to better assess the poisoning effect on radiotoxic iodine removal. For the first time, H2O breakthrough curves (BTCs) on nuclear grade ACs are predicted through a specific methodology based on the combination of transport phenomena with adsorption kinetics and equilibrium. Three ACs, similar to those deployed in the nuclear context, are considered within the present study. Our model is based on the Linear Driving Force Model (LDF), governed by an intraparticle diffusion mechanism, notably surface and Knudsen diffusions. In addition, the type V isotherms obtained for H2O and the investigated carbon supports were described through the Klotz equation, taking into account the formation and progressive growth of H2O clusters within the internal porosity. This methodology allowed us to successfully simulate the H2O adsorption by a non-impregnated AC, where only physisorption phenomena are involved. In addition, promising results were highlighted when extrapolating to the two other impregnated ACs (AC 5KI and AC Nuclear).
1. Introduction
Some accidents, such as Chernobyl (1986) and Fukushima (2011), have induced disastrous consequences in terms of radioactive releases into the environment. In that respect, the limitation of radioactive substances release in all scenarios is a major issue for nuclear safety and radioprotection. Among the susceptible fission products to be released, the attention should be devoted to radioactive iodine isotopes [1]. The major issue lies both in the ability of iodine to be present under highly volatile species (namely molecular iodine I2 and methyl iodide CH3I) [2,3], as well as in high affinity with the human thyroid [4]. Among the radioactive isotopes of iodine, iodine 131 (half-life is 8.02 days [3]) is identified as the principal source of exposure during the first stages of a major nuclear accident.
Iodine traps (ITs) are widely employed within the ventilation networks of nuclear facilities to ensure the containment of these hazardous species. The majority of traps are composed of activated carbon (AC) [5] derived from a coconut shell. These adsorbents display a well-developed microporous structure (dpore < 2 nm), enabling them to adsorb CH3I molecules (kinetic diameter: 0.5–0.6 nm [6]) through physisorption phenomena. The current nuclear grade AC is commonly co-impregnated with triethylenediamine (TEDA, ~5 wt.%) and potassium iodide (KI, ~1 wt.%) [5]. The impregnation purpose is to ensure a specific and strong trapping of iodine molecules that are present in traces. Therefore, two retention mechanisms exist in addition to the physical adsorption. On the one hand, the TEDA molecules interact with CH3I through a chemisorption mechanism [5]. On the other hand, an isotopic exchange reaction involves the KI reactivity toward radioactive iodine isotopes [7].
Several factors are reported to influence the iodine trapping efficiency. Among them, humidity has the greatest impact, notably for a relative humidity (RH) greater than 40% [5]. Indeed, the adsorbed water molecules show a competitive adsorption with the iodine species by preventing them from arriving to the active sites [8,9]. Thus, to better understand and predict this inhibiting effect, the attention should be given to the interaction between water vapor and nuclear grade AC. By now, most academic research studies have focused on H2O adsorption isotherms. Owing to their hydrophobic character, a type V isotherm is reported for the employed AC in the nuclear industry. A maximal water uptake of (30–40 mg/g) can be highlighted for these adsorbents at a RH of 40% (T = 30 °C) [10,11]. In comparison, more hydrophilic adsorbents such as silica gel composite [12], 13X zeolite [13], and MIL-160 MOF [14] display much higher water vapor adsorption capacities with values of about 200–300 mg/g in the same range of RH. At a higher water content (RH of about 95%), the water uptake is known to be dependent on the total accessible pore volume. In that respect, nuclear ACs with high specific surface areas (~1000 m2/g) exhibit an adsorption capacity of about 200–300 mg/g at a RH of 95%. This trend explains the drastic deterioration of retention efficiency toward iodine trapping in humid conditions [15]. Despite the availability of numerous data on H2O adsorption isotherms for nuclear AC, no experimental or theoretical works have been devoted to breakthrough curves for these adsorbents, to the best of our knowledge. Thus, the extrapolation of their behavior to the industrial scale is delicate. Furthermore, although several studies [16,17,18,19] have been performed to simulate the dynamic sorption profiles of pollutants (H2S, COV, etc.) on a wide range of adsorbents, no studies dedicated to activated carbons and H2O have been realized.
The present work aims to bridge this gap by reporting on the prediction of nuclear grade AC dynamic behavior toward water vapor. The employed methodology will be based mainly on H2O adsorption isotherms by gaining insights into both the adsorption equilibrium and kinetics. This model will be crucial to better quantify the poisoning effect induced by water toward the adsorption of radioactive iodine, which is of great interest to nuclear safety and radioprotection. In the following, the methodology for the model establishment will first be detailed. Then, the tested adsorbents and experimental methods will be described. Finally, the results will be presented by comparison between predicted and experimental sorption profiles.
2. Methodology for the Establishment of a Model for Breakthrough Curve Prediction
2.1. Mass Balance Equation
To model breakthrough curves (BTCs), phenomena involving the interactions between a pollutant and a given adsorption column [20] must first be modeled. Thus, the system displayed in Figure 1 was considered. A mass balance equation governing both gaseous and adsorbed species is required.
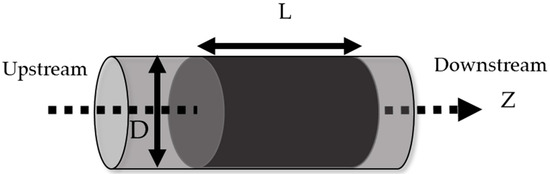
Figure 1.
Schematic diagram of the modeled system.
To decrease the complexity of this system, some approximations were undertaken. Firstly, a plug flow was considered. Therefore, there are no radial gradients of concentration, temperature, or velocity [19]. In addition, the pressure drop was disregarded due to the experiment’s small scale. For the sake of simplification, the decrease in velocity due to the compound capture was also neglected [21]. Owing to the employed temperature, the sorption of O2 and N2 in the porous material can be ignored [22]. Lastly, the system was considered to be isothermal [19,21,22,23]. With these simplifications, the global transport equation can be written as the following:
For the initial conditions, the porous material is in equilibrium with the residual humidity in the flowing air. In addition, the initial adsorption capacity q is estimated from the adsorption isotherm (see Section 3.2).
The water vapor concentration can be calculated through the ideal gas law:
Using the definition of RH (), the H2O concentration can be calculated through the following equation:
Finally, the following boundary conditions were used in agreement with the literature [22,23,24]:
Before finding a numerical solution for this model, certain parameters need to be established and estimated. Firstly, the axial dispersion (Dax), which characterizes the axial spreading of the concentration profile observed in BTC. This parameter models the non-ideal velocity profile of the flow [25,26] regarding its deviation from a plug flow. In this work, the correlation proposed by Rastegar et al. [25] was used:
The product of the Re and Sc numbers ranges between 2 and 14, which justifies the adequacy of the presented correlation with the employed conditions within the present study.
Then, specific models are needed to describe both the adsorption kinetics and equilibrium. The focus will be devoted to the adsorption kinetics in the following part. The model retained for the H2O adsorption isotherms will be presented in Section 4.1.
2.2. Adsorption Kinetics
The mass transfer global resistance can generally be supposed as the resultant from two main contributions: (i) external mass transfer and (ii) intraparticle mass transfer. It encompasses the path that the species needs to make across the outer particle layer, through the particle macroporosity, and finally inside its microporosity [27].
A global mass constant can be calculated by considering all the different mechanisms through the Linear Driving Force (LDF) model [28]. More specifically, the following equation adapted from the literature can be used to calculate the global mass transfer constant (KLDF) [29]:
In the case of this study, the external mass transfer was neglected, since the predominant resistances are due to the internal diffusion in microporous AC, in agreement with several literature studies [14,15]. More particularly, the pore diffusion resistance is known to be the governing mechanism for adsorption kinetics within ACs [30,31]. Thus, KLDF was calculated from the pore diffusivity (Dp), as shown by Equation (8).
It is also notable that the adsorption equilibrium has an impact on the kinetics constant. The term allows taking into account the non-linear character of the adsorption isotherm [32]. Moreover, the adsorbed quantity in equilibrium (qeq) is calculated using the adsorption isotherm model. This topic will be aborded in depth in Section 3.2.2.
For intraparticle phenomena, three main intraparticle mechanisms can be distinguished [18,19]: (i) molecular diffusion in macropores, (ii) Knudsen diffusion within mesopores and micropores, and finally (iii) the surface diffusion in micropores. The pore diffusivity was calculated with Equation (9) [29].
The parameters presented in this equation were calculated as the following:
- -
- The tortuosity (τ): given the lack of experimental measurements, a value of 3 was used, corresponding to a good order of magnitude in similar adsorption systems [33].
- -
- The molecular diffusivity (Dm): a value of 2.6 m2 s−1 from a previous work [34] was used.
- -
- The Knudsen diffusivity (DK), was calculated using Equation (10)).
- -
- The surface diffusivity (DS) was estimated using the Sladek et al. [35] correlation, seen in Equation (11).
For the DS correlation, a typical value for the adsorption enthalpy of water in AC was chosen (ΔHads = 40 kJ mol−1 [36,37,38]). The parameter s of Equation (11) is based mainly on the interaction between the adsorbent and adsorbate. A value of s = 2 is recommended by Sladek et al. [35] when dealing with polar adsorbate/carbon interaction. The calculated diffusivities are presented in Section 4.2.
Incorporating the LDF model in Equation (1) results in Equation (12).
Since the instant concentration plays a role in the value of the kinetic constant, KLDF will be calculated during the model resolution. This parameter is evaluated for each step of the resolution based on the actual local concentration for a given time.
The numerical resolution process will be described in the following part.
2.3. Numerical Resolution
In this work, the method of lines [39] has been applied for the discretization and the integration of the transport Equation (1). More details about this method as well as the employed parameters are summarized in the Supplementary Materials (S1).
3. Experimental Methods
3.1. Tested Adsorbents and Presentation of Their Main Properties
Three commercial AC derived from coconut shells were studied in the presented work:
- a non-impregnated activated carbon denoted as AC nI;
- an AC impregnated by KI (5 wt.%) denoted as AC 5KI;
- a co-impregnated AC with a composition similar to the employed one for a nuclear grade AC: 1 wt.% of KI and 5 wt.% of TEDA. This adsorbent is designated in the following by AC Nuclear.
The textural properties of the tested materials as deduced from our previous investigation [40] are shown in Table 1.

Table 1.
Characterization by N2 porosimetry nitrogen at 77K of the investigated adsorbents. Presented uncertainties are related to the standard deviation of the mean expressed at coverage factor k = 2 [40].
The investigated adsorbents are mainly microporous (fraction of micropores higher than 93%, Table 1), with large specific surface areas (>900 m2/g). These results are in line with type I of their N2 adsorption/desorption isotherms (see Supplementary Materials (S2)). A very negligible contribution due to mesopores can also be noticed for the investigated materials, as shown from the very small hysteresis loop at high P/P0 values (see Supplementary Materials (S2)). In addition, a certain contribution due to macropores is also presented, as observed by our previously published SEM data [5].
The presence of KI does not have a notable effect on the porosimetric properties of the materials (SBET and Vmicro), indicating therefore that KI entities are not located in the micropores. Indeed, our previous TEM and XRD characterizations have indicated the presence of well-dispersed KI nanoparticles on the external surface of AC 5KI [41]. Finally, previous XPS investigations [5] have shown the presence of two iodine forms: (i) a dominant part assigned to ionic I- (such as in KI) and (ii) a less pronounced contribution due to covalent iodine Iδ-, resulting from a potential interaction with AC surface defects.
However, the presence of TEDA causes a decrease in the SBET and in the pore volume, due to a partial pore blockage by its molecules being present within the internal porosity [40], in agreement with the literature studies [1,42,43]. The nitrogen speciation from previous XPS results [5] has also shown two contributions: (i) a dominant one related to three-coordinated nitrogen N as in TEDA and (ii) a lower part presented by N-Csp2 bonds, as in quaternary ammonium, attributed probably to nitrogen interaction with the carbon support.
Finally, it is worth recalling the absence of any interaction between KI and TEDA within the AC Nuclear, as confirmed by similar iodine and nitrogen speciation between singly impregnated and co-impregnated ACs [5].
3.2. Determination of H2O Adsorption Isotherms
3.2.1. Experimental Part
The H2O adsorption was investigated with a sorption microbalance (DVS Vacuum, photo in Supplementary Materials S3), using a sample mass of 50 mg with a grain size between 1.0 mm and 1.4 mm. Firstly, an in situ pretreatment is performed to limit the presence of residual humidity within the tested adsorbent. Mild conditions were chosen for the degassing process (60 °C, 15 h, vacuum of 10−5 torr) to avoid significant modification to the adsorbent surface chemistry, in agreement with recent works of L.F. Velasco et al. [44]. Then, the adsorption phase was conducted at 30 °C using gravimetric measurements from the RH of 0% up to 95%, with increments of 5%. The thermodynamic equilibration for each tested RH was assumed for a maximal duration of 400 min per step or when the following criterion was satisfied:
3.2.2. Data Processing
An appropriate isotherm model needs to be used to describe the interactions between AC and water. In this work, two models were explored:
- Henry model: applied only for a RH < 40%;
- Klotz equation (Equation (15)): developed in a previous work related to the interaction between proteins and particles [45]. This equation is applied to our study to mathematically consider the sigmoidal nature of the obtained isotherms. This equation was applied in the whole RH range (5–95%).
- molar fraction of the species in the gas (-);H2O adsorbed quantity in a monolayer (g g−1);K constant of the adsorption equilibrium in the Klotz equation (-);Ck constant linked to the first association between the surface and the adsorbent in the Klotz equation (-);maximum molecules association number in the clusters in the Klotz equation (-).
3.3. Determination of H2O Breakthrough Curves
3.3.1. Experimental Protocol and Data Processing
A specific bench has been assembled. Its objective was to record H2O BTCs (Figure 2). Some photos are presented in the Supplementary Materials (S3). This equipment may be divided into three main parts: (i) the generation of humid air, (ii) the adsorbent bed, and (iii) the online measurement of H2O concentration at both the adsorbent inlet and outlet.
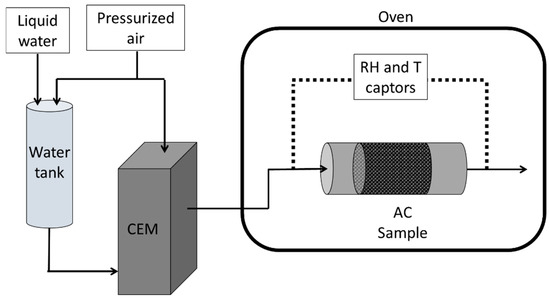
Figure 2.
Experimental equipment used to measure water BTCs.
- Humid air generator
A vapor generator was used (Controlled Evaporator Mixer (CEM) 2M process) to produce a controlled RH. The CEM is composed of a heating mixing chamber and two flowmeters: one for water and the other for air. Thus, by controlling the flow of water and air, a precise RH for a given temperature can be reached. In addition, the generated humid air flowed through an isolated and heated transport line to prevent condensation in any cold spots.
- Oven and sample holder
The sample holders and captors were enclosed in an oven (Memmert) to ensure a precise temperature for the experiment, which was fixed at 30 °C.
The adsorbent bed was constituted of cylindrical sample holders, with an internal diameter of 25 mm (DN25). They were prepared with approximately 10 g of the material and a bed height of 50 mm. The departing AC was ground and sieved to have particles with a diameter between 1.0 mm and 1.4 mm, following previous protocols [40,46]. The AC beds were then treated ex situ in an oven at 100.0 °C for 12 h to limit the residual humidity. Further details of the preparation method are presented in a previous work within our laboratory [40].
- Humidity captors
Specific sensors (ROTRONIC) are used to determine the RH and T at both the adsorbent inlet and outlet. Then, further processing should be performed to determine the H2O concentration with the aim of establishing the BTC curve (Coutlet/Cinlet = (time)).
3.3.2. Investigated Experimental Conditions
A summary of the tested experimental configurations (operating conditions and tested adsorbents) is reported in Table 2. All tests were performed with a temperature of 30 °C and a RH of 40%, in agreement with the expected conditions in the normal functioning of IT [47]. For the non-impregnated AC, the effect of linear velocity was studied. More particularly, three flow rates were studied: 1.0, 1.5, and 6.5 L min−1 (NTP), resulting in linear velocities of about 4, 6, and 25 cm s−1, respectively.
Table 2.
Overview of tested operating conditions.
4. Results
4.1. H2O Adsorption Isotherms
The adsorption isotherms obtained, presented in Figure 3 for the tested adsorbents, display a type V characteristic of hydrophobic materials. The first derivative of these experimental curves is shown in the Supplementary Materials (figure in Supplementary Materials (S4)) to better localize the inflection points indicating the beginning of capillary condensation phenomena [48,49].
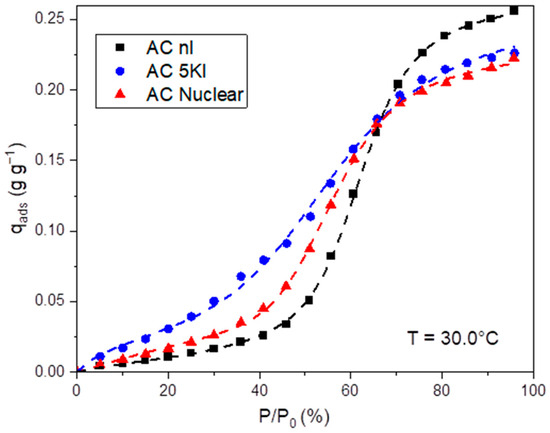
Figure 3.
H2O adsorption isotherms at 30 °C for the three studied materials (1.0 mm < dp < 1.4 mm); dashed lines represent the fitting according to the Klotz equation.
Let us begin by discussing the behavior of non-impregnated AC. Three main stages can be distinguished. In the first stage (RH < 40%), the material presents a small mass gain due to the hydrophobic surface (2.6% for the AC nI, Table 3, in line with former works on similar ACs [10]). Few water molecules adsorb only at the available heteroatoms at the surface [50]. These heteroatoms are mainly attributed to the residual oxygenated groups after the activation treatment. Indeed, oxygenated species (carbonyls, quinones, alcohols, etc.) were identified on the tested adsorbents from our already published XPS data [5]. Then, a rapid gain of mass occurs for RHs ranging from 40% to 60%, where water clusters are formed [49]. They are assembled by the creation of hydrogen bonds between new water molecules and absorbed ones. The size of these clusters increases progressively before reaching a maximal value and entering the pores [49]. Then, the saturation of the pores takes place, and the rate of mass gain decreases until the material can no longer accommodate them.
Table 3.
H2O adsorption capacities at the equilibrium for the studied materials of different RHs.
Micropore saturation is known to occur at a RH of 70% [51]. However, a threshold of 60% was obtained in the present study, leading to a water uptake of about 20% for AC nI (Table 3). Then, the water adsorption is reported to occur according to capillary condensation phenomena within mesopores (RH between 60 and 95% for the present study) and macropores (RH > 95%) [51]. Owing to the negligible fraction of mesopores, as stated from the N2 adsorption isotherms (Table 1 and figure in Supplementary Materials (S2)), a small increase in water uptake is observed in the [60%, 95%] range of RH. A final mass gain of about 26% was obtained for the AC nI (Table 3), in accordance with the literature [37,49].
These different stages of water vapor adsorption are illustrated in Figure 4.
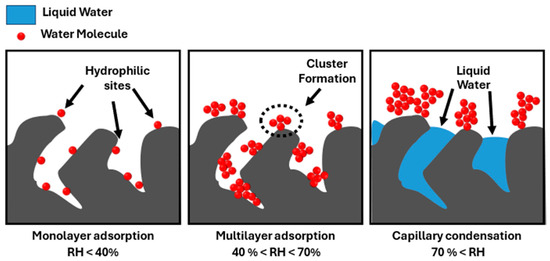
Figure 4.
Mechanisms of pore filling depending on the RH.
The impregnation has an impact on the adsorption isotherms, notably by the presence of KI, which increases the hydrophilic nature of the AC [40]. This is observed at a low RH, where the adsorbed amount is greater than that in the non-impregnated material. Indeed, the inclusion of KI on the surface serves as nucleation site for the water molecules.
This phenomenon increased the adsorbed H2O amount at a RH = 40% to 4.5% and 7.6% for AC Nuclear and AC 5KI, respectively (Table 3). In addition, a shift in the start of capillary condensation toward a lower RH was noted for the impregnated AC, in line with the hydrophilicity enhancement. However, the inclusion of these impregnations creates a partial blockage of the pores, decreasing their accessibility by adsorbate molecules. Therefore, a reduction in the maximum adsorbed amount can be highlighted after impregnation. More particularly, the maximal adsorption capacities of about 22–24% are obtained for impregnated AC (Table 3). This is due to the presence of KI nanometric particles (an average size between 2 and 10 nm) within the mesopores, as proven in our recent study of TEM characterizations [41].
To sum up, it is worth mentioning that H2O adsorption isotherms are highly dependent on the KI content in the present study. The TEDA molecules appear to have a less prominent effect compared with KI, possibly due to the pretreatment temperature and its higher volatility [41]. Indeed, previous investigations have shown a constant water uptake at a low RH (30–40%) for different TEDA impregnated ACs (content ranging from 3 to 10 wt%) [5].
Consequently, an intermediary behavior between AC nI and AC 5KI is obtained for the AC Nuclear, consistent with its lower KI concentration on the surface (%KI = 1%).
The Klotz equation was employed to mathematically describe the complex process involved in the H2O adsorption by carbonaceous materials. The obtained parameters for each material at 30 °C are reported in Table 4.
Table 4.
Computed parameters of the Klotz equation and Henry’s model for the H2O adsorption isotherms obtained on the three tested adsorbents (T = 30 °C, 1.0 mm < dp < 1.4 mm). The presented uncertainties are related to the residuals obtained between the experimental and fitted data.
The increase in the hydrophilicity of the surface has a notable effect on the parameters of the model (for example, on the parameter mK, which describes the maximum number of water molecules in a cluster). The presence of hydrophilic species on the surface facilitates the formation of these clusters, thus decreasing the number of molecules per nucleation site. Indeed, a reduction in the mK number was observed progressively from 26.3 to 10.7 for increasing KI content (Table 4). This happens since, on a hydrophobic surface, the water molecules tend to agglomerate together, rather than distribute between the hydrophilic sites. A significant increase in the monolayer capacity (qm) for the AC 5KI can also be depicted (Table 4). However, a constant evolution seems to be observed for K, which refers to the intermolecular interactions. Finally, CK expresses the affinity between the water molecules and the hydrophilic sites on the surface. A great increase is obtained after KI impregnation (1%). Then, a quasi-similar value is recorded for the AC 5KI.
4.2. Adsorption Kinetics (LDF Model)
Following the equations discussed in Section 2.2, the diffusivities were calculated and are presented in Table 5.
Table 5.
Calculated diffusivities in the present work (T = 30 °C; dpore = 0.5 nm). The same Ds value was employed for the three investigated adsorbents, assuming a similar H2O adsorption enthalpy of 40 kJ mol−1.
In the literature, the overall order of magnitude when dealing with microporous activated carbons is 10−5~10−6 m2 s−1 for Dm [52], 10−7 m2 s−1 for DK [52], and 10−8 to 10−15 m2 s−1 for Ds [35]. The calculated diffusivities seem to be in the correct range, as a comparison with former research studies. It is interesting to note that the transport phenomenon is governed mainly by Knudsen and surface diffusion mechanisms. This trend is in line with the porous character of the tested AC, dominated mainly by the presence of micropores (Table 1).
As stated before, the adsorption equilibrium has an impact on the kinetic constant. Using the Klotz equation, the KLDF constant was calculated for a RH ranging from 5% to 40%. The results are presented in Figure 5 for the three investigated adsorbents.
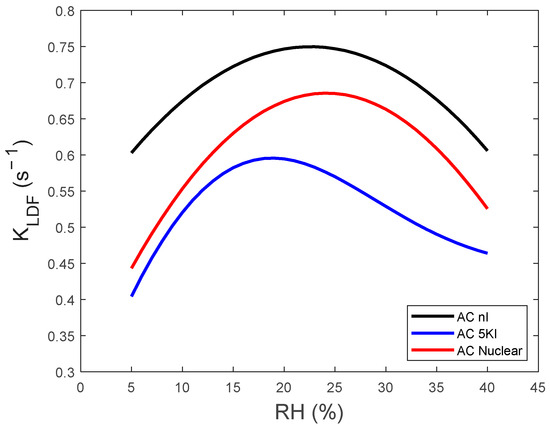
Figure 5.
Evolution of calculated KLDF kinetic constant as function of RHs.
A similar evolution of KLDF as a function of RH can be outlined for the tested adsorbents (Figure 5). More particularly, it is characterized by two opposite trends:
- (i)
- An initial increase in adsorption kinetics occurs as a function of the water vapor concentration. The RH threshold for this augmentation is about 24% for AC NI and AC Nuclear. This value is shifted to a lower RH of about 18% for AC 5KI in agreement with its more pronounced hydrophilicity, as commented before.
- (ii)
- A decrease in KLDF is, however, noticed for the further RH increase.
This antagonist effect played by RH on the H2O adsorption kinetics is in accordance with previous investigations [53,54,55]. At a low RH, the adsorption is known to occur mainly through water vapor interaction with hydrophilic sites (functional AC groups, KI or TEDA impregnates) playing the role of nucleation centers [5,42]. Initially, the concentration of these hydrophilic sites is in excess at the expense of incoming H2O molecules. Thus, the increase in concentration increases the concentration gradient and consequently the KLDF constant [56,57,58]. However, the RH increase reduces the availability of nucleation sites [59]. Hence, the adsorption will take place mainly between water molecules. Due to the lower energy of these interactions, a slower kinetics takes place [60,61].
In the following, the performance of the simulation model will be discussed.
4.3. Simulation of Breakthrough Curves
The inlet parameters for the prediction model may be classified into three categories:
- The ones linked to adsorbent column conditioning: bed density, bed porosity, and the initial RH, which determines the initial water quantity adsorbed on the AC;
- The second category related to the air flow parameters: water vapor concentration, face velocity, and axial dispersion;
- The last one, regarding the adsorption reaction: constants from kinetics and equilibrium models.
The parameters used for the first two categories are shown in Table 6.
Table 6.
Inlet parameters for the simulation models associated with the different investigated configurations.
4.3.1. Model Established for Non-Impregnated AC
The model was first studied for AC nI, due to its simplicity in comparison with impregnated materials. Two configurations were investigated, depending on the employed adsorption isotherm model for equilibrium (see Table 7). The corresponding results (comparison between experimental and simulated BTC) are presented in Figure 6 and in the Supplementary Materials (S6).
Table 7.
Tested model configurations for the AC nI.
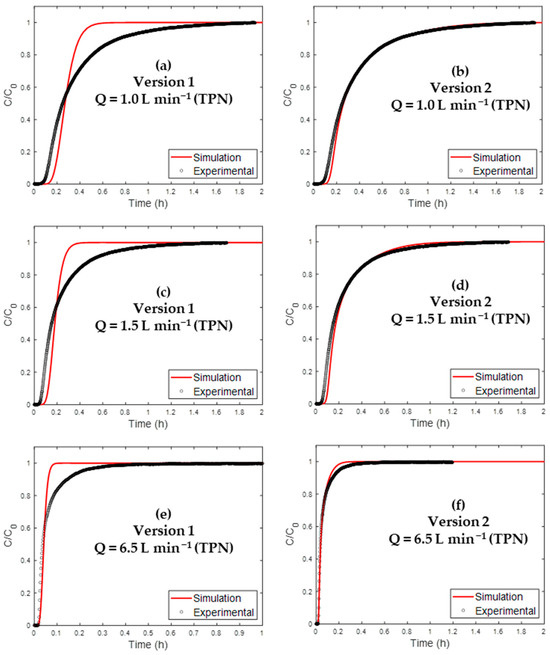
Figure 6.
Comparison of experimental and simulated BTCs by different model versions of H2O BTC for AC nI applied to the following: 1.0 L min−1 TPN {(a) version 1, (b) version 2}; 1.5 L min−1 TPN {(c) version 1, (d) version 2}, and 6.5 L min−1 TPN{(e) version 1 and (f) version 2}.
Attention was firstly devoted to the model performance at a gas flow rate of 1.0 L min−1 (NTP). The associated results are presented in Table 8 for the different model versions.
Table 8.
Correlation coefficient (R2), breakthrough time (t5%), saturation time (t95%), and prediction errors for gas flow equal to 1.0 L min−1 (NTP) in both program versions.
Regarding version 1, the application of the Henry model () led to poor prediction performances (R2 of about 0.87, Table 8). In addition, huge prediction errors for breakthrough (t5%) and saturation times (t95%) can be noticed (around 60%, Table 8).
The Henry linear isotherm model was chosen for its simple mathematical form. However, as seen in Figure 3, the H2O adsorption isotherm on AC is not linear. Thus, using an appropriate adsorption model (Klotz’s equation presented in Equation (15)) allowed better accordance with experiments (R2 = 0.99). This improvement can be seen in the t95% and t5% errors (Table 8).
The model was then applied to two other flow rates. It presented good results (R2 = 0.9746 and 0.9866 at 1.5 and 6.5 L min−1 NTP, respectively). In addition, prediction errors (<30%) were obtained for t5% and t95% errors (table in Supplementary Materials (S6)). In Figure 6, both simulation versions are presented for the three gas flow rates.
Even though these diffusivities were calculated using general values from the literature (notably DS), the resulting values led to relatively good accordance with experimental sorption profiles. Thus, specific data for the mass transport with the employed AC would be able to lower the prediction errors even more.
Hence, the established model well describes the involved phenomena (mainly physisorption) for the interaction between water vapor and non-impregnated AC. Having validated the model for the AC nI for different gas flows, it was then extrapolated to the other investigated adsorbents through the same methodology.
4.3.2. Extrapolation of AC Used in Nuclear Context
The two materials (AC 5KI and AC Nuclear) were studied according to the same approach as AC nI. A flow rate of 1.0 L min−1 (NTP) was chosen to increase the experimental BTC retention phase. Otherwise, the breakthrough would be immediate, and a precise experimental BTC would not be possible. In Figure 7, the simulated and experimental curves are compared.
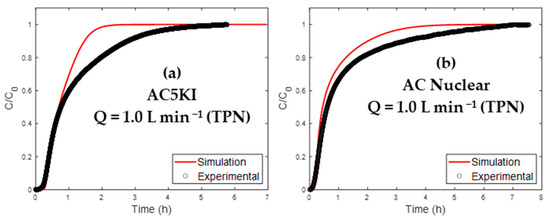
Figure 7.
Simulated and experimental BTCs for the AC used in a nuclear context.
For both materials, there is an overall agreement with the experiments (R2 > 0.87). More particularly, acceptable prediction errors for the breakthrough time (t5%) can be highlighted. However, higher deviations can be noticed for the prediction of the time needed to AC saturation (t95%), as displayed in Table 9.
Table 9.
R2, breakthrough time (t5%), saturation time (t95%), and prediction errors for AC 5KI and AC Nuclear (flow rate of 1.0 L min−1 NTP).
The observed deviation at high breakthrough levels may be caused by the KI reactivity with water. The kinetics of this interaction are not accounted for in the present model. A second possible origin would be the non-isothermal character of adsorption, neglected in the present work. Indeed, it is known that energy balance will have an impact on the local adsorption equilibrium, especially close to the adsorbent saturation [22,62].
Nevertheless, it is worth noting that the developed model was mainly dedicated to describing H2O physisorption phenomena on the non-impregnated AC. The extrapolation of this model to KI/TEDA impregnated adsorbents gives promising results, especially at the breakthrough level.
5. Conclusions
The objective of this study was the simulation of the BTCs from the data at equilibrium. Three ACs were studied, akin to the materials used in the nuclear industry. The focus of the simulation was the capture of water vapor, since it is the principal poison in the capture of iodine in the nuclear industry.
For the implemented model, several parameters have been determined. One of them was adsorption kinetics, where a global approach called LDF was picked. The kinetic constant was estimated by accounting for all the intraparticle mass transfer mechanisms.
Another important parameter is the adsorption isotherm. All considered materials had an isotherm type V, characteristic of the low affinity between the water molecules and the AC surface. However, the presence of KI in the material had a considerable effect on the hydrophilicity of the material. This increased the mass gain in low RH but decreased the pore accessibility, decreasing the maximum adsorbed amount. Afterward, the adsorption isotherms were modeled using the Klotz equation, which allowed the consideration of the cluster’s progressive formation. This equation was also applied to determine the surface diffusivity.
For the validation of the simulation, experimental curves were necessary. They were measured in conditions equivalent to the representative operation of IT. The BTCs were simulated with success. There was a remarkable agreement between the simulated and experimental curves for the non-impregnated material. This demonstrates that the model has a good description of the physisorption phenomenon toward H2O. This model also gives promising results for the prediction of impregnated AC behavior toward H2O at the breakthrough level (5%). However, deviations are noticed mainly at AC saturation, owing to the interaction between KI and water vapor molecules and the non-isothermal character of the adsorption process.
This established model on physisorption phenomena from data at equilibrium will have great potential to be applied in the simulation of the BTCs of other molecules, such as iodine species and volatile organic compounds (VOCs). It would allow for the prediction of the IT behavior toward iodine species as well as its poisoning by VOCs. Moreover, it is important to highlight the modular capacity of the developed model as a comparison with commercial codes. Complementary efforts will be performed in order to improve the presented methodology to take into account particular reactions involved in trapping, in addition to physisorption. Specifically, attention will be paid to the prediction of IT interactions toward volatile iodine species by modeling the chemisorption (TEDA) and isotopic exchange (KI) reactions.
Supplementary Materials
The following supporting information can be downloaded at: https://www.mdpi.com/article/10.3390/separations12050126/s1, S1: Detailed description of the employed method for numerical resolution: “the method of lines”, S2 N2 adsorption/desorption isotherms at 77 K of the tested activated carbons: (A) AC nI and (B) AC 5KI, (C) AC Nuclear., S3: Photos of the experimental apparatus, S4: First derivative of the adsorption isotherms, S5: Adsorption isotherms modeled with henry’s model, S6: correlation coefficient (R2), breakthrough time (t5%), saturation time (t95%) and prediction errors for the gas flow of 1.5 and 6.5 L.min−1 (NTP) and program versions.
Author Contributions
F.C.B.M.: methodology, investigation, software, validation, visualization, data curation, writing—original draft preparation. M.C.: supervision, conceptualization, methodology, validation, data curation, writing—review and editing. C.M.-L.: project administration, funding acquisition, writing—review and editing. B.M. and A.R.: investigation, experimentation. All authors have read and agreed to the published version of the manuscript.
Funding
The research leading to these results is funded by the French Authority for Nuclear Safety and Radiation protection (ASNR). This work was performed within the “Iodine” research program of the ASNR.
Data Availability Statement
Data will be made available on request.
Acknowledgments
The research leading to these results is funded by the French Authority for Nuclear Safety and Radiation protection (ASNR).
Conflicts of Interest
The authors declare no conflicts of interest.
Nomenclature
The meanings of the following parameters are presented below:
| C | water concentration in the gas phase (kg m−3) |
| Z | coordinate in the axis following the column length (m) |
| D | internal diameter of the adsorption column (m) |
| Dax | axial dispersion (m2 s−1) |
| bulk flow speed (m s−1) | |
| bed porosity (-) | |
| (m s−1) | |
| time (s) | |
| fixed bed density (kg m−3) | |
| average adsorbed quantity (g of adsorbed H2O per g of adsorbent) | |
| Dm | m2 s−1 [34] |
| particle diameter (m) | |
| m2 s−1 [63] | |
| Re | |
| Sc | |
| m | sample mass used in the sorption microbalance (mg) |
| RH | relative humidity (%) |
| adsorbed quantity at equilibrium for a given RH (g g−1) | |
| KLDF | constant associated with the LDF model (s−1) |
| Dp | pore diffusivity (m2 s−1) |
| DK | Knudsen diffusivity (m2 s−1) |
| surface diffusivity (m2 s−1) | |
| tortuosity (-) | |
| feed concentration (kg m−3) | |
| adsorbed quantity in equilibrium with feed concentration (g g−1) | |
| pore diameter (m) | |
| adsorption enthalpy (J mol−1) | |
| model parameter based on the interaction (s = 2) [35] | |
| Psat | water vapor saturation pressure for a given temperature (bar) |
| R | ideal gas constant (8.314 J mol−1 K−1) |
| T | gas temperature (K) |
| molecular mass of water (18 g mol−1) | |
| molar fraction of the species in the gas (-) | |
| H2O adsorbed quantity in a monolayer (g g−1) | |
| KH | Henry constant (-) |
| K | constant of the adsorption equilibrium in the Klotz equation (-) |
| Ck | constant linked to the first association between the surface and the adsorbent in the Klotz equation (-) |
| maximum molecules association number in the clusters in the Klotz equation (-) | |
| t5% | |
| t95% |
References
- Chebbi, M.; Monsanglant-Louvet, C.; Parent, P.; Gerente, C.; Coq, L.L.; Mokili, B.M. Sorption properties of activated carbons for the capture of methyl iodide in the context of nuclear industry. Carbon Trends 2022, 7, 100164. [Google Scholar] [CrossRef]
- Kircher, J.F.; Barnes, R.H. Methyl Iodide Formation Under Postulated Nuclear Reactor Accident Conditions; International Atomic Energy Agency (IAEA): Vienna, Austria, 1968; ISBN 0074-1884. Available online: http://inis.iaea.org/search/search.aspx?orig_q=RN:44057071 (accessed on 23 February 2024).
- Clément, B.; Cantrel, L.; Ducros, G.; Funke, F.; Herranz, L.; Rydl, A.; Weber, G.; Wren, C. State of the Art Report on Iodine Chemistry; Organisation for Economic Co-Operation and Development: Paris, France, 2007. [Google Scholar]
- Masson, O.; Baeza, A.; Bieringer, J.; Brudecki, K.; Bucci, S.; Cappai, M.; Carvalho, F.P.; Connan, O.; Cosma, C.; Dalheimer, A. Tracking of airborne radionuclides from the damaged Fukushima Dai-ichi nuclear reactors by European networks. Environ. Sci. Technol. 2011, 45, 7670–7677. [Google Scholar] [CrossRef] [PubMed]
- Lin, H.; Chebbi, M.; Monsanglant-Louvet, C.; Marcillaud, B.; Roynette, A.; Doizi, D.; Parent, P.; Laffon, C.; Grauby, O.; Ferry, D. KI and TEDA influences towards the retention of radiotoxic CH3I by activated carbons. J. Hazard. Mater. 2022, 431, 128548. [Google Scholar] [CrossRef] [PubMed]
- Scheele, R.D.; Burger, L.L.; Matsuzaki, C.L. Methyl Iodide Sorption by Reduced Silver Mordenite; Pacific Northwest National Lab.(PNNL): Richland, WA, USA, 1983. [Google Scholar]
- Chebbi, M.; Lin, H.; Azambre, B.; Monsanglant-Louvet, C.; Marcillaud, B.; Roynette, A.; Doizi, D. A novel methodology to estimate the importance of isotopic exchange in the CH3I adsorption by impregnated activated carbons. Sep. Purif. Technol. 2024, 330, 125427. [Google Scholar] [CrossRef]
- Chebbi, M.; Azambre, B.; Monsanglant-Louvet, C.; Marcillaud, B.; Roynette, A.; Cantrel, L. Effects of water vapour and temperature on the retention of radiotoxic CH3I by silver faujasite zeolites. J. Hazard. Mater. 2021, 409, 124947. [Google Scholar] [CrossRef]
- Nakamura, M.; Ohba, T.; Branton, P.; Kanoh, H.; Kaneko, K. Equilibrium-time and pore width dependent hysteresis of water adsorption isotherm on hydrophobic microporous carbons. Carbon 2010, 48, 305–308. [Google Scholar] [CrossRef]
- Ho, K.; Chun, H.; Lee, H.C.; Lee, Y.; Lee, S.; Jung, H.; Han, B.; Lee, C.-H. Design of highly efficient adsorbents for removal of gaseous methyl iodide using tertiary amine-impregnated activated carbon: Integrated experimental and first-principles approach. Chem. Eng. J. 2019, 373, 1003–1011. [Google Scholar] [CrossRef]
- Ho, K.; Moon, S.; Lee, H.C.; Hwang, Y.K.; Lee, C.-H. Adsorptive removal of gaseous methyl iodide by triethylenediamine (TEDA)-metal impregnated activated carbons under humid conditions. J. Hazard. Mater. 2019, 368, 550–559. [Google Scholar] [CrossRef]
- Hassan, A.A.; Hassan, H.; Rupam, T.H.; Islam, M.A.; Saha, B.B. Development of novel ionic liquid-based silica gel composite adsorbents for designing high-efficiency adsorption heat pumps. Int. Commun. Heat Mass Transf. 2023, 146, 106862. [Google Scholar] [CrossRef]
- Kim, K.-M.; Oh, H.-T.; Lim, S.-J.; Ho, K.; Park, Y.; Lee, C.-H. Adsorption Equilibria of Water Vapor on Zeolite 3A, Zeolite 13X, and Dealuminated Y Zeolite. J. Chem. Eng. Data 2016, 61, 1547–1554. [Google Scholar] [CrossRef]
- Shi, L.; Kirlikovali, K.O.; Chen, Z.; Farha, O.K. Metal-organic frameworks for water vapor adsorption. Chem 2024, 10, 484–503. [Google Scholar] [CrossRef]
- Ecob, C.M.; Clements, A.J.; Flaherty, P.; Griffiths, J.G.; Nacapricha, D.; Taylor, C.G. Effect of humidity on the trapping of radioiodine by impregnated carbons. Sci. Total Environ. 1993, 130–131, 419–427. [Google Scholar] [CrossRef]
- Cardenas, C. Analyse et modélisation du comportement des caissons d’épuration de l’air équipant les engins de chantier pour la protection des opérateurs contre les gaz et vapeurs. Hal 2021, 240. Available online: https://www.theses.fr/s283000 (accessed on 25 January 2025).
- Paz, L.; Gentil, S.; Fierro, V.; Celzard, A. Assessing the performance of adsorbents for CO2/CH4 separation in pressure swing adsorption units: A review. J. Environ. Chem. Eng. 2024, 12, 114870. [Google Scholar] [CrossRef]
- Gutiérrez Ortiz, F.J.; Aguilera, P.G.; Ollero, P. Modeling and simulation of the adsorption of biogas hydrogen sulfide on treated sewage-sludge. Chem. Eng. J. 2014, 253, 305–315. [Google Scholar] [CrossRef]
- Cardenas, C.; Latifi, A.M.; Vallières, C.; Marsteau, S.; Sigot, L. Analysis of an Industrial Adsorption Process Based on Ammonia Chemisorption: Modeling and simulation. Comput. Chem. Eng. 2021, 154, 107474. [Google Scholar] [CrossRef]
- Helfferich, F.G. Principles of Adsorption & Adsorption Processes; Ruthven, D.M., Ed.; John Wiley & Sons: Hoboken, NJ, USA, 1984. [Google Scholar]
- Shafeeyan, M.S.; Daud, W.M.A.W.; Shamiri, A. A review of mathematical modeling of fixed-bed columns for carbon dioxide adsorption. Chem. Eng. Res. Des. 2014, 92, 961–988. [Google Scholar] [CrossRef]
- Serna-Guerrero, R.; Sayari, A. Modeling adsorption of CO2 on amine-functionalized mesoporous silica. 2: Kinetics and breakthrough curves. Chem. Eng. J. 2010, 161, 182–190. [Google Scholar] [CrossRef]
- Knox, J.C.; Ebner, A.D.; LeVan, M.D.; Coker, R.F.; Ritter, J.A. Limitations of Breakthrough Curve Analysis in Fixed-Bed Adsorption. Ind. Eng. Chem. Res. 2016, 55, 4734–4748. [Google Scholar] [CrossRef]
- Khalighi, M.; Farooq, S.; Karimi, I.A. Nonisothermal pore diffusion model for a kinetically controlled pressure swing adsorption process. Ind. Eng. Chem. Res. 2012, 51, 10659–10670. [Google Scholar] [CrossRef]
- Rastegar, S.O.; Gu, T. Empirical correlations for axial dispersion coefficient and Peclet number in fixed-bed columns. J. Chromatogr. A 2017, 1490, 133–137. [Google Scholar] [CrossRef]
- Delgado, J.M.P.Q.P.Q. A Critical Review of Dispersion in Packed Beds. Heat Mass Transfer 2006, 42, 279–310. [Google Scholar] [CrossRef]
- Schlaich, A.; Barrat, J.; Coasne, B. Theory and Modeling of Transport in Nanoporous Materials: From Microscopic to Coarse-Grained Descriptions. arXiv 2024, arXiv:2406.03039. [Google Scholar] [CrossRef] [PubMed]
- Sircar, S.; Hufton, J.R. Why does the linear driving force model for adsorption kinetics work? Adsorption 2000, 6, 137–147. [Google Scholar] [CrossRef]
- Kärger, J.; Valiullin, R.; Brandani, S.; Caro, J.; Chmelik, C.; Chmelka, B.F.; Coppens, M.; Farooq, S.; Freude, D.; Jobic, H.; et al. Diffusion in nanoporous materials with special consideration of the measurement of determining parameters (IUPAC Technical Report). Pure Appl. Chem. 2025, 97, 1–89. [Google Scholar] [CrossRef]
- Díaz-blancas, V.; Aguilar-madera, C.G.; Flores-cano, J.V.; Leyva-ramos, R.; Padilla-ortega, E. Evaluation of mass transfer mechanisms involved during the adsorption of metronidazole on granular activated carbon in fixed bed column. J. Water Process Eng. 2020, 36, 101303. [Google Scholar] [CrossRef]
- Zheng, C.; Niu, Y.; Kang, K.; Xie, Y.; Han, H.; Song, H.; Hu, J.; Bai, S. Water Vapor Adsorption/Desorption Behaviors on Activated Carbon Particles and Fixed Beds: Isotherms, Kinetics, and Axial Temperature. Ind. Eng. Chem. Res. 2023, 62, 18032–18046. [Google Scholar] [CrossRef]
- Hassan, M.M.; Raghavan, N.S.; Ruthven, D.M.; Boniface, H.A. Pressure Swing Adsorption; John Wiley & Sons: Hoboken, NJ, USA, 1985; Volume 31, pp. 2008–2016. [Google Scholar]
- Perry, R.H.; Green, D.W. Perry’s Chemical Engineers’ Handbook, 7th ed.; Mc Graw-Hill Book Company: New York, NY, USA, 1997. [Google Scholar]
- Massman, W.J. A review of the molecular diffusivities of H2O, CO2, CH4, CO, O3, SO2, NH3, N2O, NO, and NO2 in air, O2 and N2 near STP. Atmos. Environ. 1998, 32, 1111–1127. [Google Scholar] [CrossRef]
- Sladek, K.J.; Gilliland, E.R.; Baddour, R.F. Diffusion on Surfaces II. Correlation of Diffusivities of Physically and Chemically Adsorbed Species. Ind. Eng. Chem. Fundam. 1974, 13, 100–105. [Google Scholar] [CrossRef]
- Furmaniak, S.; Gauden, P.A.; Terzyk, A.P.; Rychlicki, G. Water adsorption on carbons—Critical review of the most popular analytical approaches. Adv. Colloid Interface Sci. 2008, 137, 82–143. [Google Scholar] [CrossRef]
- Kim, M.B.; Ryu, Y.K.; Lee, C.H. Adsorption equilibria of water vapor on activated carbon and DAY zeolite. J. Chem. Eng. Data 2005, 50, 951–955. [Google Scholar] [CrossRef]
- Foley, N.J.; Thomas, K.M.; Forshaw, P.L.; Stanton, D.; Norman, P.R. Kinetics of Water Vapor Adsorption on Activated Carbon. Langmuir 1997, 13, 2083–2089. [Google Scholar] [CrossRef]
- Lee, H.S.; Matthews, C.J.; Braddock, R.D.; Sander, G.C.; Gandola, F. A MATLAB method of lines template for transport equations. Environ. Model. Softw. 2004, 19, 603–614. [Google Scholar] [CrossRef]
- Lin, H. Evaluation de la Contribution du Mécanisme D’échange Isotopique à L’épuration de L’iode Radioactive. 2022. Available online: http://www.theses.fr/2022SORUS073/document (accessed on 6 February 2025).
- Abbas, K.; Chebbi, M.; Azambre, B.; Monsanglant-Louvet, C.; Marcillaud, B.; Roynette, A. Unravelling the Potential of Iodine Isotopic Exchange in Ch3131i Capture by K127i-Impregnated Activated Carbons. Nucl. Mater. 2025, 608, 155719. [Google Scholar] [CrossRef]
- Park, S.W.; Lee, W.K.; Moon, H. Adsorption and desorption of gaseous methyl iodide in a triethylenediamine-impregnated activated carbon bed. Sep. Technol. 1993, 3, 133–142. [Google Scholar] [CrossRef]
- Ho, K.; Park, D.; Park, M.K.; Lee, C.H. Adsorption mechanism of methyl iodide by triethylenediamine and quinuclidine-impregnated activated carbons at extremely low pressures. Chem. Eng. J. 2020, 396, 125215. [Google Scholar] [CrossRef]
- Velasco, L.F.; Devos, A.; Lodewyckx, P. The importance of outgassing conditions when using water vapour to characterize activated carbons. Carbon 2019, 152, 409–415. [Google Scholar] [CrossRef]
- Buttersack, C. Modeling of type IV and v sigmoidal adsorption isotherms. Phys. Chem. Chem. Phys. 2019, 21, 5614–5626. [Google Scholar] [CrossRef]
- Inglezakis, V.J.; Poulopoulos, S.G. Adsorption, Ion Exchange and Catalysis: Design of Operations and Environmental Applications; Elsevier: Amsterdam, The Netherlands, 2006; pp. 1–602. [Google Scholar] [CrossRef]
- Chebbi, M. Piégeage d’Espèces Iodées Volatiles sur des Adsorbants Poreux de Type Zéolithique dans le Contexte d ’ un Accident Nucléaire Grave. Ph.D. Thesis, Université de Lorraine, Nancy, France, 2016. [Google Scholar]
- Buttersack, C. General Cluster Sorption Isotherm. Microporous Mesoporous Mater. 2021, 316, 110909. [Google Scholar] [CrossRef]
- Horikawa, T.; Sekida, T.; Hayashi, J.; Katoh, M.; Do, D.D. A new adsorption–desorption model for water adsorption in porous carbons. Carbon 2011, 49, 416–424. [Google Scholar] [CrossRef]
- Velasco, L.F.; Snoeck, D.; Mignon, A.; Misseeuw, L.; Ania, C.O.; Van Vlierberghe, S.; Dubruel, P.; de Belie, N.; Lodewyckx, P. Role of the surface chemistry of the adsorbent on the initialization step of the water sorption process. Carbon 2016, 106, 284–288. [Google Scholar] [CrossRef]
- Alcañiz-Monge, J.; Linares-Solano, A.; Rand, B. Water adsorption on activated carbons: Study of water adsorption in micro- and mesopores. J. Phys. Chem. B 2001, 105, 7998–8006. [Google Scholar] [CrossRef]
- Chauveau, R. Modélisation multiparamètre du phénomène d ’ adsorption: Détermination du temps de percée des cartouches de masques à gaz. 2018. Available online: https://hal.univ-lorraine.fr/tel-01751295v1 (accessed on 20 January 2025).
- Grismer, M.E. Kinetics of water vapor adsorption on soils. Soil Sci. 1987, 143, 367–371. [Google Scholar] [CrossRef]
- Qi, N.; Appel, W.S.; LeVan, M.D.; Finn, J.E. Adsorption dynamics of organic compounds and water vapor in activated carbon beds. Ind. Eng. Chem. Res. 2006, 45, 2303–2314. [Google Scholar] [CrossRef]
- Harding, A.W.; Foley, N.J.; Norman, P.R.; Francis, D.C.; Thomas, K.M. Diffusion barriers in the kinetics of water vapor adsorption/desorption on activated carbons. Langmuir 1998, 14, 3858–3864. [Google Scholar] [CrossRef]
- Rani, S.; Prusty, B.K.; Pal, S.K. Adsorption kinetics and diffusion modeling of CH4 and CO2 in Indian shales. Fuel 2018, 216, 61–70. [Google Scholar] [CrossRef]
- Qin, C.; Jiang, Y.; Zuo, S.; Chen, S.; Xiao, S.; Liu, Z. Investigation of adsorption kinetics of CH4 and CO2 on shale exposure to supercritical CO2. Energy 2021, 236, 121410. [Google Scholar] [CrossRef]
- Xie, W.; Fu, X.; Wang, H.; Sun, Y.; Vandeginste, V. Adsorption kinetics of water vapor in shale and their dependence on in-situ conditions and the composition of reservoirs. Geoenergy Sci. Eng. 2025, 249, 213779. [Google Scholar] [CrossRef]
- Mittal, H.; Al, A.; Alhassan, S.M. Microporous and Mesoporous Materials Adsorption isotherm and kinetics of water vapors on novel superporous hydrogel composites. Microporous Mesoporous Mater. 2020, 299, 110106. [Google Scholar] [CrossRef]
- Yan, J.; Yu, Y.; Ma, C.; Xiao, J.; Xia, Q.; Li, Y.; Li, Z. Adsorption isotherms and kinetics of water vapor on novel adsorbents MIL-101(Cr)@GO with super-high capacity. Appl. Therm. Eng. 2015, 84, 118–125. [Google Scholar] [CrossRef]
- AbdulKareem, F.A.; Mohd. Shariff, A.; Ullah, S.; See, T.L.; Keong, L.K.; Mellon, N. Adsorption performance of 5A molecular sieve zeolite in water vapor–binary gas environment: Experimental and modeling evaluation. J. Ind. Eng. Chem. 2018, 64, 173–187. [Google Scholar] [CrossRef]
- Born, M.H.B.; De Witte, N.; Denayer, J.F.M.; Van Assche, T.R.C. An insulated column for lab-scale non-isothermal breakthrough: Impact of thermal effects during CO2 adsorption. Chem. Eng. Sci. 2023, 276, 118810. [Google Scholar] [CrossRef]
- Houston, W.V. The viscosity of air. Phys. Rev. 1937, 52, 751. [Google Scholar] [CrossRef]
Disclaimer/Publisher’s Note: The statements, opinions and data contained in all publications are solely those of the individual author(s) and contributor(s) and not of MDPI and/or the editor(s). MDPI and/or the editor(s) disclaim responsibility for any injury to people or property resulting from any ideas, methods, instructions or products referred to in the content. |
© 2025 by the authors. Licensee MDPI, Basel, Switzerland. This article is an open access article distributed under the terms and conditions of the Creative Commons Attribution (CC BY) license (https://creativecommons.org/licenses/by/4.0/).