Article

Extraction and Characterization of TiO2 Pigments from Commercial Paints for Environmental Studies

by
Allan Philippe
1,*,
Sylvester Ndoli-Kessie
1,
Christian Fricke
1,
Jean-Michel Guigner
2,
Benjamin Heider
3 and
Eliana Di Lodovico
1
1
Group of Environmental and Soil Chemistry, iES Landau, Institute for Environmental Sciences, University of Kaiserslautern-Landau (RPTU), Fortstraße 7, 76829 Landau, Germany
2
Institut de Minéralogie, de Physique des Matériaux et de Cosmochimie (IMPMC), Sorbonne University—UPMC University Paris 06, UMR CNRS 7590, MNHN, IRD UR 206, 75252 Paris, France
3
Department of Chemistry, University of Kaiserslautern-Landau (RPTU), Erwin-Schrödinger-Str. 54, 67663 Kaiserslautern, Germany
*
Author to whom correspondence should be addressed.
Separations 2025, 12(4), 91; https://doi.org/10.3390/separations12040091
Submission received: 24 February 2025 / Revised: 28 March 2025 / Accepted: 2 April 2025 / Published: 8 April 2025

Abstract

:
TiO2 nanoparticles are found as pigments in coatings and paints and are, therefore, released into the environment through runoff. To assess their environmental impact, comprehensive fate and ecotoxicity studies necessitate particles closely resembling those released into the environment. In response, we developed a method designed to isolate TiO2 particles from commercial paints. Using six contrasting paints alongside a pure TiO2 pigment, we evaluated two extraction methods in terms of recovery, purification rate, and preservation of both inorganic and organic particle coatings. The paints and extracts were characterized using cryogenic-TEM, ICP-OES, thermogravimetry, and infrared spectroscopy. In contrast to the alkaline-based extraction method, the extraction with acetic acid facilitated the retention of both inorganic and organic coatings and ensured good removal of organic polymers. Recovery rates exceeded 70% for all paints and extraction methods, yet the complete removal of SiO2, when present, was not achieved. CaCO3 removal was effective with both extraction methods. Our developed extraction method enables the isolation of TiO2-particles similar to those aged within paints. However, we recommend using silicate-free paints when SiO2 interference is of concern for the study design. Furthermore, this method could be interesting for pigment recycling, offering a gentler alternative to existing techniques which compromise particle coatings.

1. Introduction

Titanium dioxide (TiO2) is present in sunscreens, construction materials, food, and paints, for instance, with the role of UV filter, photocatalyst, and white pigment, depending on the product [1]. In paints and coatings, its high refractive index and low cost have made TiO2 the most popular choice as a white pigment [2], whereas the other typical components of white paints are the binder (usually amphiphilic co-polymers) and the filler (e.g., CaCO3, SiO2) [3].
The release of particles from construction materials and coatings exposed to weathering is an issue which has recently raised awareness due to the various environmental impacts of these particles [4]. For instance, Azimzada et al. observed that TiO2 particles were released from paint under simulated rain events mostly in the form of single TiO2 particles [5]. The amount of released particles can increase due to freeze–thaw cycles [6]. Furthermore, the presence of anthropogenic TiO2 in runoff from urban infrastructures during rain events was observed on-site in several studies, suggesting that its concentrations in the environment are increasing [7,8,9,10]. TiO2 particles could also be released indoors, as suggested by their presence in home dust [11]. These considerations result in concerns about their environmental impact. Indeed, despite its relatively low toxicity [12,13], TiO2 is non-biodegradable and accumulates in surface waters and sediments over time [1,14]. Therefore, it cannot be excluded that anthropogenic TiO2 will have significant negative impacts on the environment in the near future. It has already been detected in urbanized rivers and lakes [15,16,17]. In addition, potential remediation methods require separating anthropogenic TiO2 from soils or sediments, which is currently impossible at a large scale and a reasonable cost [18]. TiO2 pollution is, therefore, potentially irreversible.
Therefore, environmental studies are required, for instance, to determine the surface coating of TiO2 particles under environmental conditions [19] or their aggregation behavior [20]. Unfortunately, most related environmental studies have been conducted with standard purified particles [21], which may strongly differ from the particles actually released in the environment. In addition, the surface chemistry of the particles is necessarily affected by the components of the commercial product during several months or years of storage before usage. For instance, a study of the sorption of fulvic acid onto TiO2 nanoparticles extracted from sunscreen products using ToF-SIMS suggests that the nanoparticles’ coatings maintain distinct molecular fingerprints for each sunscreen despite similar initial particle properties and coatings [22]. Therefore, it is essential to conduct environmental studies with environmentally relevant particles. An intuitive approach could be to collect the particles weathered from painted surfaces under controlled but realistic conditions. However, only limited amounts can be produced using this approach without large-scale dedicated setups [5]. Furthermore, although the composition of the weathered particles is highly realistic, the released nanoparticles are obtained as a suspension containing other components released from the paint, which represents a serious challenge for the particles’ characterization, in particular for the coating’s composition. Finally, the composition and morphology of the released particles depend on the tested release scenario, in which many parameters (rain, freeze–thaw cycles, wind, temperature, type of surface, sunlight, etc.) must be set. This makes it difficult to obtain reproducible particles characteristics, in particular for outdoor setups.
In this context, we propose an approach to extract TiO2 particles from commercial paint samples with the perspective of using these particles in environmental studies. One advantage of extracting particles from commercial products is to maintain high environmental relevance by accounting for potential alterations of the surface chemistry occurring inside the commercial product. Furthermore, an efficient mild extraction method enables us to obtain large amounts of relevant particles at low costs.
Extraction methods for TiO2 particles from paints are scarce in the peer-reviewed literature. Karlsson et al. developed a method to isolate and recycle TiO2 from paint wastes [2,23]. The method consists roughly of a pyrolysis and combustion step to mineralize the organic components followed by a treatment with ion-exchange resins to remove the ionic components [23]. The authors could reuse the isolated pigment to prepare a new paint with satisfying properties [2]. However, significant differences in the surface properties could be detected, most probably due to the loss of the organic coatings during the thermal treatment [23]. In addition, this method was tested on reconstituted paints, which did not contain inorganic compounds apart from TiO2. However, as shown below, most paints contain CaCO3 and/or SiO2 in addition to TiO2, and these compounds could not be separated by pyrolysis.
In this study, we present an approach combining two methods to extract TiO2 particles from six representative paint samples and characterize the extracted particles. We evaluated the recovery, selectivity, and stability of the coating during the extraction and discuss here the advantages and limitations of each method.

2. Materials and Methods

Paint samples
All paints for outdoor applications which contained TiO2 as an ingredient and were available in a hardware shop in Landau in der Pfalz, Germany (six in total, denoted P1–6 in the following text) were purchased in 2021–2022. All selected paints were water-based and were available for purchase all over Germany. Although this selection may not be representative of commercial paints on a larger scale, the various compositions of the paints based on the packaging (Table S1) and our characterization (see results) suggest that the selection is covering a large range of possible compositions. All paints were white except for P3, which was dark grey. The containers were thoroughly shaken by hand before sampling. In addition, a white pigment commonly used in paint formulations and denoted here as RTC (R-TC90, Tioxide®, Sehestedter Naturfarben Handel GmbH, Sehestedt, Germany) was purchased to assess recovery and surface modifications occurring during extraction. The particles contained 94% TiO2 (rutile) in the form of 250 nm large particles coated with alumina and an unspecified organic coating, based on information by the producer available online. The size characterization of this pigment can be found in the discussion and in the Supporting Information (Table S2).
Extraction methods
Two methods were evaluated for the extraction of inorganic pigments from commercial paints: one using an ethylenediaminetetraacetic acid–sodium hydroxide (EDTA-NaOH) solution as a solvent at 95 °C and one using acetic acid (AcOH) as a solvent at room temperature. In the following text, we will refer to these methods as NaOH extraction and AcOH extraction, respectively. Each extraction was carried out in triplicate.
NaOH Extraction
A total of 1 g of paint or 500 mg of R-TC90 was weighed in a glass beaker with a magnetic stir bar, and 300 mL of a solution of ultrapure water (UPW, Purelab Flex Elga-Veolia, 18.2 MΩ·cm) containing 20 mM EDTA (8043.2 Roth Titriplex III, Karlsruhe, Germany) and 0.42 M NaOH (>98%, p.a. ISO, 6771.1, Carl Roth GmbH, Karlsruhe, Germany) was added. The suspension was stirred magnetically at 500 rpm until homogeneous (typically around 15 min) and then heated to 95 °C for 3 h. After cooling, the suspension was transferred to 50 mL PP centrifuge tubes and centrifuged (Megastar, VWR, Germany, high-conic II rotor) at 14,087× g for 15 min (10,000 rpm). This time corresponds approximately to the duration in which a 120 nm rutile particle would need to settle from the top to the bottom of the centrifuge tube at this rotational speed. In preliminary experiments, we observed that this time was sufficient for obtaining clear supernatants in most samples, and longer centrifugation times did not result in a clearer supernatant. The supernatant was discarded and replaced by 50 mL of UPW. The suspension was homogenized and centrifuged at 14,087× g for 15 min. This rinsing step with UPW was repeated three times in total. The final centrifugate was dried overnight in the oven at 60 °C. The obtained pellets were homogenized gently with a mortar and a pestle to form a powder. In addition, two variations of this method, one stirring for 3 h at room temperature instead of 95 °C and the other stirring for approximately 15 min (the time required to obtain a homogeneous suspension) at room temperature, were tested on R-TC90 to evaluate the effect of milder conditions on the particle coating.
AcOH Extraction
Approximately 1 g of paint (or 500 mg of R-TC90) was placed in a 50 mL polypropylene centrifuge tube, and 40 mL of pure AcOH (Fluka Analytical, >99%, 45,740, Steinheim, Switzerland) was added to it. After mixing with a spatula, the paint was sonicated for 2 h in an ultrasonic bath. During preliminary tests, we observed that this time was required to obtain a milky, homogeneous suspension. This suspension was centrifuged at 14,087× g for 15 min. The supernatant was completely removed and replaced by UPW, and the suspension was redispersed using a spatula and shaken by hand, with occasional degassing. The samples were left to degas under the fume hood for 30 min and then centrifuged. The supernatant was discarded, and the rinsing step with UPW was repeated two more times (without degassing steps). Preliminary tests revealed that the degassing step could help remove the carbonate present in the paint. The final centrifugate was dried and homogenized as described above.
Infrared spectroscopy (IR)
A small amount of paint was applied directly to the ATR crystal to form a thin film and dried using a flow of dry air. The completion of the drying step was monitored using the live IR spectrum in which the three characteristic bands of water (3200–3400, 1650, and <650 cm−1) were visible. For the extracts, 1–2 mg of powder was applied and pressed against the ATR crystal. The measurement was carried out using a Cary 630 FTIR (Agilent Technologies, Waldbronn; Germany) using a diamond ATR crystal, individual background correction for each replicate, 124 scans with a resolution of 4 cm−1, Happ-Genzel apodization, and a Mertz phase correction. Three replicates were measured for each sample. The obtained spectra were smoothed using a Savitzky–Golay filter and normalized by the intensity of the TiO2 peak at 650 cm−1.
Inductively coupled plasma optical emission spectroscopy (ICP-OES)
All glassware was cleaned in a 5% sulfuric acid bath prior to use. Approximately 50 mg of paint or 10 mg of extract powder or R-TC90 was weighed in a beaker. The paints were dried at 105 °C for 2 h to determine the water content. Five milliliters of hydrogen peroxide (30%, Rotipuran®, Carl Roth GmbH, Karlsruhe, Germany) was added to the sample and left to stand for 10 min before the dropwise addition of 10 mL of sulfuric acid (95%, Rotipuran®, Carl Roth GmbH, Karlsruhe, Germany). After standing for 15 min, the beaker was covered by a watch glass and heated progressively until ebullition (approximately at 250 °C) for 2.5 h. The mixture was cooled to room temperature, quantitatively transferred into a 100 mL volumetric flask, and filled with ultrapure water (resistivity 18.2 MΩ·cm, Arium® Pro, Sartorius, Göttingen, Germany). This suspension was left to settle for one hour. A total of 100 µL of the supernatant was then transferred to a 15 mL polypropylene tube and diluted with UPW prior to ICP-OES analysis.
The Ti, Al, K, Na, Ca, and Fe concentrations were determined with an Agilent 720 Series ICP Optical Emission Spectrometer at emission wavelengths of 334.941, 396.152, 766.491, 589.592, 422.673, and 259.940 nm, respectively. We applied a matrix-matched calibration using a diluted blank sample to dilute the calibration standards. Ionic standards and reference materials were used for monitoring the performance of the instrument.
Cryogenic transmission electron microscopy (cryo-TEM)
A drop of paint was deposited on a Quantifoil® (Quantifoil Micro Tools GmbH, Jena, Germany) carbon membrane. The excess paint on the membrane was absorbed with filter paper, and the membrane was quickly quench-frozen in liquid ethane to form a thin vitreous ice film. Once placed in a Gatan 626 cryo-holder cooled with liquid nitrogen, the samples were transferred into the microscope and observed at −180 °C. Cryo-TEM images were recorded on an Ultrascan 2k CCD camera (Gatan, Pleasanton, CA, USA), using a LaB6 JEOL JEM2100 (JEOL, Japan) cryogenic microscope operating at 200 kV with a JEOL low dose system (Minimum Dose System, MDS) to protect the thin ice film from any irradiation before imaging and to reduce the irradiation during the image capture. Particle elemental composition was analyzed using an X-ray energy dispersive spectroscopy (XEDS) detector mounted on the microscope (JEOL Si(Li); resolution: 140 eV). XEDS analyses were always carried out on spots due to the beam-related damage on the ice matrix, which would have been massive in a mapping mode.
Scanning electron microscopy (SEM)
Approximately one milligram of extract was transferred to an Eppendorf tube, and one milliliter of UPW was added. The samples were shaken and sonicated before the application of one microliter onto an aluminum plate attached to an aluminum SEM-sample holder using carbon tape. The drop was left to dry before being placed in the SEM (Quanta 600 F, FEI, Hillsboro, OR, USA, equipped with an INCA PentaFETx3 XEDS-detector, Oxford Instruments, Abingdon, UK) for imaging under high vacuum with a secondary ion detector at 20 kV and a spot size value of 6.0. The Feret diameter and aspect ratio of the particles were determined using ImageJ 1.54f.
Thermogravimetry quadrupole mass-spectrometry (TG-QMS)
The thermogravimetric analyses were performed with an STA 449 F3 Jupiter® simultaneous thermal analyzer equipped with type-S thermocouple (Pt-Pt/Rh) DSC/TG Octo sample carrier (Netzsch-Gerätebau GmbH, Selb, Germany) and coupled via a heated transfer line at 300 °C, untreated fused silica capillary,  l = 2.2   m d = 75   µ m  (SGE Analytical Science, Ringwood, Victoria, Australia) with the QMS 403 Aeolos® Quadro quadrupole mass spectrometer (Netzsch-Gerätebau GmbH, Selb, Germany). Samples were weighed in Pt-Rh-Al2O3 crucibles on the Cubis® II Ultra-Micro lab balance (Sartorius AG, Göttingen, Germany). The sample mass was approximately 20 mg. An empty Pt-Rh-Al2O3 crucible was used as a reference. The samples were heated from 45 °C to 105 °C (heating rate 10 °C min−1), held at 105 °C for 15 min (isothermal step to remove moisture), and then heated from 105 °C to 1000 °C (heating rate 10 °C min−1). Heating took place in an oxidative atmosphere of 50 mL min−1 synthetic air (N2/O2, 80/20%) and 20 mL min−1 argon as protective gas. The combustion gases produced were ionized by the ion source (electron ionization) and recorded at the detector (secondary electron multiplier). The measurement was multiple ion detection and the mass-to-charge ratios m/z for detection were selected as 18  m / z  (H2O) and 44  m / z  (CO2). Data evaluation was performed using the NETZSCH Proteus Thermal Analysis (Netzsch-Gerätebau GmbH, Selb, Germany) software (https://analyzing-testing.netzsch.com/en/products/software/proteus, accessed on 1 April 2025). Using the QMS signals 18  m / z  and 44  m / z , the percentage mass losses of organic molecules and carbonates in the thermogravimetric curves were determined based on the combustion/decomposition temperatures and the MS signals.
X-ray diffraction (XRD)
X-ray powder diffraction (XRD) patterns were measured on a D 5005 from Siemens/Bruker AXS with Cu Kα-radiation (λ = 0.15405 nm) at 35 kV and 25 mA. The samples were scanned within the 2θ range of 4°–80° with a step width of 0.06° and a speed of 10 s per step.
X-ray photoelectron spectroscopy (XPS)
XPS were measured using a K-Alpha+ XPS spectrometer (ThermoFisher Scientific, East Grinstead, UK). The data were acquired and processed using Thermo Avantage software (version V5. 9931). All freeze-dried samples were analyzed using a micro-focused, monochromated Al Kα X-ray source (400 µm spot size). The K-Alpha+ charge compensation system was employed during analysis, using electrons of 8 eV energy and low-energy argon ions to prevent any localized charge build-up. The spectra were fitted with one or more Voigt profiles (BE uncertainty: ±0.2 eV), and Scofield sensitivity factors were applied for quantification [24]. All spectra were referenced to the C 1s peak (C-C, C-H) at 285.0 eV binding energy controlled using the well-known photoelectron peaks of metallic Cu, Ag, and Au, respectively.
Data analysis
Calibration, concentration, and recovery calculations were carried out using Excel (Version 2309) and further analyses and graphs with RStudio (version 1.2.5033). The scripts and raw data are available at Zenodo at https://doi.org/10.5281/zenodo.12744368 (accessed on 3 April 2025).

3. Results

3.1. Paints’ Composition

The selected paint samples contained between 38 and 50% water (Table 1). Ti was assumed to be present only in the form of TiO2, as it is the most stable and used form under ambient conditions [25]. TiO2 represented 1.2–14.4% of the paint’s wet mass. The RTC pigment was composed of 92% TiO2, whereas Ca and Al were also present in noticeable amounts (Table 1). This was expected, as Al is often used in the form of oxides or hydroxides as a coating for TiO2 pigments [23]. It is unclear if Ca is part of the coating, as it is a very common impurity as well. P3 contained a significant amount of Fe due to the presence of iron oxide-based pigments confirmed by cryo-TEM observations (see below), which are responsible for the darker color of this paint.
The presence of Ca is consistent with the presence of carbonate as quantified using TGA-QMS (Table 1). The identification as carbonate is justified by the detection of CO2 correlated with a mass loss at 500–800 °C, characteristic of carbonate. Furthermore, the stoichiometry of Ca and CO32− measured in the paint samples matches that of CaCO3. Therefore, we assume that all carbonates are in the form of calcium carbonate in the studied paints. TGA-QMS also confirmed the presence of a large amount of organic compounds with a typical mass loss between 300 and 500 °C correlated with the release of CO2 and H2O (Table 1), which most probably corresponds to the polymers mentioned in the lists of ingredients.
The IR spectra of the dried paints (Figure 1—black lines) revealed a set of common peaks matching compounds common to all paints including TiO2 (the shoulder visible from 650 cm−1) [26], SiO2 (~1000 cm−1) [27], and CO32− (~1435 cm−1 and ~900 cm−1) [19,27]. In addition, the bands at 2800–3000 cm−1 corresponding to C-H stretching vibrations [27] confirm the presence of organic compounds in all paints. The composition of these organic compounds differed between the paints, as shown by the differences in the fingerprint area. Nonetheless, the sharp bands around 1700 cm−1 are typical for the stretching vibrations of C=O bonds in esters present in vinyl acetate or polyacrylate polymers, for instance. Although these ATR-IR spectra cannot be evaluated quantitatively, one observes that P1, P4, and P5 are relatively rich in carbonate in accordance with higher Ca concentrations, whereas P2 and P3 spectra are dominated by SiO2 bands. P6’s spectrum differs from other samples with an IR spectrum dominated by the binder’s (polymer) bands between 1000 and 2000 cm−1.
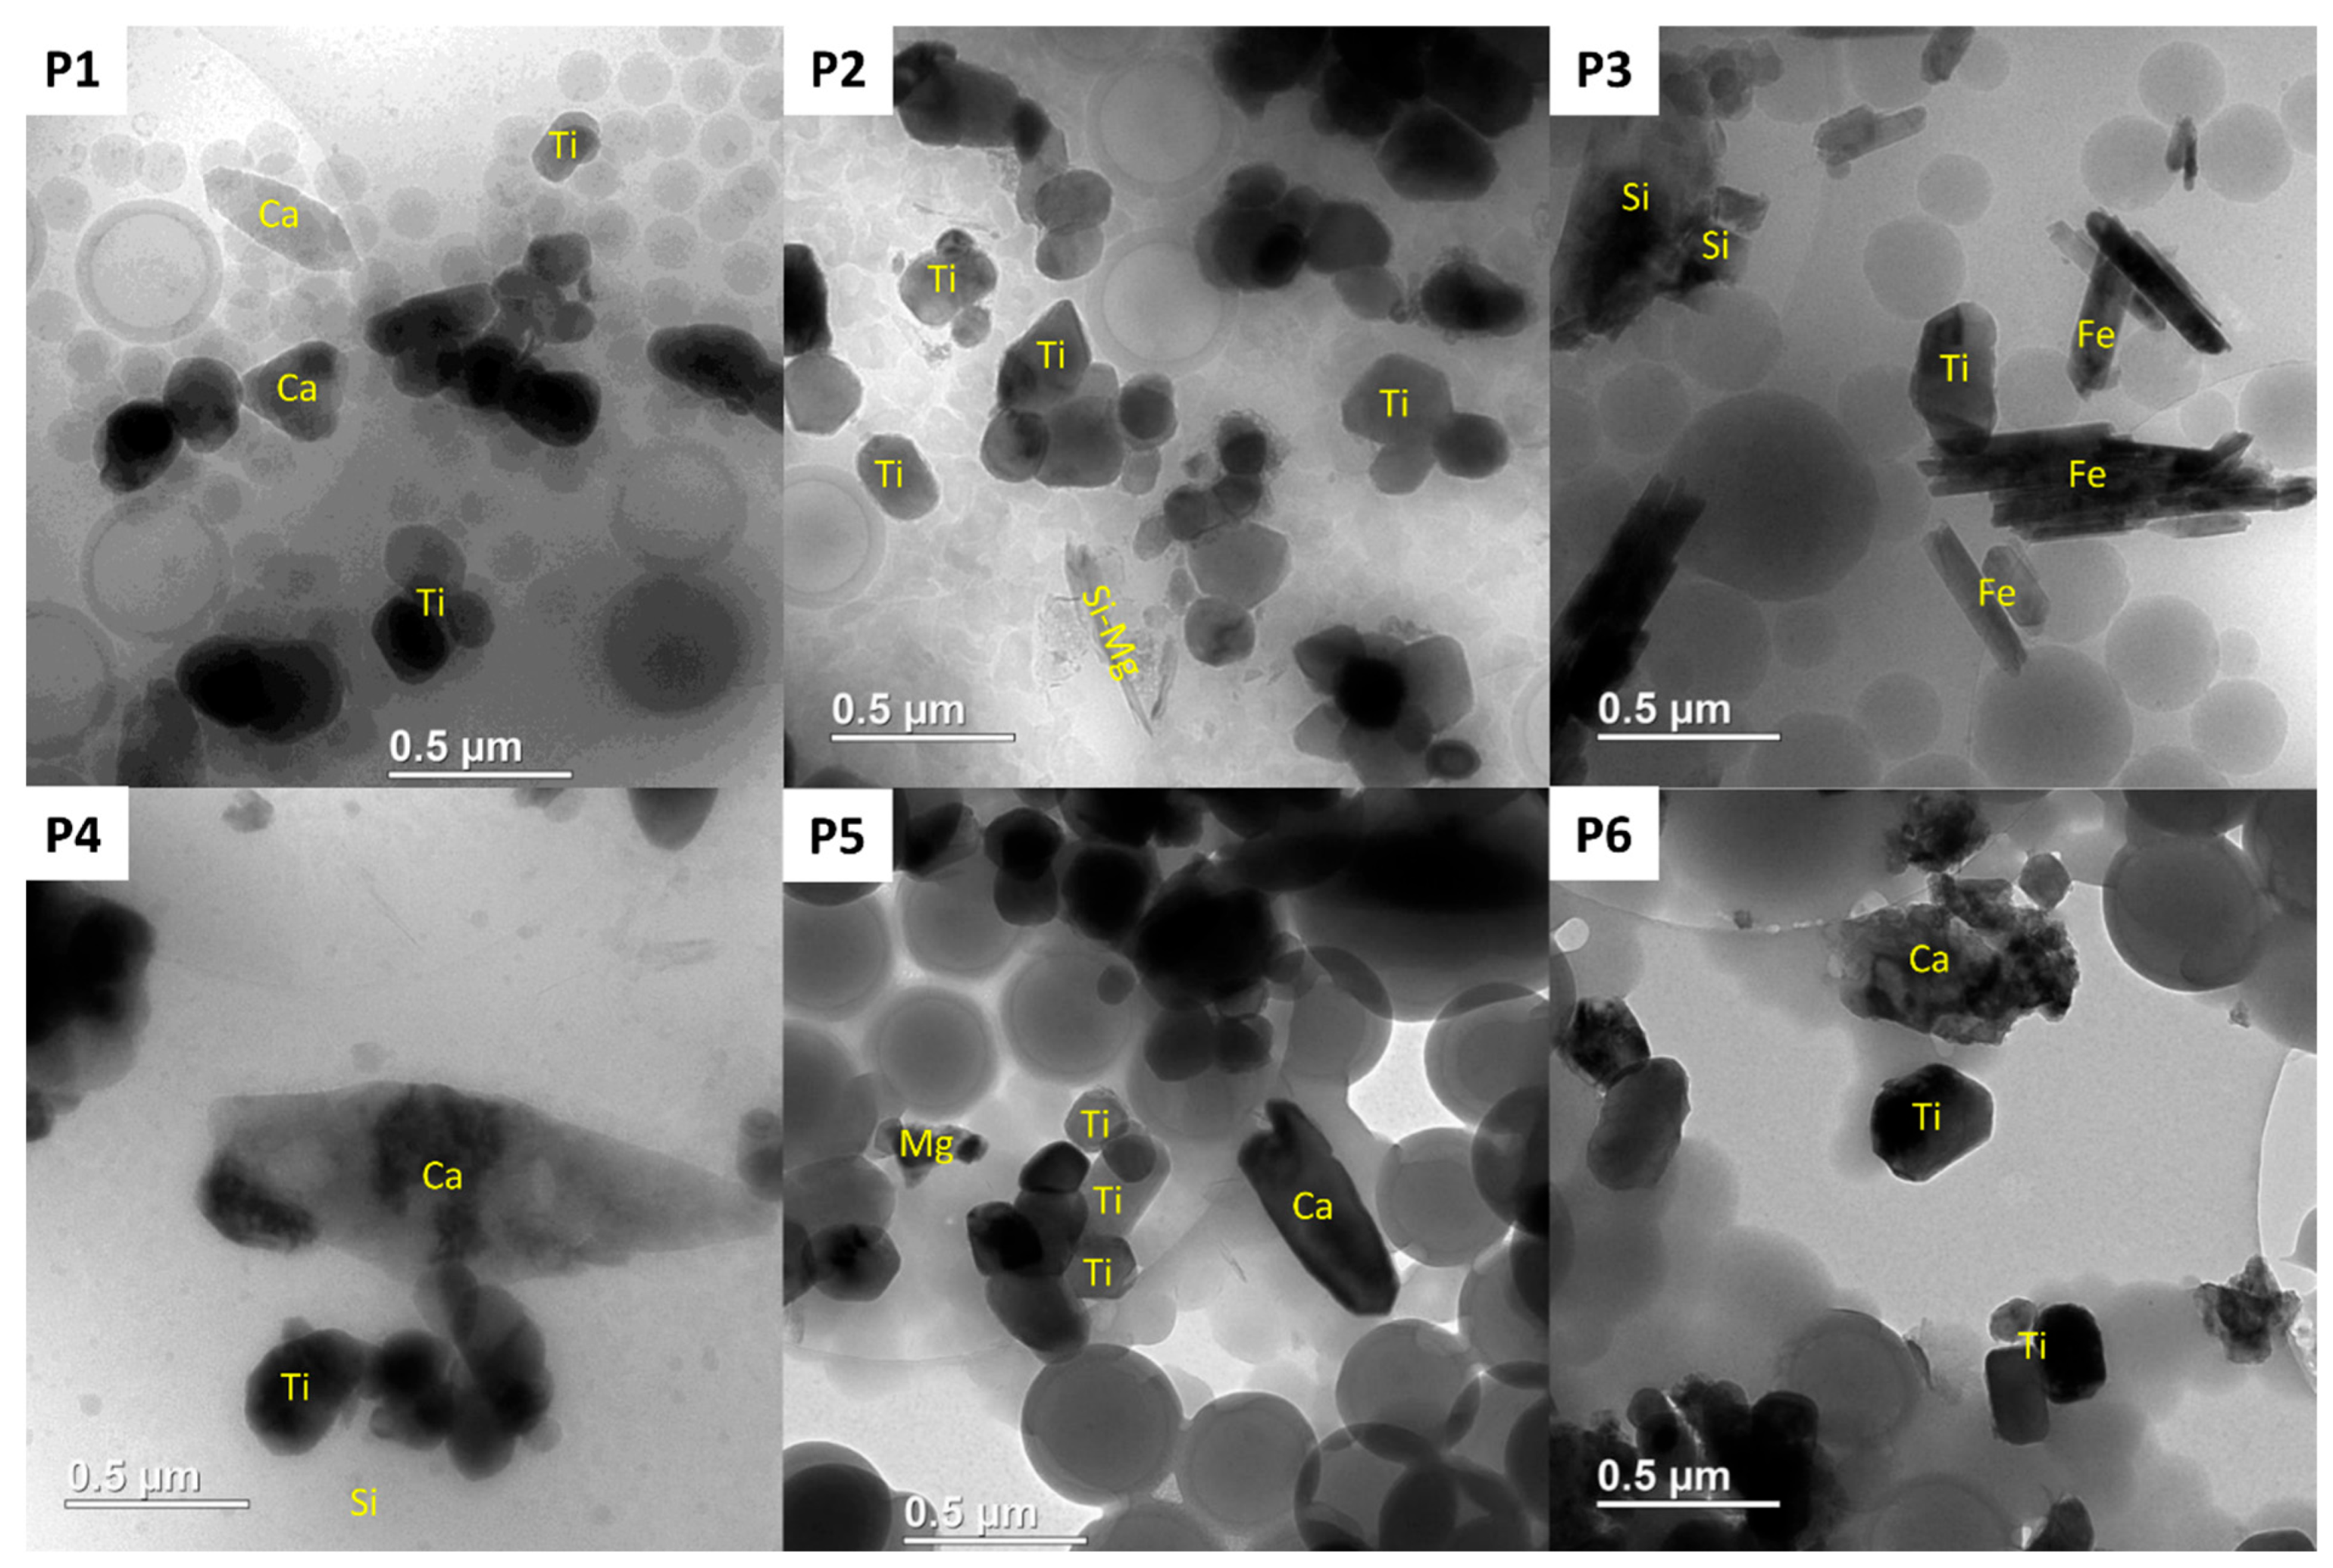
Cryo-TEM imaging of the wet paints combined with elemental analysis using XEDS qualitatively confirmed the presence of the main components as identified in IR, ICP-OES, and TGA-MS. The polymers were observable as smooth low-contrast spherical droplets suspended in water, as observed in other emulsions (Figure 2) [28]. After drying, these droplets collapse and form a solid matrix entrapping the mineral particles (Figures S1 and S2). XEDS analyses could confirm the presence of TiO2 in all paints. The size and morphology of the TiO2 particles are similar between the paints with lengths between 100 and 500 nm and a slightly angular and occasionally slightly elongated shape.
The consistent presence of traces of Al with Ti suggests that the TiO2 particles are probably coated with Al-based material for inhibiting the photocatalytic activity as in RTC-90 and other TiO2 particles used in cosmetic products [28]. This observation was confirmed by transferring the P4 sample from the cryo-TEM to the HR-TEM and carrying out XEDS mapping (Figures S1 and S2, see Supplementary Materials for the methodology). The higher signal of Al around the Ti-containing particles indicates the presence of a patchy Al-based coating. A similar halo is visible for Si and sometimes for C; however, we cannot exclude a deposition due to drying in the non-cooled sample holder of the HR-TEM for these elements. Indeed, Si and C are detected everywhere in the sample in contrast to Al (Figures S1 and S2).
The silicate ions partially formed a solid matrix (most probably SiO2) in the wet paints with the highest concentrations of Si (P2 and P4) as observed in the cryo-TEM (Figure S3). Such a SiO2 matrix represents a challenge for the extraction of TiO2 as shown below. Most particles are agglomerated in the wet paint (Figure 2). Therefore, we can expect that these particles will be released mostly as agglomerates in the environment (e.g., during weathering), as further agglomeration may occur during the drying of the paint after application.
Overall, the selected paints differed strongly in composition (Table 1 and Figure 1), suggesting that the selection covers a wide range of possible compositions. Considering the composition of the paint matrix and of R-TC90 as a representative for white pigment, two challenges become obvious for the extraction of TiO2 from paints. The first is that the pigment should be separated from the other main components: organic (co)polymers, CaCO3, silicate ions, and SiO2 particles. As these compounds are chemically very different from each other, the extraction method should combine different strategies and/or reagents to remove all of them. The second challenge is to ensure that the pigment’s coating (Al-based and organic) is not removed during the process.

3.2. Extraction Method

Since the TiO2 particles seem to be localized outside the lipophilic droplets in the wet paint (Figure 2), we assumed that the polymers could be separated using liquid–liquid extraction. However, our attempts to separate the polymers from the inorganic particles using various solvents such as ethyl acetate, toluene, acetonitrile, acetone, or aqueous solutions of surfactants, for instance, at room temperature using a separation funnel or at ebullition in a liquid–liquid continuous extractor were unsuccessful. Therefore, a solid–liquid extraction approach was tested with various solvents, among which AcOH was, by far, the most efficient in removing the polymers and the carbonates, as confirmed visually and with IR spectrometry. AcOH is a versatile solvent which can dissolve hydrophilic as well as hydrophobic compounds, which helps dissolve amphiphilic copolymers. Furthermore, the acidic character of AcOH triggers the conversion of CO32− into CO2, and AcO- can form complexes with Ca2+, thus promoting the dissolution of CaCO3.
The NaOH method was designed to remove more efficiently both carbonate and silicate. EDTA is well known for forming a strong hexadentate complex with Ca2+, hence promoting the dissolution of CaCO3 [29]. The high concentration of NaOH ensures the complete deprotonation of the EDTA’s carboxylic acids involved in the complexation of Ca2+ and a higher solubility of silicate ions, thus inhibiting the formation of SiO2 [30]. In addition, the alkaline conditions and the high temperature promote the hydrolysis of ester groups which are present in some polymers such as polyacrylate, which increases their hydrophilicity. Nonetheless, the complete dissolution of SiO2 under those conditions is not warranted, as this usually requires high pressure in addition to high temperature [31].
Concerning the isolation of the TiO2 particles from the paint matrices, the removal of CaCO3 was evident from the IR spectra (Figure 1) of the extract and the compositional analysis (Table 2). While the carbonate was completely removed in the NaOH extracts, some traces (<6%) could still be detected in some AcOH extracts. The AcOH treatment removed more efficiently the polymers than NaOH, as indicated by the stronger decrease in the characteristic C=O band around 1700 cm−1 and the C-H bands around 2900–3000 cm−1 for the AcOH extracts (Figure 1). This is confirmed by the, on average, lower contents in organic carbon measured in the AcOH extracts compared to the NaOH extracts (Table 2). However, clear differences between the paints can be observed, with P1 polymers being the most difficult to extract for both methods. It must be noted that for the NaOH method, using milder conditions such as room temperature resulted in additional bands around 600–800 cm−1 and higher relative intensity of the SiO2 bands for P1 compared to the high-temperature conditions (Figure S4), hence indicating that high temperatures help in removing polymers and SiO2.
The SiO2 could not be completely separated from the TiO2 by any of the methods, as a broad peak characteristic for Si-O bonds around 1000 cm−1 can be observed on the spectra of all extracts from Si-containing paints (P1–5). Our attempts to separate these compounds in pre-experiments using centrifugation, filtration, and density separation failed despite the differences in size and density of SiO2 and TiO2, suggesting a strong association (e.g., heteroaggregation) of both components. This implies that for extracting nanoparticles for environmental experiments, paints without SiO2 should be preferred.
The recoveries in terms of TiO2 were satisfactory, with 70–110% for the NaOH method and between 67 and 122% for the AcOH method. Most of the losses were probably due to the visible sorption of the hydrophobic particles on the walls of the centrifuge tube. Furthermore, a part of the TiO2 smaller than 100 nm could be lost during the centrifugation as discussed above. The differences observed between the samples are most probably related to the different properties and relative amount of the polymers present in the paints. Indeed, the IR spectra suggest that the polymers used in the paint differ in terms of chemical structure, which could result in different surface properties of the particles interacting with them during the centrifugation process. This would influence the interaction with the walls of the centrifuge tube and, thereafter, the recovery.
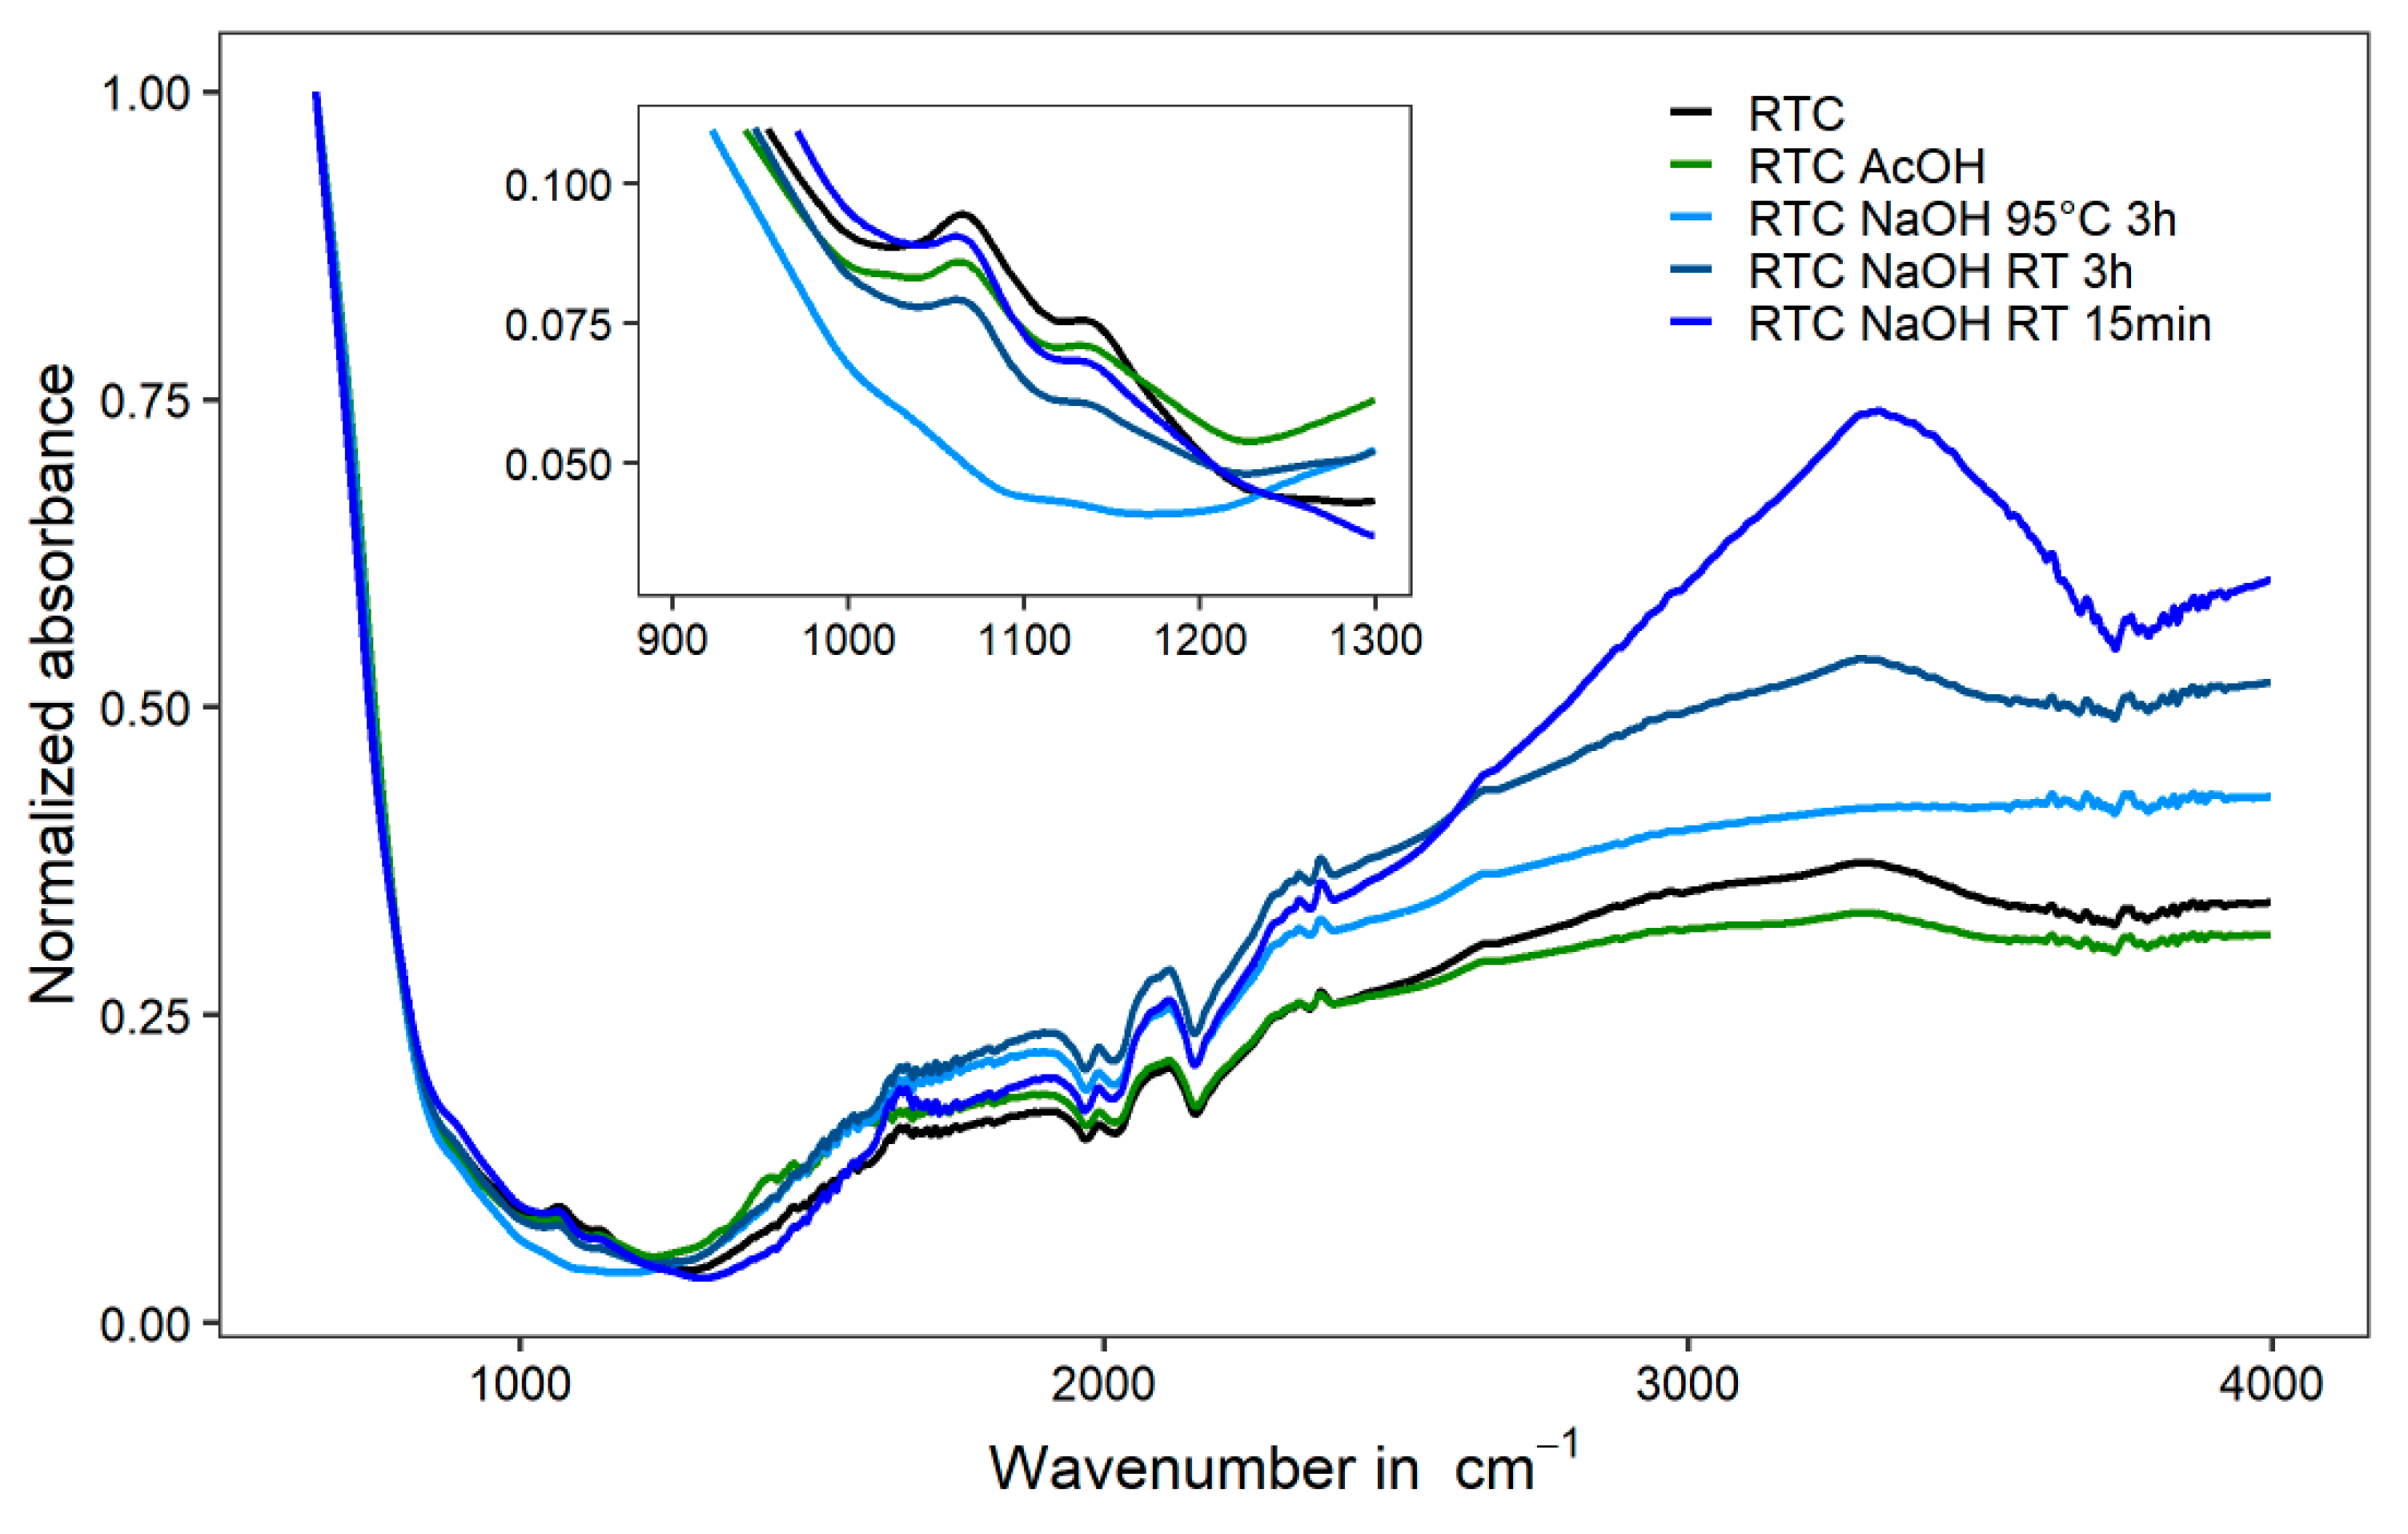
Since determining the surface coating of the pigment inside the paint was not possible, the R-TC90 pigment was used to test the stability of the coating during the extraction. After going through the same procedure as the paint, the pigment was characterized using IR (Figure 3). The small bands between 1000 and 1200 cm−1 and around 3200 cm−1 correspond well with AlO(OH) [27]. These bands disappeared after extraction with NaOH but not with AcOH, suggesting that the Al-based coating dissolved under alkaline conditions at 95 °C but not under mild acidic conditions. The typical bands of an organic coating could not be observed on the IR spectra of the R-TC90 pigment due to the low sensitivity of our IR spectrometer. Nonetheless, the TGA-QMS results indicate that there is an organic coating representing approximately 2% of the dry mass, which is stable after the AcOH extraction but is removed during the NaOH extraction. Indeed, the concentrations of Al and organic molecules in the AcOH extract were very close to the concentrations in the pristine pigment (Table 1 and Table 2). Furthermore, Al was detected in P6’s AcOH extract, although it could not be detected in the paint. Given the limit of detection (LOD) for Al in paints, it is possible that the Al-based coating was only detectable after TiO2 enrichment in the extract. We investigated the composition of the coating before and after extraction with AcOH using XPS (Table 3). A mixture of Al-oxides/hydroxides and mostly aliphatic molecules was detected on both samples. The extracted sample contained approximately 4% more oxidized C than the pristine one, indicating that a small part of the aliphatic molecules was replaced by hydrophilic ones containing carboxylic groups. It is possible that acetic acid binds on some of the metal oxides surfaces and, hence, increases the amount of oxidized carbon. Nonetheless, these changes are overall minor, as the hydrophobicity of the particles was visibly retained after extraction.
To evaluate whether the removal of the organic and AlO(OH) coatings could be avoided in the NaOH method, two milder versions of the method were tested. The IR bands corresponding to the AlO(OH) coating are better preserved after reducing the temperature and stirring time (Figure 3). However, the large O-H bands between 3000 and 3500 cm−1 are much more pronounced for the mildest conditions, suggesting that new hydroxylic groups appeared on the particle’s surface.
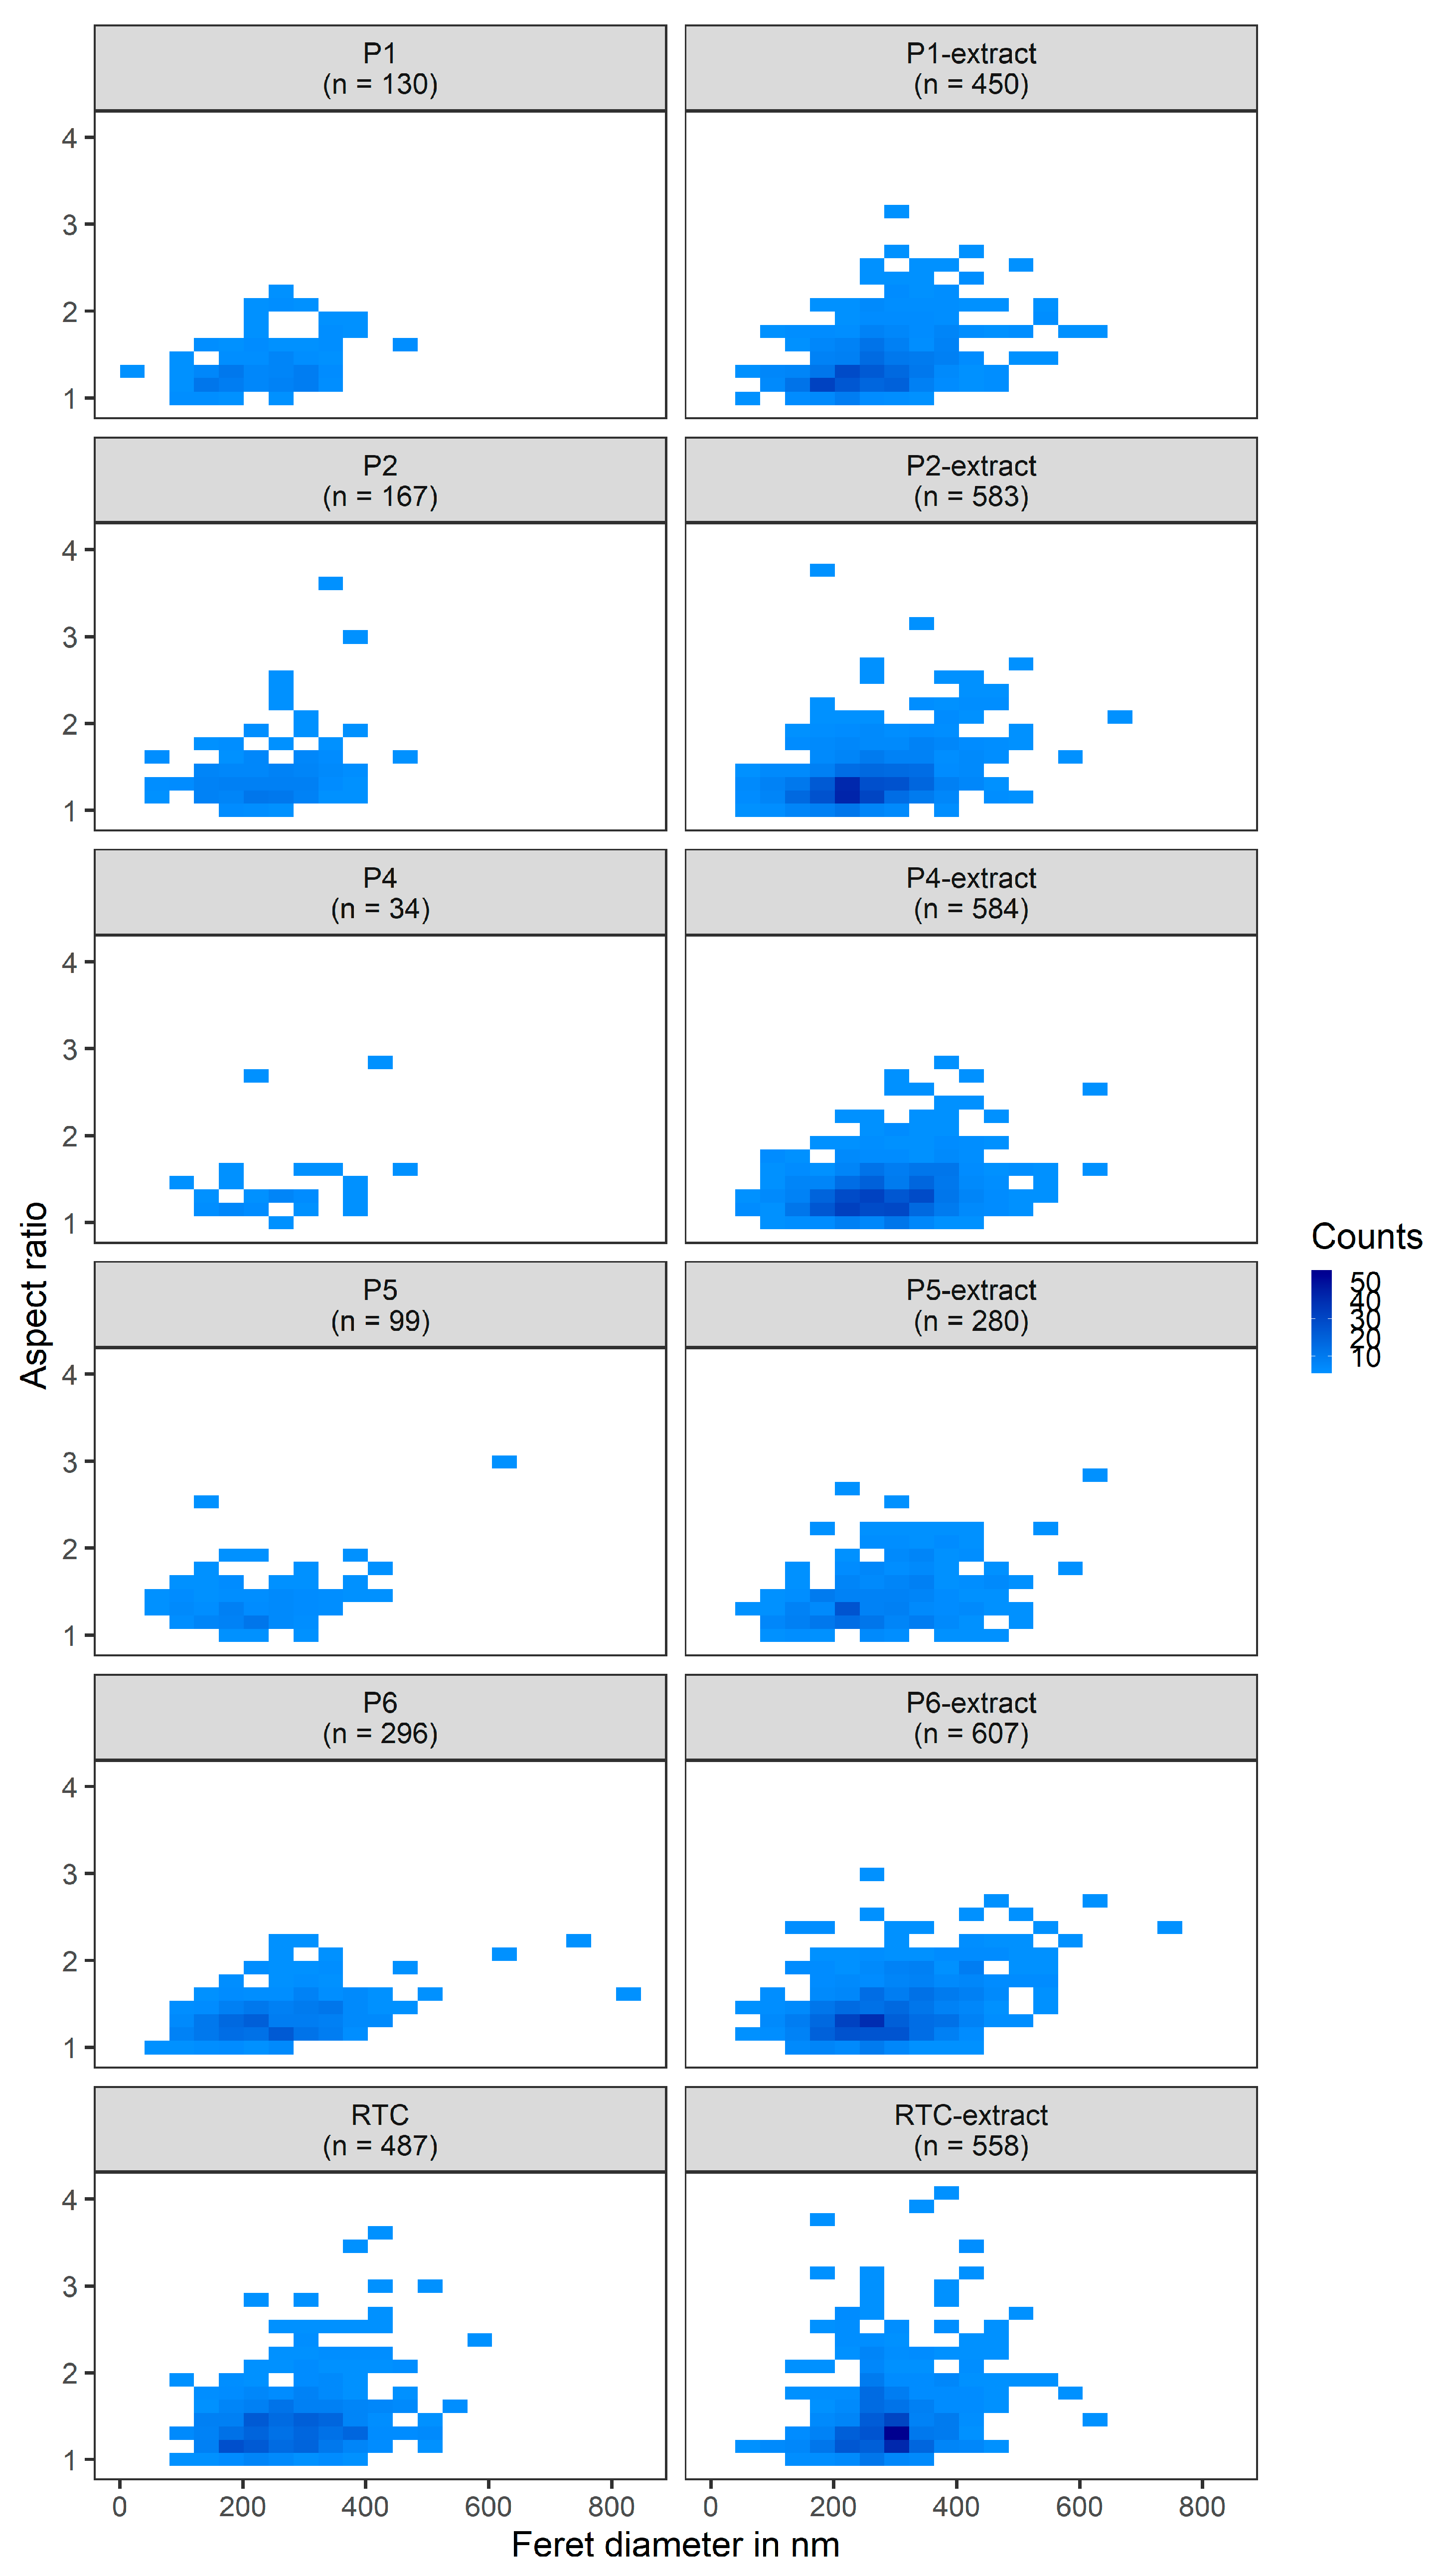
In terms of particle morphology, there were no significant differences between the aspect ratio of the RTC sample before and after extraction with AcOH, suggesting that the shape of the particle is retained during the extraction. Similarly, the shapes of the TiO2 particles in the paint sample were similar to the ones observed after extraction (see Figure 4 and Table S2). However, a significant increase in the Feret diameter of around 3–20% was observed after extraction (Figure 4 and Table S2). Although the largest part of this difference is probably due to a bias arising from comparing TEM and SEM images (see Supplementary Materials for a detailed discussion), a small difference (~3%) in size could be attributed to the smallest particles not being completely settled during the centrifugation. Nonetheless, we consider this minor change to be fully acceptable in practice.

3.3. TiO2 Pigments Characterization

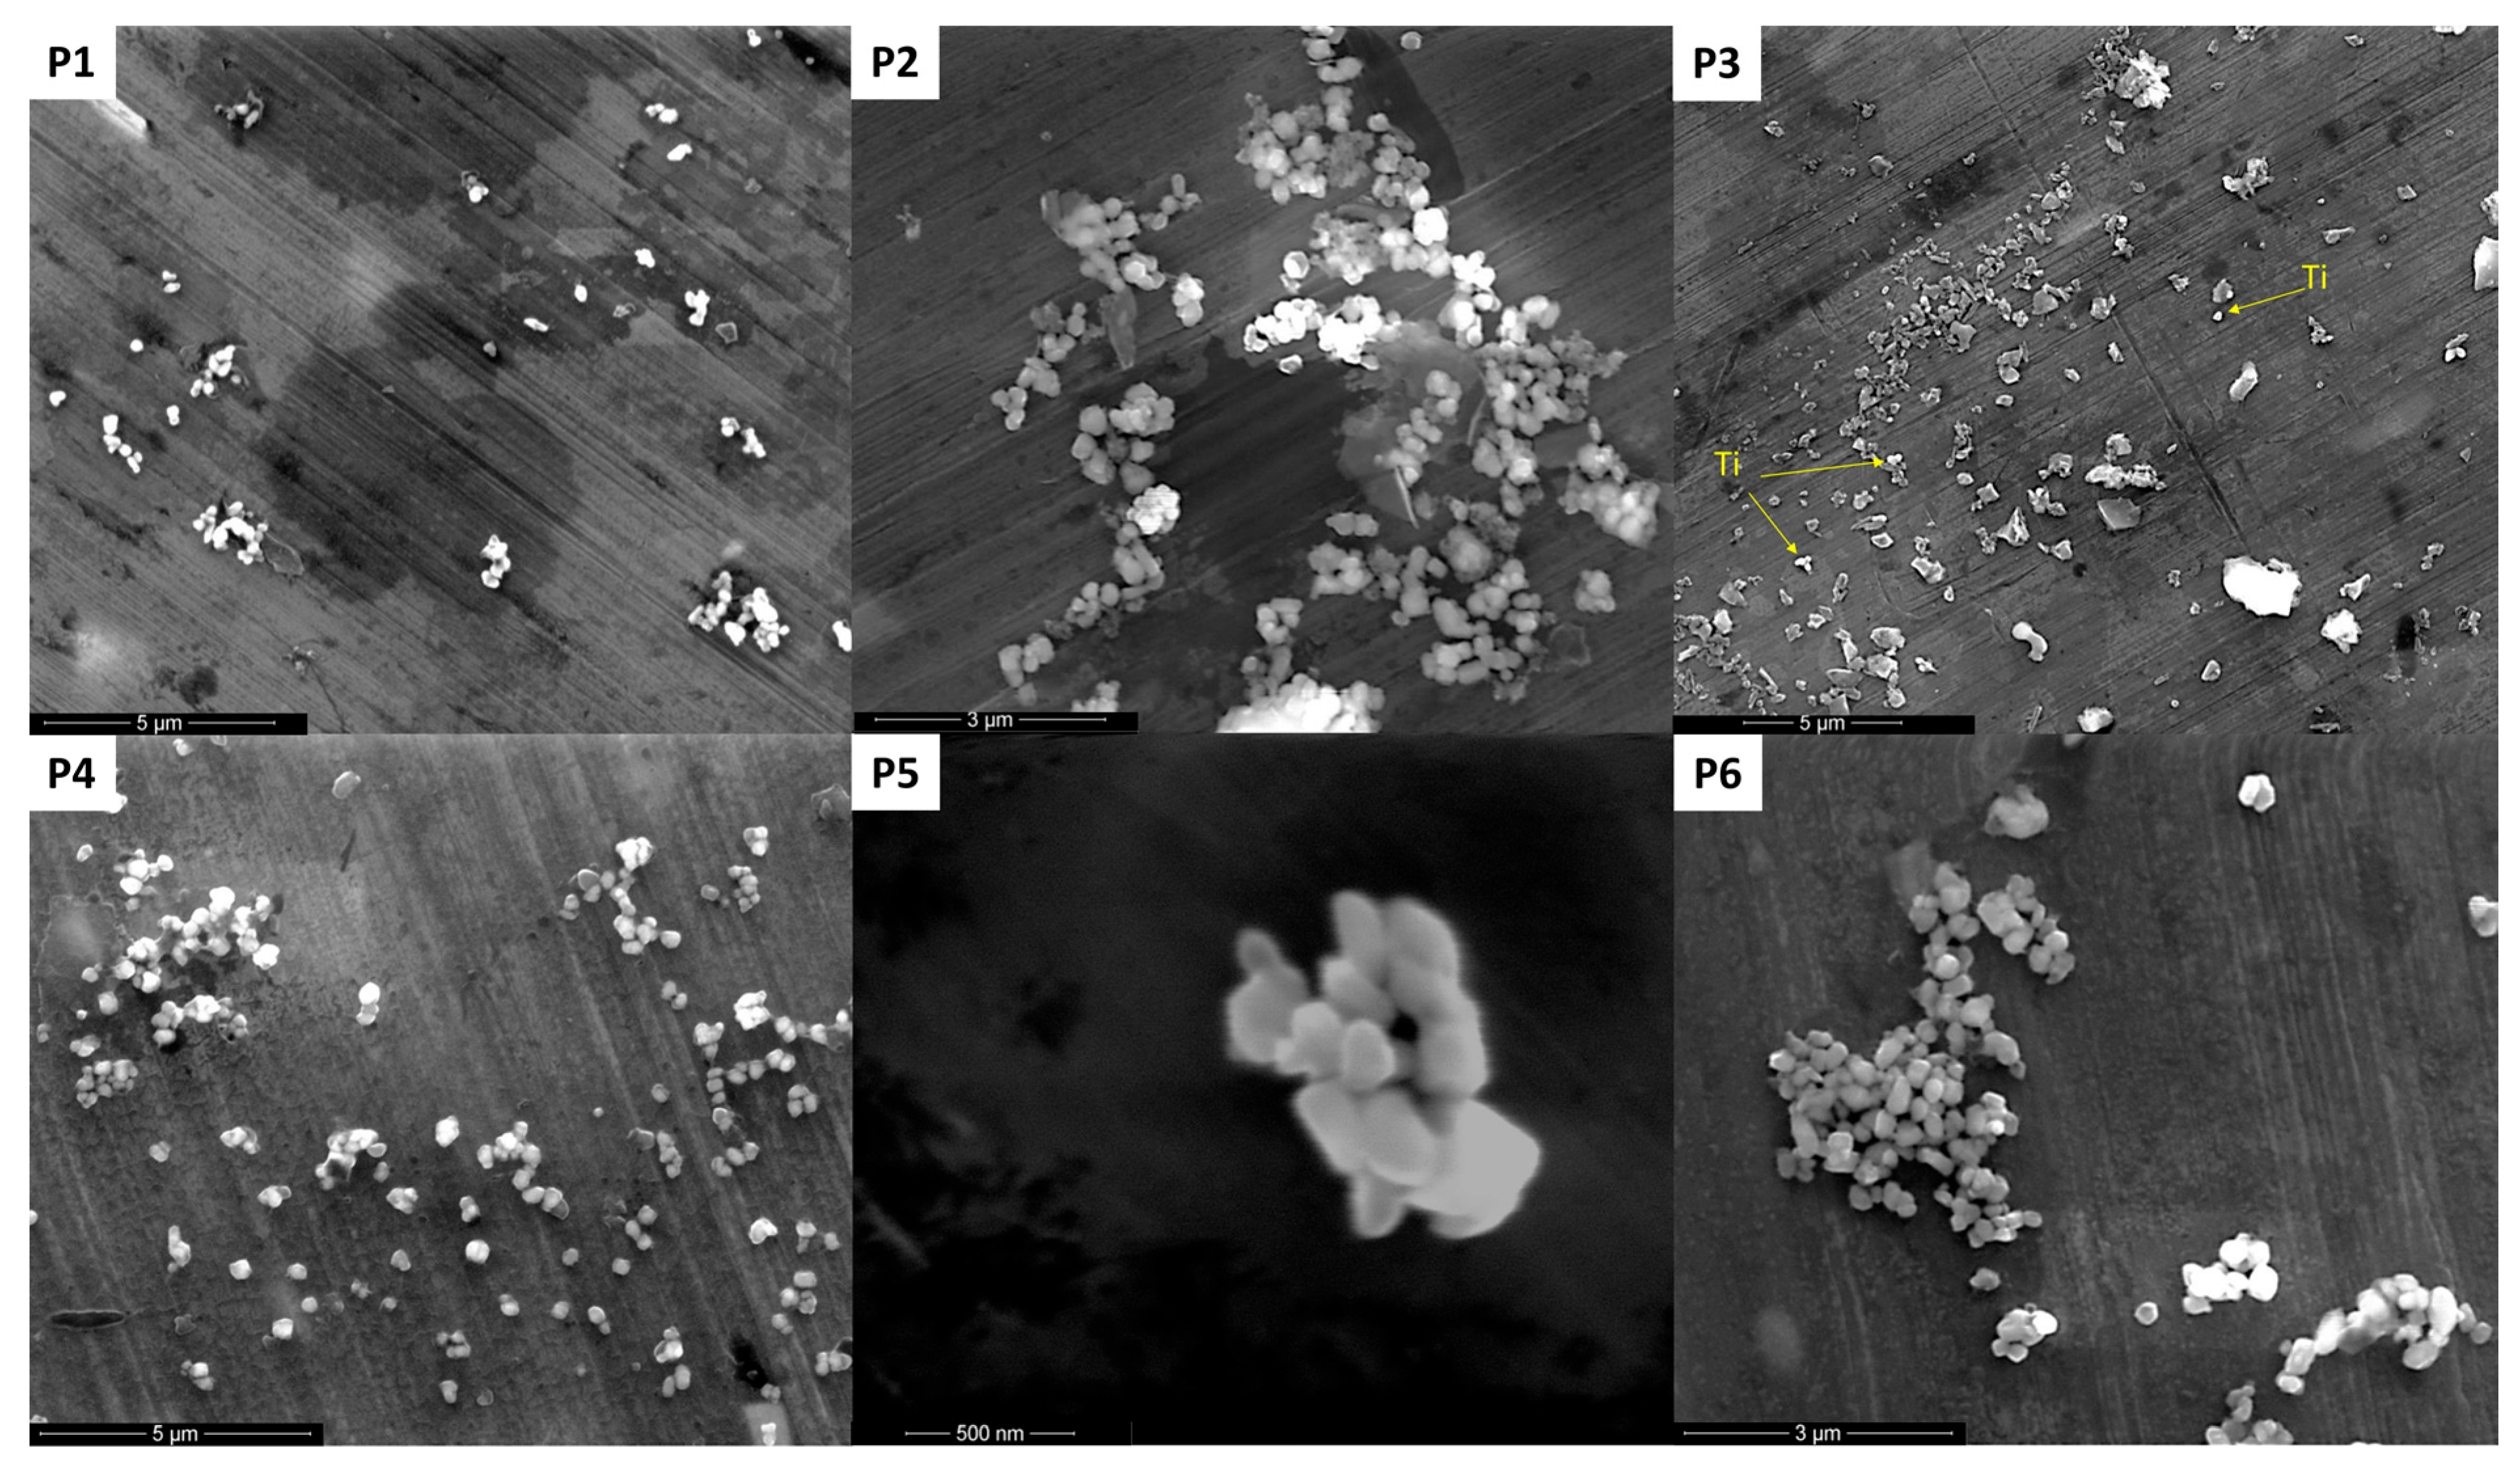
All TiO2 particles detected in the paint extracts had a similar morphology and size (Figure 4 and Figure 5). Furthermore, the extracted particles were very similar in terms of size and morphology to the R-TC90 pigment (Figure 4), confirming the relevance of this pigment for evaluating the validity of the extraction method. The median sizes (Feret diameter) ranged from 212 to 286 nm, with most of the particles being between 200 and 400 nm large (Table S2). The median aspect ratios range from 1.34 to 1.49 (Table S2), indicating that the particles are slightly elongated on average. The shape was mostly angular with some particles being triangular or, more rarely, rode shaped.
Considering the size range, the extracted particles are quite comparable to the particles detected in a diluted paint using single-particle ICP-MS but larger than those obtained from outdoor weathering of surfaces painted with the same paint [5,6]. However, the paint used in these studies is advertised to contain nanoparticles. Therefore, it is likely that the average size of the primary particles is less than 100 nm but that they are detected as aggregates during the single-particle ICP-MS analysis. This highlights the need to characterize in detail the nanomaterials used in paint and coatings to investigate their environmental fate and impact.
In terms of crystal phase, only rutile could be detected in the RTC before and after extraction with AcOH as well as in the samples extracted with AcOH (Figure S5). Therefore, the extraction does not alter the crystal phase. The similarity in terms of crystal structure between the RTC pigment and the extracted TiO2 particles from the commercial paint confirms that RTC is a good representative for pigments used in commercial paints.d

4. Conclusions

The proposed methods are applicable for environmental studies as they are simple, scalable, low-cost, and environmentally friendly. The AcOH method is recommended when the preservation of the coating is essential for the research goals. A higher purification rate could be achieved by repeating the extraction process several times if needed. The NaOH method results in less SiO2 in the extract but more organics, and it removes most of the Al-based coating. Since the silicates present in many commercial paints already form some SiO2 inside the paint, it is important to select a paint without silicates if the presence of SiO2 is an issue for the further use of the extracted particles. A further improvement could be to develop a method for separating SiO2 from TiO2, e.g., utilizing differences in surface charges; however, this remains a challenging task for the currently available techniques [18]. Such a method would nonetheless be important for other tasks such as extracting TiO2 from soils, for instance. The proposed method would also highly benefit from comparison with particles released from painted materials through weathering under controlled conditions to confirm their environmental relevance.
Finally, although it was not the focus of this study, the proposed methods could be interesting for recycling paint pigments, as AcOH could be easily recycled by distillation, for example. Since the coating is preserved, the pigments could be directly re-used in new formulations. In that case, the presence of SiO2 may not necessarily be an issue.

Supplementary Materials

The following supporting information can be downloaded at: https://www.mdpi.com/article/10.3390/separations12040091/s1, Table S1: composition of the paint sample based on the information available on the packaging, Figure S1: HR-TEM image of several TiO2- and Ca-containing particles, Figure S2: HR-TEM image of one isolated TiO2 particle, Figure S3: cryo-TEM images of the paints P2 and P4 showing the presence of solid phases containing Si, Table S2: metrics of the size and aspect ratio distributions, Figure S4: IR spectra of the dried paint P1, Figure S5: XRD-diffractograms.

Author Contributions

A.P.: Data curation, Formal analysis, Funding acquisition, Investigation, Methodology, Project administration, Resources, Supervision, Validation, Visualization, Writing—original draft. S.N.-K.: Investigation, Methodology, Validation, Writing—review & editing. C.F.: Investigation, Validation, Writing—review & editing. J.-M.G.: Investigation, Writing—review & editing. B.H.: Investigation, Writing—review & editing. E.D.L.: investigation, Writing—review & editing. All authors have read and agreed to the published version of the manuscript.

Funding

This research was founded by the German Research Foundation (DFG, project number: 458047880, PH 277/4-1) and the Karlsruhe Nano Micro facility.

Data Availability Statement

Data for this article, including IR spectra, sizes from the SEM images, and ICP-OES processed data are available at Zenodo at https://doi.org/10.5281/zenodo.12744368.

Acknowledgments

The authors would also like to thank Michel Gad and Oliver Lechtenfeld for their support in the characterization of the organic coating, Anna Baskal for the support with ICP-OES measurements, Tillmann Beck and Shirin Falakboland for helping us with the SEM imaging, Vanessa Trouillet from the Karlsruhe Nano Micro facility (KNMFi) for the XPS measurements, and Mathilde Knott and Gabrielle E. Schaumann for the organizational support as group leaders.

Conflicts of Interest

The authors declare no conflicts of interest.

Abbreviations

The following abbreviations are used in this manuscript:
cryo-TEMCryogenic-transmission electron microscopy
ICP-OESInductively coupled plasma optical emission spectroscopy
TGA-QMSThermogravimetry coupled with quadrupole mass spectrometry
IRInfrared spectroscopy
EDTAEthylenediaminetetraacetic acid
AcOHAcetic acid
UPWUltrapure water
XEDSX-ray energy dispersive spectroscopy
SEMScanning electron microscopy
XRDX-ray powder diffraction
XPSX-ray photoelectron spectroscopy

References

  1. Heilgeist, S.; Sekine, R.; Sahin, O.; Stewart, R.A. Finding Nano: Challenges Involved in Monitoring the Presence and Fate of Engineered Titanium Dioxide Nanoparticles in Aquatic Environments. Water 2021, 13, 734. [Google Scholar] [CrossRef]
  2. Karlsson, M.C.F.; Álvarez-Asencio, R.; Bordes, R.; Larsson, A.; Taylor, P.; Steenari, B.M. Characterization of paint formulated using secondary TiO2 pigments recovered from waste paint. J. Coat. Technol. Res. 2019, 16, 607–614. [Google Scholar] [CrossRef]
  3. Kirsch, S.; Pfaua, A.; Frechen, T.; Schrof, W.; Pföhler, P.; Francke, D. Scrub resistance of highly pigmented paints: A study on abrasion mechanisms of different scrub techniques. Prog. Org. Coat. 2001, 43, 99–110. [Google Scholar]
  4. Baalousha, M.; Yang, Y.; Vance, M.E.; Colman, B.P.; McNeal, S.; Xu, J.; Blaszczak, J.; Steele, M.; Bernhardt, E.; Hochella, M.F., Jr. Outdoor urban nanomaterials: The emergence of a new, integrated, and critical field of study. Sci. Total Environ. 2016, 557, 740–753. [Google Scholar]
  5. Azimzada, A.; Farner, J.M.; Jreije, I.; Hadioui, M.; Liu-Kang, C.; Tufenkji, N.; Shaw, P.; Wilkinson, K.J. Single-and multi-element quantification and characterization of TiO2 nanoparticles released from outdoor stains and paints. Front. Environ. Sci. 2020, 8, 91. [Google Scholar]
  6. Azimzada, A.; Farner, J.M.; Hadioui, M.; Liu-Kang, C.; Jreije, I.; Tufenkji, N.; Wilkinson, K.J. Release of TiO2 nanoparticles from painted surfaces in cold climates: Characterization using a high sensitivity single-particle ICP-MS. Environ. Sci. Nano 2020, 7, 139–148. [Google Scholar]
  7. Baalousha, M.; Wang, J.; Nabi, M.; Loosli, F.; Valenca, R.; Mohanty, S.K.; Afrooz, N.; Cantando, E.; Aich, N. Stormwater green infrastructures retain high concentrations of TiO2 engineered (nano)-particles. J. Hazard. Mater. 2020, 392, 122335. [Google Scholar] [PubMed]
  8. Wang, J.; Nabi, M.; Mohanty, S.K.; Afrooz, A.N.; Cantando, E.; Aich, N.; Baalousha, M. Detection and quantification of engineered particles in urban runoff. Chemosphere 2020, 248, 126070. [Google Scholar] [PubMed]
  9. Nabi, M.M.; Wang, J.; Goharian, E.; Baalousha, M. Temporal variation in TiO2 engineered particle concentrations in the Broad River during dry and wet weathers. Sci. Total Environ. 2021, 807, 151081. [Google Scholar]
  10. Wang, J.; Nabi, M.M.; Erfani, M.; Goharian, E.; Baalousha, M. Identification and Quantification of Anthropogenic Nanomaterials in Urban Rain and Runoff Using Single Particle-Inductively Coupled Plasma-Time of Flight-Mass Spectrometry. Environmental Science Nano 2022, 9, 714–729. [Google Scholar]
  11. Nabi, M.M.; Wang, J.; Baalousha, M. Detection and quantification of anthropogenic titanium, cerium, and lanthanum-bearing particles home dust. Environ. Sci. Nano 2023, 10, 1372–1384. [Google Scholar]
  12. Sharma, V.K. Aggregation and toxicity of titanium dioxide nanoparticles in aquatic environment—A Review. J. Environ. Sci. Health Part A 2009, 44, 1485–1495. [Google Scholar]
  13. Tan, W.; Peralta-Videa, J.R.; Gardea-Torresdey, J.L. Interaction of titanium dioxide nanoparticles with soil components and plants: Current knowledge and future research needs-a critical review. Environ. Sci. Nano 2018, 5, 257–278. [Google Scholar]
  14. Liu, H.H.; Cohen, Y. Multimedia environmental distribution of engineered nanomaterials. Environ. Sci. Technol. 2014, 48, 3281–3292. [Google Scholar]
  15. Phalyvong, K.; Sivry, Y.; Pauwels, H.; Gélabert, A.; Tharaud, M.; Wille, G.; Bourrat, X.; Ranville, J.F.; Benedetti, M.F. Assessing CeO2 and TiO2 nanoparticle concentrations in the Seine River and its tributaries near Paris. Front. Environ. Sci. 2021, 8, 271. [Google Scholar]
  16. Phalyvong, K.; Sivry, Y.; Pauwels, H.; Gélabert, A.; Tharaud, M.; Wille, G.; Bourrat, X.; Benedetti, M.F. Occurrence and origins of cerium dioxide and titanium dioxide nanoparticles in the Loire river (France) by single particle ICP-MS and FEG-SEM imaging. Front. Environ. Sci. 2020, 8, 141. [Google Scholar]
  17. Liu, Z.; Rui, M.; Yu, S. Occurrence of titanium dioxide nanoparticle in Taihu Lake (China) and its removal at a full-scale drinking water treatment plant. Environ. Sci. Pollut. Res. 2021, 29, 23352–23360. [Google Scholar]
  18. Campos, D.A.; Schaumann, G.E.; Philippe, A. Natural TiO2-Nanoparticles in Soils: A Review on Current and Potential Extraction Methods. Crit. Rev. Anal. Chem. 2020, 52, 735–755. [Google Scholar]
  19. Khomami, N.T.S.; Patel, P.M.; Jusi, C.P.; Trouillet, V.; David, J.; Schaumann, G.E.; Philippe, A. Influential parameters of surface waters on the formation of coating onto TiO2 nanoparticles under natural conditions. Environ. Sci. Nano 2021, 8, 3153–3166. [Google Scholar] [CrossRef]
  20. Xu, F. Review of analytical studies on TiO2 nanoparticles and particle aggregation, coagulation, flocculation, sedimentation, stabilization. Chemosphere 2018, 212, 662–677. [Google Scholar]
  21. Sani-Kast, N.; Labille, J.; Ollivier, P.; Slomberg, D.; Hungerbühler, K.; Scheringer, M. A network perspective reveals decreasing material diversity in studies on nanoparticle interactions with dissolved organic matter. Proc. Natl. Acad. Sci. USA 2017, 114, E1756–E1765. [Google Scholar] [PubMed]
  22. Tayyebi Sabet Khomami, N.; Welle, A.; Kunz, S.; Philippe, A. Sorption of Fulvic Acids onto Titanium Dioxide Nanoparticles Extracted from Commercial Sunscreens: ToF-SIMS and High-Dimensional Data Analysis. Coatings 2022, 12, 335. [Google Scholar]
  23. Karlsson, M.C.; Abbas, Z.; Bordes, R.; Cao, Y.; Larsson, A.; Taylor, P.; Steenari, B.-M. Characterisation of silicon, zirconium and aluminium coated titanium dioxide pigments recovered from paint waste. Dye. Pigment. 2019, 162, 145–152. [Google Scholar]
  24. Scofield, J.H. Hartree-Slater subshell photoionization cross-sections at 1254 and 1487 eV. J. Electron Spectrosc. Relat. Phenom. 1976, 8, 129–137. [Google Scholar]
  25. Fitzpatrick, R.W.; Chittleborough, D. Titanium and zirconium minerals. Soil Mineral. Environ. Appl. 2002, 7, 667–690. [Google Scholar]
  26. Khomami, N.T.S.; Philippe, A.; Abu Quba, A.A.; Lechtenfeld, O.J.; Guigner, J.-M.; Heissler, S.; Schaumann, G.E. Validation of a field deployable reactor for in situ formation of NOM-engineered nanoparticle corona. Environ. Sci. Nano 2020, 7, 486–500. [Google Scholar] [CrossRef]
  27. SDBS Database. (National Institute of Advanced Industrial Science and Technology). Available online: https://sdbs.db.aist.go.jp (accessed on 1 October 2023).
  28. Philippe, A.; Košík, J.; Welle, A.; Guigner, J.-M.; Clemens, O.; Schaumann, G.E. Extraction and characterization methods for titanium dioxide nanoparticles from commercialized sunscreens. Environ. Sci. Nano 2018, 5, 191–202. [Google Scholar]
  29. O’Brien, L.C.; Root, H.B.; Wei, C.C.; Jensen, D.; Shabestary, N.; De Meo, C.; Eder, D.J. M2+• EDTA binding affinities: A modern experiment in thermodynamics for the physical chemistry laboratory. J. Chem. Educ. 2015, 92, 1547–1551. [Google Scholar]
  30. Fertani-Gmati, M.; Jemal, M. Thermochemistry and kinetics of silica dissolution in NaOH aqueous solution. Thermochim. Acta 2011, 513, 43–48. [Google Scholar]
  31. Niibori, Y.; Kunita, M.; Tochiyama, O.; Chida, T. Dissolution rates of amorphous silica in highly alkaline solution. J. Nucl. Sci. Technol. 2000, 37, 349–357. [Google Scholar]
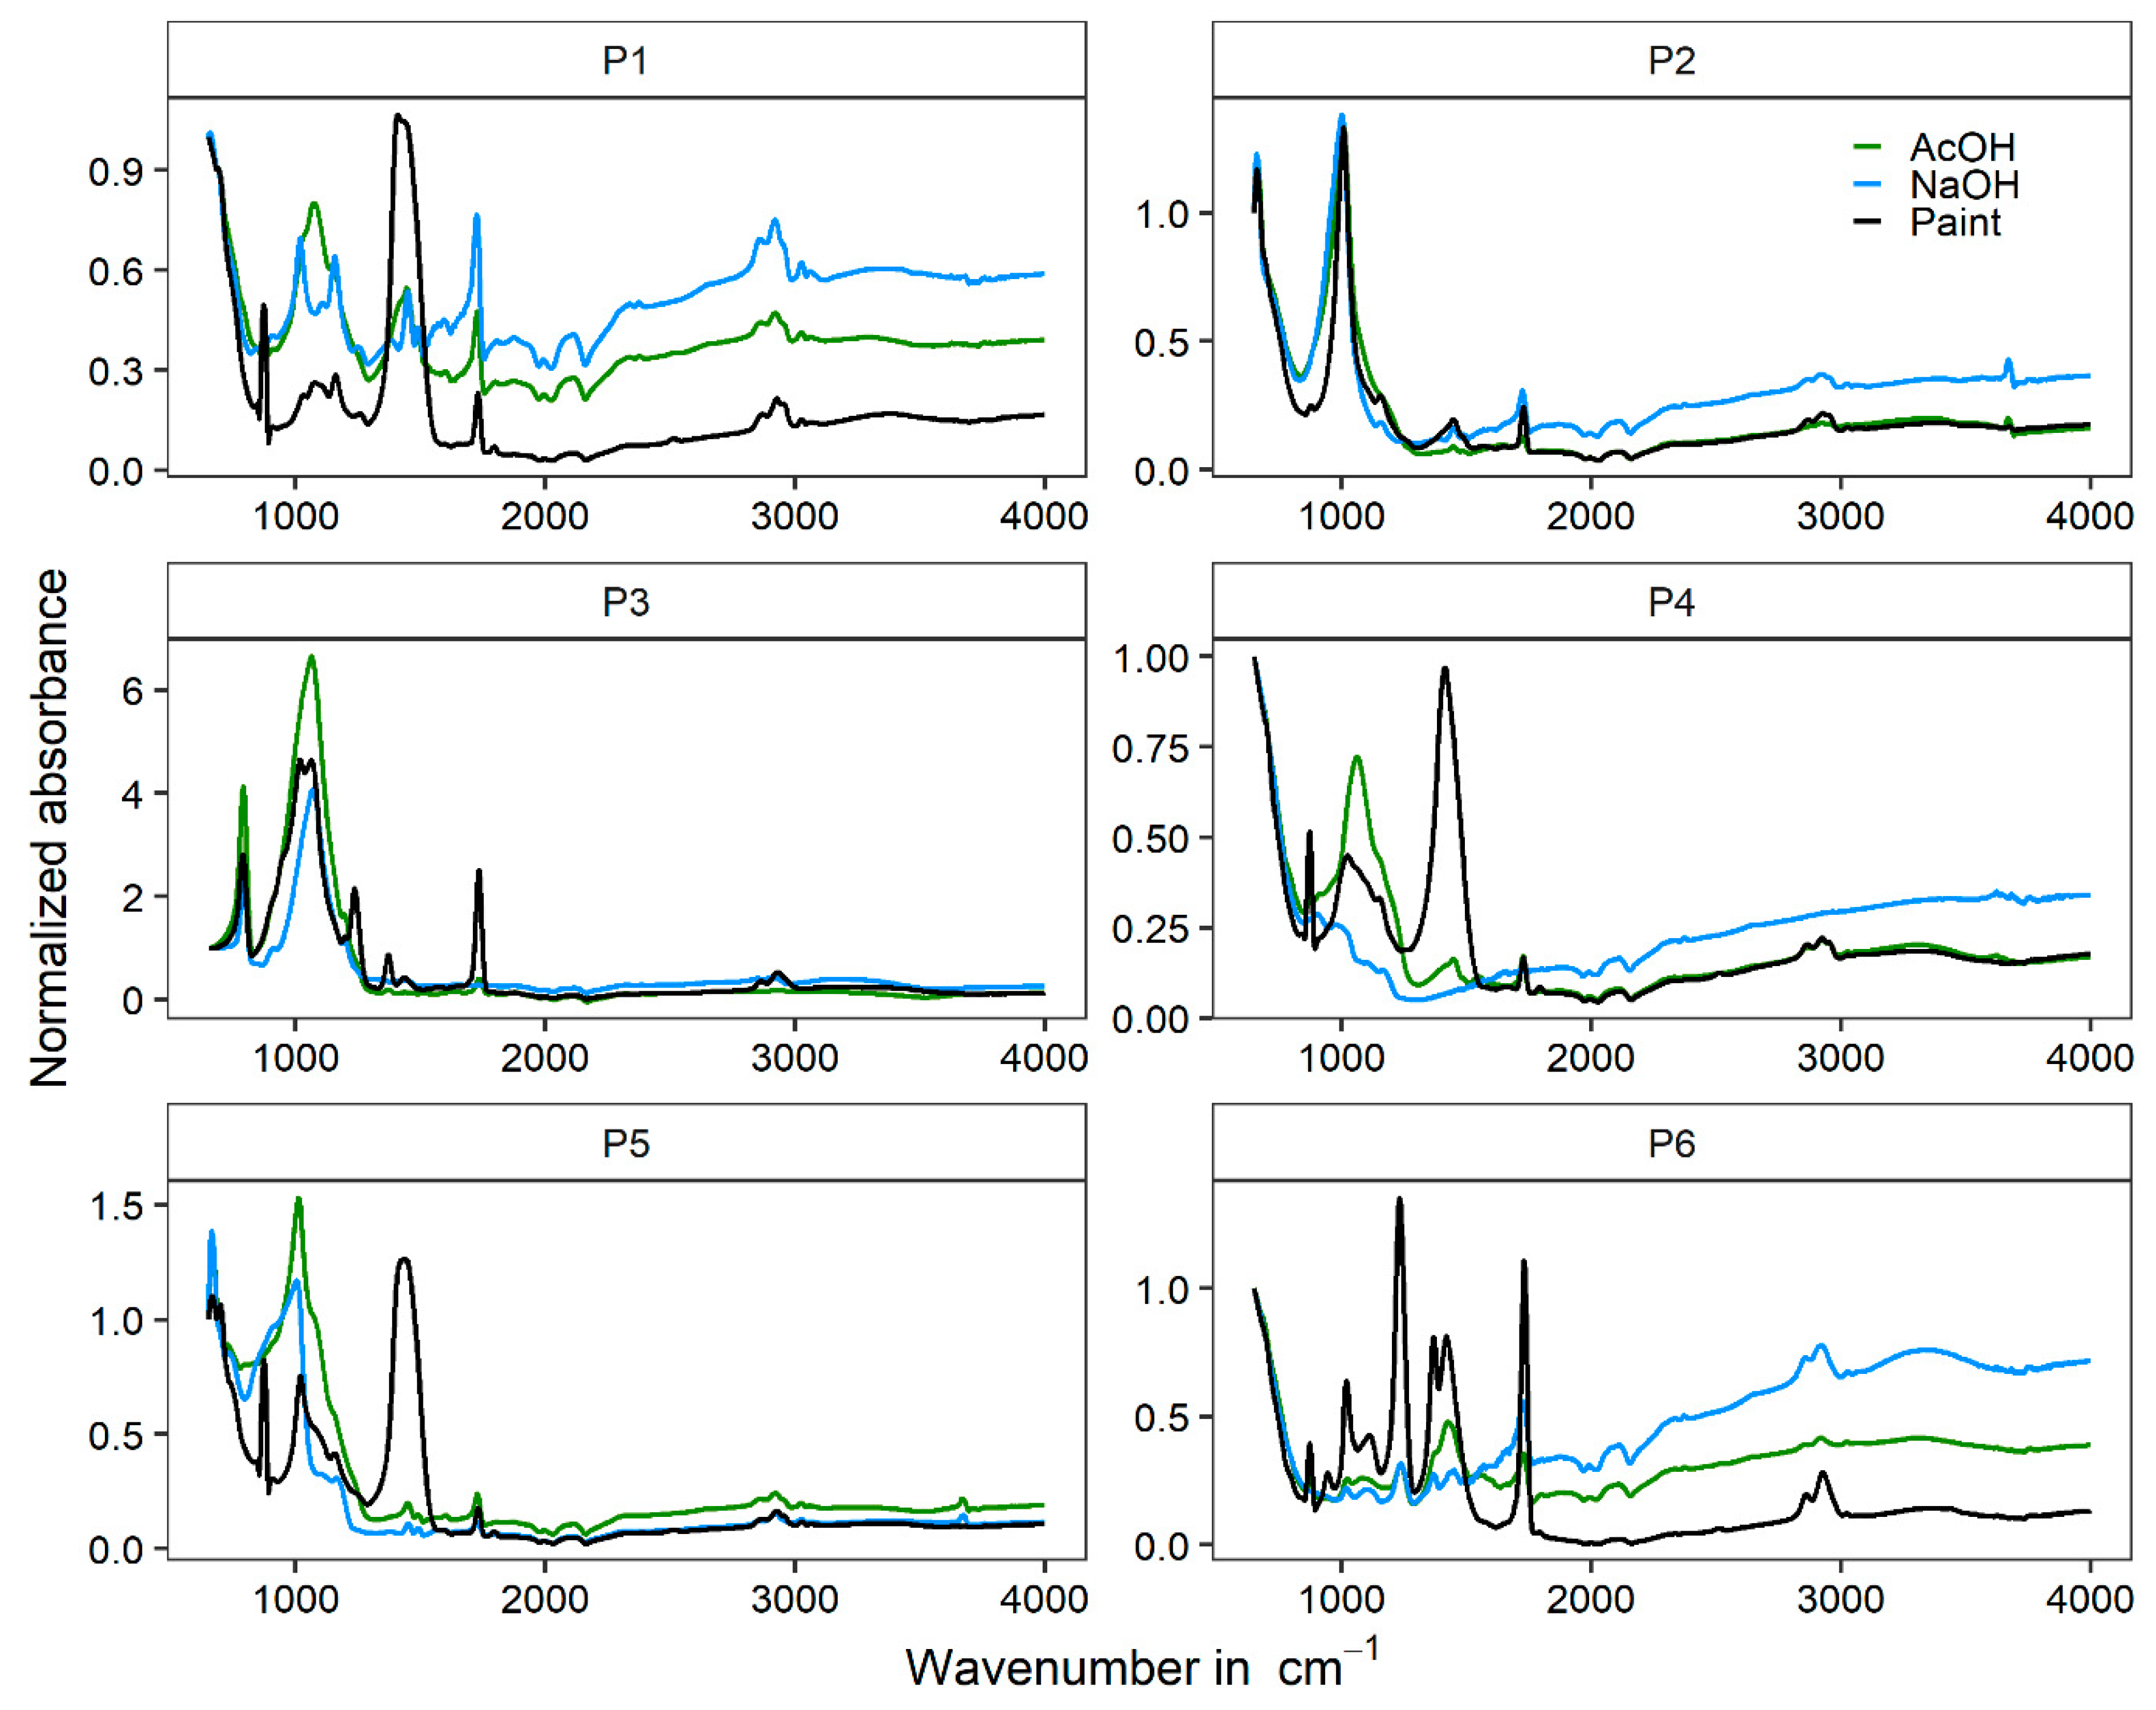
Figure 1. IR spectra of the dried paints (black lines) P1–6, the NaOH extracts (blue), and AcOH extracts (green). The absorbances were normalized by the peak of TiO2 at 650 cm−1. The shown spectra are the average of triplicates.
Separations 12 00091 g001
Figure 2. Representative cryo-TEM images of the wet paints P1–6 with text indicating the main element detected in the area using XEDS. Note that Cu, C, and O were detected everywhere due to the presence of water and the carbon-coated Cu grid. No other elements could be detected in the low-contrast highly spherical particles, suggesting that they are composed of organic polymers.
Separations 12 00091 g002
Figure 3. IR spectra of the reference pigment before extraction (RTC) and after extraction with NaOH and AcOH (RTC NaOH and RTC AcOH, respectively, each carried out with three replicates). The absorbances were normalized by the peak of TiO2 at 650 cm−1. The shown spectra are the average of three measurement replicates.
Separations 12 00091 g003
Figure 4. Feret diameter and aspect ratio distributions of the R-TC90 pigment and the TiO2 particles observed in the paint P1–6 using cryo-TEM and the TiO2 particles after extraction with AcOH determined using scanning electron microscopy (n = numbers of analyzed particles).
Separations 12 00091 g004
Figure 5. Representative SEM images of the TiO2 extracted from paints P1–6. The presence of Ti was confirmed using XEDS. For P3, only the particles pointed out with an arrow contained Ti, the other particles contained Si.
Separations 12 00091 g005
Table 1. Elemental composition in mg/g (wet paint) (ICP-OES), water content (gravimetry), and the organic molecules and carbonate content (dry weight %) (TGA-QMS) of the 6 paint samples and the pigment used in this study. The given errors correspond to the standard deviation determined by using three replicates. K was also measured, but all values were below the limit of detection (LOD) of 30 mg/g.
IDWater in %TiO2
mg/g
Al
mg/g
Ca
mg/g
Fe
mg/g
Na
mg/g
Organic Molecules in %Carbonate in %
RTC-922 ± 1222 ± 271 ± 7<LOD8 ± 62.1 ± 0.13<LOD
P142 ± 4109 ± 1611 ± 381 ± 9<LOD3.4 ± 0.120.8 ± 0.622.5 ± 0.3
P250 ± 5122 ± 917 ± 28.3 ± 0.2<LOD4.8 ± 0.418.4 ± 0.43.0 ± 0.4
P338 ± 211.7 ± 0.3<LOD<LOD12.4 ± 0.34.00 ± 0.734.9 ± 0.5<LOD
P445 ± 6142 ± 339 ± 2109 ± 22<LOD<LOD11.4 ± 0.225.2 ± 0.2
P544 ± 349 ± 215 ± 869 ± 3<LOD3.20 ± 0.317.1 ± 0.319.1 ± 0.3
P644 ± 3.3144 ± 21<LOD56 ± 8<LOD5 ± 243.5 ± 0.515.0 ± 0.5
LOD-1.752320.0250.025
Table 2. Elemental composition in mg/g (wet paint) (ICP-OES), water content (gravimetry), and the organic molecules and carbonate content (dry weight %) (TG-QMS) of the paint extracts. The given errors correspond to the standard deviation (n = 3). For the TG-QMS results, the standard deviation (n = 3) was determined for one sample only due to the high repeatability of the replicated measurements. LOD: limit of detection.
IDMethodTiO2
mg/g
Al
mg/g
Ca
mg/g
Fe
mg/g
Na
mg/g
Recovery TiO2 in %Organic Molecules in %CO32− in %
RTCAcOH922 ± 3121.7 ± 0.82.4 ± 0.2<LOD11.3 ± 0.298 ± 31.620.08
RTCNaOH973 ± 334.9 ± 0.21.2 ± 0.1<LOD9 ± 1106 ± 2<LOD<LOD
P1NaOH506 ± 2218 ± 5<LOD<LOD10 ± 2109 ± 2739.2<LOD
P1AcOH922 ± 538.4 ± 0.722.9 ± 4.3<LOD11.3 ± 1.1118 ± 226.5<LOD
P2NaOH307 ± 1621 ± 4<LOD2.6 ± 0.510 ± 190 ± 1019.41.0
P2AcOH285 ± 1735 ± 53.8 ± 0.2<LOD13.0 ± 0.391 ± 49.6<LOD
P3NaOH56 ± 3<LOD<LOD60 ± 18 ± 178 ± 541.5<LOD
P3AcOH25.0 ± 0.3<LOD2.8 ± 0.428 ± 212.5 ± 1.191 ± 419.71.0
P4NaOH725 ± 3146 ± 4<LOD2.8 ± 0.87.2 ± 0.895 ± 182.2<LOD
P4AcOH317 ± 2820.2 ± 1.119.4 ± 1.0<LOD10.0 ± 0.967 ± 514.13.6
P5NaOH278 ± 974 ± 2<LOD2.2 ± 0.29.8 ± 0.2107 ± 1419.4<LOD
P5AcOH166 ± 844 ± 127.3 ± 0.6<LOD14 ± 3122 ± 621.61.7
P6NaOH358 ± 101<LOD<LOD<LOD8.7 ± 0.673 ± 3034.8<LOD
P6AcOH618 ± 596.3 ± 1.720 ± 18<LOD18 ± 1392 ± 611.05.9
LOD 25522 0.025 0.025
Table 3. Elemental composition in atomic % for the elements detected on the surface of RTC pigment before and after extraction with AcOH using XPS. Typical standard deviations for such measurements were determined from a set of 25 duplicated similar samples and are approximately 9%, 28%, and 59% for the C signals at 285, 286.5, and 289 eV, respectively.
ElementBinding Energy in eVCorresponding SpeciesRTCRTC AcOH
Al2p374.3Al-oxides/hydroxides13.612.8
C1s285.0C-C and C-H27.020.1
C1s286.5C-O3.35.1
C1s288.9O-C=O1.23.6
Ti2p3458.7TiO26.16.2
O1s529–533Metal oxide, C-O and C=O47.551.1
Disclaimer/Publisher’s Note: The statements, opinions and data contained in all publications are solely those of the individual author(s) and contributor(s) and not of MDPI and/or the editor(s). MDPI and/or the editor(s) disclaim responsibility for any injury to people or property resulting from any ideas, methods, instructions or products referred to in the content.