Abstract
The simultaneous determination of 166 pesticides using dispersive liquid–liquid micro extraction combined with gas chromatography–tandem mass spectrometry and ultra-high performance liquid chromatography–tandem mass spectrometry (DLLME–GC-MS/MS+LC-MS/MS) is presented here. In this work, DLLME was extended to complex residues in the ginseng wine matrix. This study first focused on the selection of an appropriate solvent that enabled the dissolution of analytes from ginseng wine. The matrix-matched calibration curves showed good linearity in the range of 2–100 µg L−1 for all pesticides, with coefficients of determination of 0.977–1. The mean recoveries were in the range of 3–124%, with 133 pesticides in the range of 60–130%, and the relative standard deviations (RSDs) were between 0.4% and 31.4%. The limits of detection (LOD) and limits of quantitation (LOQ) were within the ranges of 0.14–140 and 0.5–470 ng L−1, respectively. Therefore, this analytical method contributes to residue analyses of 133 pesticides for the routine laboratory testing of ginseng wine. Research was also carried out by soaking the pesticide-positive samples in ginseng wine to monitor the migration and degradation of pesticides. The results showed that, the migration rates of thifluzamidewaslower than 60%, cyprodinil was 73.7, while azoxystrobin, pyrimethanil, carbendazim, dimethomorph, difenoconazole, pyraclostrobin, propiconazole, quintozene, pentachloroaniline, tebuconazole and phoximwere between 75% and 95%. Quintozene was more easily degraded into pentachloroaniline in the wine.
1. Introduction
Ginseng is a perennial plant belonging to the genus Panax (family Araliaceae) and has been used widely in traditional Chinese medical procedures for thousands of years [1,2,3]. Ginseng has a long history of applications in alternative and complementary treatments as well as in preventative measures to improve disease resistance [4,5]. The active constituents of P. ginseng include ginsenosides, monosaccharides, polysaccharides, amino acids, and peptides [6,7,8]. Ginseng was recognized as a health food item after an announcement by China’s Ministry of Health to enhance the oversight of the base ingredients for health product management. Wine that has been flavored with ginseng is referred to as ginseng wine. The recent increase in the global popularity of ginseng wine has led to a boom in its annual production. It remains in tremendous demand due to its medicinal advantages in invigorating blood circulation, soothing the brain, lessening the feelings of exhaustion, raising metabolism, and enhancing the detoxification of the liver [9,10].
Currently, the most commonly used techniques for analyzing multiple pesticide residues in food and commodities include liquid chromatography–tandem mass spectrometry (LC-MS, LC-MS/MS) [11,12], gas chromatography–mass spectrometry (GC-MS), gas chromatography–tandem mass spectrometry (GC-MS/MS) [13,14], ultra-high performance LC-MS/MS (UHPLC-MS/MS) [15,16,17], and other types of UHPLC. To determine if ginseng contains any traces of harmful chemicals, several laboratories use gas chromatography–tandem mass spectrometry (GC-MS/MS) [18] and other similar methods. Because of its high sensitivity, GC-MS/MS can be used to simultaneously evaluate multiple pesticides. In addition, this method can reduce the disruption caused by co-eluting chemical compounds [19,20].
The preparation of the samples is an essential stage in analytical procedures [21]. Solid-phase extraction (SPE), dispersive SPE (d-SPE), supercritical fluid extraction (SFE), solid-phase micro extraction (SPME), matrix solid-phase dispersion (MSPD), liquid–liquid extraction (LLE), and QuEChERS are examples of sample preparation methods [22,23,24,25,26,27]. These methods always begin with an extraction step and a cleaning phase. Conventional procedures for LLE are used for liquid samples such as oils and drinks [28,29]. However, these processes need additional cleanup procedures, such as SPE, to remove interferences [30]. To address these limitations, liquid-phase micro extraction (LPME) techniques, including in-tube solid-phase micro extraction (SPME) and dispersive liquid–liquid micro extraction (DLLME) [31,32,33,34,35], have emerged as viable approaches for the analysis of polycyclic aromatic hydrocarbons (PAHs). These methods represent a novel trend in minimizing waste generation and reducing costs, thereby promoting the adoption of environmentally friendly analytical techniques.
DLLME, or dispersive liquid–liquid micro extraction, is a cutting-edge sample preparation strategy that permits massive enrichment factors to be accomplished with only a small volume of water samples. Because of its many benefits, such as low cost, high recovery rate, quick processing time, and potential for adaptation to a variety of analytical settings, the DLLME method has been accepted as a workable approach to sample preparation [35,36]. There have been several developments since the technology’s launch in 2006, including its integration with other extraction techniques. In addition, it is no longer limited to simple water matrices but now encompasses environmental, food, and biological components [31,32]. To date, there has been one article demonstrating the online dispersive liquid–liquid micro extraction (DLLME) approach [33]. However, the disclosed strategy was considerably more complex than the simple approach initially proposed by As-sadi and colleagues [37]. The DLLME technique may be easily modified for new purposes and used with existing sample preparation procedures. Over a hundred academic papers have been written about this method, showing its widespread use in particular types of laboratories. There is a significant desire to replace the current old liquid–liquid extraction procedures, mainly motivated by concerns over the environment [38,39].
Fresh ginseng is not easy to preserve, and fresh ginseng wine is one of the most important ways to use ginseng, which has health benefits, can assist in the treatment of various types of diseases, while the preparation method is simple and the wine can be stored for a long time [40]. In the process of making ginseng wine, many active ingredients of ginseng can dissolve in the wine. Most indicators show significantly higher values. Long-term consumption of ginseng wine has the same efficacy as consuming ginseng directly.
This study presents the development and validation of a rapid, cost-effective, easy, and environmentally friendly extraction technique known as DLLME. This method was used in the simultaneous analysis of several pollutants in ginseng wine samples using LC-MS/MS and GC-MS/MS. To the best of our knowledge, this is the first time that a DLLME approach has been described for the simultaneous assessment of various pollutants and pesticides in the ginseng wine matrix. In the process of adding ginseng active ingredients from raw materials to wine, the pesticide residues in ginseng may migrate to ginseng wine at the same time. This paper conducted a systematic study on the pesticide migration in the production process of ginseng wine through a ginseng wine processing experiment.
2. Materials and Methods
2.1. Chemicals, Reagents, and Materials
A group of 166 pesticide standards, each with purity above 95%, was procured from reputable sources, including the Dr. Ehrenstorfer Company (Augsburg, Germany), TM Standard Co., Ltd. (Beijing, China), and the Agro-Environmental Protection Institute Ministry of Agriculture (Tianjin, China). HPLC-grade methanol and acetonitrile used for the current research were provided by Merck Companies (Darmstadt, Germany). The remaining components of the solvents and chemicals used in the experiments were of analytical grade and came from Beijing Chemical Works (Beijing, China) and CNW Technologies GmbH (Dusseldorf, Germany). Magnesium sulfate, primary secondary amine (PSA), and C18 were acquired from Agela Technologies Inc. (Newark, DE, USA) for application in this experiment.
2.2. Sample Preparation
First, 12 mL of ginseng wine sample was placed in a centrifuge tube with a capacity of 15 mL. The volume was reduced to 4 mL by heating in a water bath at 80 °C under nitrogen flow. Afterward, water was added to bring the final volume to 6 mL. Following the addition of extraction dispersant, the mixture was vortexed for 1 min and centrifuged at 6000 r/min for 5 min. Then, 100 µL of the organic phase was taken by syringe from a sharp-bottomed centrifuge tube. The sample was then blow-dried, re-dissolved with 100 µL of methanol, vortexed, and passed through 0.22 µm membrane filter. An additional 100 µL of the lower organic phase was supplemented with 50 µL of an internal standard solution and thoroughly mixed by vortexing for further assessment.
2.3. LC-MS/MS Analysis
An LC30A-Qtrap 4500 LC-MS/MS instrument was purchased from SHIMADZU (Tokyo, Japan) and SCIEX (Framingham, MA, USA). The multi-residue analytes were separated using an XB-C18 reversed-phase column with a 2.1 mm internal diameter, 100 mm length, and 2.6 µm particle sizes at 40 °C. The chromatographic separation employed mobile phase A (0.1% formic acid and 5 mM ammonium formate) and mobile phase B (methanol). The concentrations of mobile phase B under gradient elution conditions were as follows: 0–6 min, 5–80%; 6–6.1 min, 80–95%; 6.1–8 min, 95–95%; 8–8.1 min, 95–5%; and 8.1–11 min, 5–5%. The column temperature was 40 ℃, and injection volume 5.0 µL. Electrospray ionization (ESI) interface mass spectrometry instruments (Framingham, MA, USA) were employed in this study. The ionization method used the following parameters: electrospray ionization; ionization voltage, 5500 V; atomizing gas pressure, 0.38 MPa; auxiliary heating gas pressure, 0.41 MPa; and air curtain gas pressure, 0.2 MPa. The ESI interface was in the positive ionization mode. In addition, data from multiple reaction monitoring (MRM) experiments were gathered and analyzed for each pesticide. For detailed parameters, see Table S1 in Supplementary Materials.
2.4. GC-MS/MS Analysis
A gas chromatography/TSQ 8000 Evo Triple Quadrupole mass detection system purchased from Thermo Fisher Scientific (Waltham, MA, USA) was used to perform GC-MS/MS analysis. The instrument was equipped with an Agilent DB-1701 column (Agilent, Santa Clara, CA, USA) with 30 m length, 0.32 mm internal diameter (Agilent, Santa Clara, CA, USA), and 0.25 µm film thickness. For gas chromatography (GC), the initial temperature of the column was set to 100 °C for 1 min. The temperature was then raised to 180 °C at a rate of 10 °C/min and maintained for 5 min. The final step was a 20 °C/min rise toward a temperature of 280 °C, which was maintained for 8 min. The ion source and transition line were heated to 300 and 280 °C, respectively, in the tandem mass spectrometer using helium carrier gas. Using the ions and MRM, we were able to determine the retention time, stem ion transitions, and collision energy. For detailed parameters, see Table S1 in Supplementary Materials.
2.5. Calibration, Detection, and Quantification
A total of 166 pesticide solutions were prepared by dissolving the compounds in a base solution of 1000 mg L−1, employing acetone as the solvent. These solutions were then kept at −20 °C. The range of the calibration curves was 1–1000 ng mL−1. Acetone was used to create the mixed standard and mixed-matrix standard solutions. To generate the matrix-matched calibration curve, mixed-matrix standard solutions diluted to different concentrations (2, 5, 10, 20, 50, and 100 mg L−1) were prepared. The peak area of each component at each concentration was plotted to generate a standard curve, which was used to estimate the correlation coefficient.
2.6. Recovery Assays
The spiked recovery experiment was conducted at two different pesticide treatment concentrations (i.e., 2 and 100 µg kg−1) as per the sample preparation approach. Five replicates were carried out for both spiked levels, and the average recoveries and relative standard deviations (RSDs) were determined. The recoveries should be in the range of 70–120% [41], as indicated by the standards for assessing pesticide residues in crops in China. Once the augmented levels are set between 0.01 and 0.1 mg L−1, the relative standard deviations should remain below 20%.
We calculated the matrix effect for 167 compounds, with matrix effects ranging from 85.5% to 142.4%. Forty-three species had a significant matrix effect, with a matrix effect greater than 130%. This study employed the matrix external-standard method to satisfy the needs of residue analysis methodologies, while also circumventing the challenges associated with obtaining internal standards and the complexity of the associated procedures. To minimize the influence of the matrix, a solution standard curve covering a concentration range of 2–100 ng mL−1 was developed to produce a matrix-matched standard curve.
3. Results and Discussion
3.1. Optimization of GC-MS/MS
The instrumental techniques should be optimized in analyzing pesticide residues to successfully identify low-concentration target pesticides. In the current study, LC-MS/MS and GC-MS/MS were selected and modified for detection of the pesticides. Once the MS spectra were obtained in the full-scan mode, the appropriate precursor ions were selected, and the product ions were scanned at different collision energies (CE) to determine the retention time, transition pairs, and CE for each pesticide. In comparison with GC and LC, this approach is more precise, sensitive, and repeatable. The results obtained are shown in the appendices.
3.2. Linearity, Limits of Detection (LODs), and Limits of Quantification (LOQ)
Pesticide residue analysis frequently employs both external- and internal-standard procedures, each presenting significant advantages and limitations. This study employed the matrix external-standard method to satisfy the needs of residue analysis methodologies, while also circumventing the challenges associated with obtaining internal standards and the complexity of the associated procedures. To minimize the influence of the matrix, a solution standard curve covering a concentration range of 2–100 ng mL−1 was developed to produce a matrix-matched standard curve. The correlation coefficients for 166 different pesticides are provided in the Supplementary Materials. The coefficients of determination for all 166 pesticides were between 0.977 and 1, with 133 pesticides revealing remarkable linearity when analyzed in the ginseng wine matrix. Three different analytical studies were performed on the target chemicals to determine the signal-to-noise ratio and the LOD. In addition, the limit of detection was three times the signal-to-noise ratio and the limit of quantification was ten times the signal-to-noise ratio, as calculated by the signal-to-noise ratio. In this work, we employed mixed matrix-matched curves to determine the LODs and LOQ values. As shown in the Supplementary Materials, a wide range of LODs and LOQ values were observed in the 166 different pesticides. The LODs and LOQ values achieved were significantly lower than the maximum residue limits established by the European Union. Therefore, the developed LC-MS/MS and GC-MS/MS analytical approaches are suitable for the routine assessment of pesticide residues in ginseng wine.
3.3. Optimization of Extraction
The weak polarity of carbon tetrachloride grants it good solubility for weakly polar pesticides. However, its ability to recover pesticides of medium polarity for LC-MS/MS detection is limited, as demonstrated by previous studies [36]. The solubilities of trichloromethane and ginseng wine samples are greater than that of dichloromethane, rendering it less suitable for liquid–liquid partitioning. The recovery of 166 pesticides spiked at 0.002 mg/L was carried out using four different extraction methods, and the comparative recoveries are shown in Figure 1: (I) dichloromethane extraction, (II) trichloromethane extraction, (III) dichloromethanetoluene extraction, and (IV) carbon tetrachloride extraction.
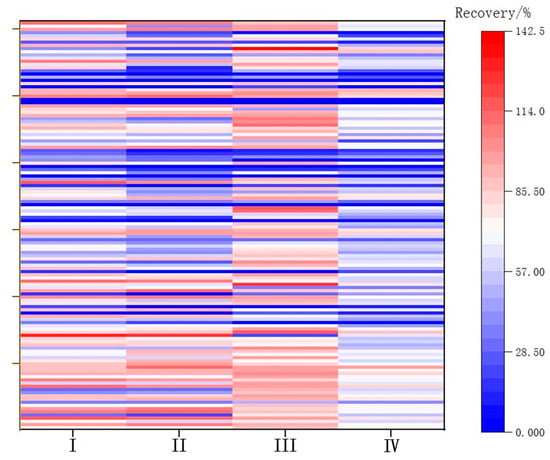
Figure 1.
Recoveries for each extraction method.
Dichloromethane exhibited better compatibility with the 166 pesticides compared with trichloromethane and carbon tetrachloride. However, the recovery rate of organochlorine pesticides with planar structures using dichloromethane ranged from 20% to 40%. Finally, a 300 L mixture of dichloromethane and toluene (5:1 v/v) was used for extraction. Recoveries for each extraction method are shown in Figure 1.
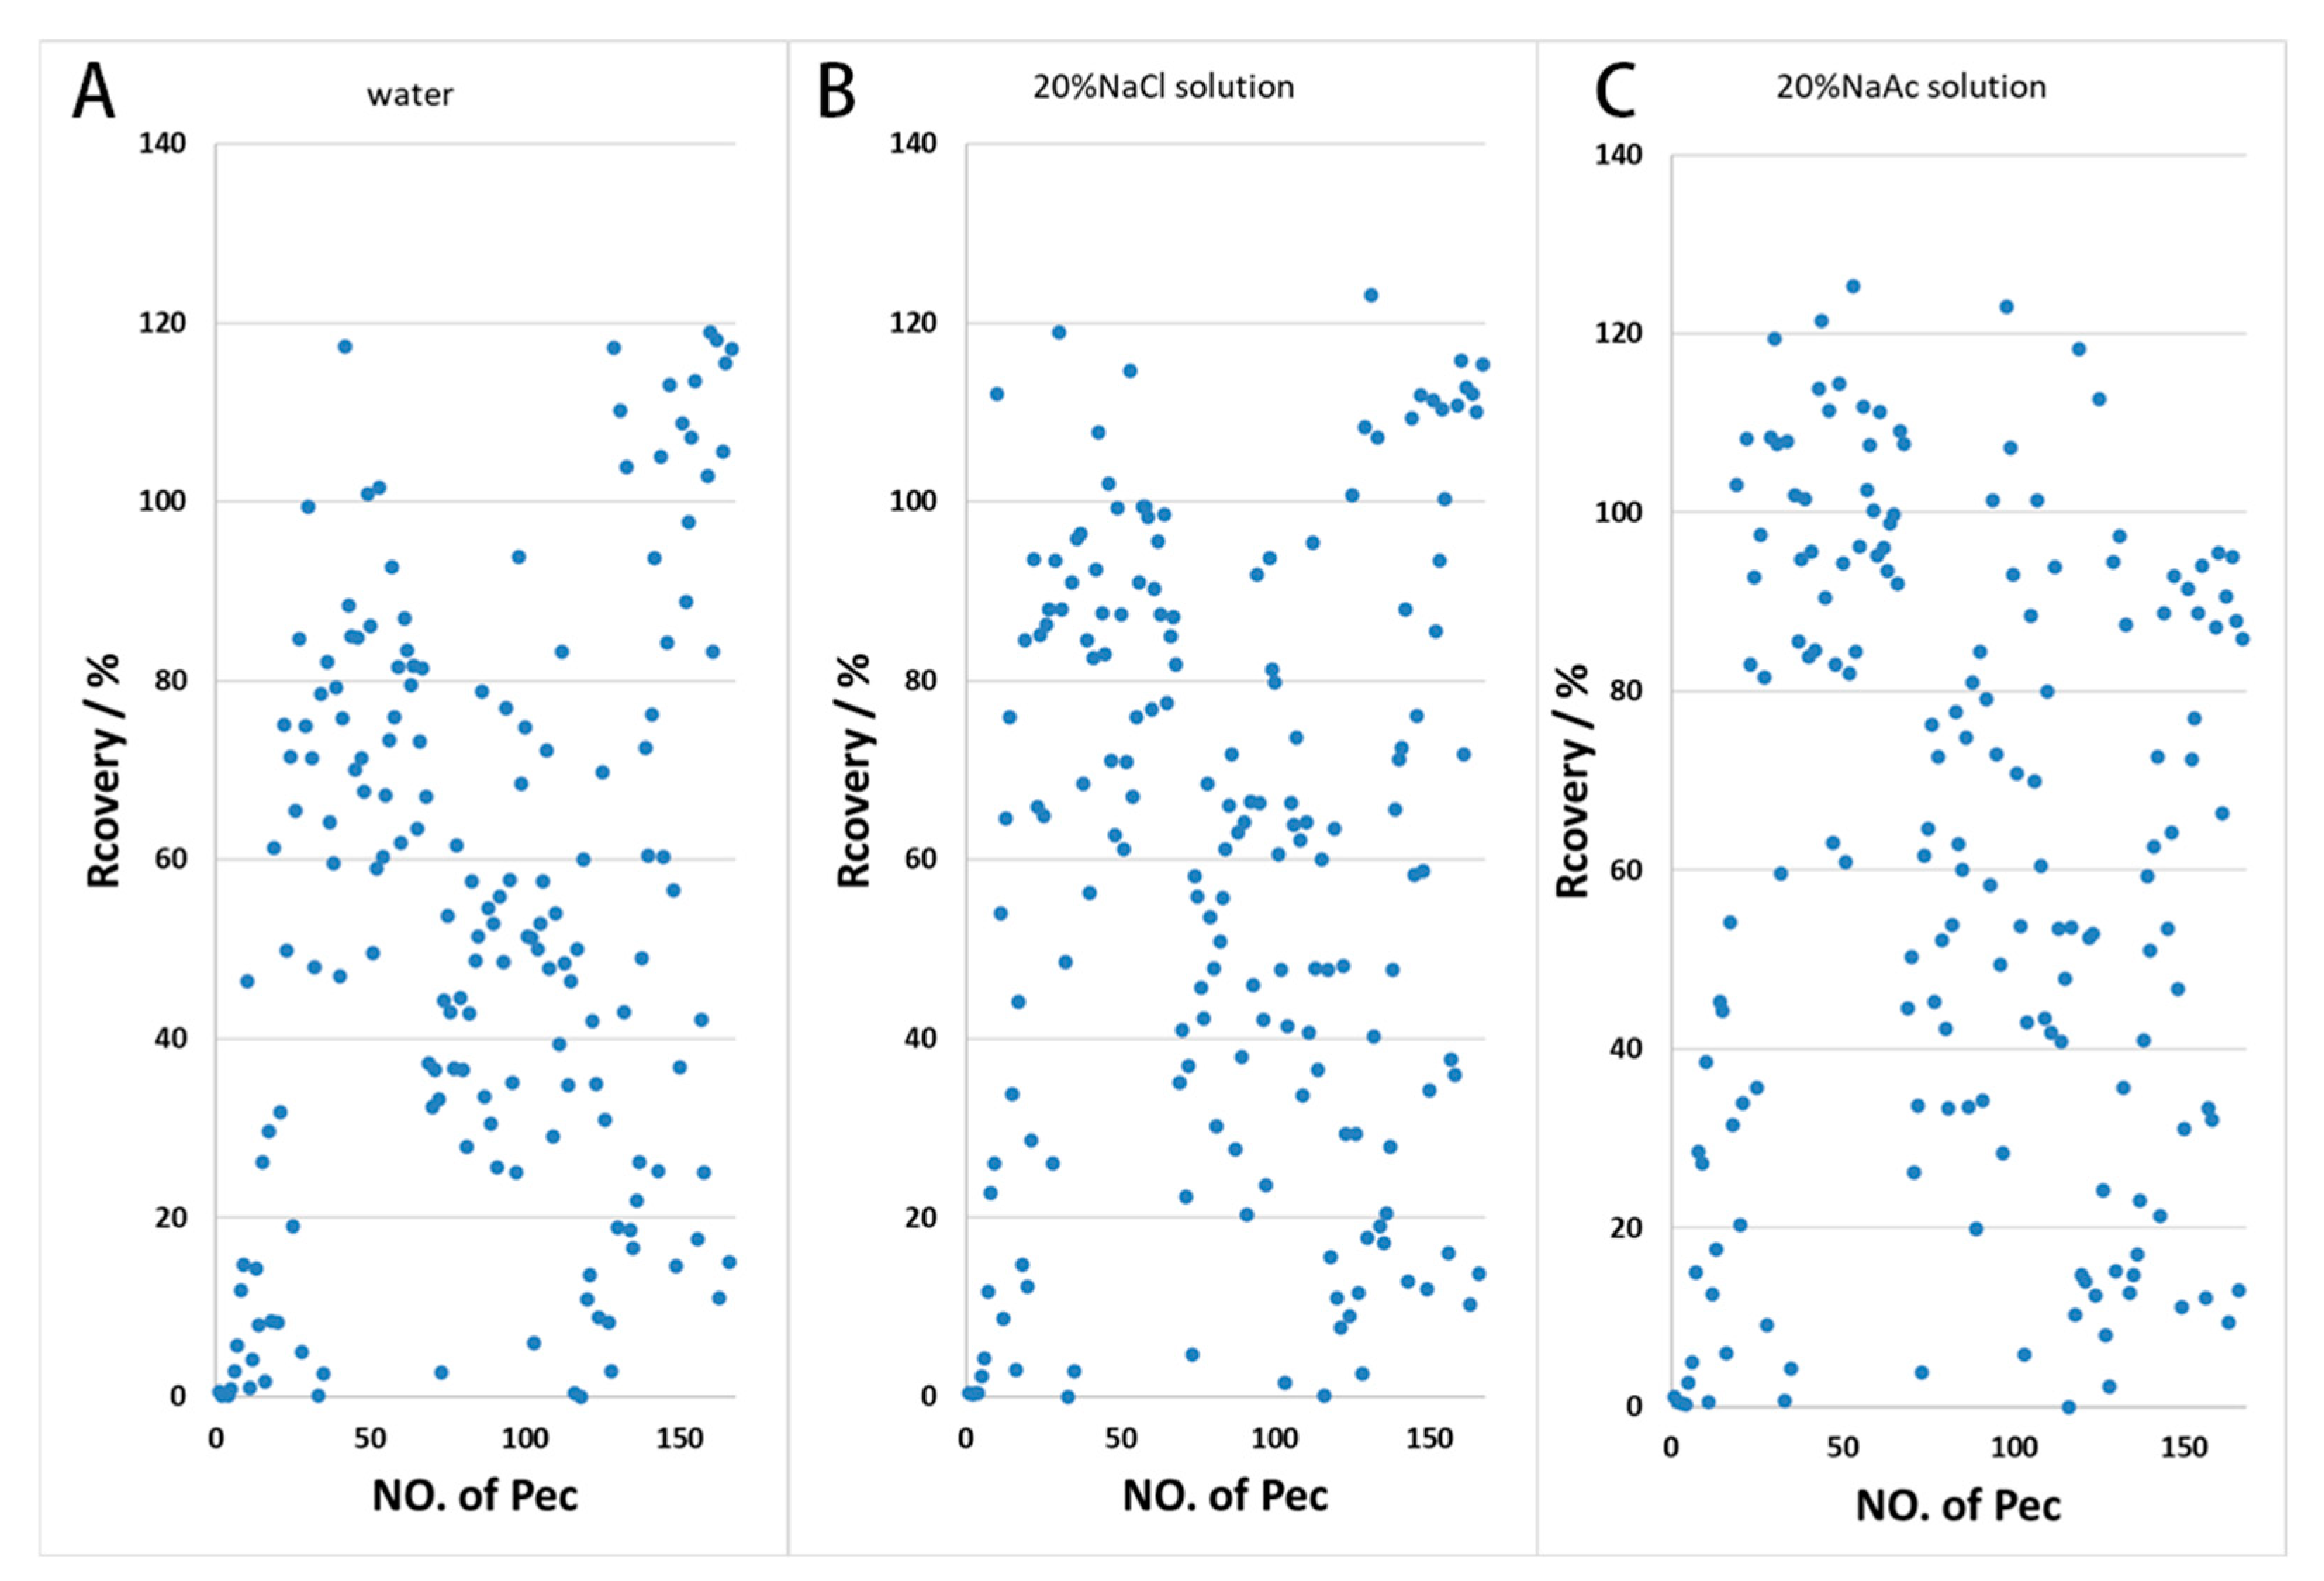
3.4. Optimization of Water/Salt Solution
The application of a salt solution can enhance the distribution ratio of the compound to be extracted during the extraction process by decreasing its solubility in the ginseng wine phase. The addition of 20% sodium chloride and 20% sodium acetate solution to the treatment samples resulted in a higher recovery rate compared with the addition of pure water. As can be seen in Figure 2, the addition of salt solution improved the recovery of some pesticides, while the difference between sodium chloride and sodium acetate was not significant; pesticide recovery rates in the range of 60–120% in the sodium chloride treatment group were slightly higher in number than in the sodium acetate treatment group.
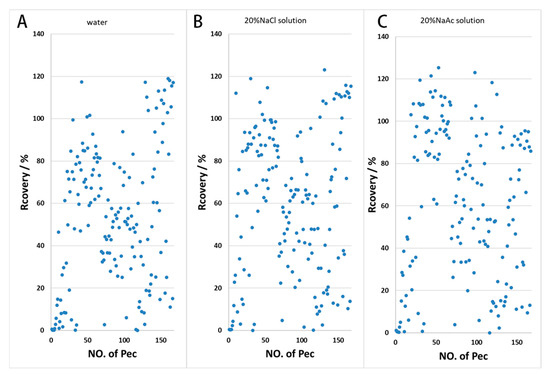
Figure 2.
Effects of water and salt solution on the recovery rate ((A) water; (B) 20% NaCl solution; (C) 20% NaAc solution).
3.5. Optimization of Dispersant
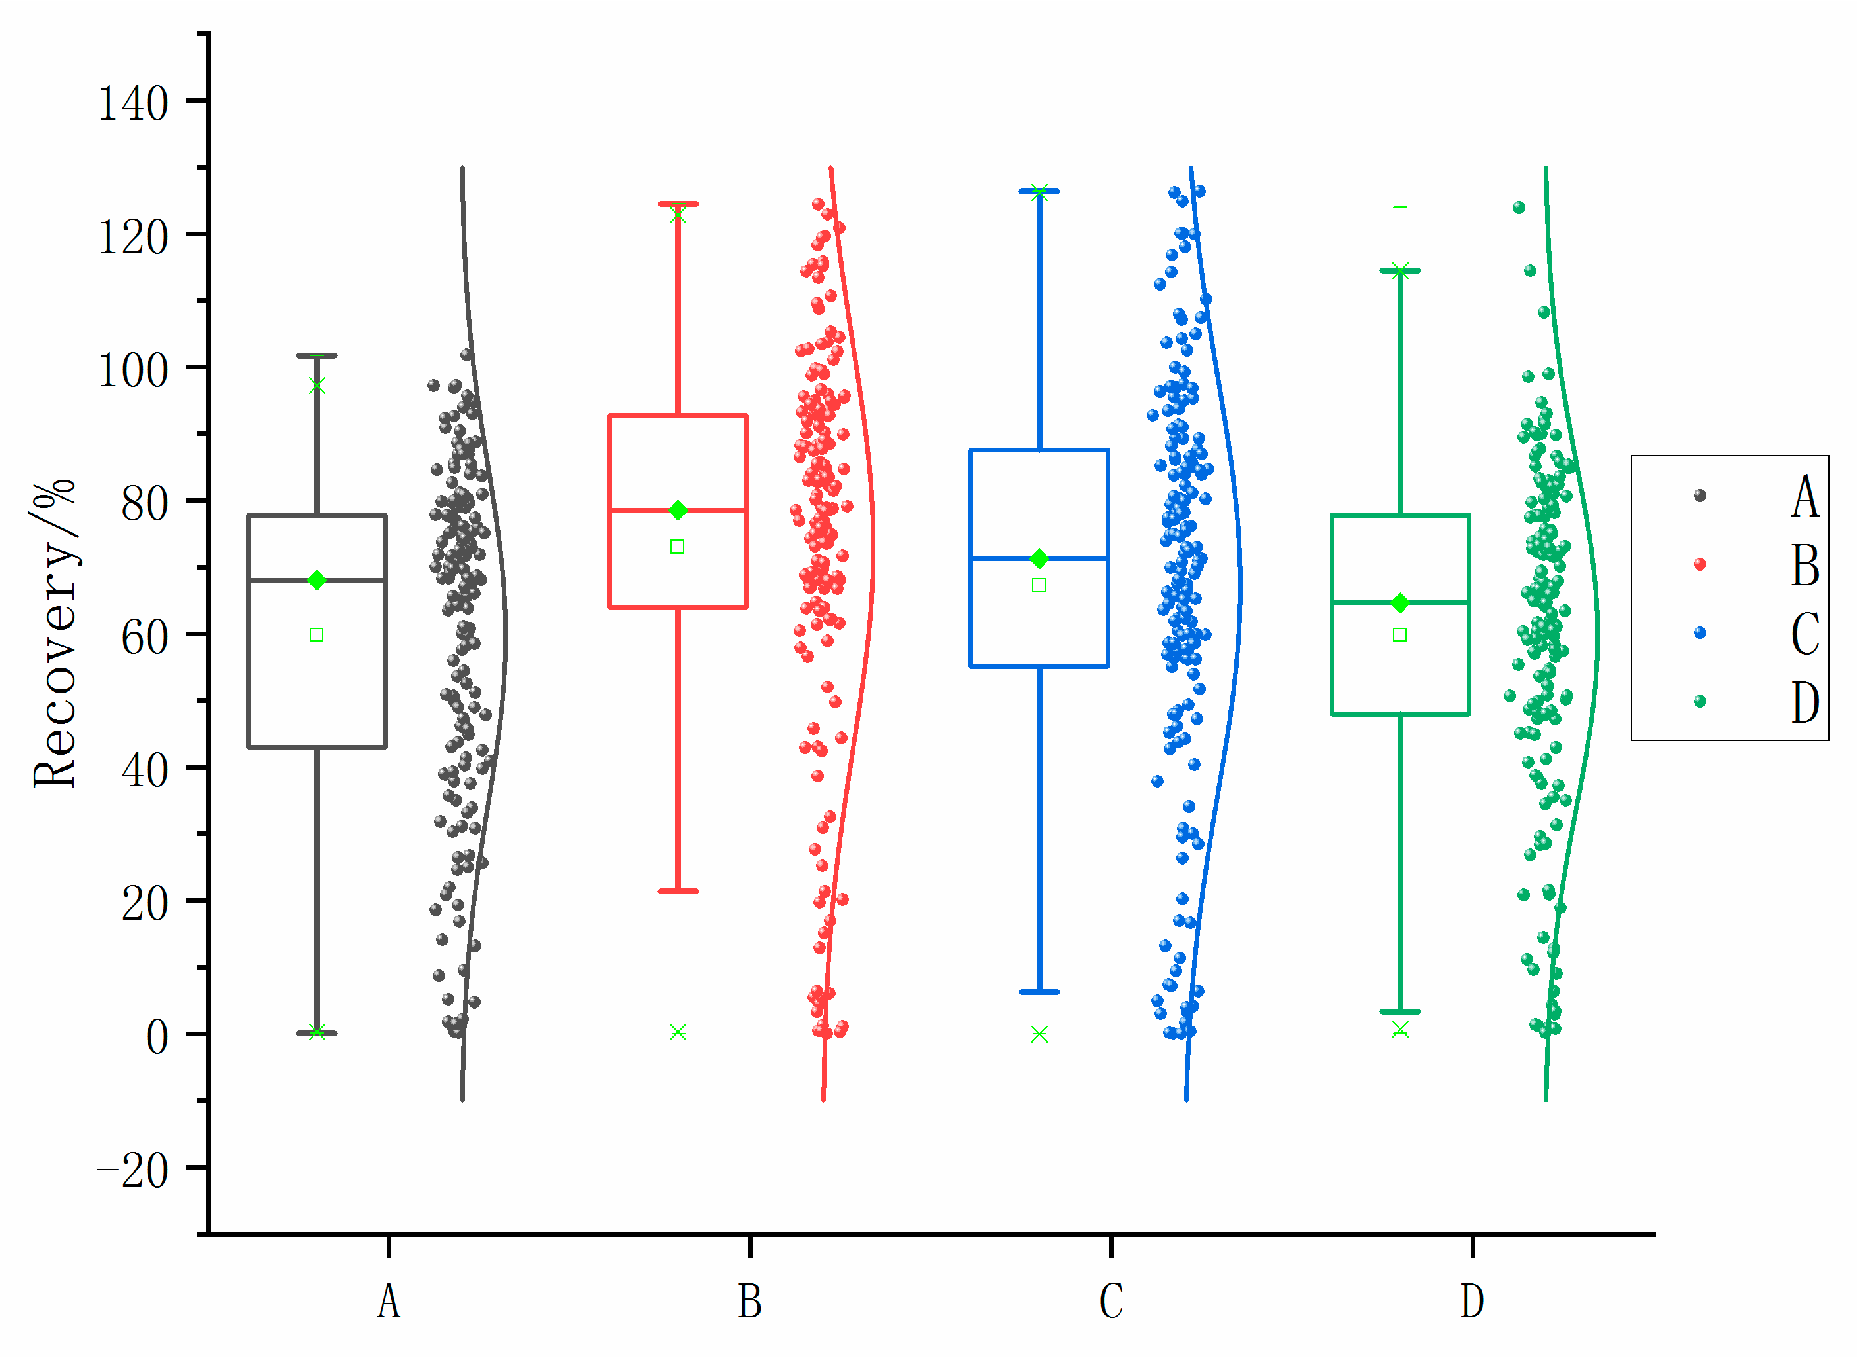
The results gathered from the optimization of dispersants demonstrate that scheme B, which used 300 µL of acetonitrile as the dispersant, exhibited a slightly higher recovery rate compared with the other three groups. Specifically, 76 of the 166 compounds had average recoveries within the range of 80% to 120%, which was the highest among the four methods. For the 133 target compounds, this treatment group had the most recoveries within the range of 60% to 130%. As a result, scheme B was considered the most effective option among those shown in Figure 3.
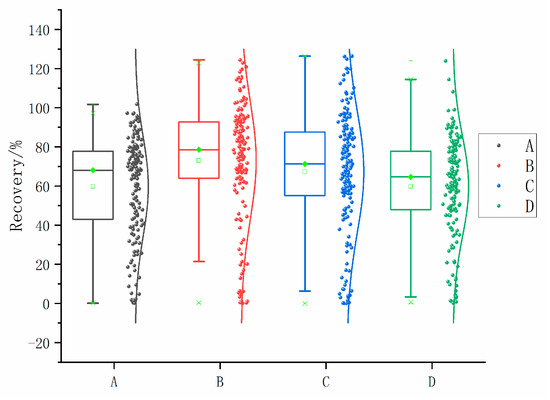
Figure 3.
Recoveries for each dispersant treatment method.
Figure 3 shows the recovery rates for the four extraction dispersant methods (A, B, C, and D).
A: First, add 600 µL of dispersant-extractant with toluene-acetonitrile = 1:5 (v/v); shake vigorously and then add 300 µL of methylene chloride; shake vigorously again for 1 min; centrifuge, process and measure according to the steps in Section 2.2.
B: First, add 400 µL of dispersant-extractant with toluene-acetonitrile = 1:3 (v/v); shake vigorously then add 300 µL of methylene chloride; shake vigorously again for 1 min; centrifuge, process and measure according to the steps in Section 2.2.
C: First, add 600 µL of dispersant-extractant with toluene-acetone = 1:5 (v/v); shake vigorously and then add 300 µL of methylene chloride; shake vigorously again for 1 min; centrifuge, process and measure according to the steps in Section 2.2.
D: First, add 400 µL of dispersant-extractant with toluene-acetone = 1:5 (v/v); shake vigorously then add 300 µL of dichloromethane; shake vigorously again for 1 min; centrifuge, process and measure according to the steps in Section 2.2.
3.6. Accuracy and Precision
This paper presents an analysis technique for ginseng wine, which was first developed through the optimization of the number of tests. The method involved concentrating the ginseng wine and then adding sodium chloride solution. Subsequently, a mixed solvent consisting of 250 µL of dichloromethane and 50 µL of toluene was used as the extractant, while 300 µL of acetonitrile was used as the dispersant. The determination of analytes was carried out via GC-MS/MS with an internal standard, in addition to UHPLC-MS/MS with an external-standard method. The standard deviations of the 166 pesticides and their associated metabolites were also determined. The recoveries of the 166 pesticides and metabolites varied between 3% and 124%, among which 133 pesticides exhibited recoveries ranging from 60% to 130% (with relative standard deviations of 0.4% to 31.4%). Notably, this approach satisfies the screening and quantification requirements for these 133 chemical compounds. The chromatographic profiles are provided in the total ion chromatograms shown in Figure 4 and Figure 5.
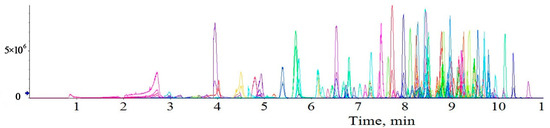
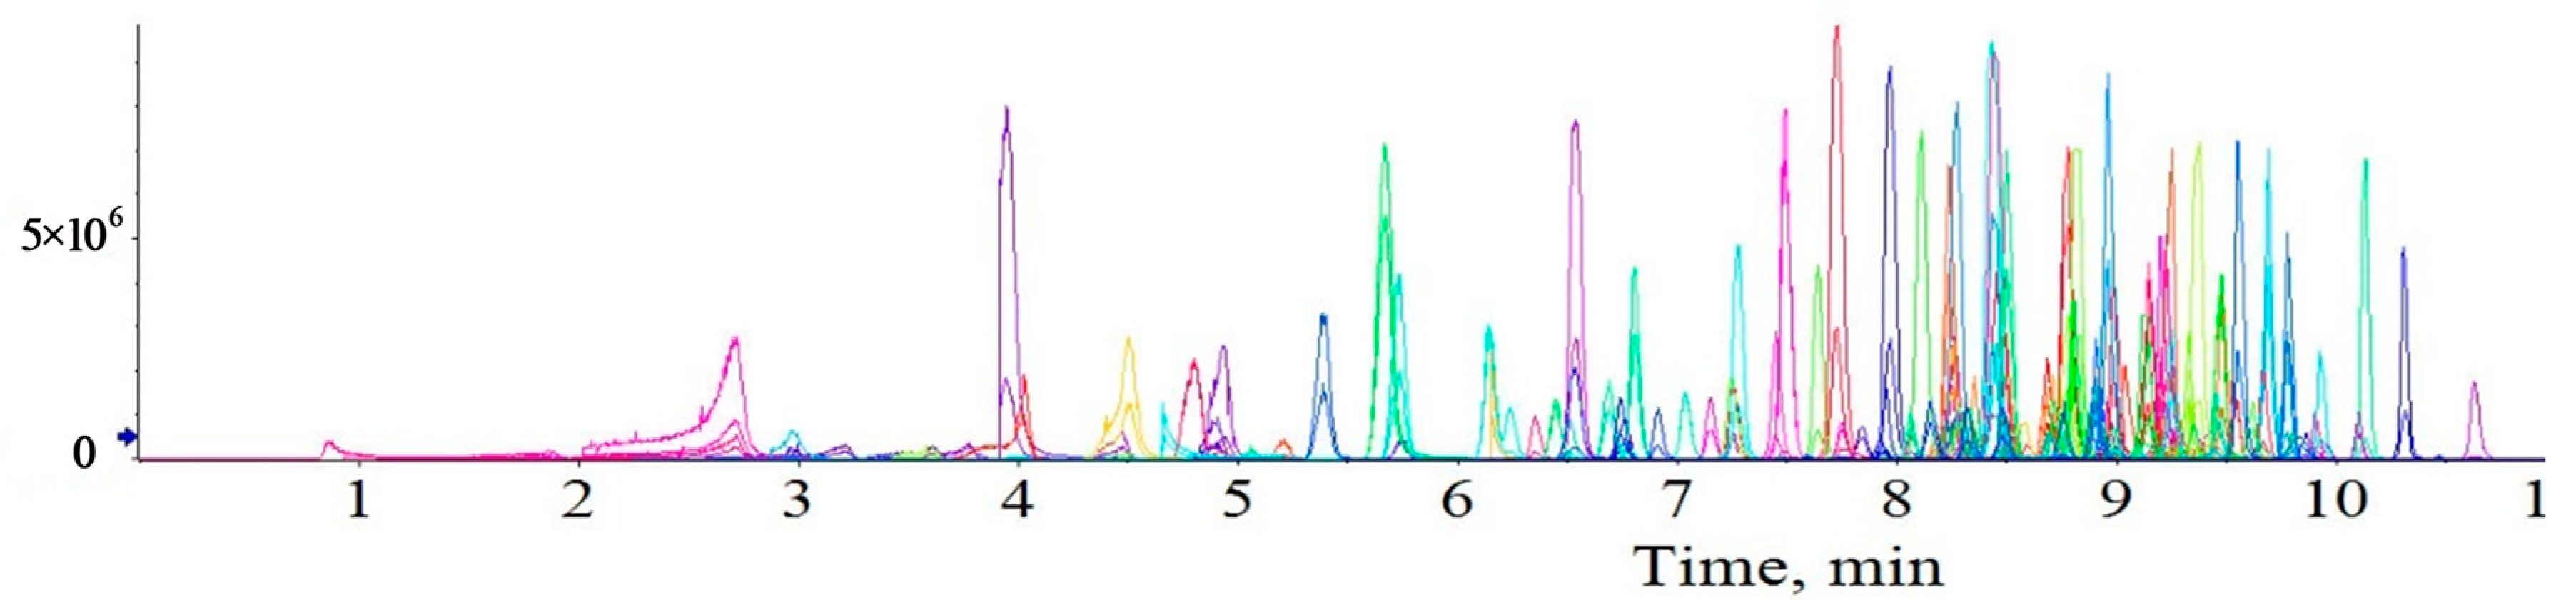
Figure 4.
TIC of ultra-high performance liquid chromatography tandem mass spectrometry.
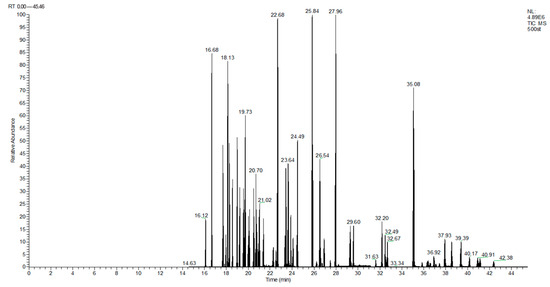
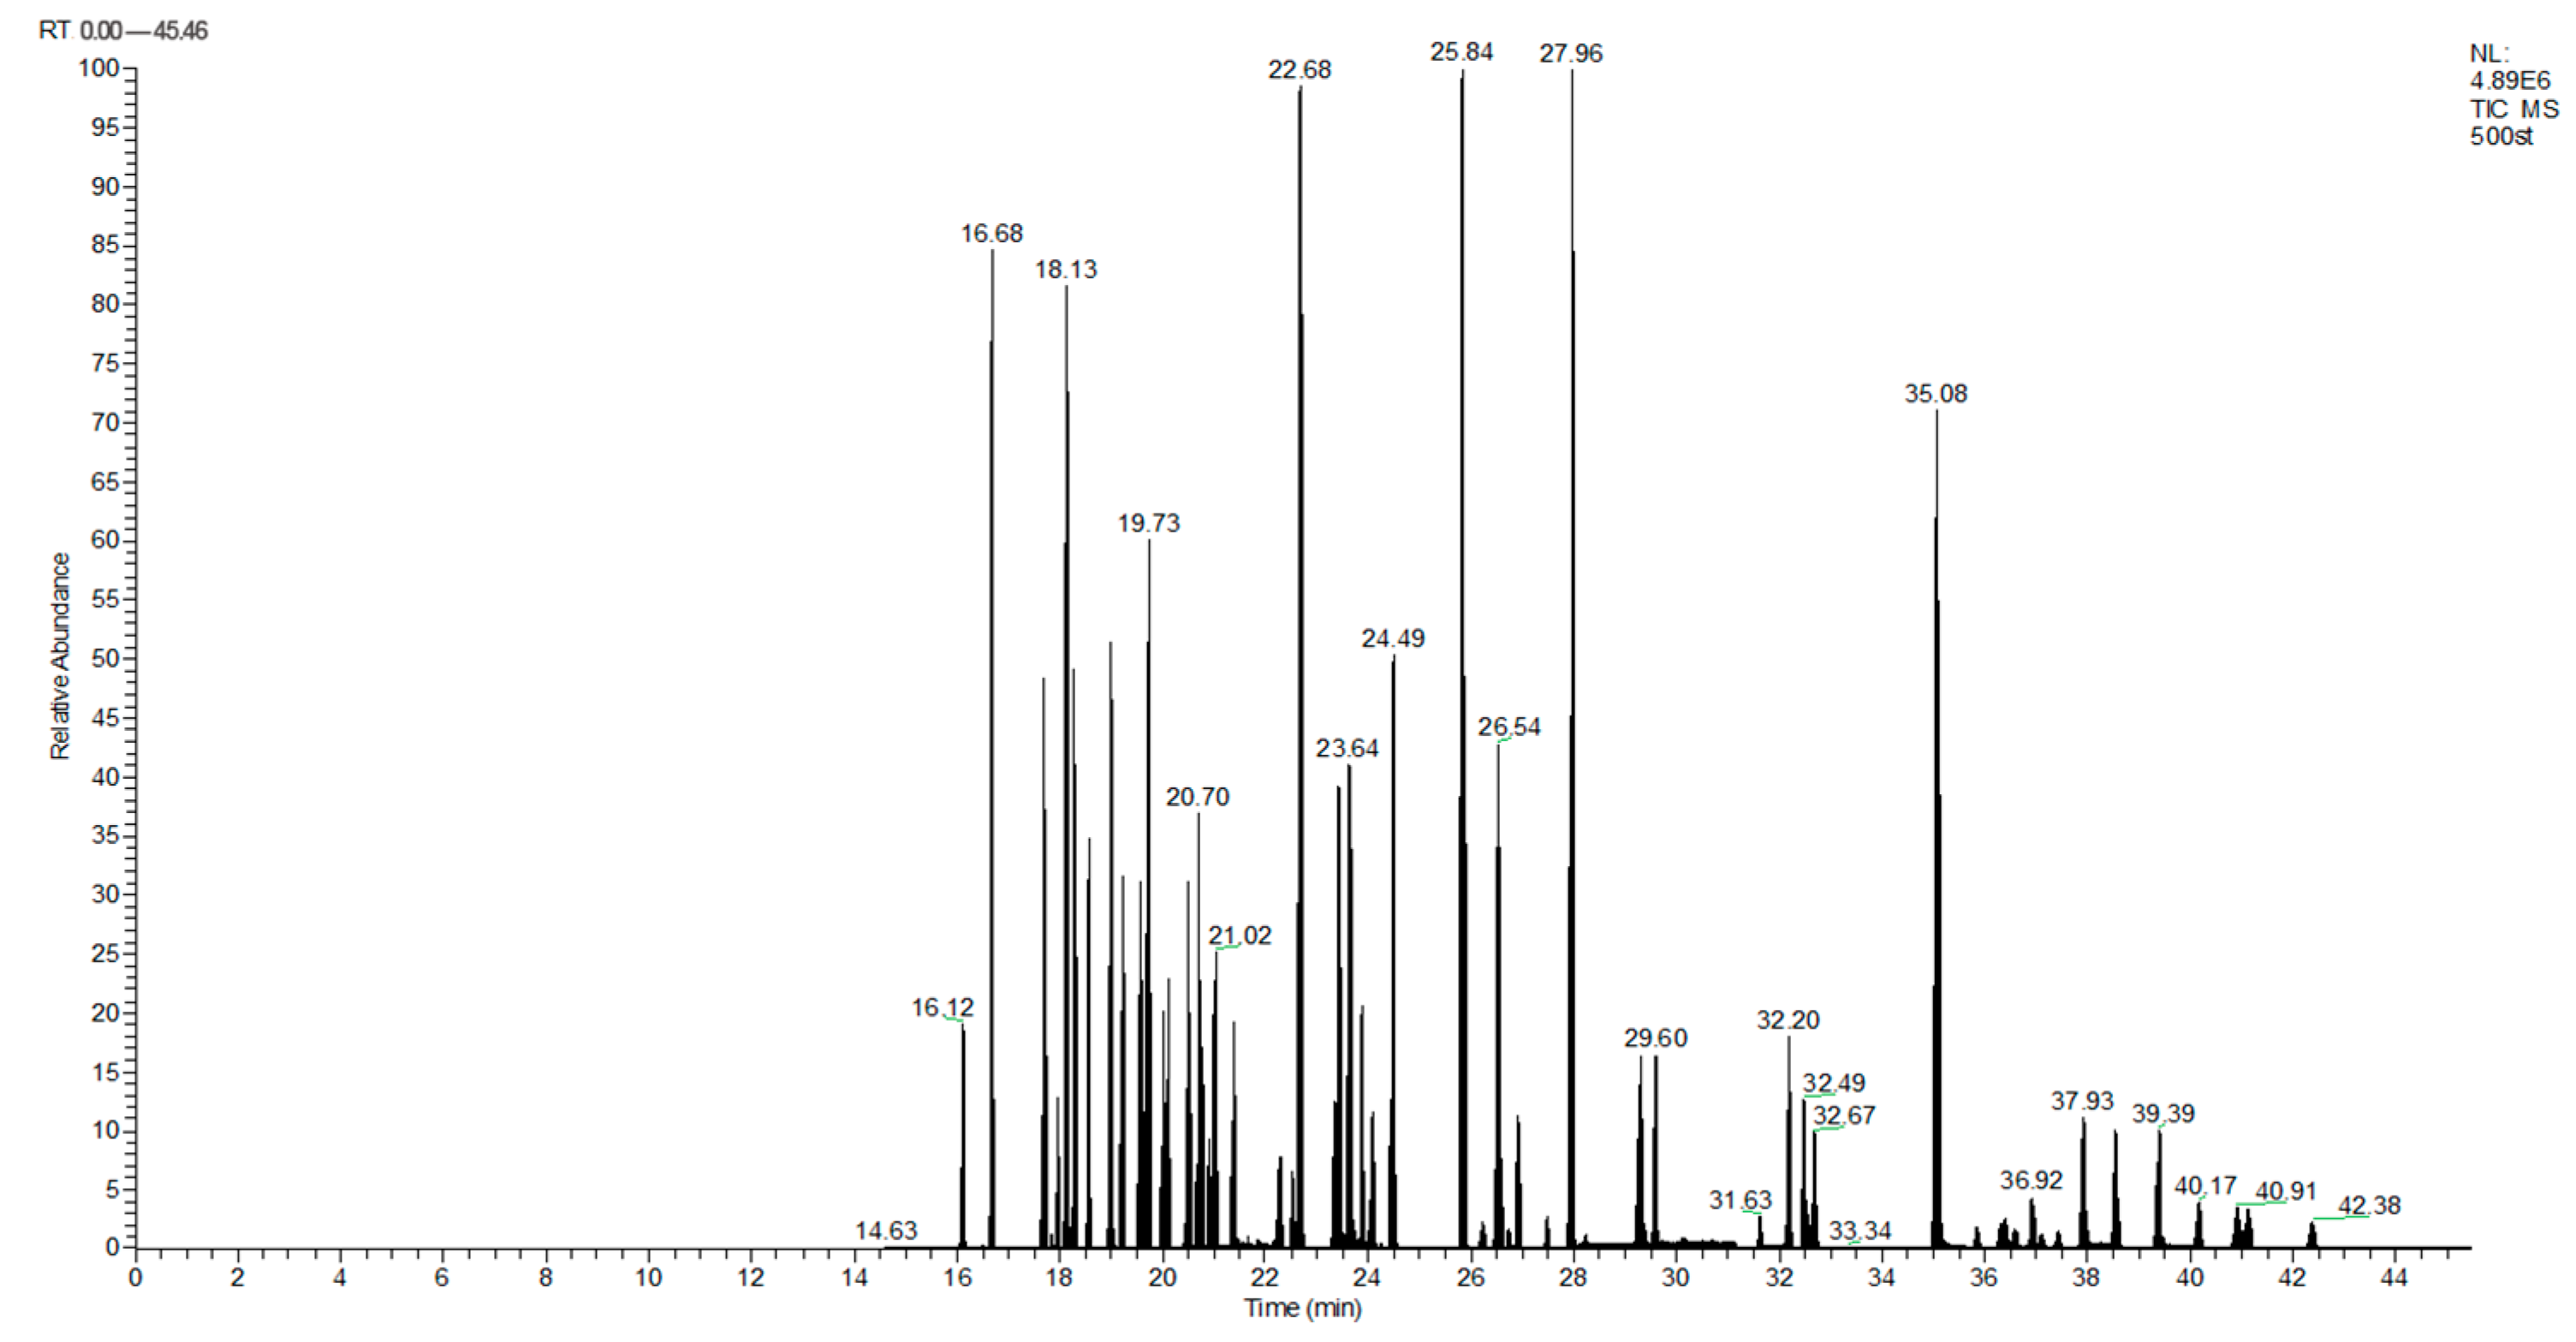
Figure 5.
TIC of gas chromatography tandem mass spectrometry.
3.7. Real Samples Analysis
In our research, ten ginseng wine samples collected from the wine markets in Jilin Province were used to validate the reliability of the developed method. Of these ten samples, two contained dimethomorph, while carbendazim, difenoconazole, azoxystrobin, pyrimethanil and pyraclostrobin pesticides were each found in one wine sample. Among them, dimethomorph was the most frequently detected pesticide. Table 1 summarizes the above results. The residue of pyraclostrobin was higher than that of the other pesticides, reaching 0.23 μg L−1. This may be ascribed to the heavy application of pyraclostrobin in ginseng.

Table 1.
Screening results of pesticide residues in ginseng wine products from the wine markets in Jilin Province.
4. Migration Studies
4.1. Test Time, Place and Sample Collection
Test period: July 2021–January 2022. Test place: Ginseng and Antler Products Testing Center of the Ministry of Agricultural PRC, Jilin Agricultural University. Sample species: four-year-old Damaya. All ginsengs were collected from the ginseng trading market. Number of samples: 15 batches of ginseng samples, with 4 ginseng tubers per sample, and each tuber weighing in the range of 100 ± 10 g.
4.2. Setup of Migration Studies
One ginseng tuber was taken from each sample and analyzed for pesticide residues according to the methods described in Section 2.2 and Section 2.3. These tests were based on 15 samples of ginseng. From each sample, two additional ginseng tubers were selected for infusion, resulting in a final total of 30 individual ginseng tubers, and 30 bottles of ginseng wine.
Fresh ginseng was rinsed with a high-pressure water gun, air-dried and weighed. It was then immersed in a container containing a certain quality of white wine, sealed and stored at room temperature. The ethanol concentration of the white wine was 62%, and the soaking ratio of ginseng to white wine was about 100 g/L. The ginseng wine was gently shaken and drained every day for the first 7 d. The ginseng wine was weighed and topped up regularly. The mass was periodically weighed and replenished with white wine, and the soaking period was 180 d.
4.3. Sample Preparation of Migration Studies
The fresh ginseng in the ginseng wine was removed. The surface of the ginseng was allowed to completely air dry. The ginseng tuber was then weighed, and the mass was recorded. Each ginseng tuber was then pulped with a plant processor and stored in a sealed container at −18 °C until use.
An 8 g sample of fresh ginseng was weighed into a 50 mL PP centrifuge tube, and 5 mL of 1% aqueous acetic acid and 10 mL of acetonitrile containing 1% acetic acid were added. The mixture was homogenized in a homogenizer for 1 min at a rotational speed of not less than 15,000 r/min. Next, 1.5 g of sodium acetate, 6 g of anhydrous magnesium sulfate, and a ceramic homogenizer were added, and the sample was then placed in the QuEChERS automatic sample preparation system. After shaking vigorously for 5 min, the sample was centrifuged at 4500 r/min for 5 min. Then, 9 mL of supernatant was added to a 15 mL stoppered centrifuge tube containing 900 mg of anhydrous magnesium sulfate and 150 mg of PSA, vortexed and shaken for 2 min. It was then centrifuged at 5000 r/min for 5 min. Then, 4 mL of supernatant was added to a 10 m graduated centrifuge tube, and blown under nitrogen in a water bath at 60 °C until nearly dry. The supernatant was then fixed with ethyl acetate solution containing triphenyl phosphate as an internal standard, adjusted to 1 mL and vortexed to mix well. It was then passed through a 0.22 μm membrane filter for GC-MS/MS determination.
Another 2 mL of supernatant was added to a 5 mL graduated centrifuge tube and blown to near dryness under nitrogen in a water bath at 60 °C. After dissolving the residue with 0.5 mL of methanol, the residue was finely adjusted to 1 mL using a 5 mmol/L aqueous ammonium formate containing 0.1% formic acid. After spinning and mixing, the solution was passed through a 0.22 μm membrane filter, and stored until the LC-MS/MS analysis.
The ginseng wine was mixed and filtered, and 500 mL of the filtrate was transferred to a brown screw-top reagent bottle and stored at −4 °C, protected from light.
4.4. Sample Determination
All 30 ginseng samples were determined according to the procedures described in Section 2.2 and Section 2.3, three times in parallel for each sample, and blank and quality control tests were performed at the same time.
The 30 ginseng wine samples were processed according to the optimized method in 2.1, with three parallel tests for each sample, and blank ginseng wine was used for the additive recovery and control tests.
4.5. Test Results and Analyses
4.5.1. Results of Pesticide Screening of Fresh Ginseng Before Brewing
Table 2 shows the pesticide screening results for 10 batches of ginseng samples, with a total of 14 compounds detected in the fresh ginseng raw material used for ginseng wine soaking. The specific pesticide types and residue levels are shown, and the most frequently detected pesticide was PCNB, with residues ranging from 0.073 to 57.2 mg/kg.
Table 2.
Pesticide residues of raw ginseng.
4.5.2. Pesticide Residues in Ginseng Wine
After brewing ginseng wine, 11 compounds were detected in the wine and ginseng, among which chlorpyrifos and phoxim were not detected. The specific pesticide types and residues detected are shown in Table 3. The residues of all compounds were corrected to the theoretical concentrations by spiking the recoveries and calculating the ratio of the concentration in wine to that in ginseng. The detailed results are shown in Figure 6.
Table 3.
Pesticide residues and recovery from ginseng and ginseng wine.
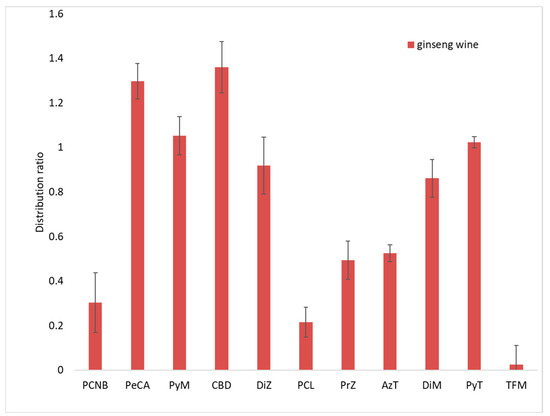
Figure 6.
Distribution ratios of 11 target substances in ginseng and ginseng wine.
As shown in Figure 6, the average distribution ratio (concentration of compound in wine/concentration of compound in ginseng) of PCNB in ginseng wine and fresh ginseng was 0.30, while that of PeCA was 1.3. The concentration in ginseng wine was 1.3 times that in ginseng. The distribution ratios of four pesticides (PyM, DiZ, DiM and PyT) in the ginseng wine were about 1. Their concentrations in ginseng and ginseng wine had converged. On the other hand, the distribution ratios of four pesticides (CyD, PrZ, AzT and TFM) ranged from 0.025 to 0.52, and their concentrations in ginseng wine were less than 50% of their concentrations in fresh ginseng.
4.5.3. Discussion
The mass mobility of the target was calculated based on the final converted concentrations of the target in ginseng wine and ginseng, Cgi (µg/L) and Cai (µg/kg), the mass of ginseng, mgi (kg), and the volume of ginseng wine, ‘V’ (L). Since the mobility varies with differenced in the initial concentration of the target compounds, only samples with a 20% difference in ginseng wine concentration or parallel samples were used to calculate the mobility () in this section. The mobility equation is as follows:
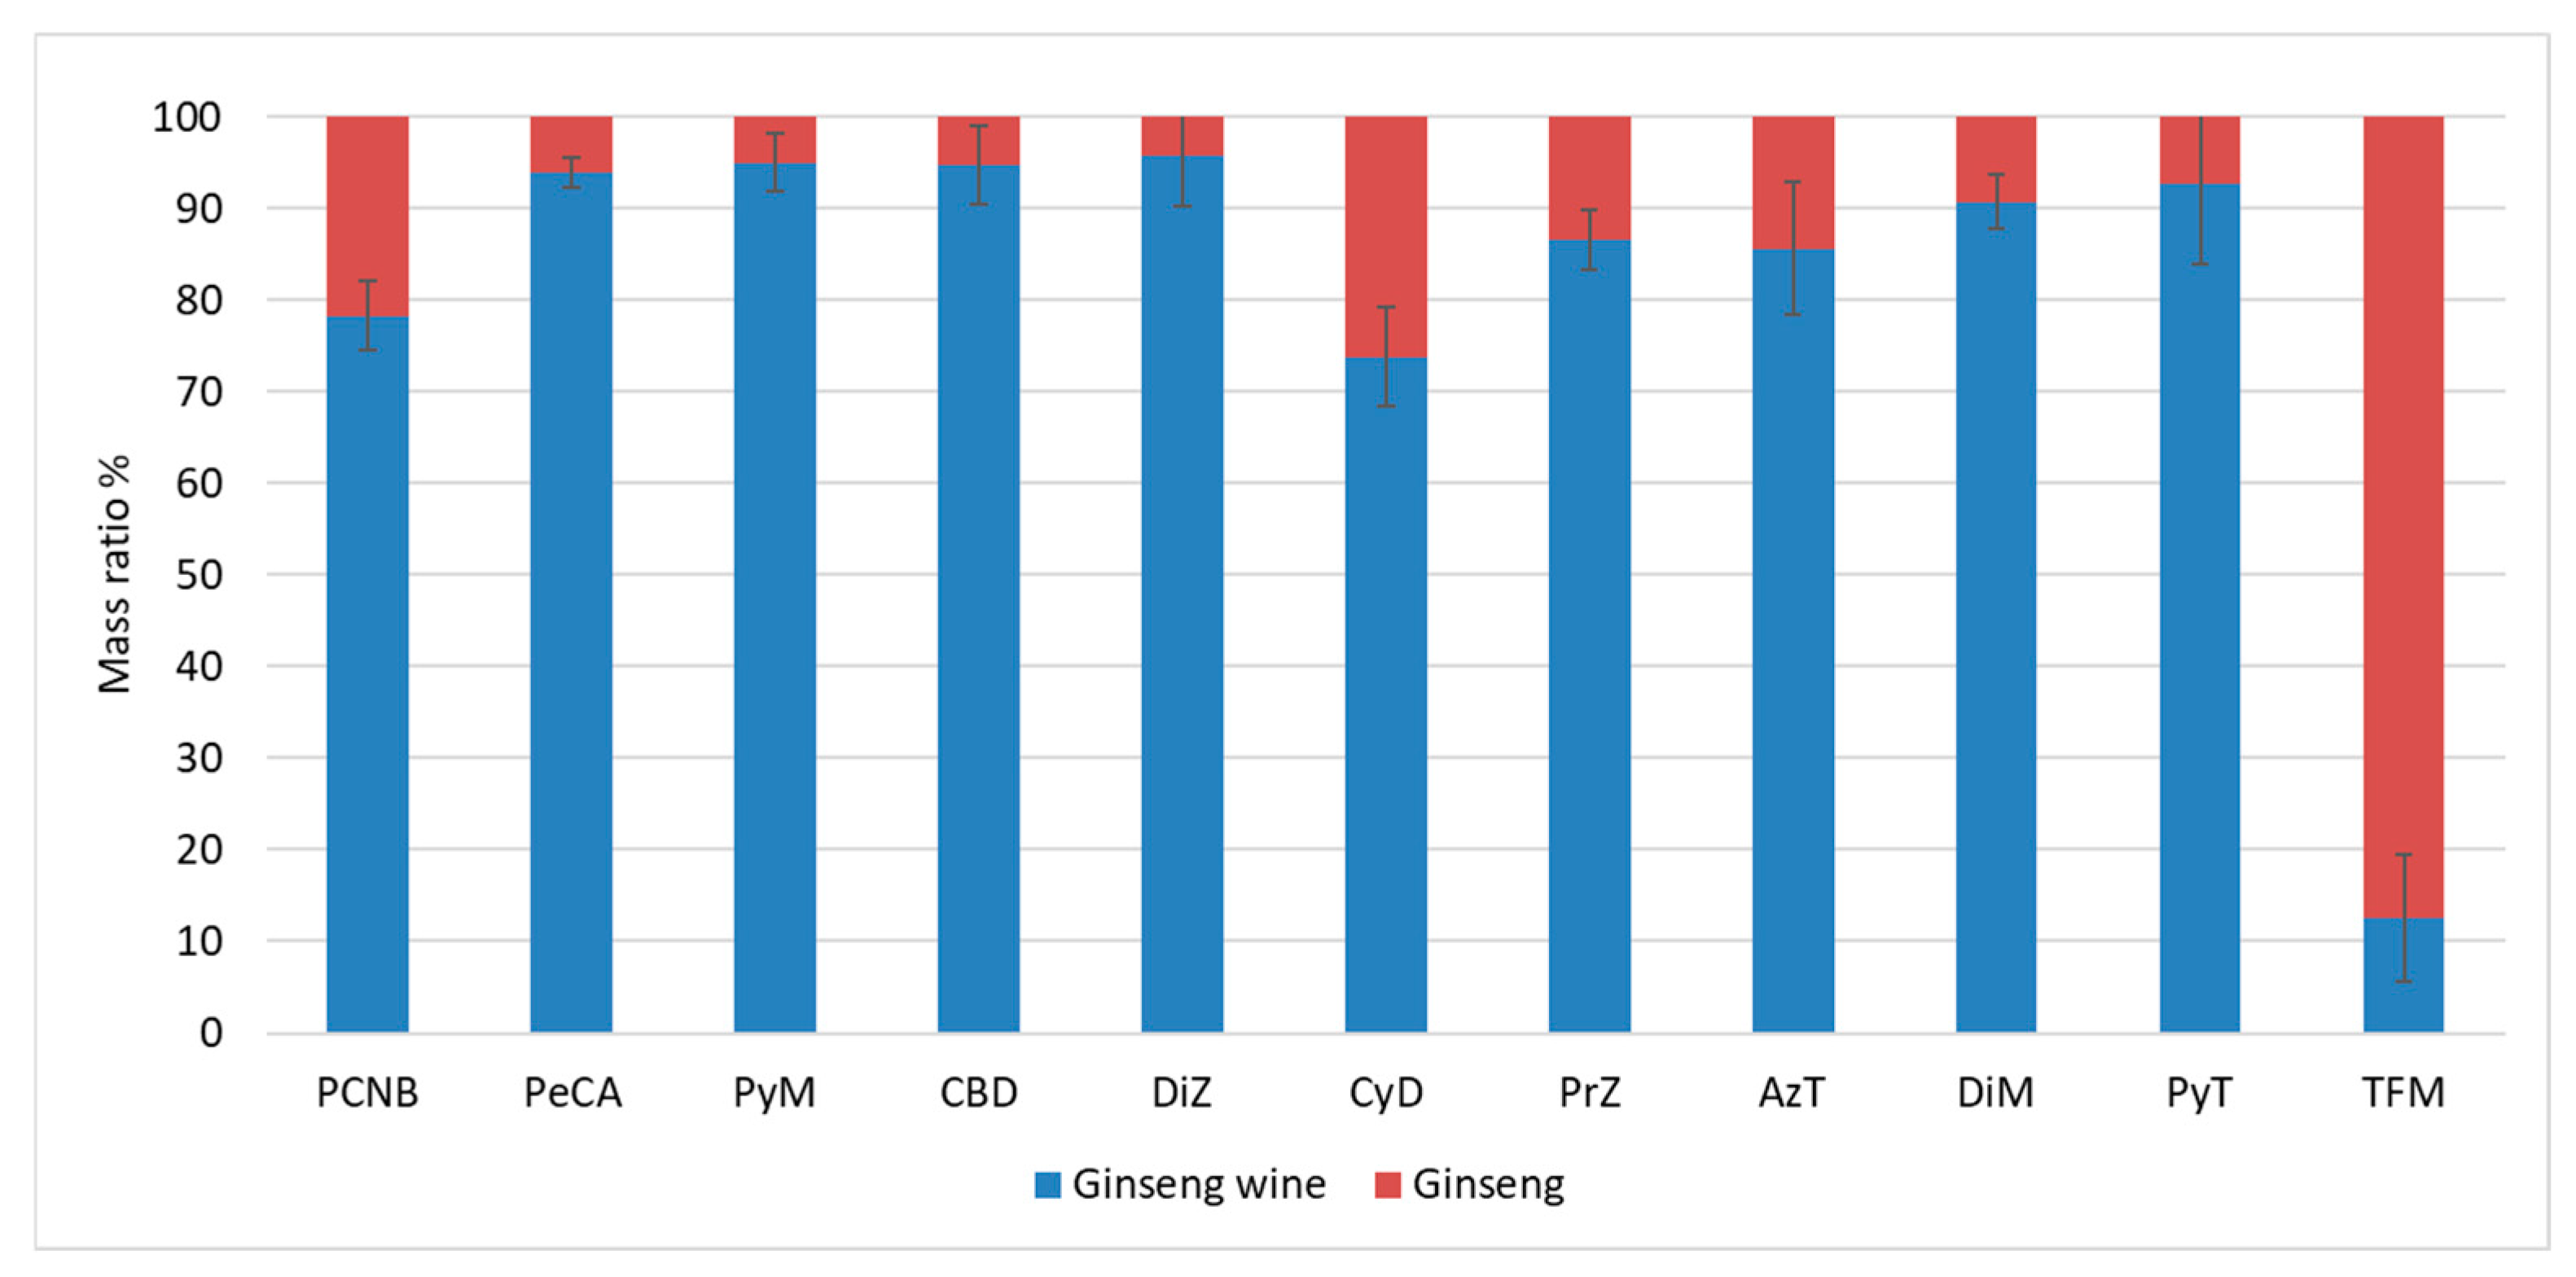
As shown in Figure 7, the mobility results of this experiment had a high precision, which indicated that the mass mobility of PCNB soaked in 62 degrees white wine at a ginseng-to-wine mass ratio of 1:10 for 180 days was about 78.3%, and that the mobility of its metabolite (PeCA) was 93.9% (ignoring the metabolism of PCNB to PeCA). The mobility of TFM was the lowest, at only 12.6%, followed by CyD at 73.7%. The remaining pesticides had mobility rates ranging from 85% to 95.7%.
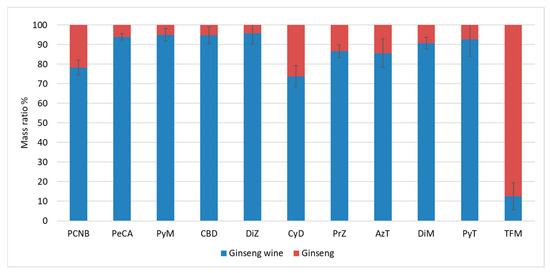
Figure 7.
Mass ratios of 11 target substances in ginseng and ginseng wine.
The total mass of PeCA in both ginseng and wine increased after ginseng wine soaking, while the Quality Growth Rate of PeCA in ginseng wine was higher than that in ginseng, which also indicated that ginseng wine processing accelerated the conversion of PCNB to PeCA in each medium. The high distribution ratio of CDB may be because of the calculation error caused by its sensitivity to pH, which makes the measured recovery different from the spiked recovery. Except for PCNB, CyD, PrZ, AzT, and TFM, the concentrations of the compounds in ginseng and wine converged, and their residues in the fresh ginseng were gradually transferred to the ginseng wine.
4.6. Dietary Risk of Ginseng Wine
In this analytical study, it was shown that the migration rate of pesticides in ginseng wine was overwhelmingly above 70%. The processing of fresh ginseng to ginseng wine does not increase the residual levels of risk factors. In this paper, ginseng wine was made with a mass–volume ratio of ginseng to wine of 1:10 (g/mL), and the mass ratio of fresh ginseng made into raw sun-dried ginseng was 3:1 (g/g).
5. Conclusions
For the first time, a method based on gas chromatography–tandem mass spectrometry (GC-MS/MS) and liquid chromatography–tandem mass spectrometry (LC-MS/MS) using a dispersive liquid–liquid micro extraction technique was established for the simultaneous determination of 166 pesticides and related metabolites in ginseng wine. Important pre-treatment aspects such as the concentration method, micro extracting, salt solution, and type and volume of dispersant were optimized. The recoveries ranged from 60% to 130% for 133 pesticides and metabolites. It was shown that this method can achieve the qualitative and quantitative detection of 133 pesticides and metabolites in ginseng wine. The approach has been improved upon over time, and in this work, more precise LC-MS/MS and GC-MS/MS methods were utilized. This reliable and effective method is thus appropriate for use in the risk assessment and screening of real samples. During the making of ginseng wine from fresh ginseng, most of the pesticides in fresh ginseng migrated to the wine. PCNB is also degraded to PeCA at an accelerated rate, which reduces the dietary risk of raw materials.
One limitation of this study is that the present method has very low recoveries or even no detection at all for some of the more polar pesticides. Therefore, methods for recovery by solid-phase extraction should be further developed.
Supplementary Materials
The following supporting information can be downloaded at https://www.mdpi.com/article/10.3390/separations12040085/s1. Table S1: The presence and quantification of 166 pesticide residues in ginseng wine.
Author Contributions
Conceptualization, Y.L., D.Z. and X.X.; Methodology, X.X., M.Z. and X.M.; Validation, X.M., D.Z. and X.X.; Formal analysis, X.X., Y.C., M.Z. and X.M.; Data curation, X.X., Y.C. and M.Z.; Writing—original draft preparation, X.X., X.L. and S.L.; Writing—review and editing, X.X. and S.L.; Supervision, Y.L. and D.Z.; Project administration, X.X. and D.Z.; Funding acquisition, X.X. and D.Z. All authors have read and agreed to the published version of the manuscript.
Funding
This study was financially supported by the Science and Technology Guidance Program of Jilin Provincial Science and Technology Department (20200354): Development of a method for authentication and quality evaluation of ginseng products using headspace gas chromatography-mass spectrometry fingerprinting technology.
Data Availability Statement
Data are contained within the article and Supplementary Materials.
Conflicts of Interest
The authors declare no conflicts of interest.
References
- Kim, J.H.; Yi, Y.S.; Kim, M.Y.; Cho, J.Y. Role of ginsenosides, the main active components of Panax ginseng, in inflammatory responses and diseases. J. Ginseng Res. 2017, 41, 435–443. [Google Scholar] [CrossRef] [PubMed]
- Gu, L.D.; Lee, J.S.; Kim, K.T.; Kim, H.Y.; Lee, S. Analysis of major ginsenosides in various ginseng samples. J. Biol. Chem. 2019, 62, 87–91. [Google Scholar]
- In, G.; Ahn, N.G.; Bae, B.S.; Lee, M.W.; Park, H.W.; Jang, K.H.; Cho, B.G.; Han, C.K.; Park, C.K.; Kwak, Y.S. In situ analysis of chemical components induced by steaming between fresh ginseng, steamed ginseng, and red ginseng. J. Ginseng Res. 2017, 41, 361–369. [Google Scholar] [CrossRef] [PubMed]
- Colzani, M.; Altomare, A.; Caliendo, M.; Aldini, G.; Righetti, P.G.; Fasoli, E. The secrets of Oriental panacea: Panax ginseng. J. Proteomics. 2016, 130, 150–159. [Google Scholar] [CrossRef]
- Lee, J.I.; Park, K.S.; Cho, I.H. Panax ginseng: A candidate herbal medicine for autoimmune disease. J. Ginseng Res. 2019, 43, 342–348. [Google Scholar] [CrossRef]
- Zhang, X.; Gao, Y.G.; Zang, P.; Zhao, Y.; Zhu, H.Y.; He, Z.M. Effects of four new processing technologies on pesticide residues and saponins content in ginseng. J. Food Process Pres. 2020, 44, 7. [Google Scholar] [CrossRef]
- Ye, J.; Gao, Y.X.; Tian, S.S.; Su, J.; Zhang, W.D. A novel and effective mode-switching triple quadrupole mass spectrometric approach for simultaneous quantification of fifteen ginsenosides in Panax ginseng. Phytomedicine 2018, 44, 164–172. [Google Scholar] [CrossRef]
- Wu, P.L.; Gu, M.Y.; Wang, Y.J.; Xue, J.; Wu, X.L. Transfer of Organochlorine Pesticide Residues during Household and Industrial Processing of Ginseng. J. Food Qual. 2020, 2020, 1–9. [Google Scholar] [CrossRef]
- Yao, C.L.; Wang, J.; Li, Z.W.; Qu, H.; Pan, H.Q.; Li, J.Y.; Wei, W.L.; Zhang, J.Q.; Bi, Q.R.; Guo, D.A. Characteristic malonyl ginsenosides from the leaves of Panax notoginseng as potential quality markers for adulteration detection. J. Agric. Food Chem. 2021, 69, 4849–4857. [Google Scholar] [CrossRef]
- Fan, S.S.; Zhang, Z.P.; Su, H.; Xu, P.; Qi, H.Y.; Zhao, D.Q.; Li, X.Y. Panax ginseng clinical trials: Current status and future perspectives. Biomed. Pharmacother. 2020, 132, 110932. [Google Scholar] [CrossRef]
- Stachniuk, A.; Fornal, E. Liquid Chromatography-Mass Spectrometry in the Analysis of Pesticide Residues in Food. Food Anal. Methods 2016, 9, 1654–1665. [Google Scholar]
- Anagnostopoulos, C.J.; Sarli, P.A.; Liapis, K.; Haroutounian, S.A.; Miliadis, G.E. Validation of Two Variations of the QuEChERS Method for the Determination of Multiclass Pesticide Residues in Cereal-Based Infant Foods by LC-MS/MS. Food Anal. Methods 2012, 5, 664–683. [Google Scholar] [CrossRef]
- Cherta, L.; Beltran, J.; Pitarch, E.; Hernandez, F. Comparison of Simple and Rapid Extraction Procedures for the Determination of Pesticide Residues in Fruit Juices by Fast Gas Chromatography-Mass Spectrometry. Food Anal. Methods 2013, 6, 1671–1684. [Google Scholar]
- Tong, H.F.; Tong, Y.L.; Xue, J.; Liu, D.J.; Wu, X.B. Multi-residual Pesticide Monitoring in Commercial Chinese Herbal Medicines by Gas Chromatography-Triple Quadrupole Tandem Mass Spectrometry. Food Anal. Methods 2014, 7, 135–145. [Google Scholar] [CrossRef]
- Chen, L.N.; Yin, L.H.; Song, F.R.; Liu, Z.Q.; Zheng, Z.; Xing, J.P.; Liu, S.Y. Determination of pesticide residues in ginseng by dispersive liquid-liquid microextraction and ultra high performance liquid chromatography-tandem mass spectrometry. J. Chromatogr. B 2013, 917, 71–77. [Google Scholar]
- Wu, R.X.; Chen, Q.Y.; Li, S.J.; Fan, G.L. Simultaneous Determination of 27 Pesticides in Ginseng by UPLC/MS/MS and Modified QuEChERS Procedure. J. AOAC Int. 2015, 98, 839–846. [Google Scholar] [CrossRef]
- Chen, Y.; Lopez, S.; Hayward, D.G.; Park, H.Y.; Wong, J.W.; Kim, S.S.; Wan, J.; Reddy, R.M.; Quinn, D.J.; Steiniger, D. Determination of Multiresidue Pesticides in Botanical Dietary Supplements Using Gas Chromatography-Triple-Quadrupole Mass Spectrometry (GC-MS/MS). J. Agric. Food Chem. 2016, 64, 6125–6132. [Google Scholar]
- Chowdhury, M.E.K.; Bae, H. Bacterial endophytes isolated from mountain-cultivated ginseng (Panax ginseng Mayer) have biocontrol potential against ginseng pathogens. Biol. Control 2018, 126, 97–108. [Google Scholar]
- Lu, Z.; Fang, N.; Liu, Y.J.; Zhang, Z.B.; Pan, H.Y.; Hou, Z.G.; Li, Y.R.; Lu, Z.B. Dissipation and residues of the diamide insecticide chlorantraniliprole in ginseng ecosystems under different cultivation environments. Environ. Monit. Assess. 2017, 189, 534. [Google Scholar]
- Narenderan, S.T.; Meyyanathan, S.N.; Babu, B. Review of Pesticide Residue Analysis in Fruits and Vegetables. Pre-Treatment, Extraction and Detection Techniques. Food Res. Int. 2020, 133, 109141. [Google Scholar]
- Makni, Y.; Diallo, T.; Guérin, T.; Parinet, J. Improving the Monitoring of Multi-Class Pesticides in Baby Foods Using QuEChERS-UHPLC-Q-TOF with Automated Identification Based on MS/MS Similarity Algorithms. Food Chem. 2022, 395, 133573. [Google Scholar] [CrossRef] [PubMed]
- Moinfar, S.; Khodayari, A.; Abdulrahman, S.S.; Aghaei, A.; Sohrabnezhad, S.; Jamil, L.A. Development of a SPE/GC–MS Method for the Determination of Organophosphorus Pesticides in Food Samples Using Syringe Filters Packed by GNP/MIL-101(Cr) Nanocomposite. Food Chem. 2022, 371, 130997. [Google Scholar] [CrossRef]
- Cunha, S.C.; Fernandes, J.O.; Oliveira, M.B.P.P. Fast Analysis of Multiple Pesticide Residues in Apple Juice Using Dispersive Liquid-Liquid Microextraction and Multidimensional Gas Chromatography-Mass Spectrometry. J. Chromatogr. A 2009, 1216, 8835–8844. [Google Scholar] [CrossRef] [PubMed]
- Farajzadeh, M.A.; Kiavar, L.; Pezhhanfar, S. Development of a Method Based on Dispersive Liquid–Liquid Microextraction Followed by Partial Vaporization of the Extract for Ultra–Preconcentration of Some Pesticide Residues in Fruit Juices. J. Chromatogr. A 2021, 1653, 462427. [Google Scholar] [CrossRef] [PubMed]
- Deng, K.J.; Lan, X.H.; Sun, G.; Ji, L.Y.; Zheng, X.L. Determination of Sulfonamide Residues in Chicken Liver Using High-Performance Liquid Chromatography. Food Anal. Methods 2016, 9, 3337–3344. [Google Scholar] [CrossRef]
- Moema, D.; Nindi, M.M.; Dube, S. Development of a dispersive liquid–liquid microextraction method for the determination of fluoroquinolones in chicken liver by high performance liquid chromatography. Anal. Chim. Acta 2012, 730, 80–86. [Google Scholar] [CrossRef]
- Han, D.D.; Tang, B.K.; Lee, Y.R.; Row, K.H. Application of ionic liquid in liquid phase microextraction technology. J. Sep. Sci. 2015, 35, 2949. [Google Scholar] [CrossRef]
- Liu, B.; Yan, H.; Qiao, F.; Geng, Y. Determination of clenbuterol in porcine tissues using solid-phase extraction combined with ultrasound-assisted dispersive liquid-liquid microextraction and HPLC-UV detection. J. Chromatogr. B Anal. Technol. Biomed. Life Sci. 2011, 879, 90–94. [Google Scholar] [CrossRef]
- Viñas, P.; López-García, I.; Bravo-Bravo, M.; Briceño, M.; Hernández-Córdoba, M. Dispersive liquid-liquid microextraction coupled to liquid chromatography for thiamine determination in foods. Anal. Bioanal. Chem. 2012, 403, 1059–1066. [Google Scholar] [CrossRef]
- Cha, K.M.; Lee, E.S.; Kim, I.W.; Cho, H.K.; Ryu, J.H.; Kim, S.K. Canola oil is an excellent vehicle for eliminating pesticide residues in aqueous ginseng extract. J. Ginseng Res. 2016, 40, 292–299. [Google Scholar] [CrossRef]
- Zhang, X.; Gao, Y.G.; Zang, P.; Zhao, Y.; He, Z.M.; Zhu, H.Y.; Song, S.N.; Zhang, L.X. Study on the simultaneous degradation of five pesticides by Paenibacillus polymyxa from Panax ginseng and the characteristics of their products. Ecotoxicol. Environ. Saf. 2019, 168, 415–422. [Google Scholar] [CrossRef] [PubMed]
- Kocúrová, L.; Balogh, I.S.; Šandrejová, J.; Andruch, V. Recent advances in dispersive liquid–liquid microextraction using organic solvents lighter than water. A Review. Microchem. J. 2012, 102, 11–17. [Google Scholar] [CrossRef]
- Ma, J.; Lu, W.; Chen, L. Recent Advances in Dispersive Liquid–Liquid Microextraction for Organic Compounds Analysis in Environmental Water: A Review. Curr. Anal. Chem. 2012, 8, 78–90. [Google Scholar] [CrossRef]
- Li, S.; Chen, Y.H.; Li, S.K.; Xu, D.P.; Zou, Z.F.; Li, H.B. Recent Development and Application of Dispersive Liquid-Liquid Microextraction. Int J. Food Sci. Nutr. 2013, 3, 171–204. [Google Scholar]
- Padilla-Alonso, D.J.; Garza-Tapia, M.; Chávez-Montes, A.; González-Horta, A.; Waksmande Torresa, N.H.; Castro-Ríos, R. New temperature-assisted ionic liquid-based dispersive liquid–liquid microextraction method for the determination of glyphosate and aminomethylphosphonic acid in water samples. J. Liq. Chromatogr. Relat. Technol. 2017, 40, 147–155. [Google Scholar]
- Ballesteros-Gómez, A.; Rubio, S.; Pérez-Bendito, D. Potential of supramolecular solvents for the extraction of contaminants in liquid foods. J. Chromatogr. A 2009, 121, 530–539. [Google Scholar] [CrossRef]
- Vázquez, M.P.; Vázquez, P.P.; Galera, M.M.; García, M.G.; Uclés, A. Ultrasound-assisted ionic liquid dispersive liquid–liquid microextraction coupled with liquid chromatography-quadrupole-linear ion trap-mass spectrometry for simultaneous analysis of pharmaceuticals in wastewaters. J. Chromatogr. A 2013, 1291, 19–26. [Google Scholar] [CrossRef]
- Yan, H.; Wang, H. Recent development and applications of dispersive liquid–liquid microextraction. J. Chromatogr. A 2013, 1295, 1–15. [Google Scholar] [CrossRef]
- Hassan, S.; Parisa, K.; Nina, N. Recent trends in replacement of disperser solvent in dispersive liquid-liquid microextraction methods. Sep. Purif. Rev. 2018, 48, 159–178. [Google Scholar]
- Mingtao, H.; Xiaoran, L.; Rui, C.; Naichao, C. Ginsenosides’ Dissolution Performance and Distribution Characteristics in Alcohol. J. Ginseng Res. 2020, 32, 2–8. [Google Scholar]
- GB/T 27404-2008; Laboratory Quality Control Practices, Physical and Chemical Testing of Food. China National Standardization Administration: Beijing, China, 2008.
- GB 2763-2021; Maximum Residue Limits for Pesticides in Food. National Health Commission of the People’s Republic of China, Ministry of Agriculture and Rural Affairs of the People’s Republic of China, State Administration for Market Regulation: Beijing, China, 2021.


Disclaimer/Publisher’s Note: The statements, opinions and data contained in all publications are solely those of the individual author(s) and contributor(s) and not of MDPI and/or the editor(s). MDPI and/or the editor(s) disclaim responsibility for any injury to people or property resulting from any ideas, methods, instructions or products referred to in the content. |
© 2025 by the authors. Licensee MDPI, Basel, Switzerland. This article is an open access article distributed under the terms and conditions of the Creative Commons Attribution (CC BY) license (https://creativecommons.org/licenses/by/4.0/).