Abstract
Polygonatum sibiricum (P. sibiricum) is a significantly health-promoting plant unique in medicine and food. Currently, research on the bioactive components of P. sibiricum primarily focuses on polysaccharides. According to the Chinese Pharmacopoeia, the polysaccharide content in P. sibiricum must be at least 7.0%, which is the only criterion used for determining its content. In contrast, this study aims to thoroughly investigate and clarify the various components that contribute to the therapeutic and functional properties of P. sibiricum. We seek to broaden the focus beyond polysaccharides to identify other potentially significant bioactive substances. We established High-Performance Liquid Chromatograph (HPLC) fingerprints for wine-processed P. sibiricum from various regions and identified 17 common peaks. The antioxidant activities of these components were assessed using ABTS and DPPH methods. The spectrum–effect relationship was elucidated through partial least squares regression and grey relational analysis. The results revealed that the antioxidant active components in wine-processed P. sibiricum include 5-hydroxymethylfurfural, p-hydroxycinnamic acid, myricetin, caffeic acid, vanillic acid, and adenosine. This research not only clarifies the antioxidant material basis of wine-processed P. sibiricum but also establishes a scientific foundation for enhanced quality control in future applications.
1. Introduction
P. sibiricum is a perennial herbaceous plant in the Liliaceae family [1], and it holds a significant position in traditional Chinese medicine (TCM). As documented in the Compendium of Materia Medica, P. sibiricum has been regarded as an essential medicinal herb for promoting health. It was also prominently listed in the herbal section of the Mingyi Bielu [2]. This plant is believed to strengthen the body, prevent diseases, and promote longevity, resulting in its esteemed status as a “longevity herb” [3]. Since 2002, P. sibiricum has been classified as a medicinal food homologous plant in China [4]. Modern research has highlighted its distinct bioactivities, including antioxidative, anti-aging, blood glucose-lowering, antitumor, antibacterial, anti-inflammatory, and immune-regulatory properties [5,6,7]. Studies on the phytochemical composition of P. sibiricum have identified several bioactive components, such as polysaccharides, flavonoids, steroidal saponins, and alkaloids [8]. Notably, most existing literature has focused primarily on the polysaccharide components. The polysaccharide content (which must be at least 7.0%) is the sole criterion for determining the content of P. sibiricum in the Chinese Pharmacopoeia [9]. This narrow focus may not adequately represent the overall quality of such a complex herbal material, emphasizing the need for comprehensive research into its other active constituents [10].
The study of the TCM spectrum–effect relationship has developed rapidly in recent years, relating the TCM fingerprint and pharmacodynamics through chemometric models, enhancing the understanding of the medicine’s quality and efficacy [11,12,13]. It facilitates the identification of effective compounds within Chinese medicines and aids in establishing control standards that accurately reflect their intrinsic quality [14,15]. Chemometrics analysis plays an important role in the study of the spectrum–effect relationship. Combining HPLC fingerprinting with chemometrics offers a more scientific, reliable, and comprehensive solution for TCM quality control. HPLC fingerprinting can effectively capture the intricate chemical profile of TCM. Meanwhile, chemometric techniques like principal component analysis (PCA) and cluster analysis (CA) help to analyze and interpret this extensive fingerprint data, providing a more comprehensive understanding of the chemical characteristics of TCM [16]. At the same time, analyzing chemometric correlations is crucial for identifying the key pharmacodynamic components. The most frequently used techniques for relationship analysis and modeling in chemometrics include grey relational analysis (GRA), partial least squares (PLS) regression modeling, and bivariate correlation analysis (BCA) [17]. The correlation between the chromatographic peak and pharmacodynamic index can be established. This correlation model can predict the relationship between the pharmacodynamic index and chemical composition, providing a foundation for research on the pharmacodynamic material basis.
In this study, we investigated the pharmacodynamic material basis of P. sibiricum using the HPLC fingerprinting spectrum–effect relationship methodology. We chose wine-processed P. sibiricum as the raw material instead of raw P. sibiricum because it has a numbing and irritating taste and causes itching and discomfort when it directly contacts the skin, making it less palatable. Consequently, raw P. sibiricum is generally not used directly [5]. In contrast, wine-processed P. sibiricum is more popularly used as a raw material in medicines and health foods. According to the Chinese Pharmacopoeia [9], the wine-processing process involves cleaning the P. sibiricum, stewing or steaming it with wine, slightly drying it, cutting it into thick slices, and then drying it again. This process allows wine-processed P. sibiricum to retain its original properties while enhancing its efficacy, maximizing its beneficial effects. A study reported that wine-processed P. sibiricum performed better than raw P. sibiricum in improving mental state by increasing the spleen index, superoxide dismutase (SOD), and glutathione peroxidase (GSH-Px) activities, decreasing the liver index and malondialdehyde (MDA) activities, and restoring the histopathological morphology in D-gal-induced aging mice [18]. Therefore, we chose to use wine-processed P. sibiricum.
Initially, we established high-performance liquid chromatography (HPLC) fingerprint profiles for various batches of wine-processed P. sibiricum, and subsequently assessed their in vitro antioxidant activities. We further explored the relationships between the antioxidant activities and the chemical profiles through grey relational analysis and partial least squares regression modeling. This study provided a comprehensive exploration and elucidation of all material components that serve as the foundation for the therapeutic and functional characteristics of P. sibiricum. It moves beyond the previous focus on polysaccharides to investigate other bioactive substances that may also be important. The research findings not only enhance the understanding of the material basis of P. sibiricum but also provide a foundation for its comprehensive quality control.
2. Materials and Methods
2.1. Instruments
Elite p230 High Performance Liquid Chromatograph (Dalian Elite Analytical Instruments Co., Ltd., Dalian, China); AR3130 Electronic Analytical Balance (Mettler Toledo Co., Ltd., Shanghai, China); TGL-16C High-Speed Centrifuge (Shanghai Anting Scientific Instrument Factory, Shanghai, China); SCIENTZ-12N/A Freeze-Dryer (Ningbo Scientz Biotechnology Co., Ltd., Ningbo, China); R214-17302 Rotary evaporator (SENCO Bio-Tech./Senco Technology Co., Ltd., Shanghai, China); ELx800 microplate reader (BioTek Instruments, Inc., Winooski, VT, USA); and DS-5510 Ultrasonic Cleaner (Jeken Ultrasonic Cleaner Limited Co., Ltd., Wuhan, China).
2.2. Chemicals and Materials
2.2.1. Materials
All batches of wine-processed P. sibiricum were purchased from manufacturers in various regions of China, and the specific source information is shown in Table 1.

Table 1.
Sample information of wine-processed P. sibiricum.
2.2.2. Reagents and Chemicals
Reference standards 5-hydroxymethylfurfural (5-HMF) (LOT. M18B215382), p-hydroxycinnamic acid (LOT. H05A6Q1), myricetin (LOT. J11HB18838), adenosine (LOT. J08HB173656), caffeic acid (LOT. M28HB183194), vanillic acid (LOT. M06IB214403), and DL-malic acid (LOT. 119120871) were procured from Shanghai Yuanye Bio-Technology Co., Ltd., Shanghai, China. Chlorogenic acid (LOT. PS012922) (Chengdu Pusi Biotechnology Co., Ltd., Chengdu, China), methanol (analytical grade, Sinopharm Chemical Reagent Co., Ltd., Shanghai, China), ethanol (analytical grade, Sinopharm Chemical Reagent Co., Ltd., China), acetonitrile (Chromatographic grade, Thermo Fisher Scientific (China) Co., Ltd., Shanghai, China), formic acid (Chromatographic grade, Shanghai Aladdin Biochemical Technology Co., Ltd., Shanghai, China), 2,2′-azino-bis (3- ethylbenzothiazoline-6-sulfonic acid) (ABTS, Shanghai Yuanye Bio-Technology Co., Ltd., China), 2,2-diphenyl-1-picrylhydrazyl (DPPH, Shanghai Yuanye Bio-Technology Co., Ltd., China), potassium persulfate (K2S2O8, analytical pure, Sinopharm Chemical Reagent Co., Ltd., China), and L(+)-ascorbic acid (analytical pure, Sinopharm Chemical Reagent Co., Ltd., China). The experimental water was ultra-purified water, which was prepared by means of UPT-I-10T Ultra-pure Water System (Sichuan Uprime Ultra-pure Technology Co., Ltd., Chengdu, China).
2.3. Development of the HPLC Fingerprint of Wine-Processed P. sibiricum
2.3.1. Chromatographic Conditions
Supersil AQ-C18 (4.6 mm × 250 mm, 5 μm) column, wavelength: 280 nm, mobile phase: acetonitrile (A) − 0.1% formic acid solution (B), flow rate: 0.5 mL/min, column temperature: 25 °C, injection volume: 20 μL. The mobile phase gradient elution is presented as in Table 2.
Table 2.
The mobile phase gradient elution.
2.3.2. Preparation of the Sample Solutions
Approximately 5 g of wine-processed P. sibiricum was weighed, finely ground and sieved, then measured precisely. It was placed in a 100 mL conical flask, to which 50 mL of 75% ethanol was added, and ultrasonically treated three times, each for 30 min. The solution was filtered and centrifuged, compensating for any weight loss. The filtrates were combined and evaporated to dryness. The residue was diluted with 75% methanol to a final volume of 10 mL in a volumetric flask and set aside. Just before use, 200 μL of the solution was taken and diluted with 75% methanol to a final volume of 1 mL. Finally, the diluted solution was passed through a 0.22 μm microporous membrane for further use.
2.3.3. Preparation of the Reference Standard Solution
Eight standard samples were accurately weighed separately, dissolved in 75% methanol by volume, and solutions of 5-hydroxymethylfurfural (0.1060 mg/mL), p-hydroxycinnamic acid (0.1182 mg/mL), myricetin (0.1295 mg/mL), adenosine (0.2353 mg/mL), vanillic acid (0.1176 mg/mL), DL-malic acid (0.1765 mg/mL), caffeic acid (0.1500 mg/mL), and chlorogenic acid (0.1200 mg/mL) were prepared. These solutions were filtered through a 0.22 μm membrane and subsequently analyzed by injection under the specified chromatographic conditions.
2.4. Analytical Method Validation
2.4.1. Stability
Samples of wine-processed P. sibiricum (S14) were prepared according to the chromatographic conditions. Samples were injected at 0, 4, 8, 12, 16, 20, and 24 h according to the chromatographic conditions. Peak 15 was designated as the reference peak (S), and the relative standard deviation (RSD) of the relative retention time (RRt) and relative peak area (RPA) of the common peaks were calculated.
2.4.2. Accuracy
A wine-processed P. sibiricum (S14) sample was prepared and six consecutive injections were conducted according to the chromatographic conditions. Peak 15 was used as the reference peak (S), and the RSD of the RRt and RPA of the common peaks were calculated.
2.4.3. Repeatability
Six samples of wine-processed P. sibiricum (S14) test solution were prepared in parallel according to the method and injected according to the chromatographic conditions, with Peak 15 taken as the reference peak (S), and the RSD of the RRt and RPA of the common peaks was calculated.
2.5. Establishment of the Common Mode of Wine-Processed P. sibiricum
Fourteen batches of test solutions of wine-processed P. sibiricum were prepared according to the aforementioned steps. The samples were injected under the chromatographic conditions of the aforementioned steps. The liquid chromatograms were exported in a specific format and analyzed using the Fingerprint Evaluation System of Traditional Chinese Medicines (2004.A version). SPSS 27.0 was used for cluster analysis, and SPSS 27.0 and SIMCA 14.1 were used for principal component analysis.
2.6. Determination of Antioxidant Activity
2.6.1. Preparation of the Solutions
Sample preparation: The wine-processed P. sibiricum was extracted by the above method and frozen for 24 h at −80 °C. It was then freeze-dried for 24 h at −55 °C and a vacuum degree of 6.4 Pa to obtain the lyophilized powder.
Test sample solution: The lyophilized powder of wine-processed P. sibiricum was accurately weighed and dissolved in 75% methanol solution, and solutions with concentrations of 0.05, 0.10, 0.20, 0.50, 1.00, 2.00, 3.00, and 5.00 mg/mL were prepared for subsequent use.
Ascorbic acid (Vc) solution: An appropriate amount of Vc was accurately weighed and dissolved in water to form a stock solution. Working solutions of concentrations 0.01, 0.02, 0.05, 0.10, 0.20, 0.50, and 1.00 mg/mL were prepared and stored in the dark for later use.
The ABTS working solution: 0.0663 g of K2S2O8 was accurately weighed and dissolved in 100 mL of water to prepare a 2.45 mmol·L−1 K2S2O8 solution; 0.3841 g of ABTS was accurately weighed and dissolved in 100 mL of water to prepare a 7.00 mmol/L ABTS solution. The two solutions were mixed in equal volumes and incubated in the dark at room temperature for 12 h to yield the ABTS radical cation stock solution. Before the experiment, 2 mL of the ABTS radical cation stock solution was diluted with pure water to achieve an absorbance of 0.70 (±0.02) at a wavelength of 734 nm, resulting in the ABTS radical cation working solution [19].
The DPPH working solution: 0.0049 g of DPPH was accurately weighed and dissolved in 50 mL of anhydrous ethanol, configured as a 0.2 mmol·L−1 DPPH solution, and stored away from light [20].
2.6.2. ABTS Assay
Fourteen batches of test solutions with different concentrations were prepared by mixing 50 μL of the test solution with 200 μL of ABTS+ solution and sequentially adding them to the 96-well plate. The mixtures were shaken well and incubated at room temperature for 6 min. Ascorbic acid was used as the positive control, and the absorbance values were measured at 734 nm using auto-zeroing with purified water.
where:
Scavenging rate = [1 − (A2 − A1)/A0] × 100%
A0 is the absorbance of the blank control (50 μL of 75% methanol + 200 μL ABTS+ solution);
A1 is the background absorbance of the sample group (50 μL test solution + 200 μL pure water);
and A2 is the absorbance of the sample group (50 μL test solution + 200 μL ABTS+ solution).
2.6.3. DPPH Assay
A 96-well plate added 100 μL of 0.2 mmol·L−1 DPPH solution and 100 μL of sample solutions at various concentrations separately. After being incubated for 30 min at room temperature in the dark, the absorbance was measured at 517 nm. The blank control was the absorbance of a mixture of 100 μL of DPPH solution and an equal volume of 75% methanol. In comparison, the self-control was the absorbance of a mixture of 100 μL of the test solution and an equal volume of anhydrous ethanol. The calculation of the scavenging rate of DPPH free radicals was as follows:
where Ai is the absorbance of the sample, Aj is the absorbance of the self-control, and Ac is the absorbance of the blank control.
Scavenging rate (%) = (1 − (Ai − Aj)/Ac) × 100%
The mass concentration of wine-processed P. sibiricum samples and the corresponding measured antioxidant scavenging rates were imported into GraphPad Prism 10 software and processed to obtain the half-maximal clearance concentration (IC50).
2.7. Spectrum–Effect Relationship Analysis
2.7.1. Grey Relational Analysis
The reciprocals of the measured results of DPPH antioxidant capacity and ABTS antioxidant capacity were used as the reference sequence (Yk), and the peak areas of common peaks were used as the comparison sequence (Xi). The data were normalized using the initial value method. The grey relational grade between the reference sequence and the comparison sequence was calculated using the following formula [21]:
where k is the sample number, i is the common peak number, is the grey relational coefficient, and ρ is the resolution coefficient, taken as 0.5. r is the grey relational grade.
ξi(k) = (Δ(min) + ρΔ(max))/(Δ(ik) + ρΔ(max))
Δ(ik) = ∣Yi(k) − Xi(k)∣
The closer the grey relational grade is to 1, the stronger the correlation between the peak area and the corresponding indicator. A grade of ≥0.9 means a significant impact, a grade of ≥0.7 indicates a considerable impact, and a grade of ≥0.6 suggests a minor impact.
2.7.2. Partial Least Squares Regression Analysis
Regression equations were established using partial least squares regression analysis with SIMCA 14.0 software. The independent variable (X) consisted of the peak areas of common peaks in the HPLC fingerprints for each batch of wine-processed P. sibiricum. The dependent variable (Y) was the reciprocal of the measured results of DPPH antioxidant capacity and ABTS antioxidant capacity, respectively [22]. The data were standardized by using the normalization method. The contribution of each common peak to anti-oxidation was predicted by the regression coefficient of the regression equation and the Variable Importance in the Projection (VIP) value. A positive regression coefficient indicates that a chemical component enhances pharmacodynamic effects, while a negative one suggests an inhibitory role. Variables with VIP > 1 significantly contribute to the model and are crucial to pharmacodynamic effect assessment.
3. Results
3.1. HPLC Fingerprint Analysis of Wine-Processed P. sibiricum
3.1.1. Optimization of the Chromatographic Conditions
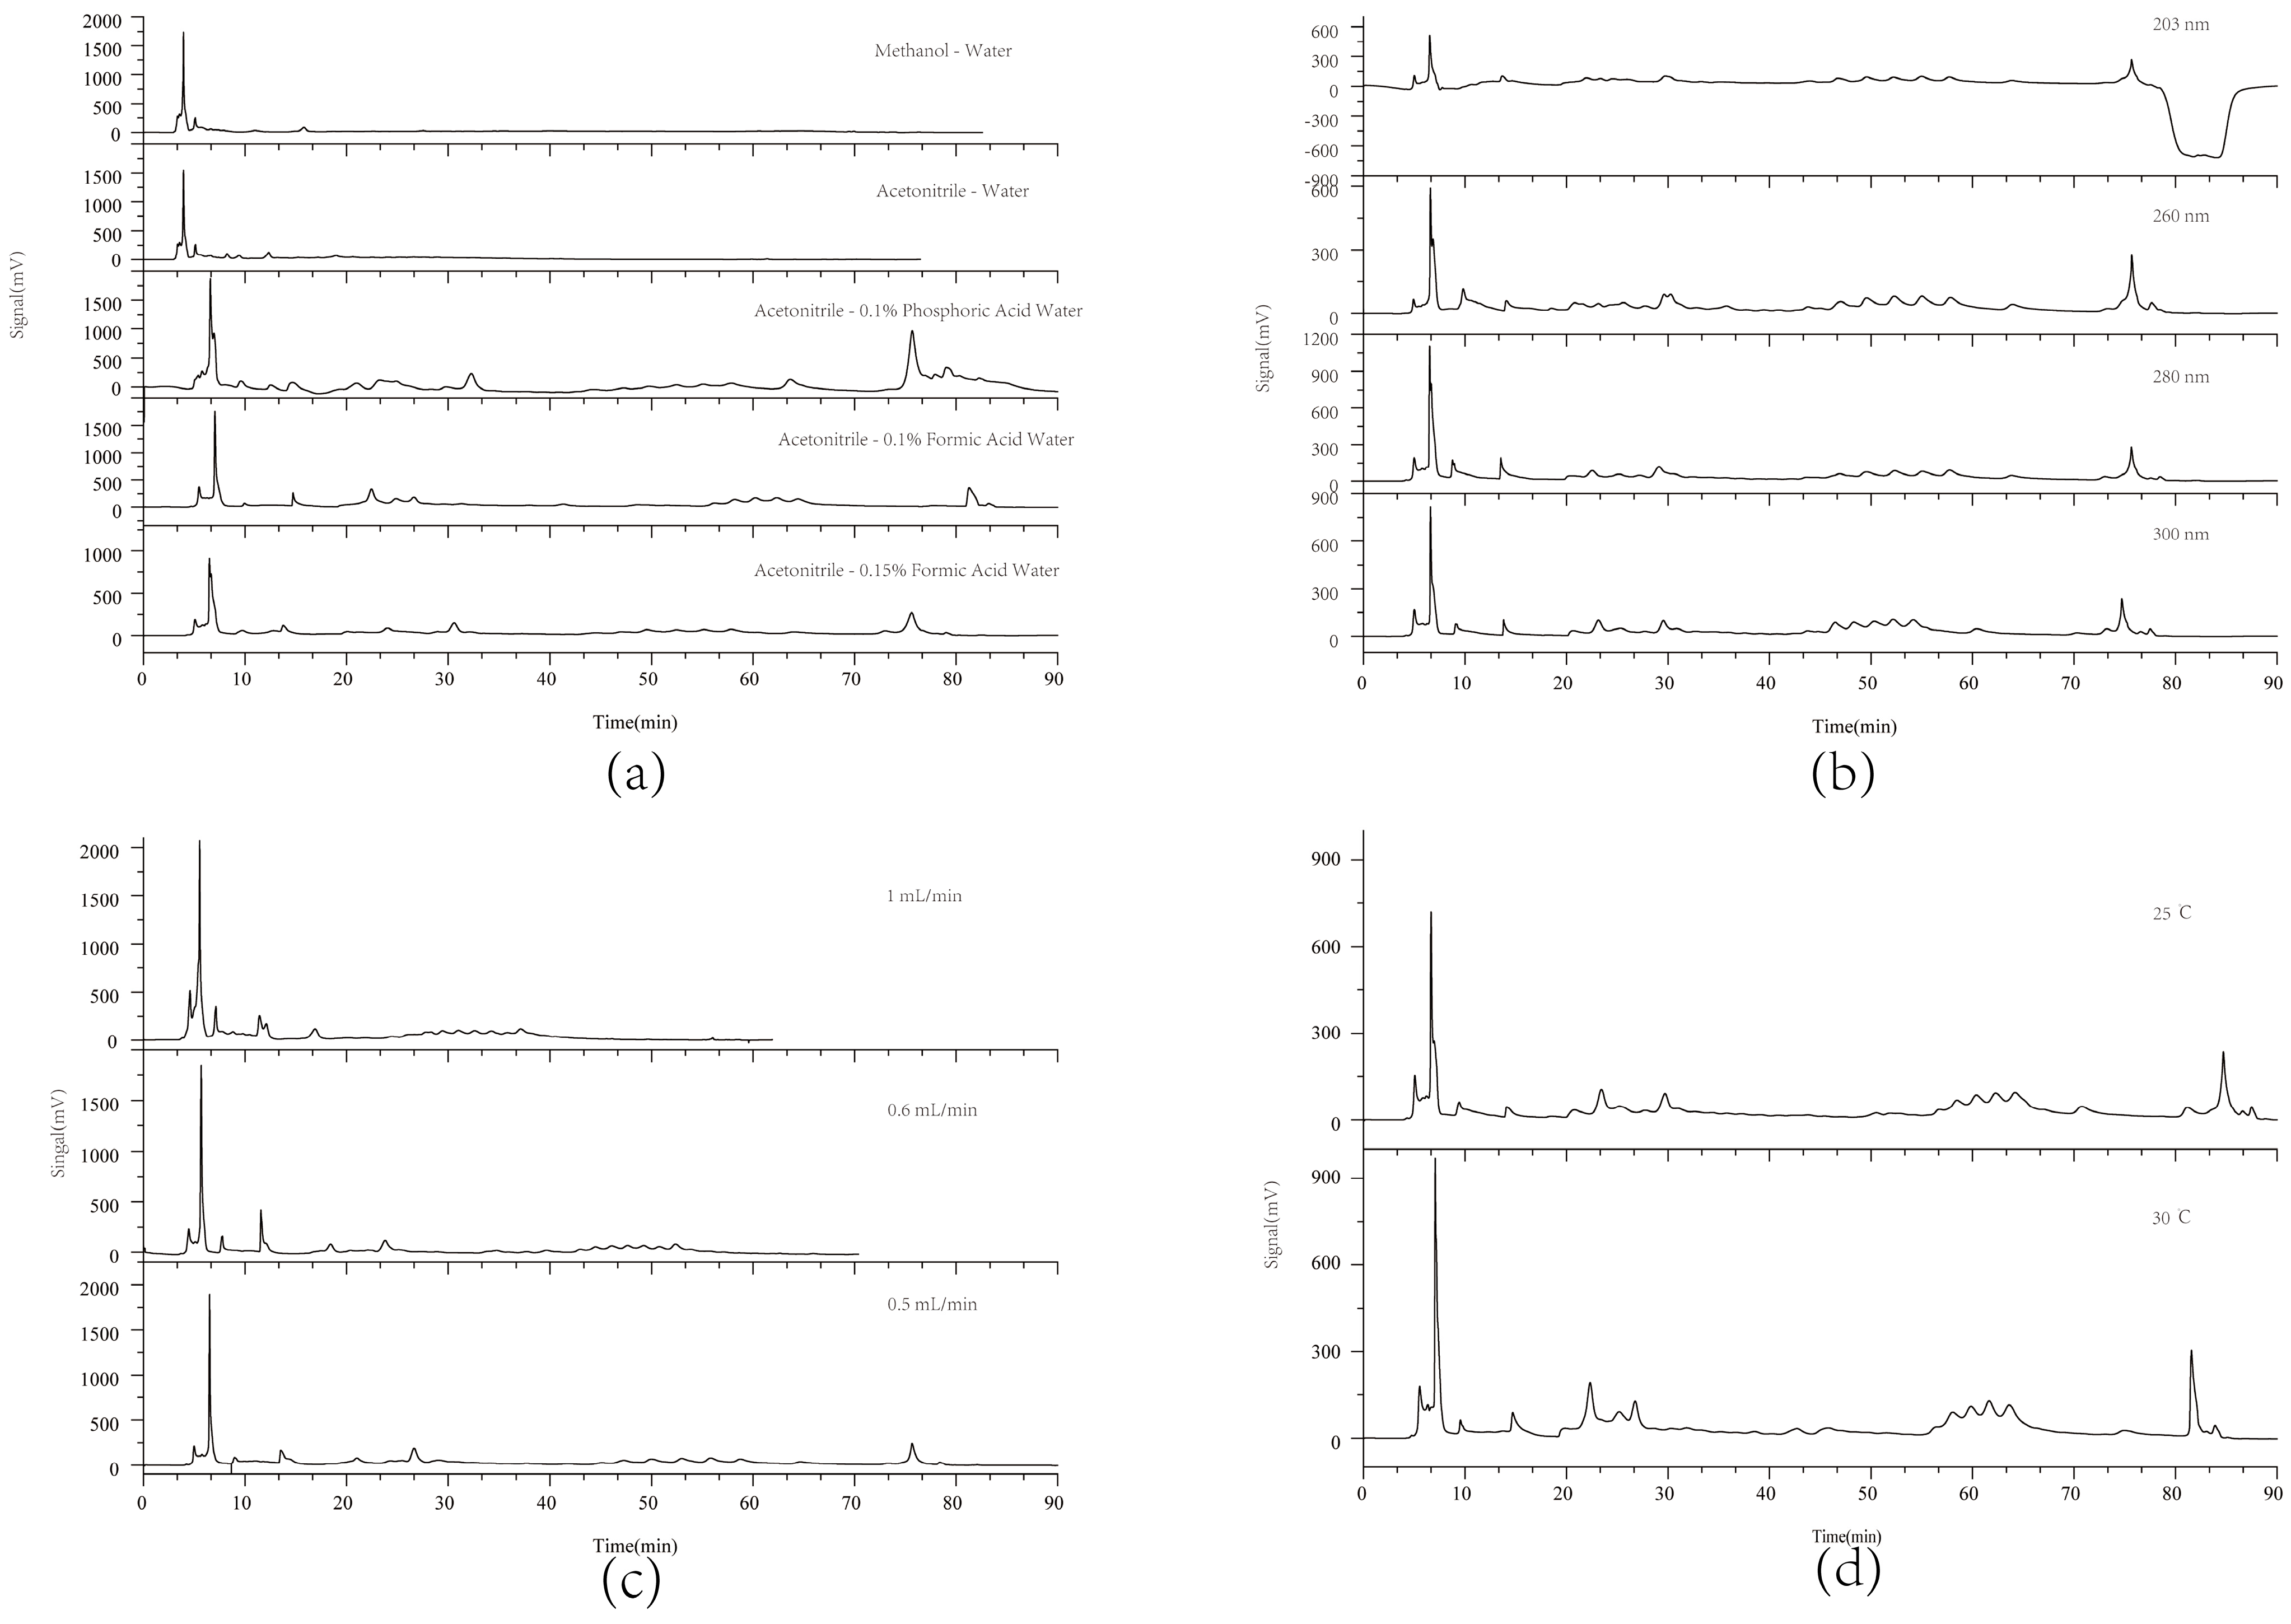
According to the relevant literature [23,24], the chromatographic conditions were optimized, including the mobile phase composition, flow rates, detection wavelength, and column temperature, as illustrated in Figure 1. Studies indicated that acetonitrile as the organic phase yielded improved chromatographic performance with more detectable peaks (Figure 1a). Among the additives tested, 0.1% formic acid provided the best baseline stability and peak separation. For detection wavelengths, 280 nm offered more detectable peaks and smoother baselines (Figure 1b). Better peak separation was achieved at a flow rate of 0.5 mL/min (Figure 1c) and a column temperature of 25 °C (Figure 1d). The elution condition was finalized through repeated experiments.
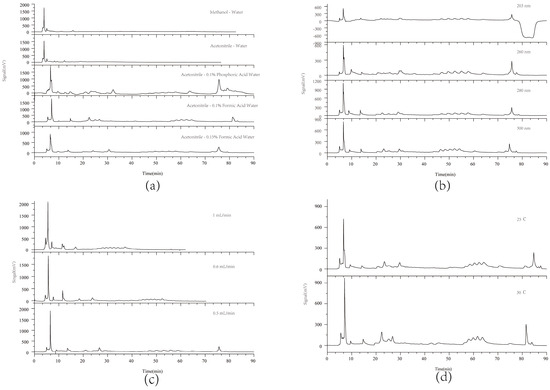
Figure 1.
HPLC chromatograms of wine-processed P. sibiricum under different separation conditions. (a) Study of mobile phase compositions including acetonitrile, methanol, and formic acid water; (b) Investigation of wavelengths at 203, 260, 280, and 300 nm; (c) Examination of flow rates at 1.0, 0.6, and 0.5 mL/min; and (d) Evaluation of column temperatures at 25 °C and 30 °C.
3.1.2. Results of Analytical Method Validation
The precision study of wine-processed P. sibiricum samples revealed that the RSD of the RRt for common peaks was ≤2.14% and that of the RPA was ≤2.67%. In the reproducibility study, the RSD of the RRt and RPA were ≤1.55% and 1.69%, respectively. The stability study showed that the RSD of the RRt and RPA were ≤1.66% and 1.94% respectively. In the above validation studies, the RSD of both RRt and RPA of the common peaks were less than 3.00%, which confirmed the method’s reliability for establishing the fingerprints of wine-processed P. sibiricum. The specific RSD values for the methodological validation are detailed in Supplementary Material Table S1.
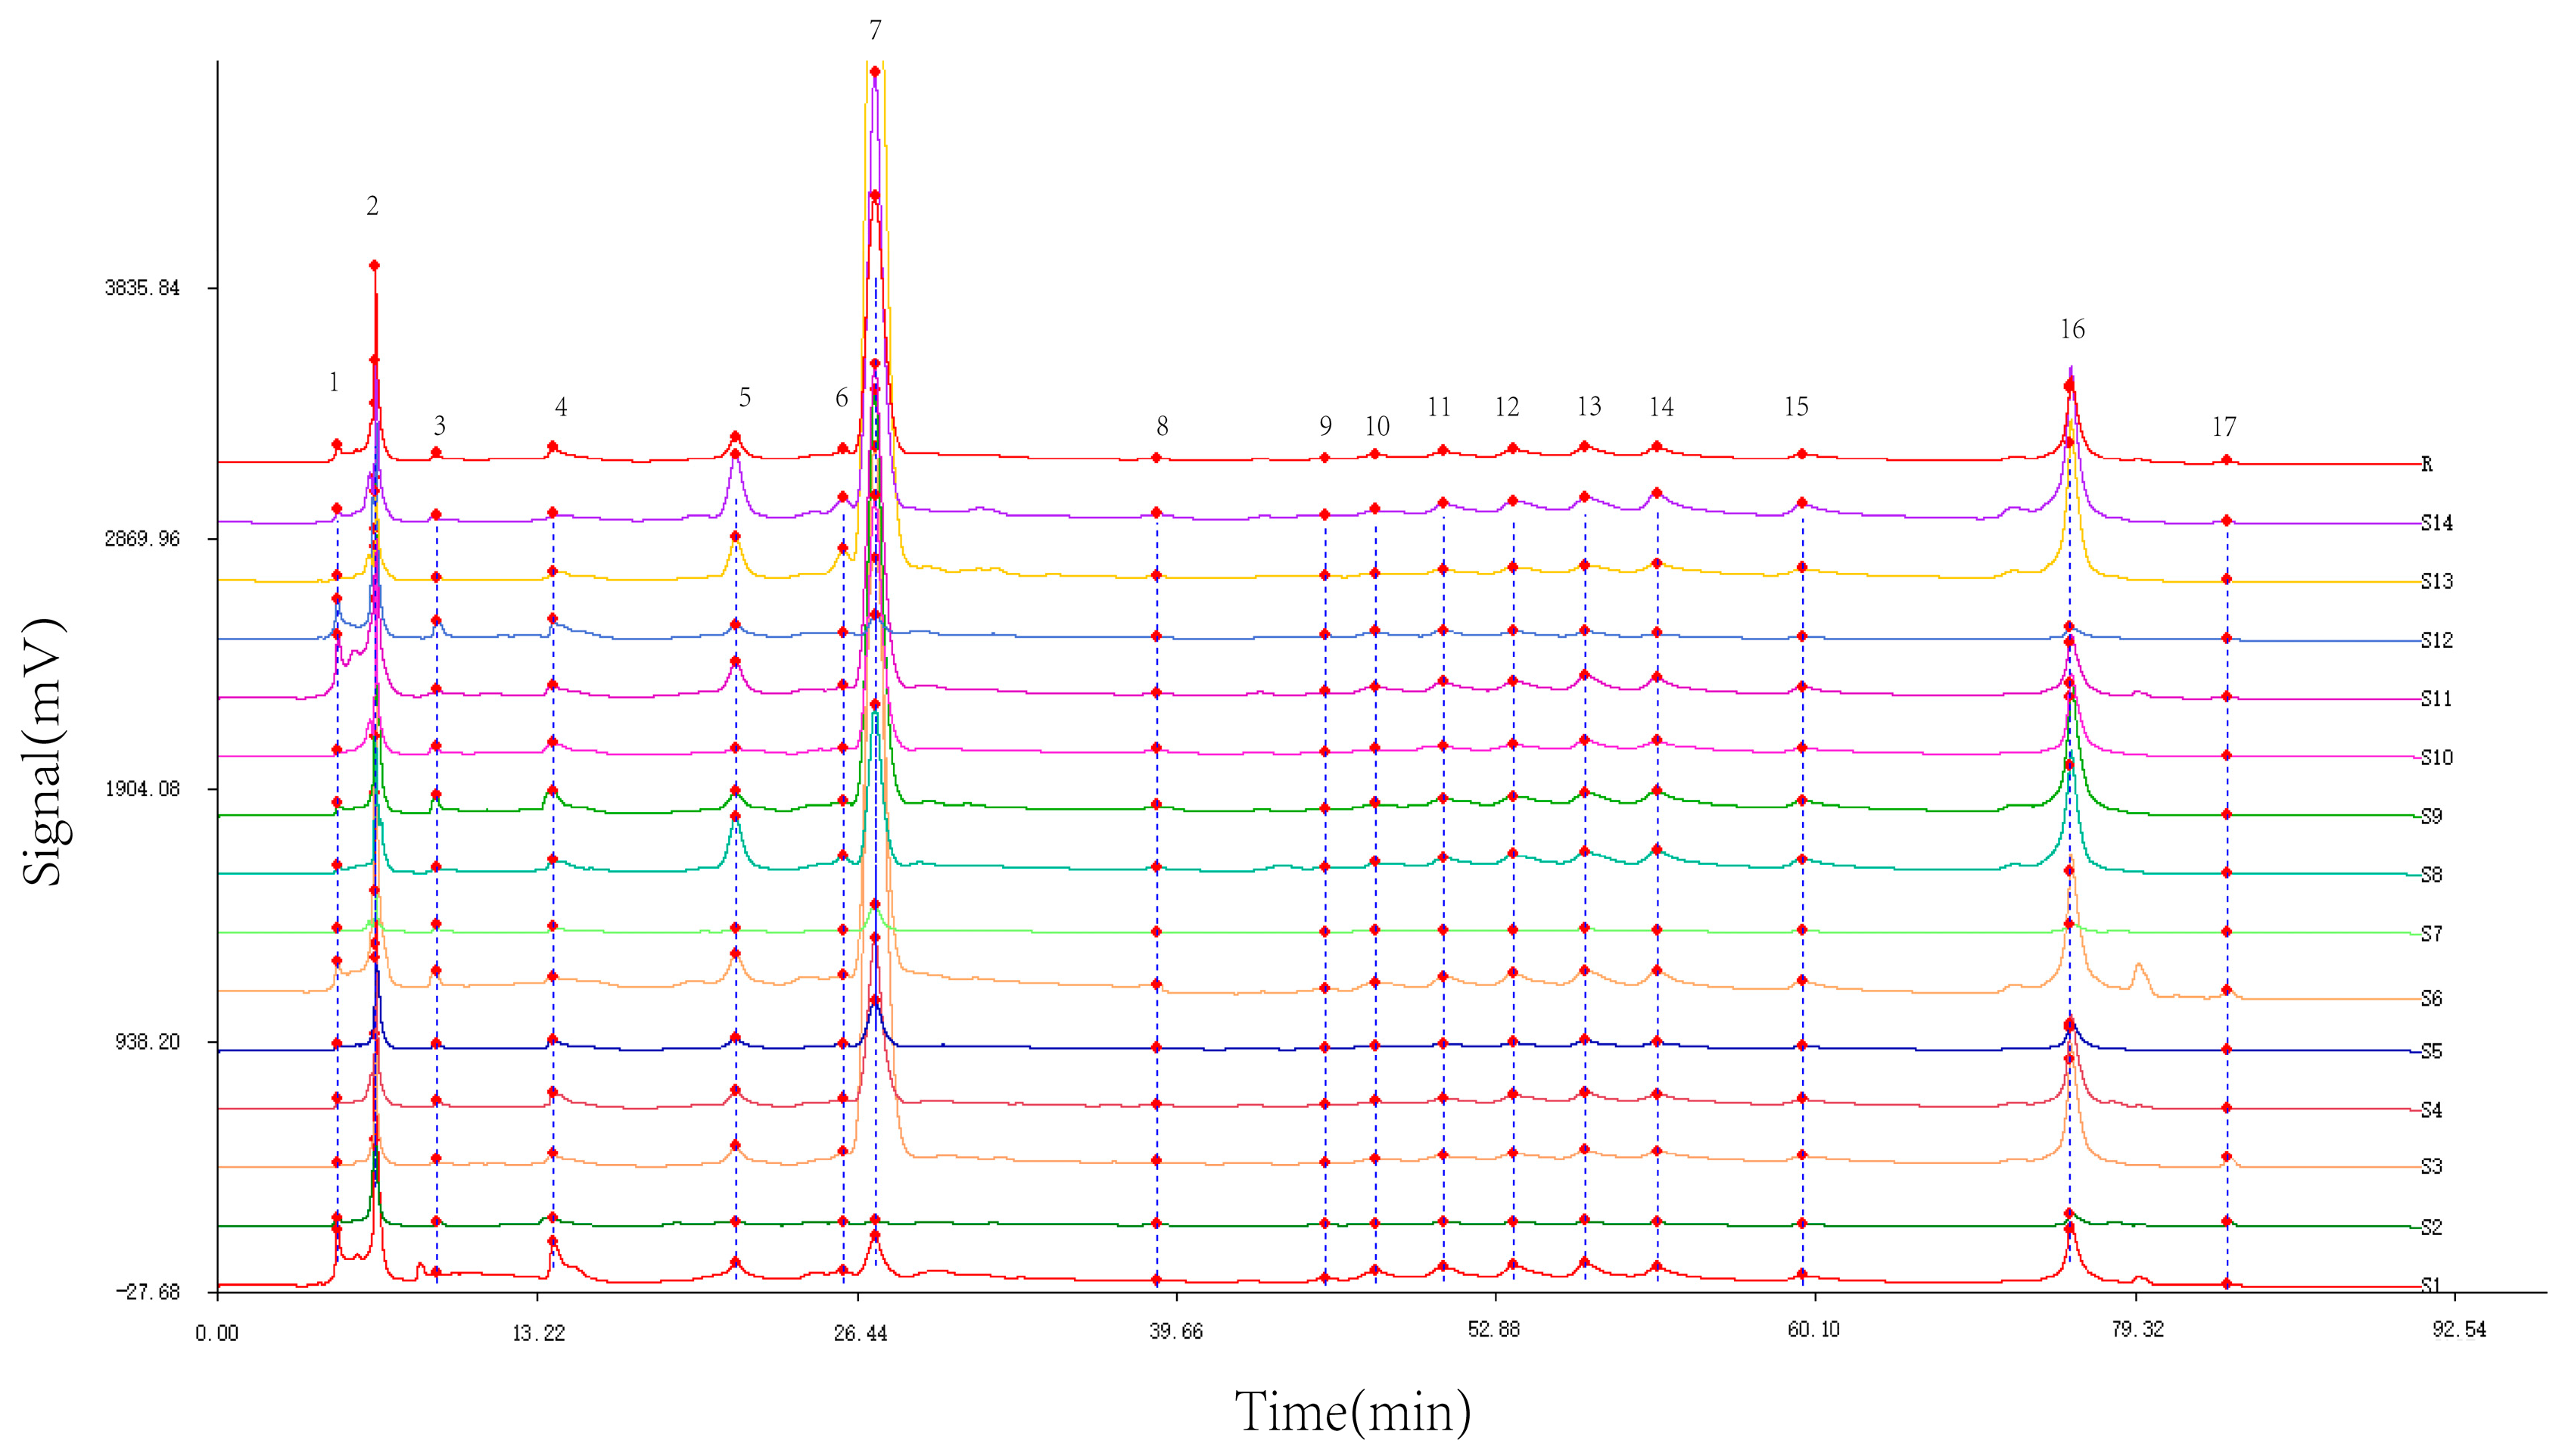
3.1.3. Establishment of the Fingerprint and Identification of Common Peaks of Wine-Processed P. sibiricum
Utilizing the TCM Chromatographic Fingerprint Similarity Evaluation System 2004.A version software, we analyzed HPLC chromatograms of 14 batches of wine-processed P. sibiricum sourced from different regions. The chromatogram of batch S8 was used as the reference standard. We employed the average method with a time window width of 0.1 min and applied multiple-point correction to generate the superimposed HPLC fingerprint (Figure 2), which revealed 17 common peaks. By comparing the common peak superimposed HPLC fingerprint with a mixed reference standard (Figure 3), the peaks were identified as follows: Peak 2 as malic acid, Peak 5 as adenosine, Peak 7 as 5-HMF, Peak 12 as chlorogenic acid, Peak 13 as vanillic acid, Peak 14 as caffeic acid, Peak 15 as p-hydroxycinnamic acid, and Peak 16 as myricetin.
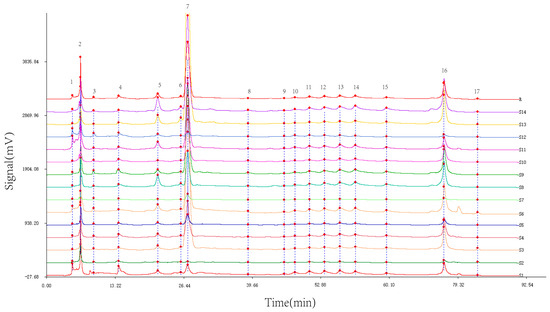
Figure 2.
Superimposed HPLC fingerprint of wine-processed P. sibiricum. (1–17 are the numbers of common peak).
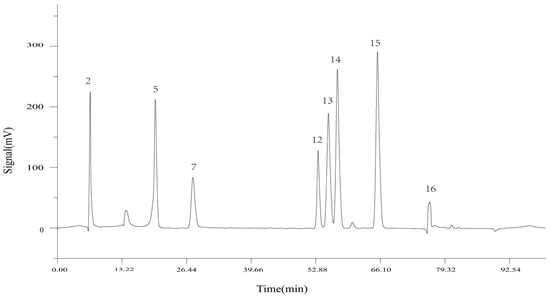
Figure 3.
HPLC fingerprint of mixed standards (2: DL-malic acid, 5: adenosine, 7: 5-HMF, 12: chlorogenic acid, 13: vanillic acid, 14: caffeic acid, 15: p-hydroxycinnamic acid, 16: myricetin).
3.2. Similarity Evaluation
The similarity results of 14 different regions of wine-processed P. sibiricum, as analyzed in the Chinese Medicine Chromatographic Fingerprint Evaluation System software version 2004.A, are shown in Figure 4. The similarity indices for batches S3–S11, S13, and S14 exceeded 0.89, indicating high similarity. In contrast, the indices for batches S1, S2, and S12 were 0.558, 0.311, and 0.402, respectively, suggesting that the chemical constituents or contents of these batches differed notably from the control. S1 and S12 were from Hunan, and S2 from Guizhou. This variability suggests chemical composition and content differences among wine-processed P. sibiricum samples from different sources. The origin of the samples and the preparation process may contribute to these differences.
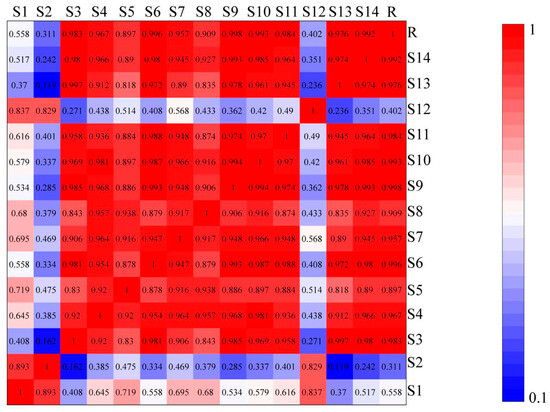
Figure 4.
Results of the similarity evaluation of wine-processed P. sibiricum. Note: Red indicates higher similarity and blue indicates lower similarity.
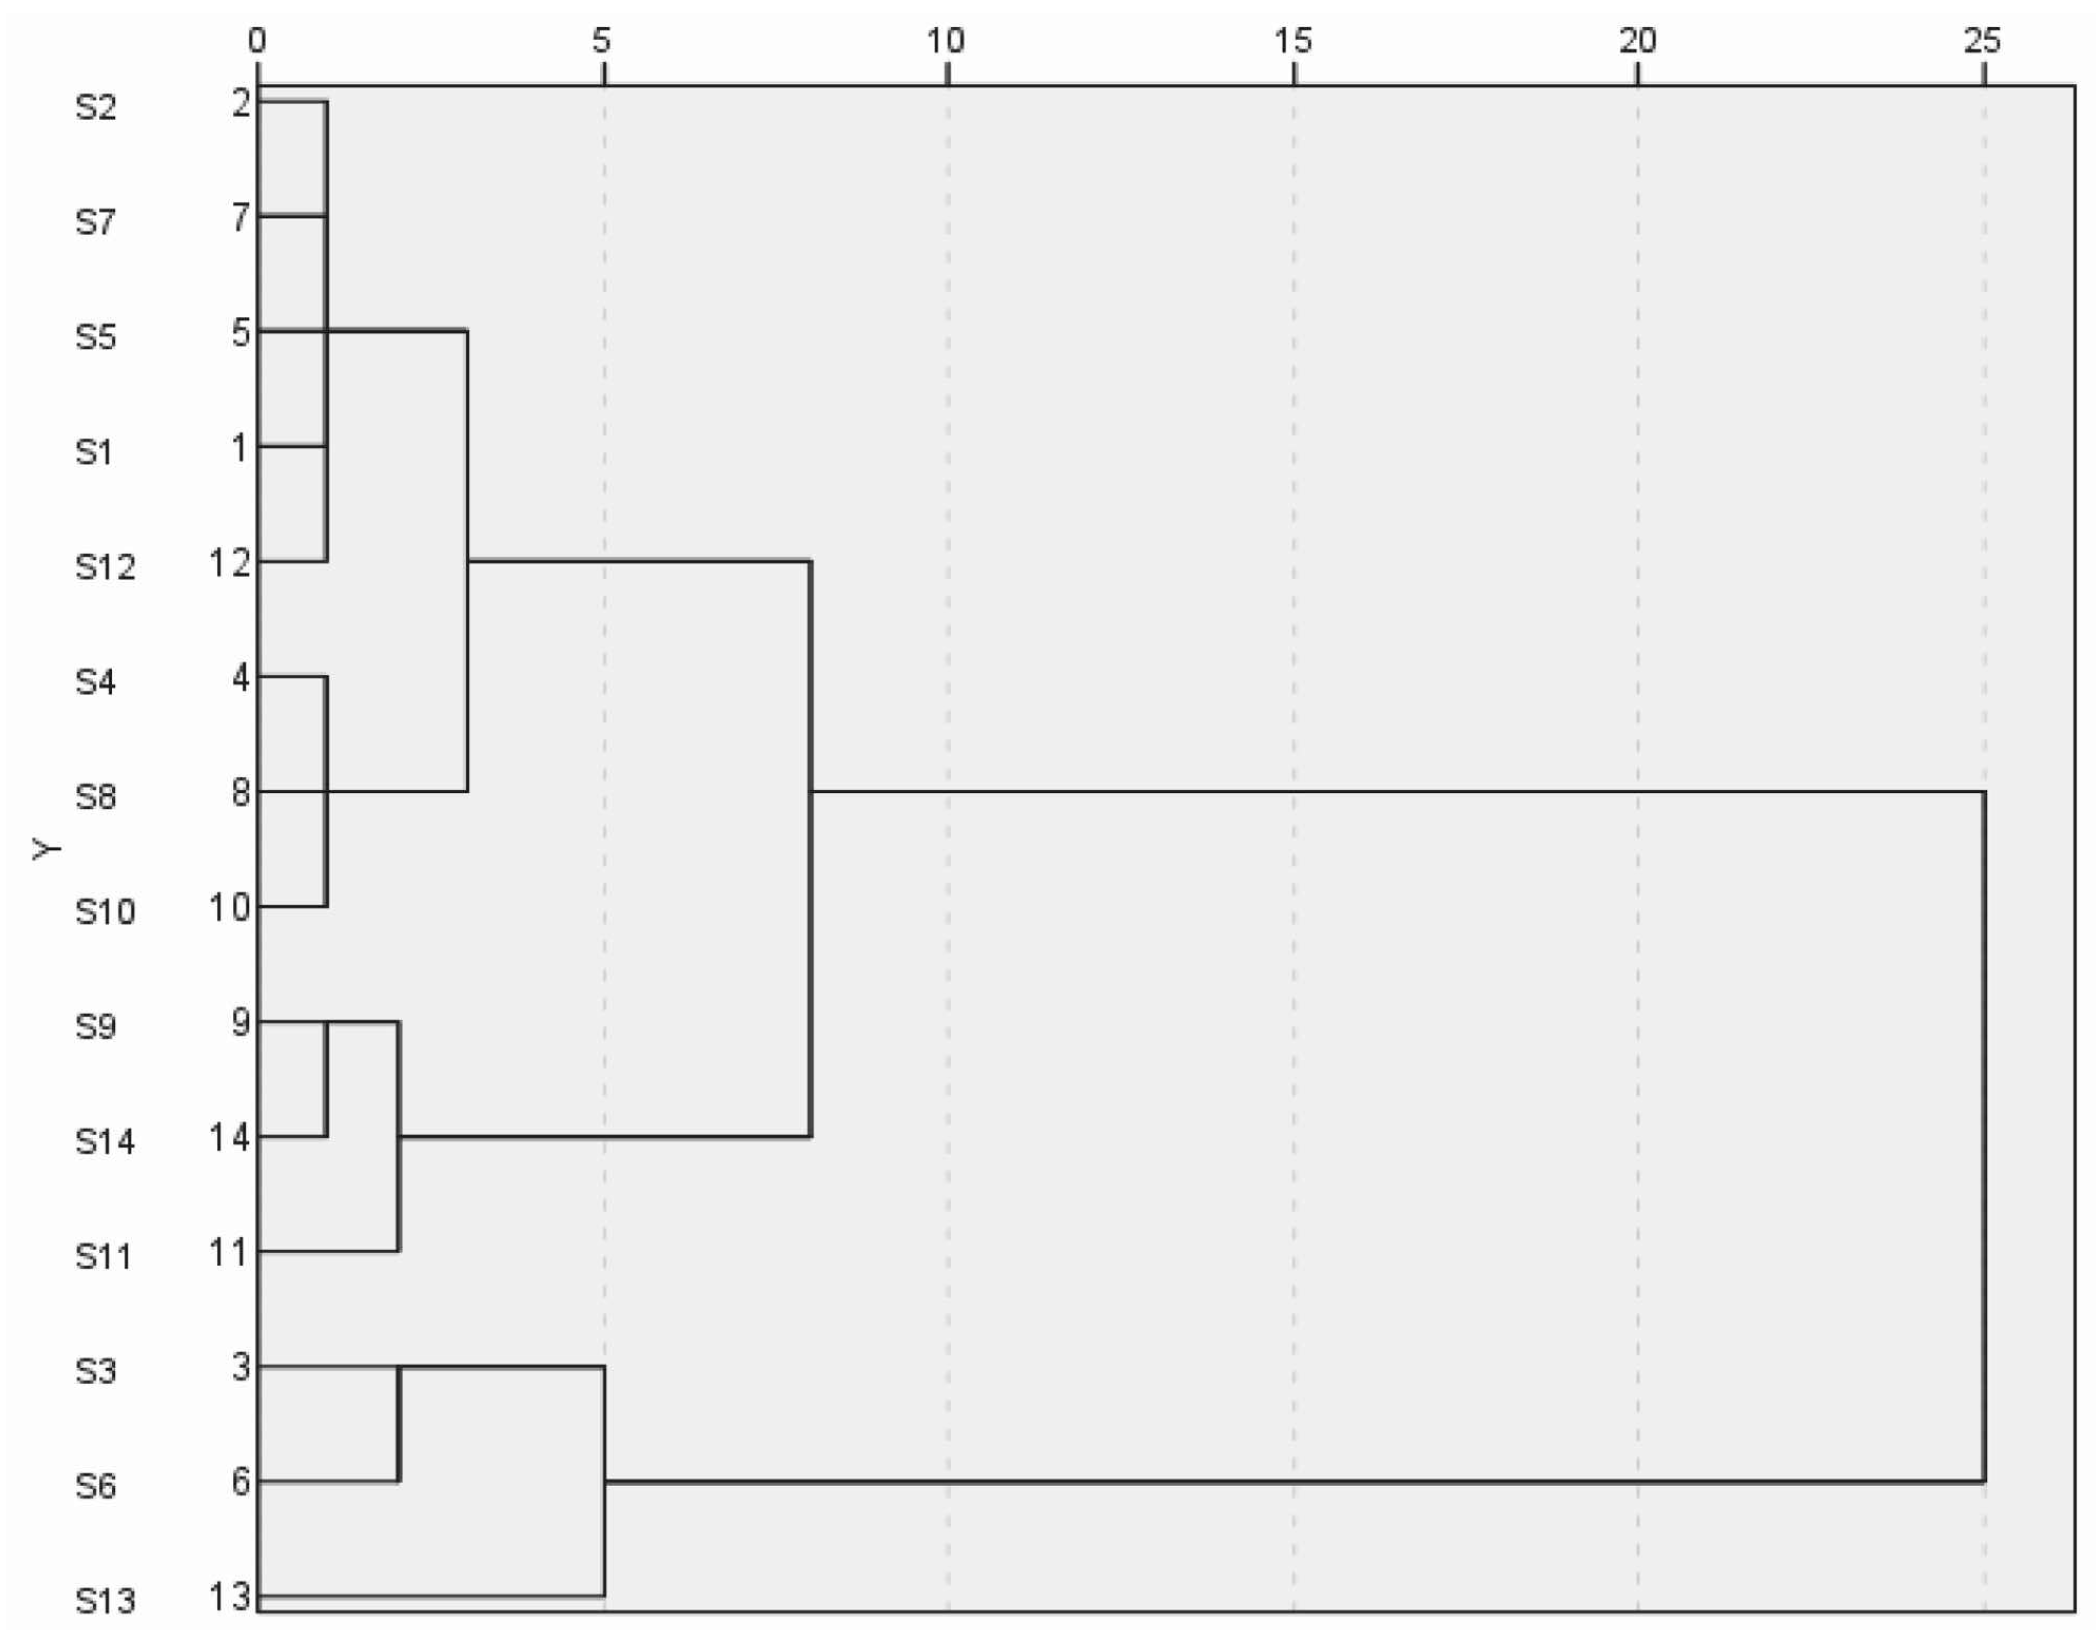
3.2.1. Hierarchical Cluster Analysis (HCA) Results
The common peak areas of 14 batches of wine-processed P. sibiricum were imported into SPSS 27.0 software for cluster analysis. This analysis was conducted using squared Euclidean distance with the inter-group linkage method. The results are shown in Figure 5. The cluster analysis revealed that at the Euclidean spacing of 6, the 14 batches of wine-processed P. sibiricum extracts could be categorized into three major groups. Specifically, batches S1, S2, S4, S5, S7, S8, S6, S10, and S12 were clustered into the first category, batches S3, S6, and S13 into the second group, and batches S7, S11, and S14 into the third group. When the Euclidean distance was set to 10, all products from Guizhou were grouped. The cluster analysis helps differentiate the origins of wine-processed P. sibiricum based on variations in quality.
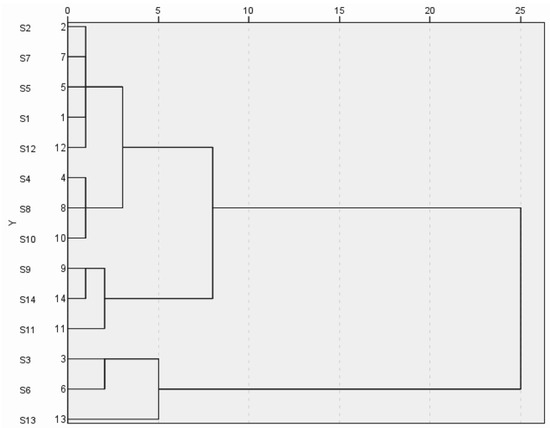
Figure 5.
Hierarchical cluster analysis of the wine-processed P. sibiricum.
3.2.2. Principal Component Analysis (PCA) Results
The eigenvalues and contribution rates in Table 3 indicated that five principal components were extracted based on the criterion of eigenvalues > 1 [25]. These components accounted for variance contributions of 41.379%, 23.261%, 9.640%, 8.217%, and 7.702%, resulting in a cumulative rate of 90.200%. These components represent the quality assessment indices of wine-processed P. sibiricum.
Table 3.
Eigenvalues and contribution of principal component analysis.
The component matrix is presented in Table 4. By applying a criterion of factor loading greater than 0.5, we identified the following relationship: principal component 1 is associated with Peaks 2, 5 to 7, and 9 to 16. Component 2 is linked to Peaks 1 to 4. While Component 3 corresponds to Peak 7, Component 5 is influenced by Peak 8. Component 4 has no peaks exceeding this threshold. The results indicated that the contribution of different common peaks to the quality of wine-processed P. sibiricum is different, and the common peaks related to principal component 1 are the primary influence factors in the quality of wine-processed P. sibiricum.
Table 4.
Principal component loading matrix.
Principal component score and comprehensive score analysis: Through SPSS 27.0 analysis of variance contribution rates and component matrices, the peak areas of the common peaks from 14 batches of wine-processed P. sibiricum were standardized. Using the variance contribution rates of each principal component as the allocation coefficients, we calculated the scores for each principal component and comprehensive scores of 14 batches of wine-processed P. sibiricum and ranked them. The higher the scores of a sample, the better the indicated quality of the samples.
The results, as shown in Table 5, revealed the ranking of the comprehensive scores of the principal components as follows: S6, S1, S3, S11, S14, S9, S8, S10, S12, S13, S4, S5, S2, and S7. This ranking suggested that the components common to wine-processed P. sibiricum were influenced by the specific environmental conditions of their geographical origin, leading to significant variations among the samples.
Table 5.
Principal component scores and comprehensive scores of wine-processed P. sibiricum.
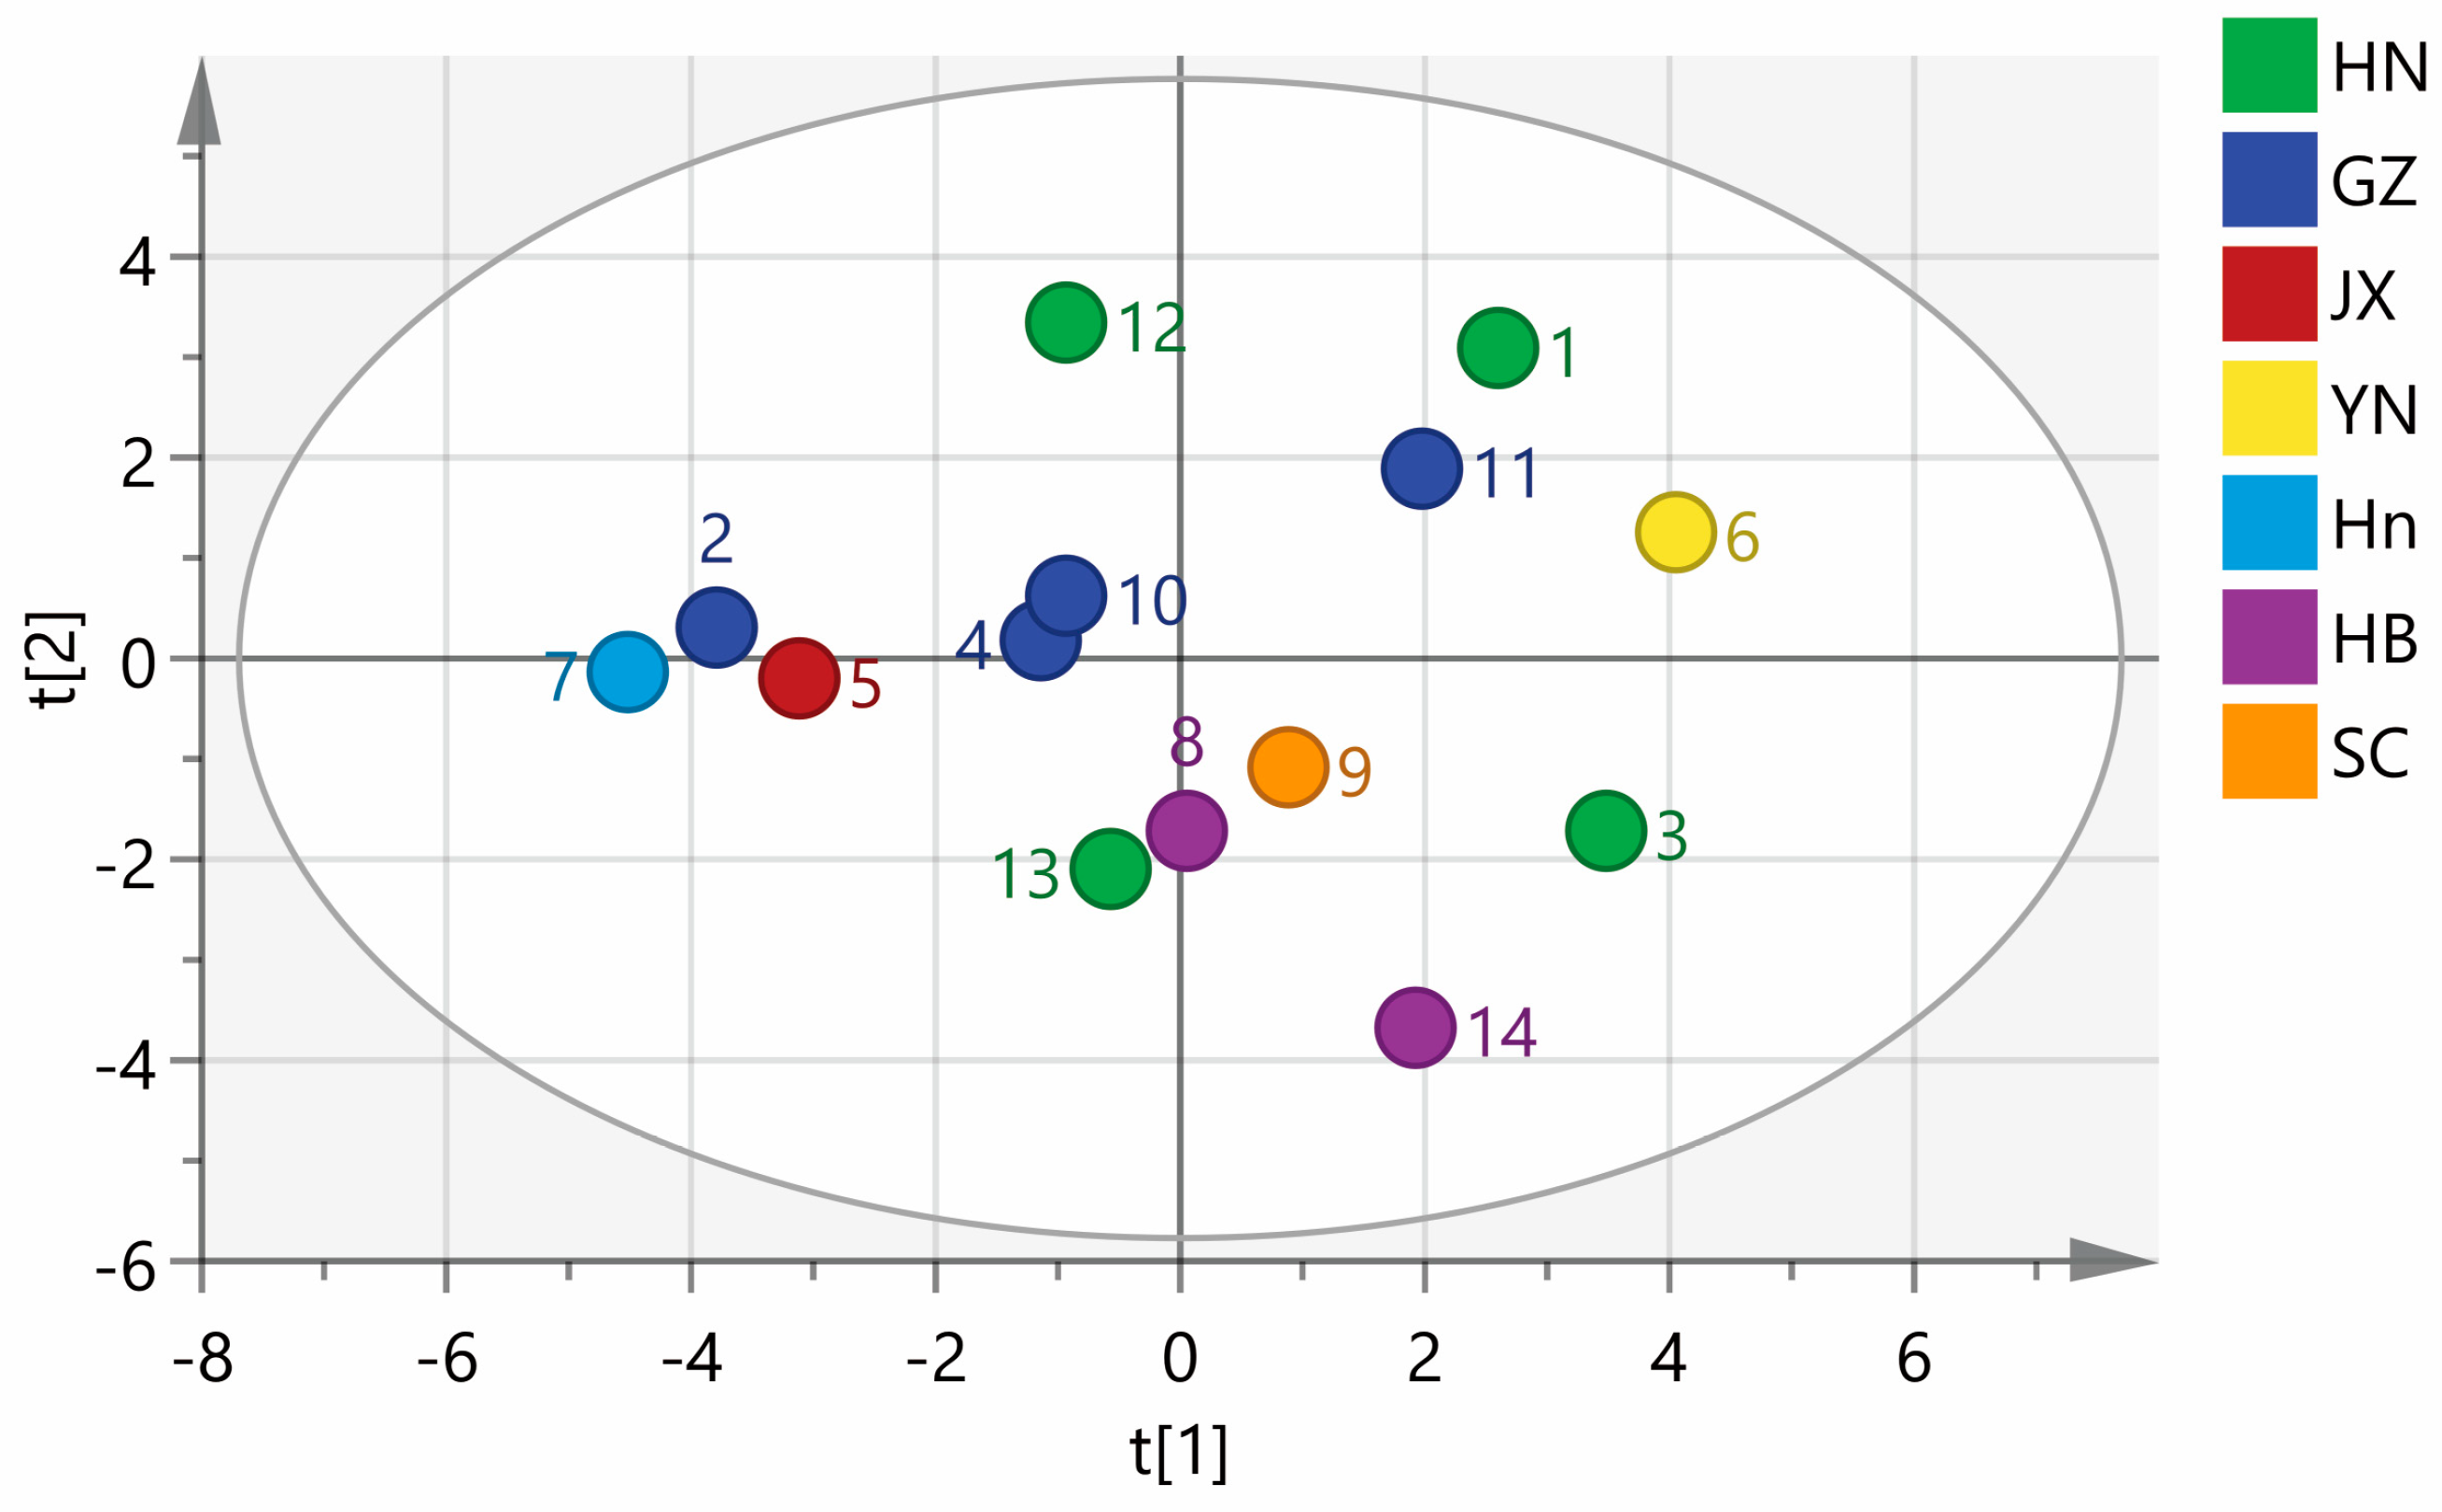
SIMCA 14.1 software was used to perform a PCA analysis of 14 batches of wine-processed P. sibiricum. A PCA matrix of size 14 × 17 was created, with the areas of 17 common peaks in the fingerprints serving as variables. This matrix was employed to plot the PCA scores for 14 batches of wine-processed P. sibiricum from various regions. As shown in Figure 6, the samples are categorized into three groups: the first group includes samples S1, S6, and S11; the second group comprises S2, S4, S5, S7, S8, S10, S12, and S13; and the third group consists of S3, S9, and S14. The rankings of the comprehensive scores were consistent with those derived from the PCA conducted using SPSS. The findings highlight the differences in quality among the wine-processed P. sibiricum from different regions. Notably, even within the same region, there are variations in quality, which may be influenced by different harvest seasons and processing conditions.

Figure 6.
Principal component analysis (PCA) of the wine-processed P. sibiricum. HN: Hunan; GZ: Guizhou; Hn: Henan; HB: Hebei; JX: Jiangxi; YN: Yunnan; SC: Sichuan.
3.2.3. Antioxidant Activity of Wine-Processed P. sibiricum
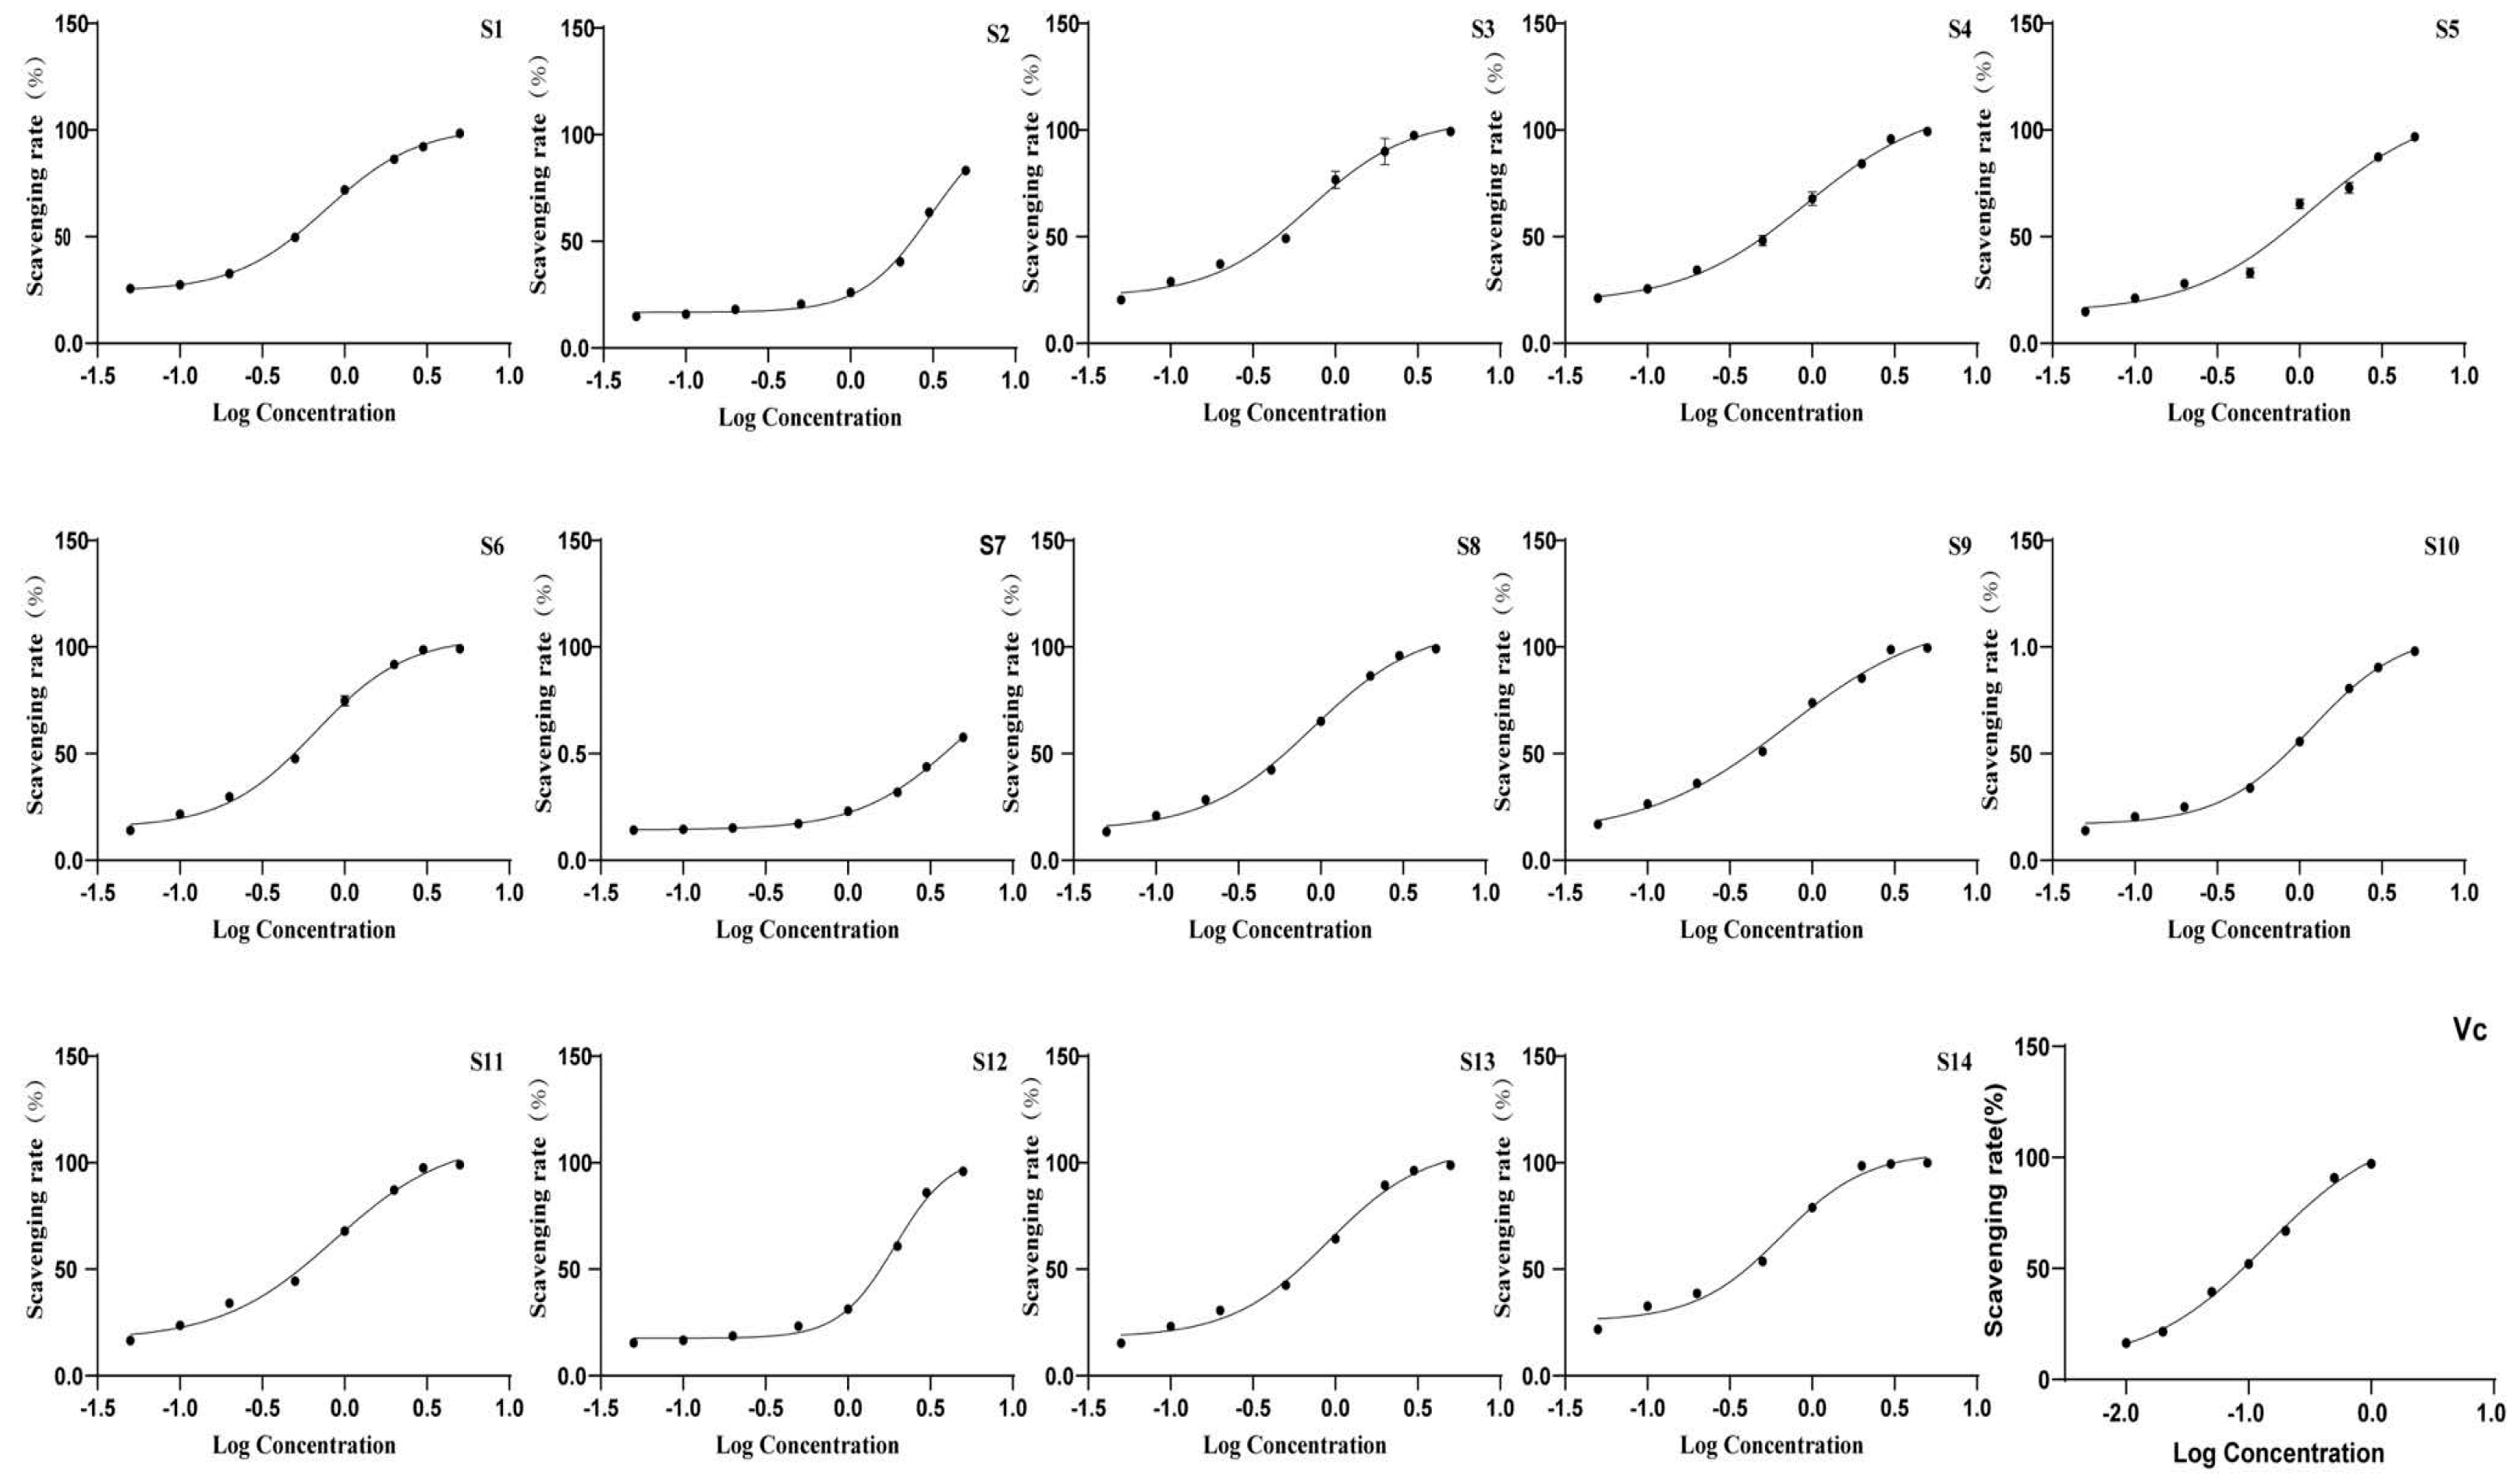
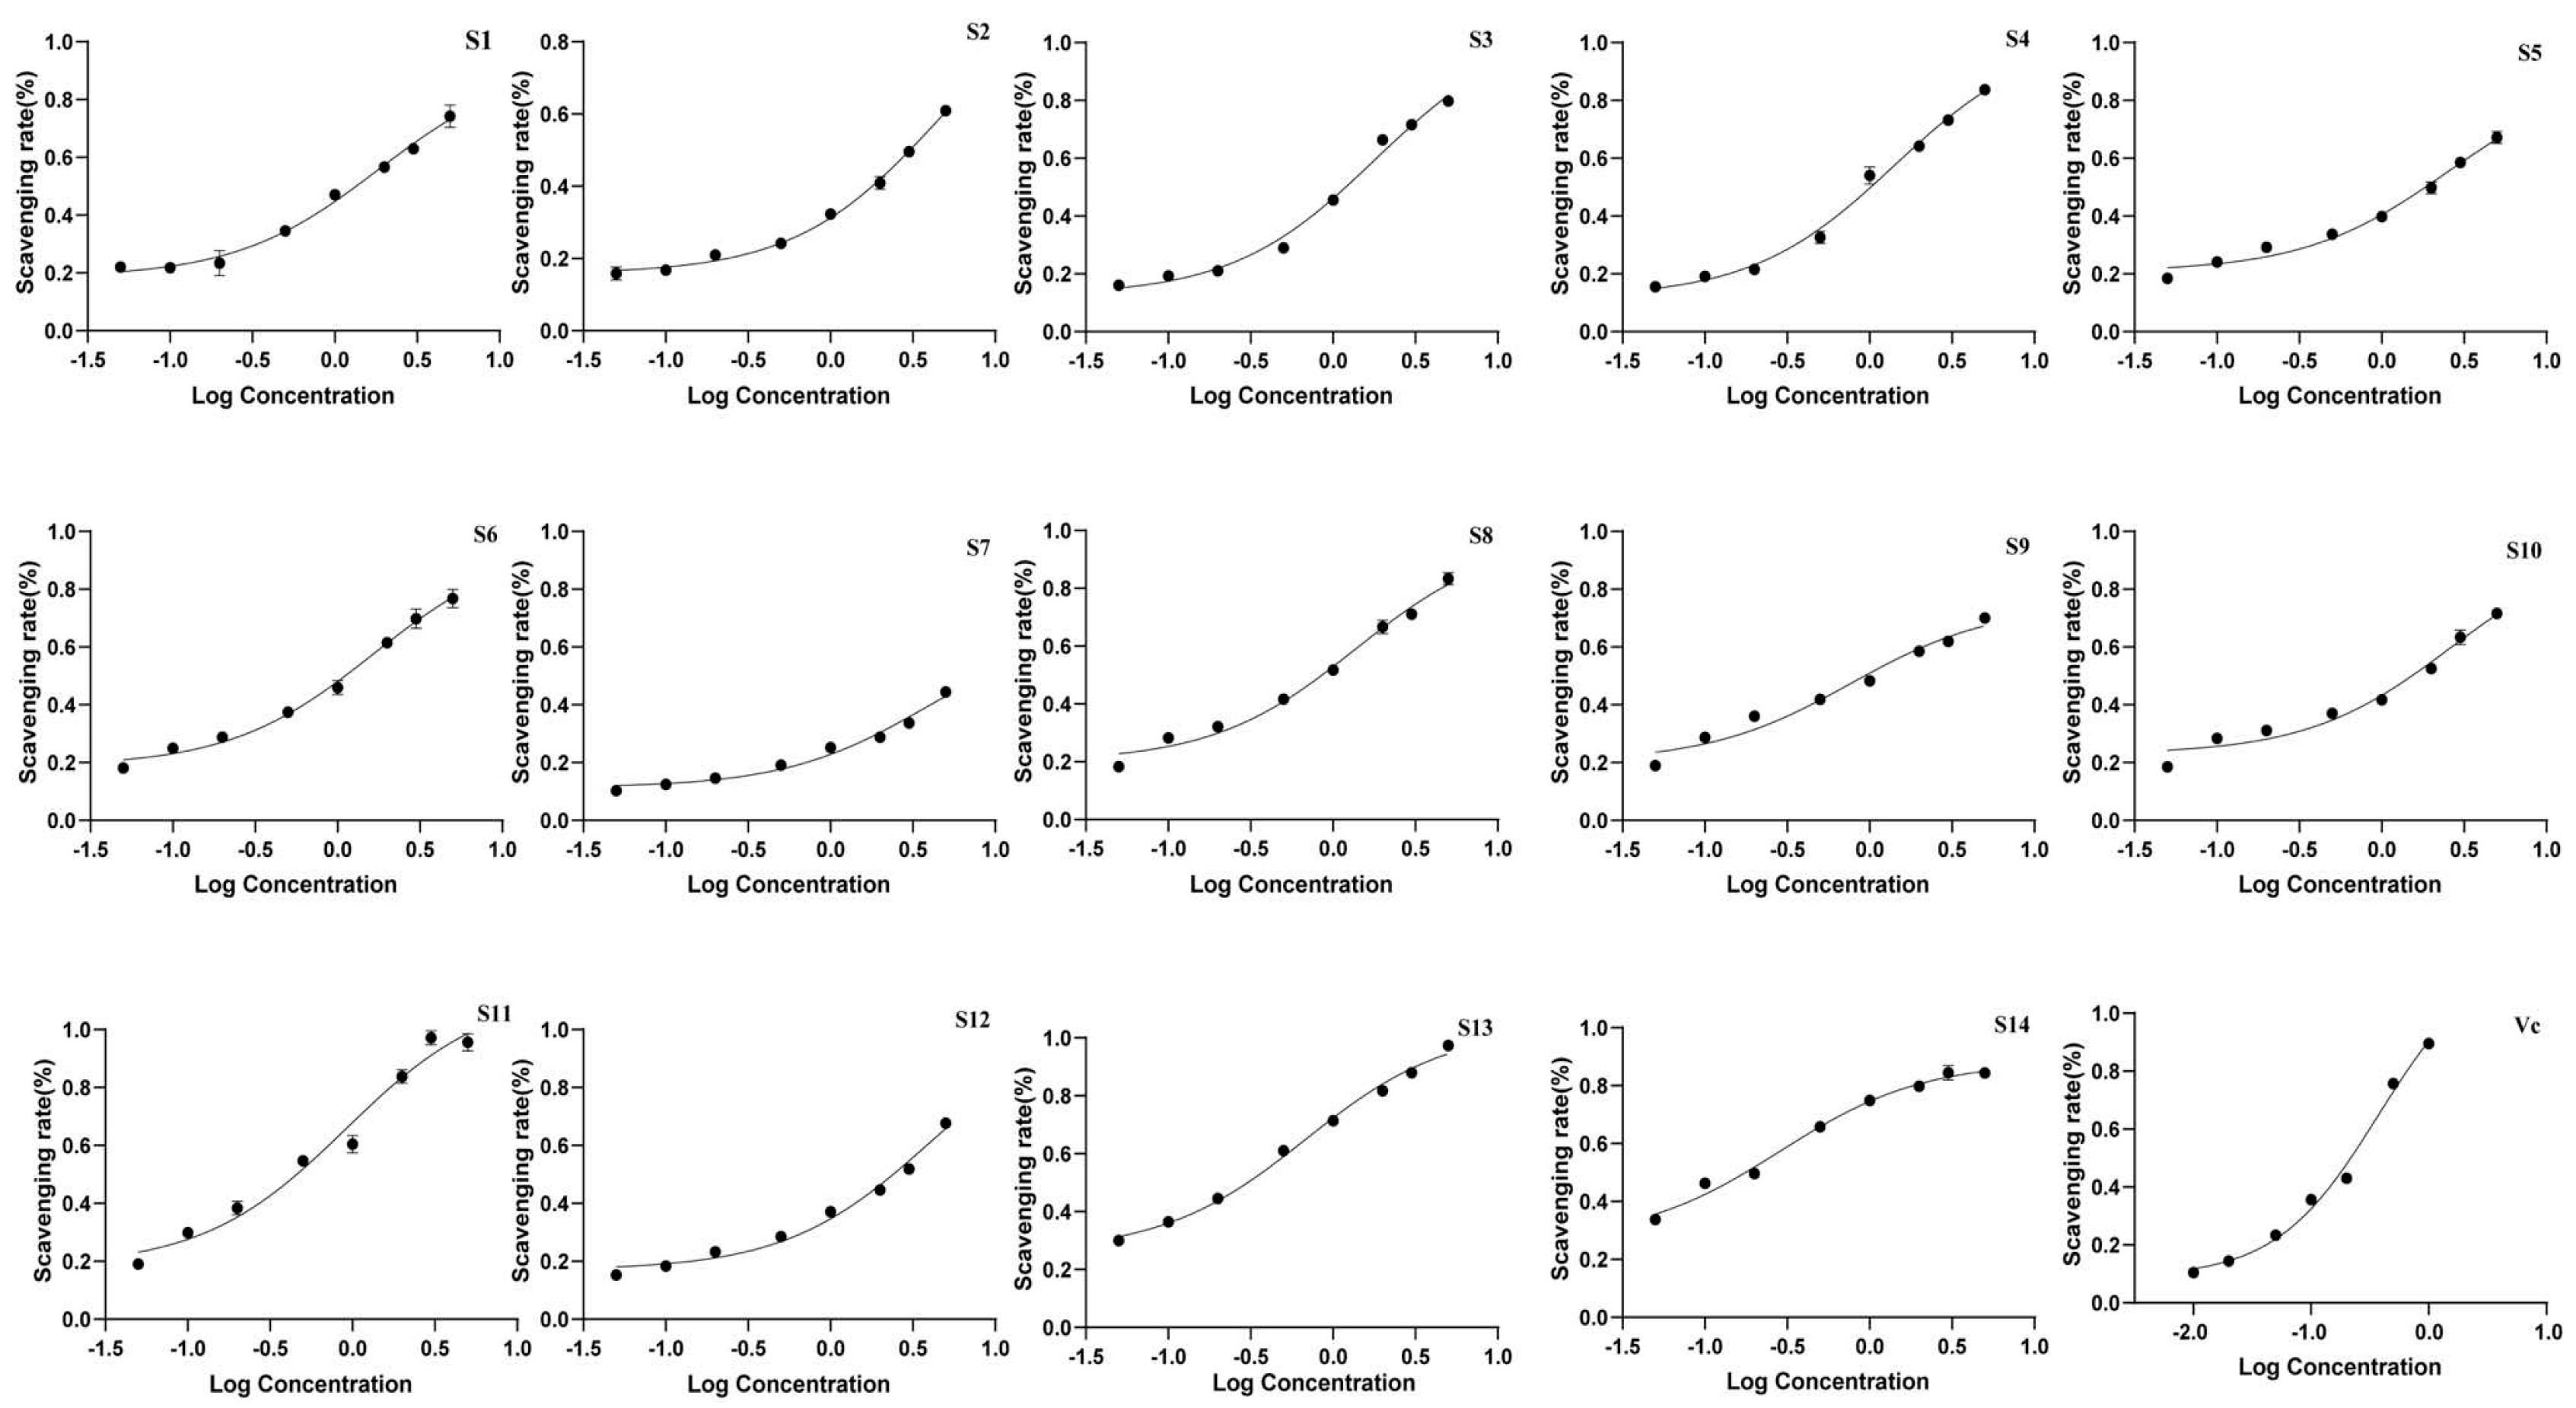
The antioxidant activity of the extracts was evaluated using DPPH and ABTS antioxidant assays, with the IC50 values presented in Table 6 and Figure 7 and Figure 8. All batches of wine-processed P. sibiricum extracts demonstrated antioxidant activities; however, the levels of these activities varied among the different batches. This variation suggested that although the chemical composition of each sample is similar, there may be significant differences in the content of specific compounds that influence the antioxidant activity. Additionally, the results obtained from the ABTS and DHHP assays were consistent in their overall trends.
Table 6.
Antioxidant activity of 14 batches of wine-processed P. sibiricum.
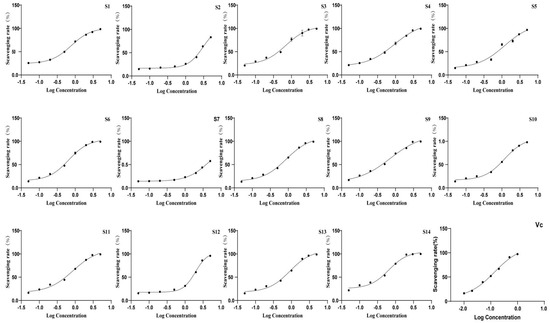
Figure 7.
The radical scavenging effects of 14 batches of wine-processed P. sibiricum on ABTS radicals.
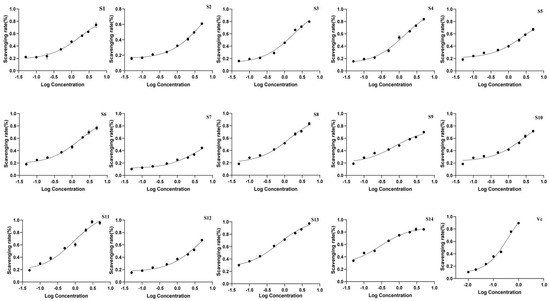
Figure 8.
The radical scavenging effects of 14 batches of wine-processed P. sibiricum on DPPH radicals.
3.3. Spectrum–Effect Relationship Research
3.3.1. Grey Relational Analysis (GRA)
The correlation results in Table 7 indicated that the chemical components represented by the peaks have varying degrees of influence on their antioxidant activities. A correlation closer to 1 signifies a more substantial effect of these components on antioxidant activity. The results of the ABTS assay are consistent with those from the DPPH assay. Notably, the correlations for all peaks, except for Peaks 1 and 17, exceed 0.7. This finding suggested that these 15 common peaks are likely highly correlated with antioxidant activities. Therefore, it can be concluded that the antioxidant effect of wine-processed P. sibiricum is the result of the synergistic action of its internal group of pharmacodynamic components.
Table 7.
Results of grey relational analysis.
3.3.2. Partial Least Squares (PLS) Regression Analysis
According to the PLS model, the regression equation were obtained as follows:
Y(ABTS) = −0.051516X1 + 0.037772X2 − 0.006503X3 + 0.023294X4 + 0.111036X5 + 0.115117X6 + 0.103518X7 + 0.069946X8 + 0.060870X9 + 0.049577X10 + 0.048769X11 + 0.128833X12 + 0.132695X13 + 0.139658X14 + 0.143111X15 + 0.150618X16 + 0.003207X17
Y(DPPH) = −0.023550X1 + 0.039765X2 − 0.040781X3 + 0.155193X4 + 0.073892X5 + 0.124159X6 − 0.003611X7 + 0.040935X8 + 0.001126X9 − 0.006570X10 + 0.082437X11 + 0.100406X12 + 0.146767X13 + 0.145227X15 + 0.150225X16 − 0.0494023X17
For the ABTS and DHHP methods, the model’s fitting parameters showed R2 values of 0.932 and 0.889, while the predictive parameters Q2 were 0.821 and 0.535, respectively. R2 and Q2 values greater than 0.5 indicated that the models exhibited a good fit, high stability, and prediction accuracy.
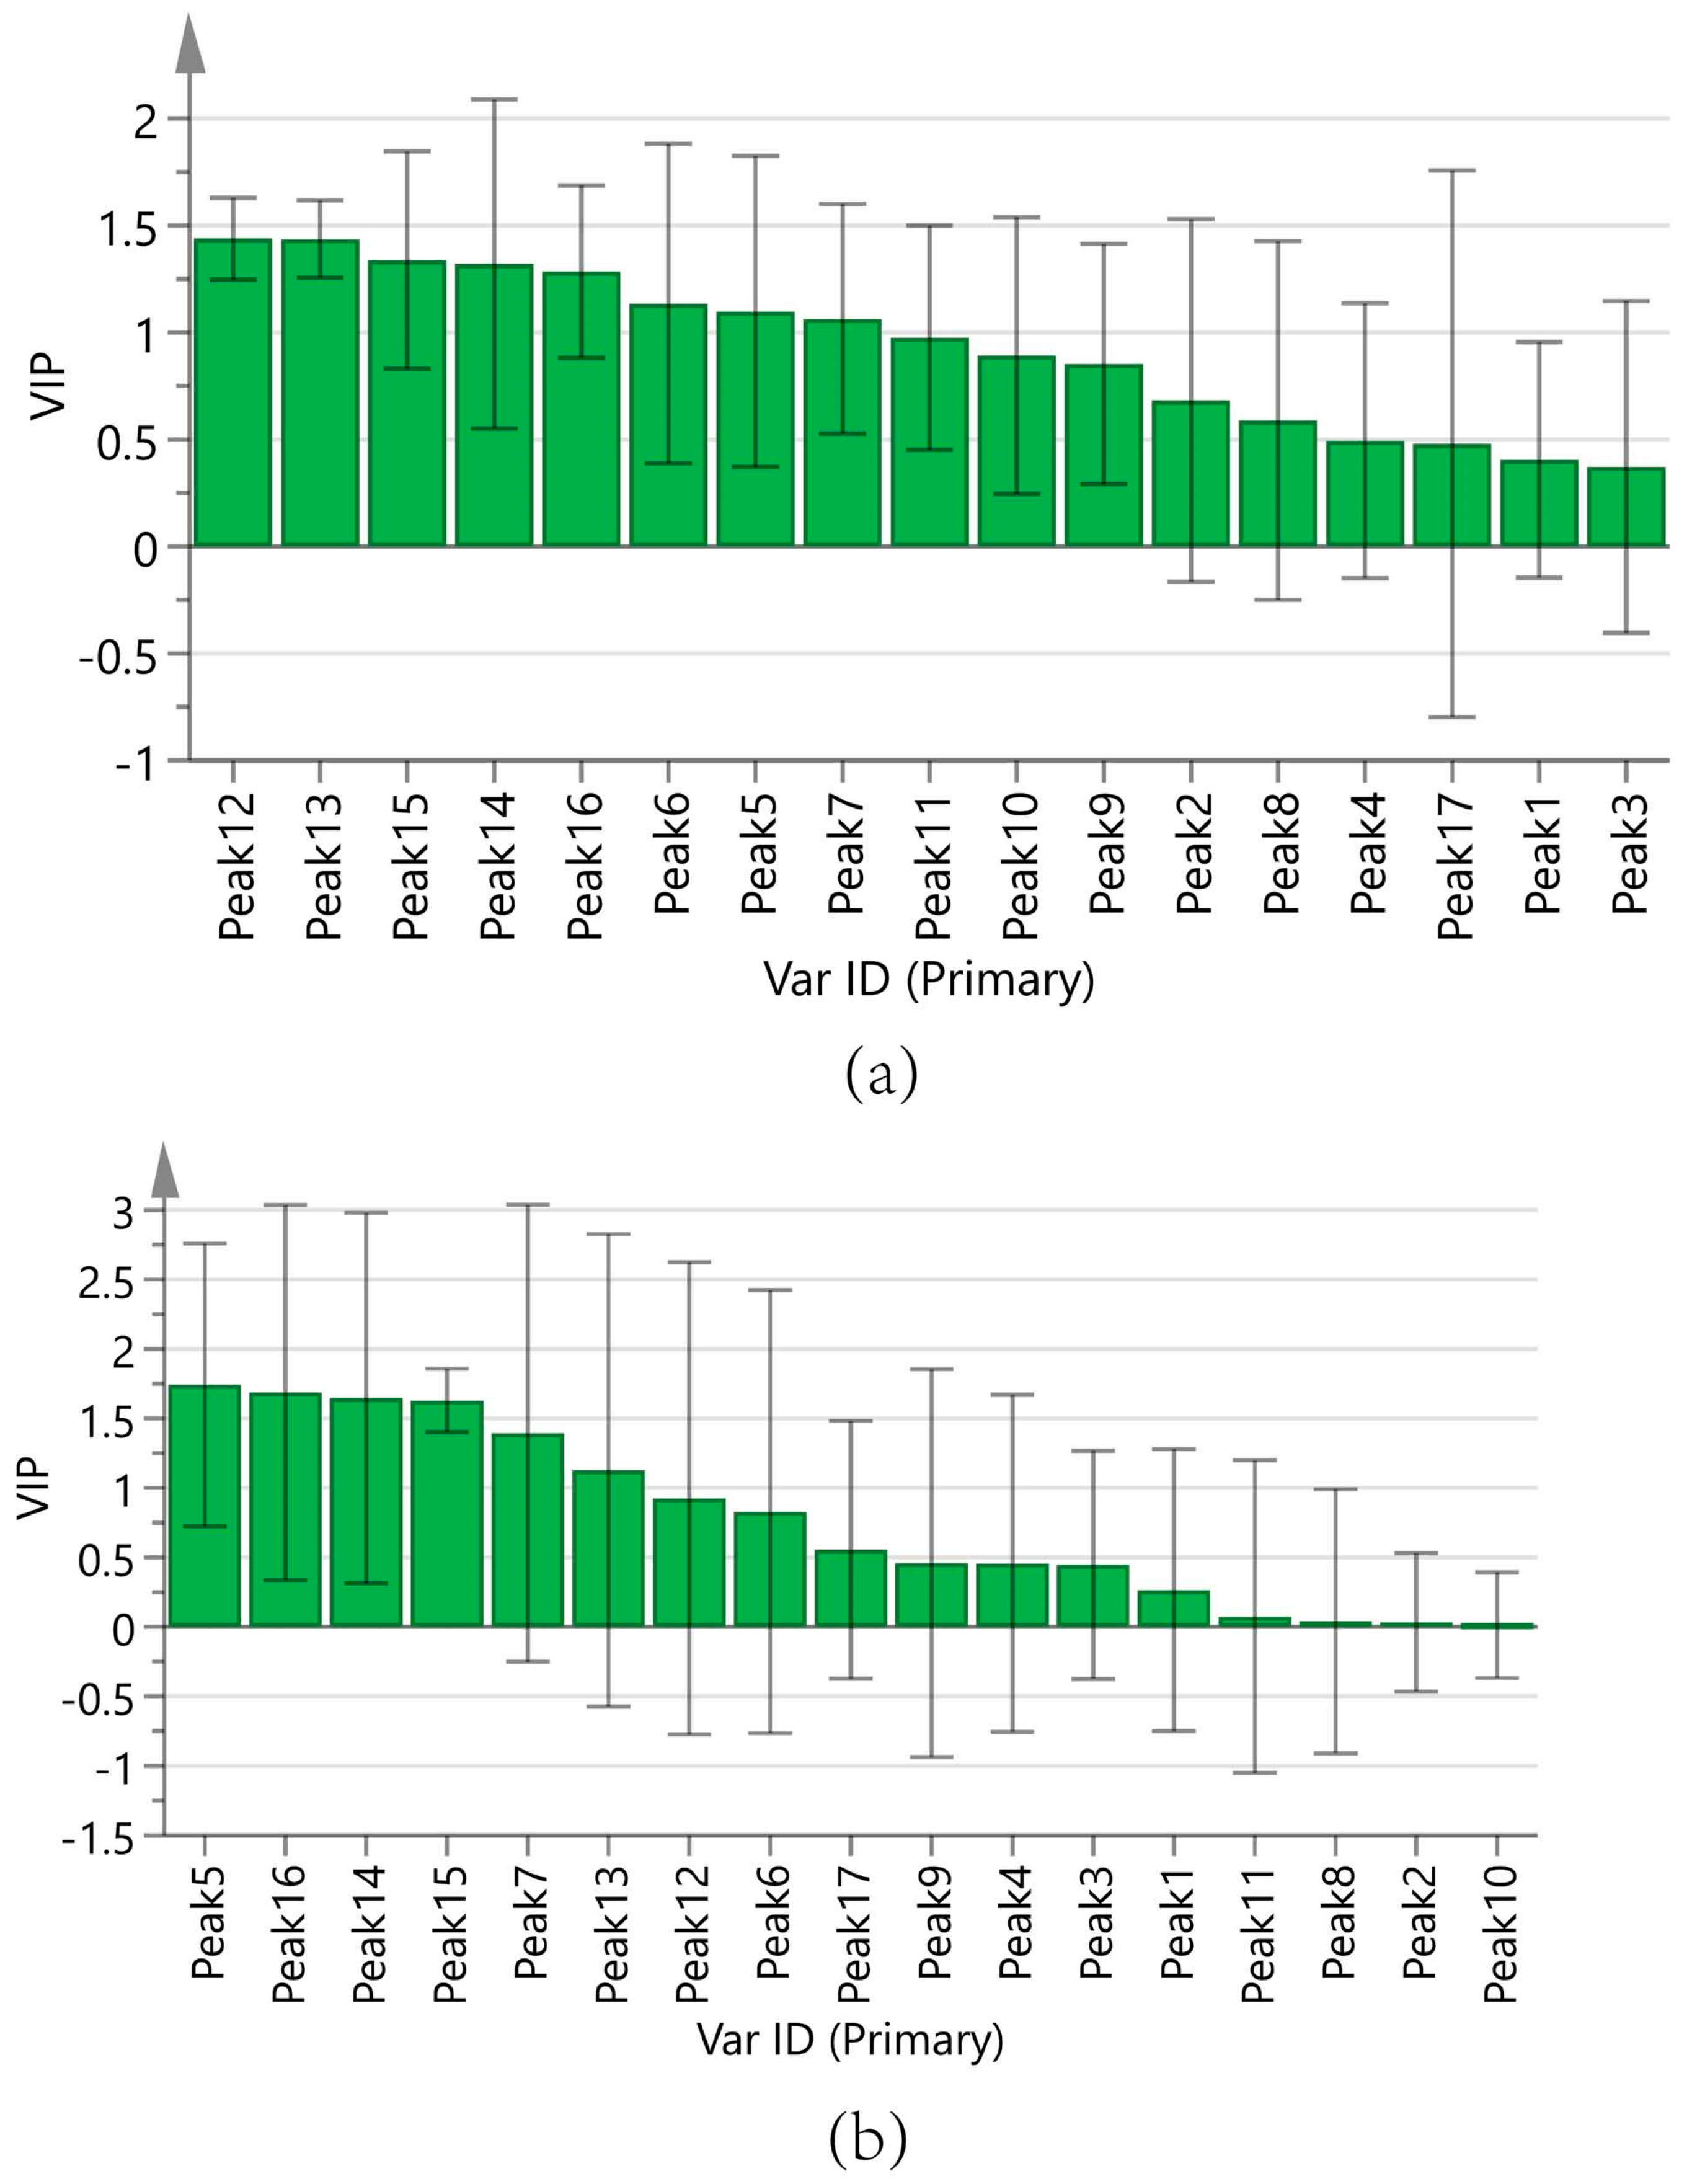
Figure 9a displays the regression coefficients of the 17 peaks with antioxidant capacity. Positive regression coefficients represent a positive correlation, and negative regression coefficients suggest a negative correlation. The VIP values are shown in Figure 10a, where VIP > 1 indicates that the components significantly affect antioxidant capacity.
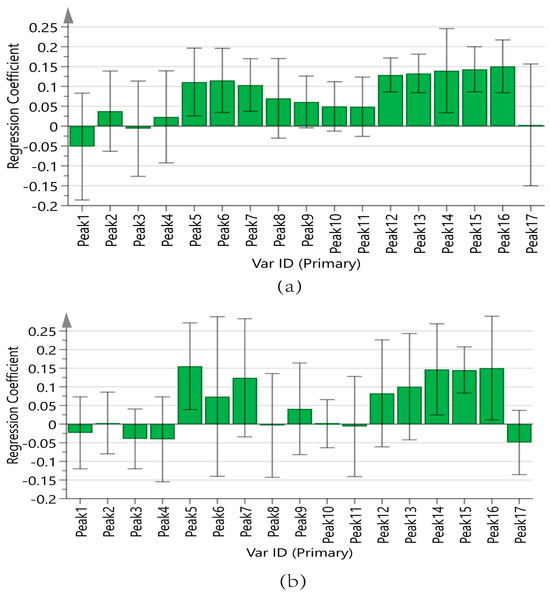
Figure 9.
Regression coefficient of 17 chromatographic peaks with antioxidant capacity. (a) ABTS assay, (b) DPPH assay.
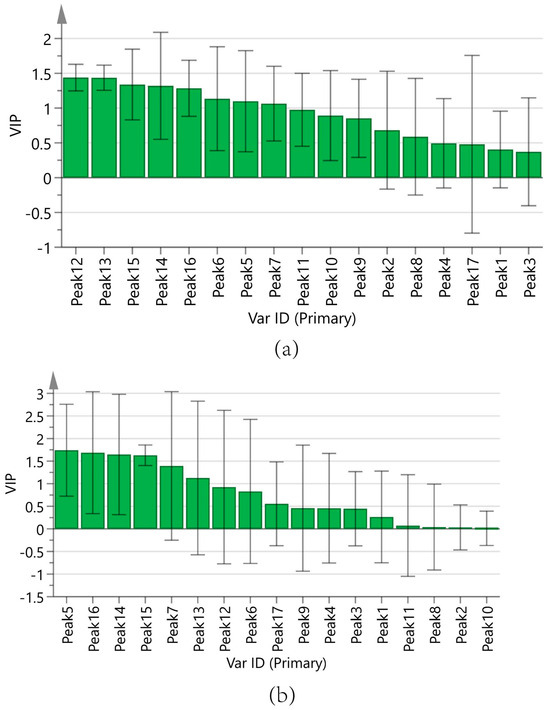
Figure 10.
Variable importance in projection (VIP) values. (a) ABTS assay, (b) DPPH assay.
In summary, the antioxidant capacities measured by the ABTS of the components are ranked as follows: Peak 12 (chlorogenic acid), Peak 13 (vanillic acid), Peak 15 (p-hydroxycinnamic acid), Peak 14 (caffeic acid), Peak 16 (myricetin), Peak 6, Peak 5 (adenosine), and Peak 7 (5-HMF). The results of the DPPH assay were analyzed in the same manner as those of the ABTS assay, as shown in Figure 9b and Figure 10b. The antioxidant activities measured by DPPH of the components are ranked as follows: Peak 5 (adenosine), Peak 16 (myricetin), Peak 14 (caffeic acid), Peak 15 (p-hydroxycinnamic acid), Peak 7 (5-HMF), and Peak 13 (vanillic acid).
Supplementary Materials Tables S2 and S3 detail the specific regression coefficients and VIP values for the 17 chromatographic peaks with antioxidant activity.
3.3.3. Comprehensive Analysis of the Spectrum–Effect Relationship
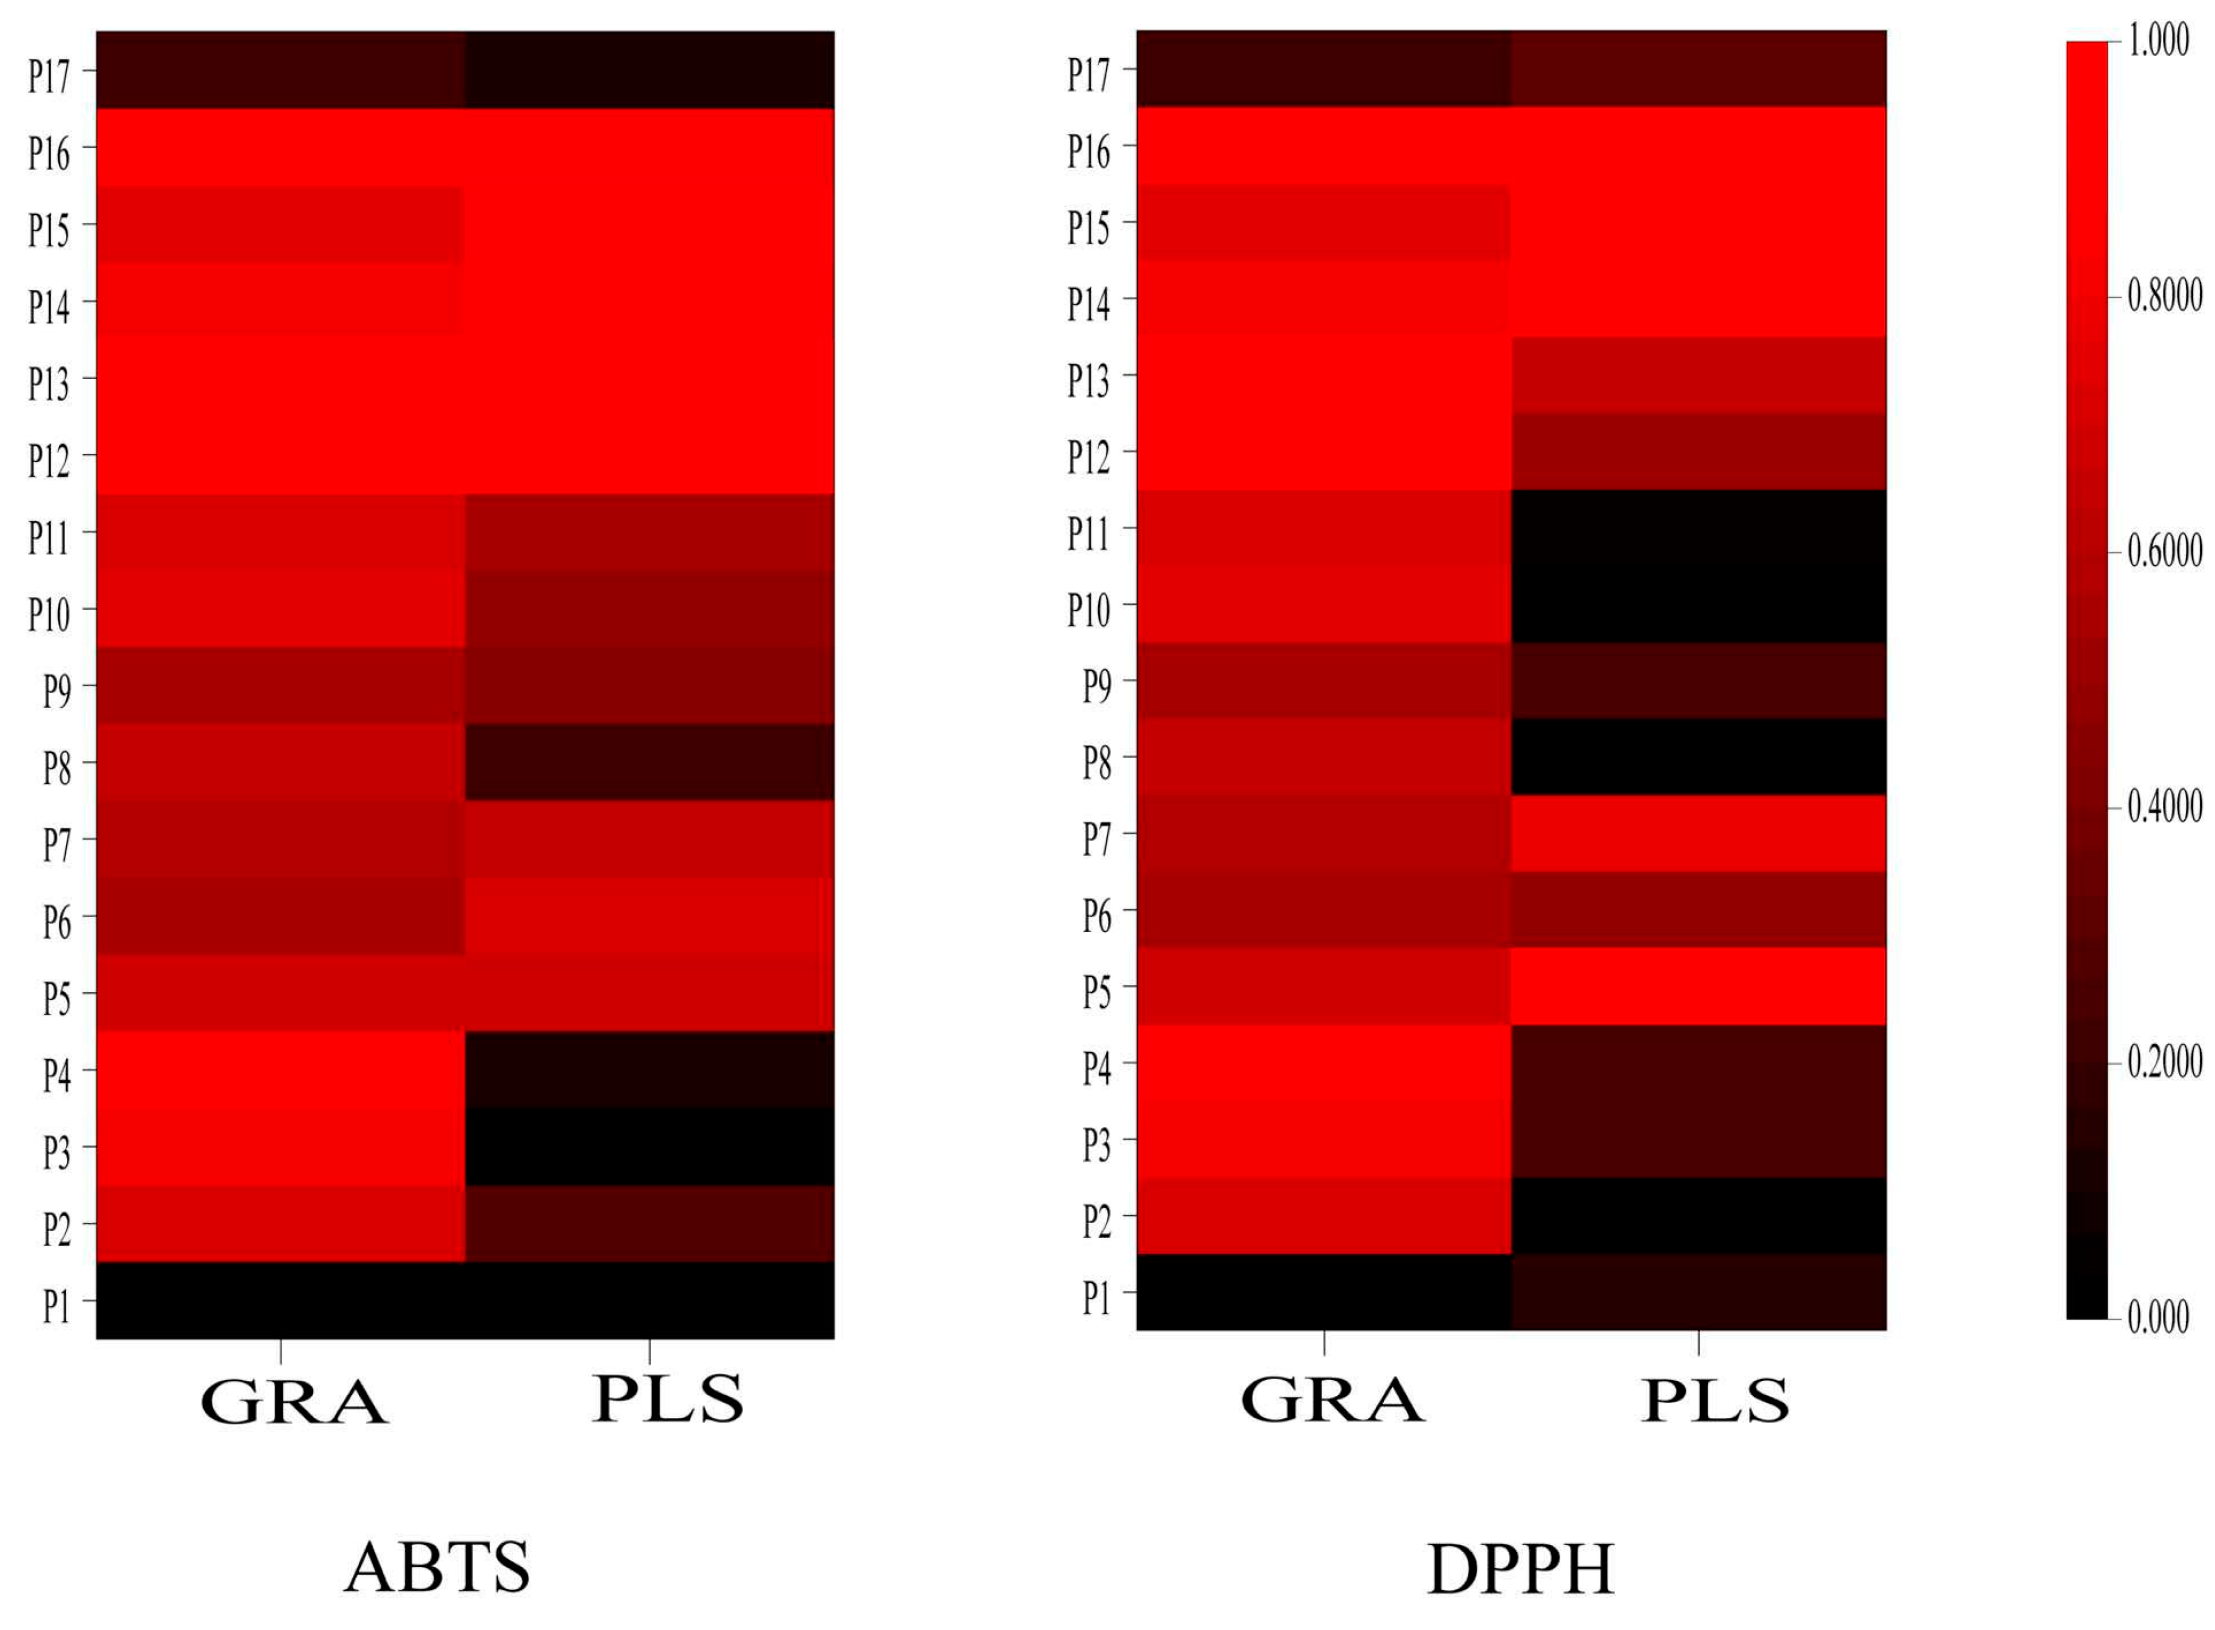
Figure 11 illustrates a heatmap displaying the antioxidant correlation coefficients for 14 peaks derived from two statistical methods. The color intensity in the heatmap indicates the strength of the correlation coefficients, with darker shades of red indicating stronger correlations. The antioxidant correlations among different peaks are evident. Notably, the antioxidant components identified by the ABTS and DPPH methods show significant overlap when the same statistical method was applied. However, the results obtained from the two statistical methods, GRA and PLS, show some differences on the heatmap, suggesting that each method may have limitations. Combining these two statistical methods can provide more comprehensive and reliable results for accurately identifying antioxidant components. By analyzing the intersection of the results, we identified six common components with content greater than 0.005% in wine-processed P. sibiricum. These components are 5-HMF (Peak 7), p-hydroxycinnamic acid (Peak 15), myricetin (Peak 16), caffeic acid (Peak 14), vanillic acid (Peak 13), and adenosine (Peak 5). These components have the potential to serve as quality markers for wine-processed P. sibiricum. The findings also indicate that the antioxidant capacity of wine-processed P. sibiricum arises from a combination of several components.

Figure 11.
The heatmaps of the antioxidant correlation coefficient of 17 chromatographic peaks of different statistical methods. Note: the darker red color indicates higher correlations.
4. Discussion
As the population ages, delaying the aging process has become an important area of research in contemporary society. The free radical theory of aging suggested that the degenerative changes associated with aging resulted from the damaging effects of free radicals produced during normal cellular metabolism [26]. Since ancient times, P. sibiricum has been regarded as a life-prolonging herb in China. Modern studies have also shown that the decoction of P. sibiricum can significantly extend the lifespan of silkworms and fruit flies. P. sibiricum is known for inhibiting lipid peroxidation in cell membranes and protecting the structural integrity of myocardial mitochondria. The anti-aging effects of P. sibiricum may be related to its potent antioxidant properties [27,28]. However, previous research on P. sibiricum has primarily focused on the effects of polysaccharides, often overlooking its specific composition and synergistic effects involving other active constituents [29]. This experiment explored these additional active components by investigating their biological activity, particularly regarding antioxidant capacity. In establishing the HPLC fingerprint of P. sibiricum, we carefully selected analysis methods and conditions based on the characteristics of the studied components. During the sample extraction, a 75% ethanol solution was chosen as the solvent to minimize the polysaccharide content in the extraction, thereby allowing for a greater focus on extracting other active substances. Additionally, in selecting chromatographic analysis conditions, we thoroughly considered the properties of the analyzed components to determine the appropriate mobile phase composition, elution gradient, and other analytical parameters. By providing a comprehensive understanding of the antioxidant substance in wine-processed P. sibiricum, this research lays a theoretical foundation for its potential application in delaying the aging process.
This study successfully established an HPLC fingerprint for wine-processed P. sibiricum. The validation results of the method’s repeatability, reproducibility, and stability showed that it is highly reliable. The analysis of 14 batches of wine-processed P. sibiricum showed significant differences in ABTS and DPPH radical scavenging. GRA and PLS regression methods were used to study the spectrum–effect relationship between common chromatographic peaks and antioxidant activity. The study on antioxidant activity showed that the results of ABTS and DHHP were consistent in terms of the overall trend, but there were some differences, which may be mainly due to the differences in principle between the two methods. GRA and PLS, two different statistical methods for spectrum–effect relationship analysis, also have specific differences in results, which are also due to the limitations of a single method. In this study, we combined the two antioxidant analysis methods. We conducted the spectrum–effect relationship study through two statistical methods, which guaranteed the scientific reliability of the experimental results.
This research has shown that the common peaks identified in wine-processed P. sibiricum exhibited varying degrees of correlation with its antioxidant activity. The results indicated that 5-HMF, p-hydroxycinnamic acid, myricetin, caffeic acid, vanillic acid, and adenosine are correlated with the antioxidant activity of wine-processed P. sibiricum. Each of these components has been reported to have antioxidant capacity. 5-HMF is a common byproduct in food products and has been noted in literature for its diverse pharmacological effects, which included antioxidation, antitumor, and anti-diabetic properties [30,31]. p-hydroxycinnamic acid, a natural metabolite found in many edible plants, is recognized for its pharmacological benefits, such as antioxidant, antitumor, antibacterial, and anti-aging properties. Numerous experimental models have confirmed its ability to reduce oxidative stress and inflammatory responses [32,33]. Myricetin, a flavonoid that occurs widely in various natural plants, including Myrica rubra, possesses several pharmacological activities, such as antioxidant, anti-amyloidogenic, antibacterial, antiviral, and anti-diabetic properties [34,35,36]. Caffeic acid is crucial in providing human health benefits through its antioxidant properties. It inhibits the formation of reactive oxygen species (ROS) by blocking 5-lipoxygenase, an enzyme that converts arachidonic acid to leukotrienes, which are involved in ROS generation [37]. Vanillic acid, another important compound, is a flavoring agent in the food, beverage, cosmetics, and pharmaceutical industries. This phenolic acid exhibits antioxidant, anti-inflammatory, and neuroprotective properties [38,39,40]. Lastly, adenosine is an endogenous metabolite with considerable potential for use in immunomodulatory therapy, offering antioxidant, anti-inflammatory, and immune-boosting effects [41]. In conclusion, beyond polysaccharides, these compounds significantly contribute to the antioxidant activity of P. sibiricum.
5. Conclusions
This investigation elucidated the antioxidant material basis of wine-processed P. sibiricum through a comprehensive spectrum–effect relationship analysis. This study successfully established an HPLC fingerprint for wine-processed P. sibiricum by gradually optimizing various conditions. This fingerprint comprehensively reflected the types and quantities of chemical compounds in different batches of samples. Similarity analysis and cluster analysis revealed significant differences in the components and contents of samples from different regions, with quality variations also observed within the same region. The results of ABTS and DPPH methods showed that all samples showed antioxidant activity, yet there were variations in antioxidant activity among extracts from different regions. Combined with chemometric GRA and PLS regression analysis, key antioxidant pharmacodynamic components were identified by the correlation analysis, i.e., 5-HMF, p-hydroxycinnamic acid, myricetin, caffeic acid, vanillic acid, and adenosine. In this study, we expanded our focus beyond polysaccharides to identify other potentially important bioactive substances and seek multi-compound markers for quality control. We combined two methods for antioxidant analysis. By employing two statistical techniques, we ensured the scientific reliability of our results. This research provides novel insights into the material basis of P. sibiricum, offering a valuable framework for comprehensive quality control and further pharmacological research.
However, there are some limitations in the research, including potential batch-to-batch variability and possible unknown synergistic effects that have not been thoroughly addressed. In future work, a more detailed quantitative analysis method for these pharmacodynamic components should be established. Additionally, a comprehensive quality control strategy for the combination of the aforementioned components and polysaccharides needs to be further developed.
Supplementary Materials
The following supporting information can be downloaded at: https://www.mdpi.com/article/10.3390/separations12040081/s1; Table S1. The specific RSD values for the methodological validation; Table S2. Correlation coefficient of 17 common peaks with antioxidant activity of PLS; Table S3. VIP value of 17 common peaks with antioxidant capacity of PLS.
Author Contributions
Conceptualization, L.-W.Z.; methodology, L.-W.Z.; software, J.W.; validation, Y.G.; formal analysis, L.-W.Z.; investigation, J.W.; resources, J.W.; data curation, L.-W.Z.; writing—original draft preparation, Z.-L.K.; writing—review and editing, Y.-Q.Z.; visualization, Z.-L.K.; supervision, Y.G.; project administration, Y.-Q.Z.; funding acquisition, Y.-Q.Z. All authors have read and agreed to the published version of the manuscript.
Funding
This research received no external funding.
Data Availability Statement
The data presented in this study are available within the article and Supplementary Materials.
Conflicts of Interest
The authors declare no conflicts of interest.
References
- Li, W.; Xu, S.; Bi, J.; Huang, S.; Fan, B.; Qian, C. Metabolomics study of polysaccharide extracts from Polygonatum sibiricum in mice based on (1) H NMR technology. J. Sci. Food Agric. 2020, 100, 4627–4635. [Google Scholar] [CrossRef] [PubMed]
- Zhang, H.; Kang, J.; Guo, W.; Wang, F.; Guo, M.; Feng, S.; Zhou, W.; Li, J.; Tahir, A.T.; Wang, S.; et al. An optimal medicinal and edible Chinese herbal formula attenuates particulate matter-induced lung injury through its anti-oxidative, anti-inflammatory and anti-apoptosis activities. Chin. Herb. Med. 2023, 15, 407–420. [Google Scholar]
- Shen, F.; Song, Z.; Xie, P.; Li, L.; Wang, B.; Peng, D.; Zhu, G. Polygonatum sibiricum polysaccharide prevents depression-like behaviors by reducing oxidative stress, inflammation, and cellular and synaptic damage. J. Ethnopharmacol. 2021, 275, 114164. [Google Scholar]
- Ma, A.; Zou, F.; Zhang, R.; Zhao, X. The effects and underlying mechanisms of medicine and food homologous flowers on the prevention and treatment of related diseases. J. Food Biochem. 2022, 46, e14430. [Google Scholar] [CrossRef] [PubMed]
- Luan, Y.; Jiang, Y.; Huang, R.; Wang, X.; He, X.; Liu, Y.; Tan, P. Polygonati Rhizoma Polysaccharide Prolongs Lifespan and Healthspan in Caenorhabditis elegans. Molecules 2023, 28, 2235. [Google Scholar] [CrossRef] [PubMed]
- Mao, Y.P.; Song, Y.M.; Pan, S.W.; Li, N.; Wang, W.X.; Feng, B.B.; Zhang, J.H. Effect of Codonopsis radix and Polygonati Rhizoma on the regulation of the IRS1/PI3K/AKT signaling pathway in type 2 diabetic mice. Front. Endocrinol. 2022, 13, 1068555. [Google Scholar]
- Zhao, J.; Ma, L.; Ni, Z.; Liu, H. In vitro facilitating role of Polygonatum sibiricum polysaccharide in osteogenic differentiation of bone marrow mesenchymal stem cells from patients with multiple myeloma. Biotechnol. Lett. 2021, 43, 1311–1322. [Google Scholar] [CrossRef] [PubMed]
- Liu, R.; Zhang, X.; Cai, Y.; Xu, S.; Xu, Q.; Ling, C.; Li, X.; Li, W.; Liu, P.; Liu, W. Research progress on medicinal components and pharmacological activities of Polygonatum sibiricum. J. Ethnopharmacol. 2024, 328, 118024. [Google Scholar] [CrossRef] [PubMed]
- Chinese Pharmacopoeia Commission. Pharmacopoeia of the People’s Republic of China; 2020 Edition (in 4 Volumes); China Press of Traditional Chinese Medicine: Beijing, China, 2020; 319. [Google Scholar]
- Yang, H.J.; Gong, Q.F. Progress in Study on Processing of Polygonati Rhizome in Past Decade. Chin. J. Exp. Tradit. Med. Formulae. 2017, 23, 216–222. [Google Scholar]
- Zhu, C.S.; Lin, Z.J.; Xiao, M.L.; Niu, H.J.; Zhang, B. The spectrum-effect relationship-a rational approach to screening effective compounds, reflecting the internal quality of Chinese herbal medicine. Chin. J. Nat. Med. 2016, 14, 177–184. [Google Scholar] [CrossRef]
- Wang, X.; Liu, X.; Wang, J.; Wang, G.; Zhang, Y.; Lan, L.; Sun, G. Study on multiple fingerprint profiles control and quantitative analysis of multi-components by single marker method combined with chemometrics based on Yankening tablets. Spectrochim. Acta Part A Mol. Biomol. Spectrosc. 2021, 253, 119554. [Google Scholar] [CrossRef] [PubMed]
- Liu, Y.; Tao, C.; Ma, H.; Qiu, F. Differential Comparison of Chemical Compositions Between Two Wutou Decoctions Based on Ultrahigh-Performance Liquid Chromatography Coupled With Quadrupole Time-of-Flight Tandem Mass Spectrometry Combined With Chemometric Analysis. J. Sep. Sci. 2024, 47, e70047. [Google Scholar] [CrossRef] [PubMed]
- Huang, Y.; Tao, M.; Li, R.; Liang, F.; Xu, T.; Zhong, Q.; Yuan, Y.; Wu, T.; Pan, S.; Xu, X. Identification of key phenolic compounds for alleviating gouty inflammation in edible chrysanthemums based on spectrum-effect relationship analyses. Food Chem. X. 2023, 20, 100897. [Google Scholar] [CrossRef]
- Li, S.; Huang, X.; Li, Y.; Ding, R.; Wu, X.; Li, L.; Li, C.; Gu, R. Spectrum-effect relationship in Chinese herbal medicine: Current status and future perspectives. Crit. Rev. Anal. Chem. 2023, 55, 353–374. [Google Scholar] [CrossRef] [PubMed]
- Wang, F.; Qian, Z.; Liao, G.; Zeng, J.; Huang, D.; Liu, Q.; Xie, X. HPLC Coupled with Chemical Fingerprinting for Multi-Pattern Recognition for Identifying the Authenticity of Clematidis Armandii Caulis J. Vis. Exp. 2022, 189, 1485–1492. [Google Scholar] [CrossRef]
- Li, S.; Sun, Y.; Gao, Y.; Yu, X.; Zhao, C.; Song, X.; Han, F.; Yu, J. Spectrum-effect relationship analysis based on HPLC-FT-ICR-MS and multivariate statistical analysis to reveal the pharmacodynamic substances of Ling-Gui-Zhu-Gan decoction on Alzheimer's disease. J. Pharm. Biomed. Anal. 2024, 237, 115765. [Google Scholar]
- Zhong, R.; Shen, L.; Fan, Y.; Luo, Q.; Hong, R.; Sun, X.; Zhou, X.; Wan, J. Anti-aging mechanism and effect of treatment with raw and wine-steamed Polygonatum sibiricum on D-galactose-induced aging in mice by inhibiting oxidative stress and modulating gut microbiota. Front. Pharmacol. 2024, 15, 1335786. [Google Scholar] [CrossRef] [PubMed]
- Rumpf, J.; Burger, R.; Schulze, M. Statistical evaluation of DPPH, ABTS, FRAP, and Folin-Ciocalteu assays to assess the antioxidant capacity of lignins. Int. J. Biol. Macromol. 2023, 233, 123470. [Google Scholar]
- Pavlíková, N. Caffeic acid and diseases-mechanisms of action. Int. J. Mol. Sci. 2022, 24, 588. [Google Scholar] [CrossRef]
- Jiang, Y.L.; Xu, Z.J.; Cao, Y.F.; Wang, F.; Chu, C.; Zhang, C.; Tao, Y.; Wang, P. HPLC fingerprinting-based multivariate analysis of chemical components in Tetrastigma hemsleyanum Diels et Gilg: Correlation to their antioxidant and neuraminidase inhibition activities. J. Pharm. Biomed. Anal. 2021, 205, 114314. [Google Scholar] [CrossRef]
- Ibrahim, R.S.; Khairy, A.; Zaatout, H.H.; Hammoda, H.M.; Metwally, A.M.; Salman, A.M. Chemometric evaluation of alfalfa sprouting impact on its metabolic profile using HPTLC fingerprint-efficacy relationship analysis modelled with partial least squares regression. J. Pharm. Biomed. Anal. 2020, 179, 112990. [Google Scholar]
- Xu, Y.; Yuan, D.; Liu, L.; Yu, Z.; Duan, M. To explore the best freeze-drying technology of Polygonatum sibiricum delar. Ex. redoute and to establish the best HPLC method for the determination of main effective components of it from different areas in China. Heliyon 2023, 9, e14156. [Google Scholar] [CrossRef] [PubMed]
- Luo, G.; Lin, J.; Cheng, W.; Liu, Z.; Yu, T.; Yang, B. UHPLC-Q-Orbitrap-MS-Based Metabolomics Reveals Chemical Variations of Two Types of Rhizomes of Polygonatum sibiricum. Molecules 2022, 27, 4685. [Google Scholar] [CrossRef] [PubMed]
- Yuxiang, N.; Zhanjing, G.; Xueqing, X.; Minzhen, W.; Yuanzhi, Y.; Lixia, H.; Hongmiao, H. Establishment of fingerprints and spectrum-effect relationship of anti-tumor activity of Spatholobi Caulis Chinese Traditional and Herbal. Drugs 2024, 55, 2405–2412. [Google Scholar]
- Viña, J. The free radical theory of frailty: Mechanisms and opportunities for interventions to promote successful aging. Free Radic. Biol. Med. 2019, 134, 690–694. [Google Scholar] [PubMed]
- Wang, W.; Li, S.; Song, M. Polygonatum sibiricum polysaccharide inhibits high glucose-induced oxidative stress, inflammatory response, and apoptosis in RPE cells. J. Recept. Signal Transduct. Res. 2022, 42, 189–196. [Google Scholar] [PubMed]
- Huang, Y.; Wang, Y.; Deng, J.; Gao, S.; Qiu, J.; He, J.; Yang, T.; Tan, N.; Cheng, S.; Song, Z. Research on the anti-oxidant and anti-aging effects of Polygonatum kingianum saponins in Caenorhabditis elegans. Heliyon 2024, 10, e35556. [Google Scholar]
- Sun, T.; Zhang, H.; Li, Y.; Liu, Y.; Dai, W.; Fang, J.; Cao, C.; Die, Y.; Liu, Q.; Wang, C.; et al. Physicochemical properties and immunological activities of polysaccharides from both crude and wine-processed Polygonatum sibiricum. Int. J. Biol. Macromol. 2020, 143, 255–264. [Google Scholar] [CrossRef]
- Guan, D.; Li, Y.; Cui, Y.; Zhao, H.; Dong, N.; Wang, K.; Ren, D.; Song, T.; Wang, X.; Jin, S.; et al. 5-HMF attenuates inflammation and demyelination in experimental autoimmune encephalomyelitis mice by inhibiting the MIF-CD74 interaction. Acta Biochim. Biophys. Sin. 2023, 55, 1222–1233. [Google Scholar] [CrossRef]
- Zhang, J.H.; Di, Y.; Wu, L.Y.; He, Y.L.; Zhao, T.; Huang, X.; Ding, X.F.; Wu, K.W.; Fan, M.; Zhu, L.L. 5-HMF prevents against oxidative injury via APE/Ref-1. Free Radic. Res. 2015, 49, 86–94. [Google Scholar]
- Chen, F.; Zhang, X.; Wang, J.; Wang, F.; Mao, J. P-coumaric Acid: Advances in Pharmacological Research Based on Oxidative Stress. Curr. Top. Med. Chem. 2024, 24, 416–436. [Google Scholar] [CrossRef]
- Yue, Y.; Shen, P.; Xu, Y.; Park, Y. p-Coumaric acid improves oxidative and osmosis stress responses in Caenorhabditis elegans. J. Sci. Food Agric. 2019, 99, 1190–1197. [Google Scholar] [CrossRef] [PubMed]
- Gupta, G.; Siddiqui, M.A.; Khan, M.M.; Ajmal, M.; Ahsan, R.; Rahaman, M.A.; Ahmad, M.A.; Arshad, M.; Khushtar, M. Current Pharmacological Trends on Myricetin. Drug Res. 2020, 70, 448–454. [Google Scholar] [CrossRef] [PubMed]
- Taheri, Y.; Suleria, H.A.R.; Martins, N.; Sytar, O.; Beyatli, A.; Yeskaliyeva, B.; Seitimova, G.; Salehi, B.; Semwal, P.; Painuli, S.; et al. Myricetin bioactive effects: Moving from preclinical evidence to potential clinical applications. BMC Complement. Med. Ther. 2020, 20, 241. [Google Scholar] [CrossRef] [PubMed]
- Kimura, A.M.; Tsuji, M.; Yasumoto, T.; Mori, Y.; Oguchi, T.; Tsuji, Y.; Umino, M.; Umino, A.; Nishikawa, T.; Nakamura, S.; et al. Myricetin prevents high molecular weight Aβ(1-42) oligomer-induced neurotoxicity through antioxidant effects in cell membranes and mitochondria. Free Radic. Biol. Med. 2021, 171, 232–244. [Google Scholar] [CrossRef] [PubMed]
- Baliyan, S.; Mukherjee, R.; Priyadarshini, A.; Vibhuti, A.; Gupta, A.; Pandey, R.P.; Chang, C.M. Determination of Antioxidants by DPPH Radical Scavenging Activity and Quantitative Phytochemical Analysis of Ficus religiosa. Molecules 2022, 27, 1326. [Google Scholar] [CrossRef]
- Osorio-Paz, I.; Valle-Jiménez, X.; Brunauer, R.; Alavez, S. Vanillic Acid Improves Stress Resistance and Substantially Extends Life Span in Caenorhabditis elegans. J. Gerontol. Ser. A Biol. Sci. Med. Sci. 2023, 78, 1100–1107. [Google Scholar] [CrossRef] [PubMed]
- Taqvi, S.; Ahmed Bhat, E.; Sajjad, N.; Sabir, J.S.M.; Qureshi, A.; Rather, I.A.; Rehman, S. Protective effect of vanillic acid in hydrogen peroxide-induced oxidative stress in D.Mel-2 cell line. Saudi J. Biol. Sci. 2021, 28, 1795–1800. [Google Scholar] [CrossRef]
- Shabani, M.; Jamali, Z.; Bayrami, D.; Salimi, A. Vanillic acid alleviates methamphetamine-induced mitochondrial toxicity in cardiac mitochondria via antioxidant activity and inhibition of MPT Pore opening: An in-vitro study. BMC Pharmacol. Toxicol. 2023, 24, 33. [Google Scholar] [CrossRef]
- Gao, J.; Liu, X.; Wang, M.; Zeng, X.; Wang, Z.; Wang, Y.; Lou, J.; Liu, J.; Zhao, L. Adenosine protects cardiomyocytes against acrolein-induced cardiotoxicity by enhancing mitochondrial homeostasis, antioxidant defense, and autophagic flux via ERK-activated FoxO1 upregulation. Ecotoxicol. Environ. Saf. 2024, 283, 116799. [Google Scholar] [CrossRef]


Disclaimer/Publisher’s Note: The statements, opinions and data contained in all publications are solely those of the individual author(s) and contributor(s) and not of MDPI and/or the editor(s). MDPI and/or the editor(s) disclaim responsibility for any injury to people or property resulting from any ideas, methods, instructions or products referred to in the content. |
© 2025 by the authors. Licensee MDPI, Basel, Switzerland. This article is an open access article distributed under the terms and conditions of the Creative Commons Attribution (CC BY) license (https://creativecommons.org/licenses/by/4.0/).