Abstract
The bed expansion height serves as a macroscopic representation of the efficiency with which vibrational energy is transmitted within pulsed fluidized beds. Due to its complex nonlinear characteristics, further research is needed to explore the fluidization mechanisms in pulsed fluidized beds and identify effective predictive models for expansion ratios. This work evaluates and analyzes the predictive capabilities of models established based on theoretical learning, as well as three machine learning methods. Additionally, dimensionless numbers are introduced to facilitate dimensionality reduction. Among these methods, the extreme gradient boosting model demonstrated exceptional performance, achieving an R2 value of 0.9907 on the training set and reaching 0.9300 on the testing set. Furthermore, an interpretability analysis of the extreme gradient boosting model was conducted using Shapley additive explanations, revealing that f/fn is the most significant factor influencing the bed expansion ratio, while H0/D has a relatively minor effect. These findings provide a basis for effectively predicting bed expansion ratios and facilitate further scale-up studies in pulsed fluidized beds.
1. Introduction
The pulsed fluidized bed is a technology where continuous gas flow is changed into forced oscillatory gas flow [1,2,3]. This process is driven by the periodic forces of the gas stream, which supplement energy dissipation, enhance fluidization quality, reduce bubble size, and improve mass and heat transfer efficiency [4,5,6,7,8]. In the field of coal separation, clean coal and gangue are separated based on the density of the fluidized bed; clean coal with a lower density than the fluidized bed rises to the top layer while denser gangue settles at the bottom [9,10]. Consequently, the separation effectiveness of a fluidized bed is closely related to its bed density. However, the stability of this bed density is influenced by the bubbles present in it. Due to controllable bubbles and particles within pulsed fluidized beds, this technology significantly enhances separation efficiency between clean coal and gangue [11,12,13]. The response degree of a fluidized bed to airflow excitation determines its energy transfer efficiency, which macroscopically manifests as the expansion ratio of the bed. The expansion ratio subsequently influences the magnitude of bed density. Research indicates that key factors affecting fluidized bed expansion ratios include the gas velocity, pulsation frequency, particle characteristics, and height of the bed [14]. Nevertheless, due to their complex nonlinear nature, a further investigation into the fluidization mechanism of pulsating fluidized beds is necessary for establishing effective prediction models for expansion ratios.
Scholars conduct research through numerical simulation techniques; however, the complexity and difficulty of understanding fluid dynamics models, coupled with high computational costs and lengthy calculation times, pose significant challenges [15]. Consequently, rapidly obtaining the characteristics of pulsed fluidized bed flow remains a formidable task. In recent years, significant advancements have been made in the application of machine learning (ML) within the field of chemical engineering [16,17]. Machine learning techniques can assist in developing effective predictive models for fluidized beds by identifying hidden patterns, information, and mechanisms present in data sets. Xiao et al. [18] proposed a hybrid model that combines artificial neural networks (ANNs) and random forests (RF), which markedly enhances the accuracy of particle velocity measurements. Jiang et al. [19] introduced a machine learning-based method to aid image segmentation for automatic bubble recognition in two-dimensional gas–solid fluidized beds, thereby improving the accuracy of bubble identification. Hossein et al. [20] developed a combination of acoustic emission (AE) technology and ML algorithms to characterize particle size distribution within gas–solid fluidized bed reactors. By integrating quantum computing principles with ML techniques, Razzak et al. [21] analyzed and simulated amplification effects occurring at the outlet of liquid–solid circulating fluidized beds. For pulsed fluidized beds, the bed expansion ratio is a key indicator reflecting energy transfer efficiency, which is influenced by operational parameters and particle properties. However, due to the complexity inherent to high-dimensional processes, it is necessary to reduce dimensionality in order to identify relevant dimensionless numbers and develop a high-precision predictive model for the bed expansion ratio in pulsed fluidized beds.
This work is based on the gas–solid distribution theory model and three machine learning models, utilizing a data set of 203 samples to investigate the correlation of the bed expansion ratio in pulsed fluidized beds. By introducing dimensionless numbers for dimensionality reduction, it evaluated and analyzed the predictive capabilities of these models. Furthermore, an interpretability analysis was conducted on the extreme gradient boosting (XGBoost) model using Shapley additive explanation (SHAP) values, providing support for the effective predictions of bed expansion ratios, which is essential for the further scaling-up of pulsed fluidized beds.
2. Experimental and Material Section
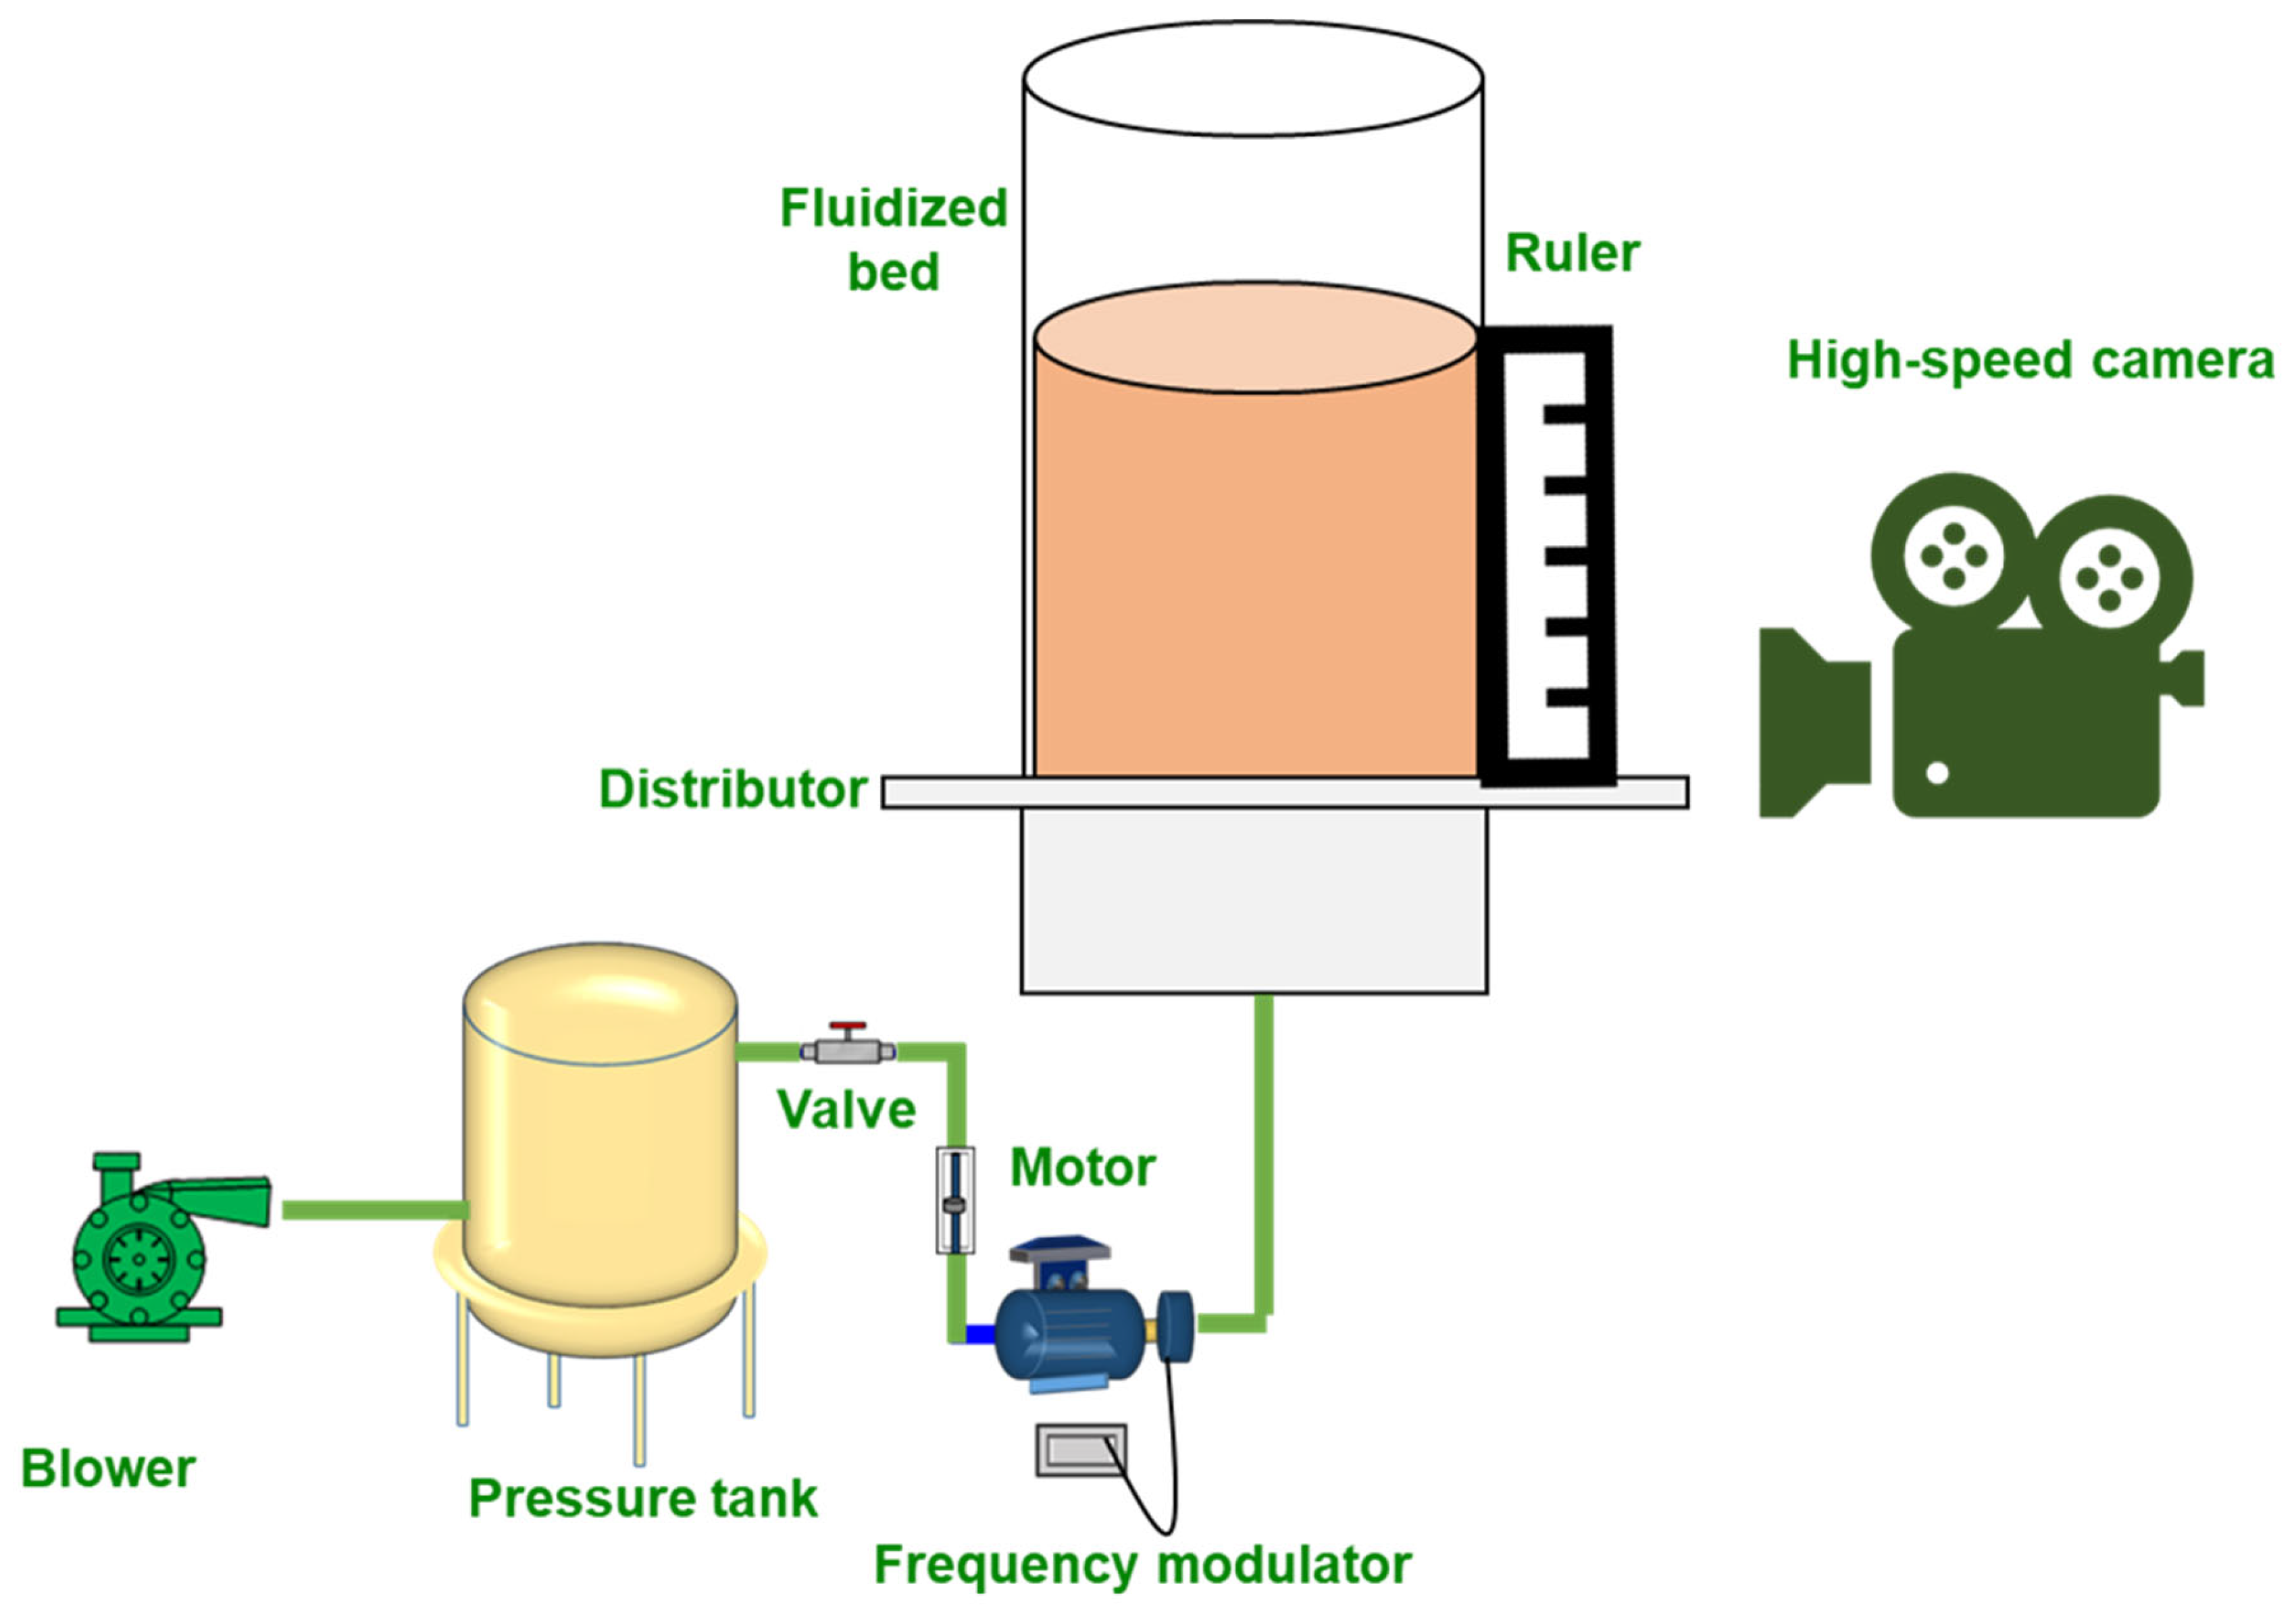
The data were obtained from a laboratory-scale pulsed fluidized bed, which primarily consists of an air supply system, airflow control and regulation systems, and the fluidized bed itself, as well as measurement and data acquisition systems. The pulsed fluidized bed is constructed from plexiglass with a diameter of 200 mm and a height of 1000 mm. The distributor plate is made of sintered material with pore sizes measuring 20 μm. The pulsation frequency is adjusted by controlling the motor speed through a variable-frequency drive; the motor operates a butterfly valve that rotates one complete turn to generate two cycles of pulsating airflow. High-speed camera recording of the fluidization experiments was conducted using a camera operating at 60 frames per second (fps), capturing images over a duration of 60 s. The bed exhibited varying expansion characteristics by altering the experimental particles, pulsation frequency, bed height, and gas velocity. The captured images were processed frame by frame using the i-Speed Control software to extract numerical values from a ruler, enabling the acquisition of bed-height data under different operational conditions. Subsequently, the bed height was divided by its initial height to obtain the final bed expansion ratio. A schematic diagram of the experimental system is presented in Figure 1. The range of the tested pulsation frequencies extends from 0 to 7 Hz, with initial bed heights set to 0.3 m, 0.4 m, 0.5 m, and 0.6 m, respectively. The materials employed for experimentation include magnetite powder and quartz sand, as detailed in Table 1. It is noteworthy that each experiment utilized only one type of material (either magnetite powder or quartz sand), rather than a mixture.

Figure 1.
Schematic diagram of experimental system.

Table 1.
Physical properties of particles for testing.
3. Theoretical Analysis of Bed Expansion in Pulsed Fluidized Beds
According to the theory of gas–solid distribution, traditional fluidized beds can be categorized into two phases: the bubble phase and the emulsion phase. The sum of their respective proportions within the bed layer equals one, as illustrated in Equation (1).
where represents the proportion of the bubble phase within the bed, while denotes the proportion of the emulsion phase present in the bed.
The proportion of the dense phase can be calculated using Equation (2).
where H represents the bed height under specific operating conditions, and Hmf denotes the bed height at the minimum fluidization velocity.
Kunii et al. [22] proposed that the proportion of the bubble phase can be calculated using Equation (3).
where u represents the gas velocity, umf denotes the minimum fluidization velocity, ub refers to the rising velocity of a group of bubbles, and ubr indicates the rising velocity of an individual bubble.
The rising velocity of an individual bubble can be described using Equation (4) [23].
where represents the average diameter of the bubbles within the fluidized bed. By averaging the bubble sizes observed at various heights within the fluidized bed, it is possible to calculate using Equation (5) [24].
where AD represents the area of single hole on air distributor, and g is the gravitational acceleration.
The rising velocity of a group of bubbles can be computed using Equation (6).
However, the introduction of vibrational energy has led to a change in the ratio of the dense phase to the bubble phase. The existing formulas for the bubble diameter and size are no longer applicable to pulsed fluidized beds; therefore, a correction factor, Y, has been introduced to rectify this discrepancy, as demonstrated in Equation (7).
Based on the integration of Equations (2)–(7), Equation (8) can be derived.
By further transforming Equation (8), the correction factor formula shown in Equation (9) can be obtained.
By incorporating Equations (4) and (6) into Equation (9), followed by a systematic simplification of the resulting expression, one can derive the calculation formula for the correction factor of gas–solid distribution in a pulsed fluidized bed. This is presented in Equation (10).
Equation (10) undergoes a further transformation, ultimately leading to the model for the bed expansion ratio in pulsed fluidized beds, as presented in Equation (11).
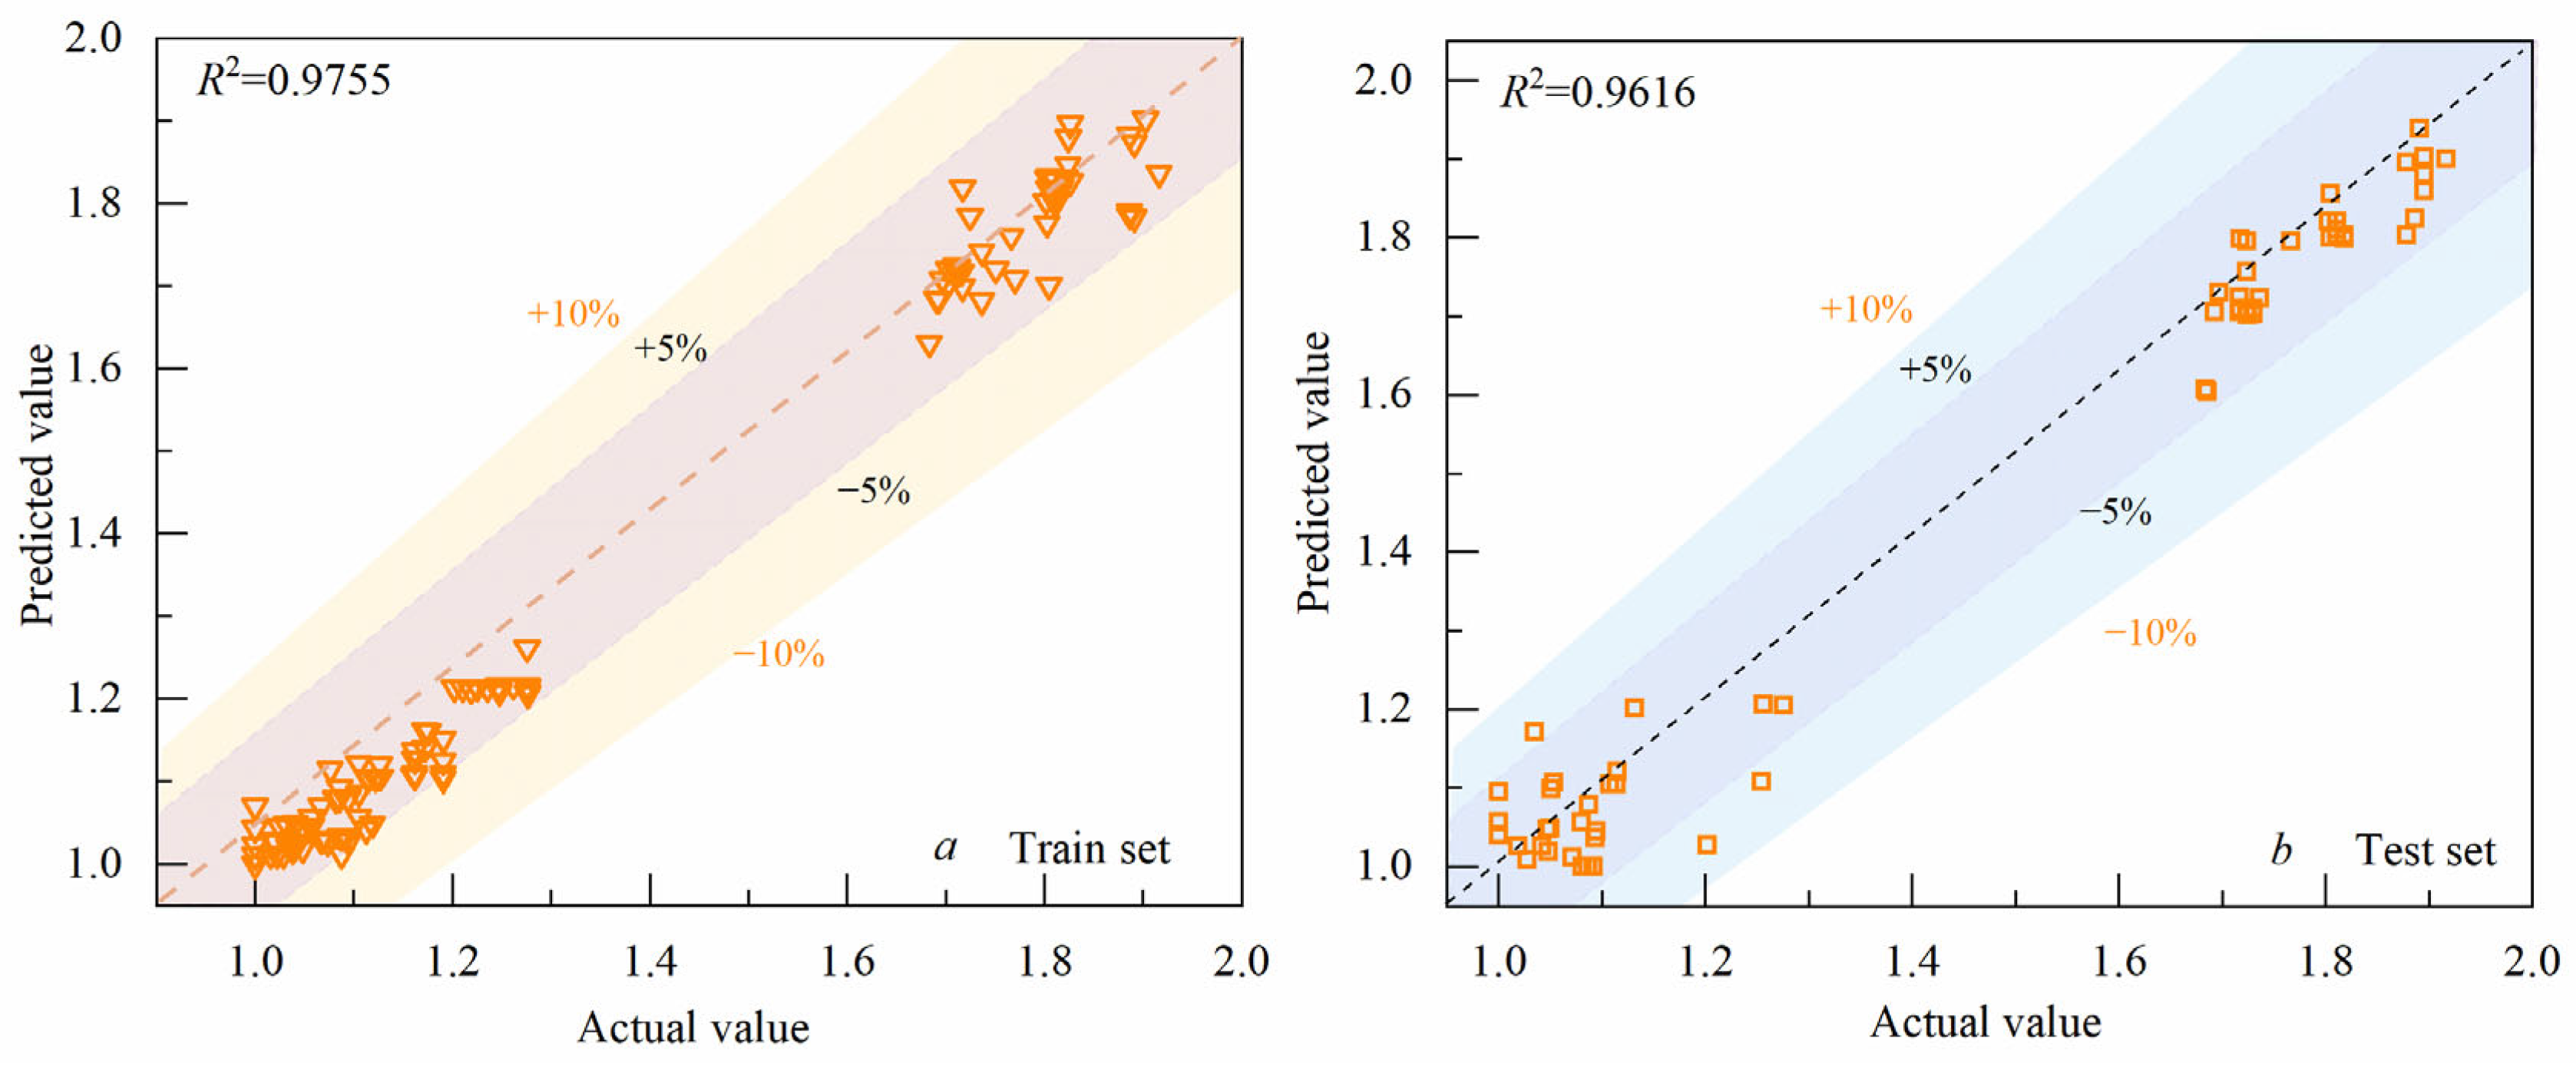
Equation (10) indicates that Y is not a constant; it varies within a specific range in response to changes in operational parameters, although the variation is relatively small. However, establishing a relationship between Y and the operational parameters would complicate the model and hinder its practical application. To simplify the model as much as possible, Y needs to be processed by iterating within its range of values until achieving a specific value that minimizes the error between the model’s predictions and experimental results. Ultimately, Y = 0.9728 is substituted into Equation (11), leading to the derivation of Equation (12). This equation is utilized to predict the bed expansion ratio under various operating conditions and to compare these predictions with the corresponding experimental values, as illustrated in Figure 2. The partitioning of the training set and testing set is consistent with the data splitting method described in Section 4.2 on the machine learning data sets, ensuring the accuracy of R2. The prediction error remains within 10%, while the R2 values for both the training and testing sets are recorded at 0.9755 and 0.9616, respectively.
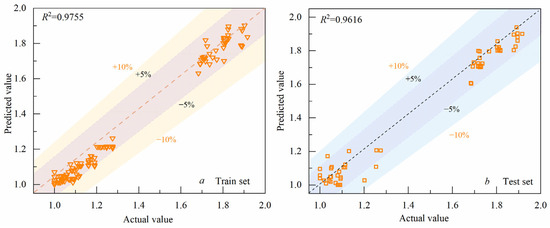
Figure 2.
Prediction accuracy of the theoretical model ((a): Train set; (b): Test set).
According to Equation (12), the parameters related to the bed expansion ratio include gas velocity, pulsation frequency, bed height, and particle properties. Among these factors, the influence of pulsation frequency and particle properties on the bed expansion ratio is primarily reflected in the minimum fluidization velocity and bubble characteristics [25,26].
4. Description of the Machine Learning Process
4.1. Refinement of Feature Parameters
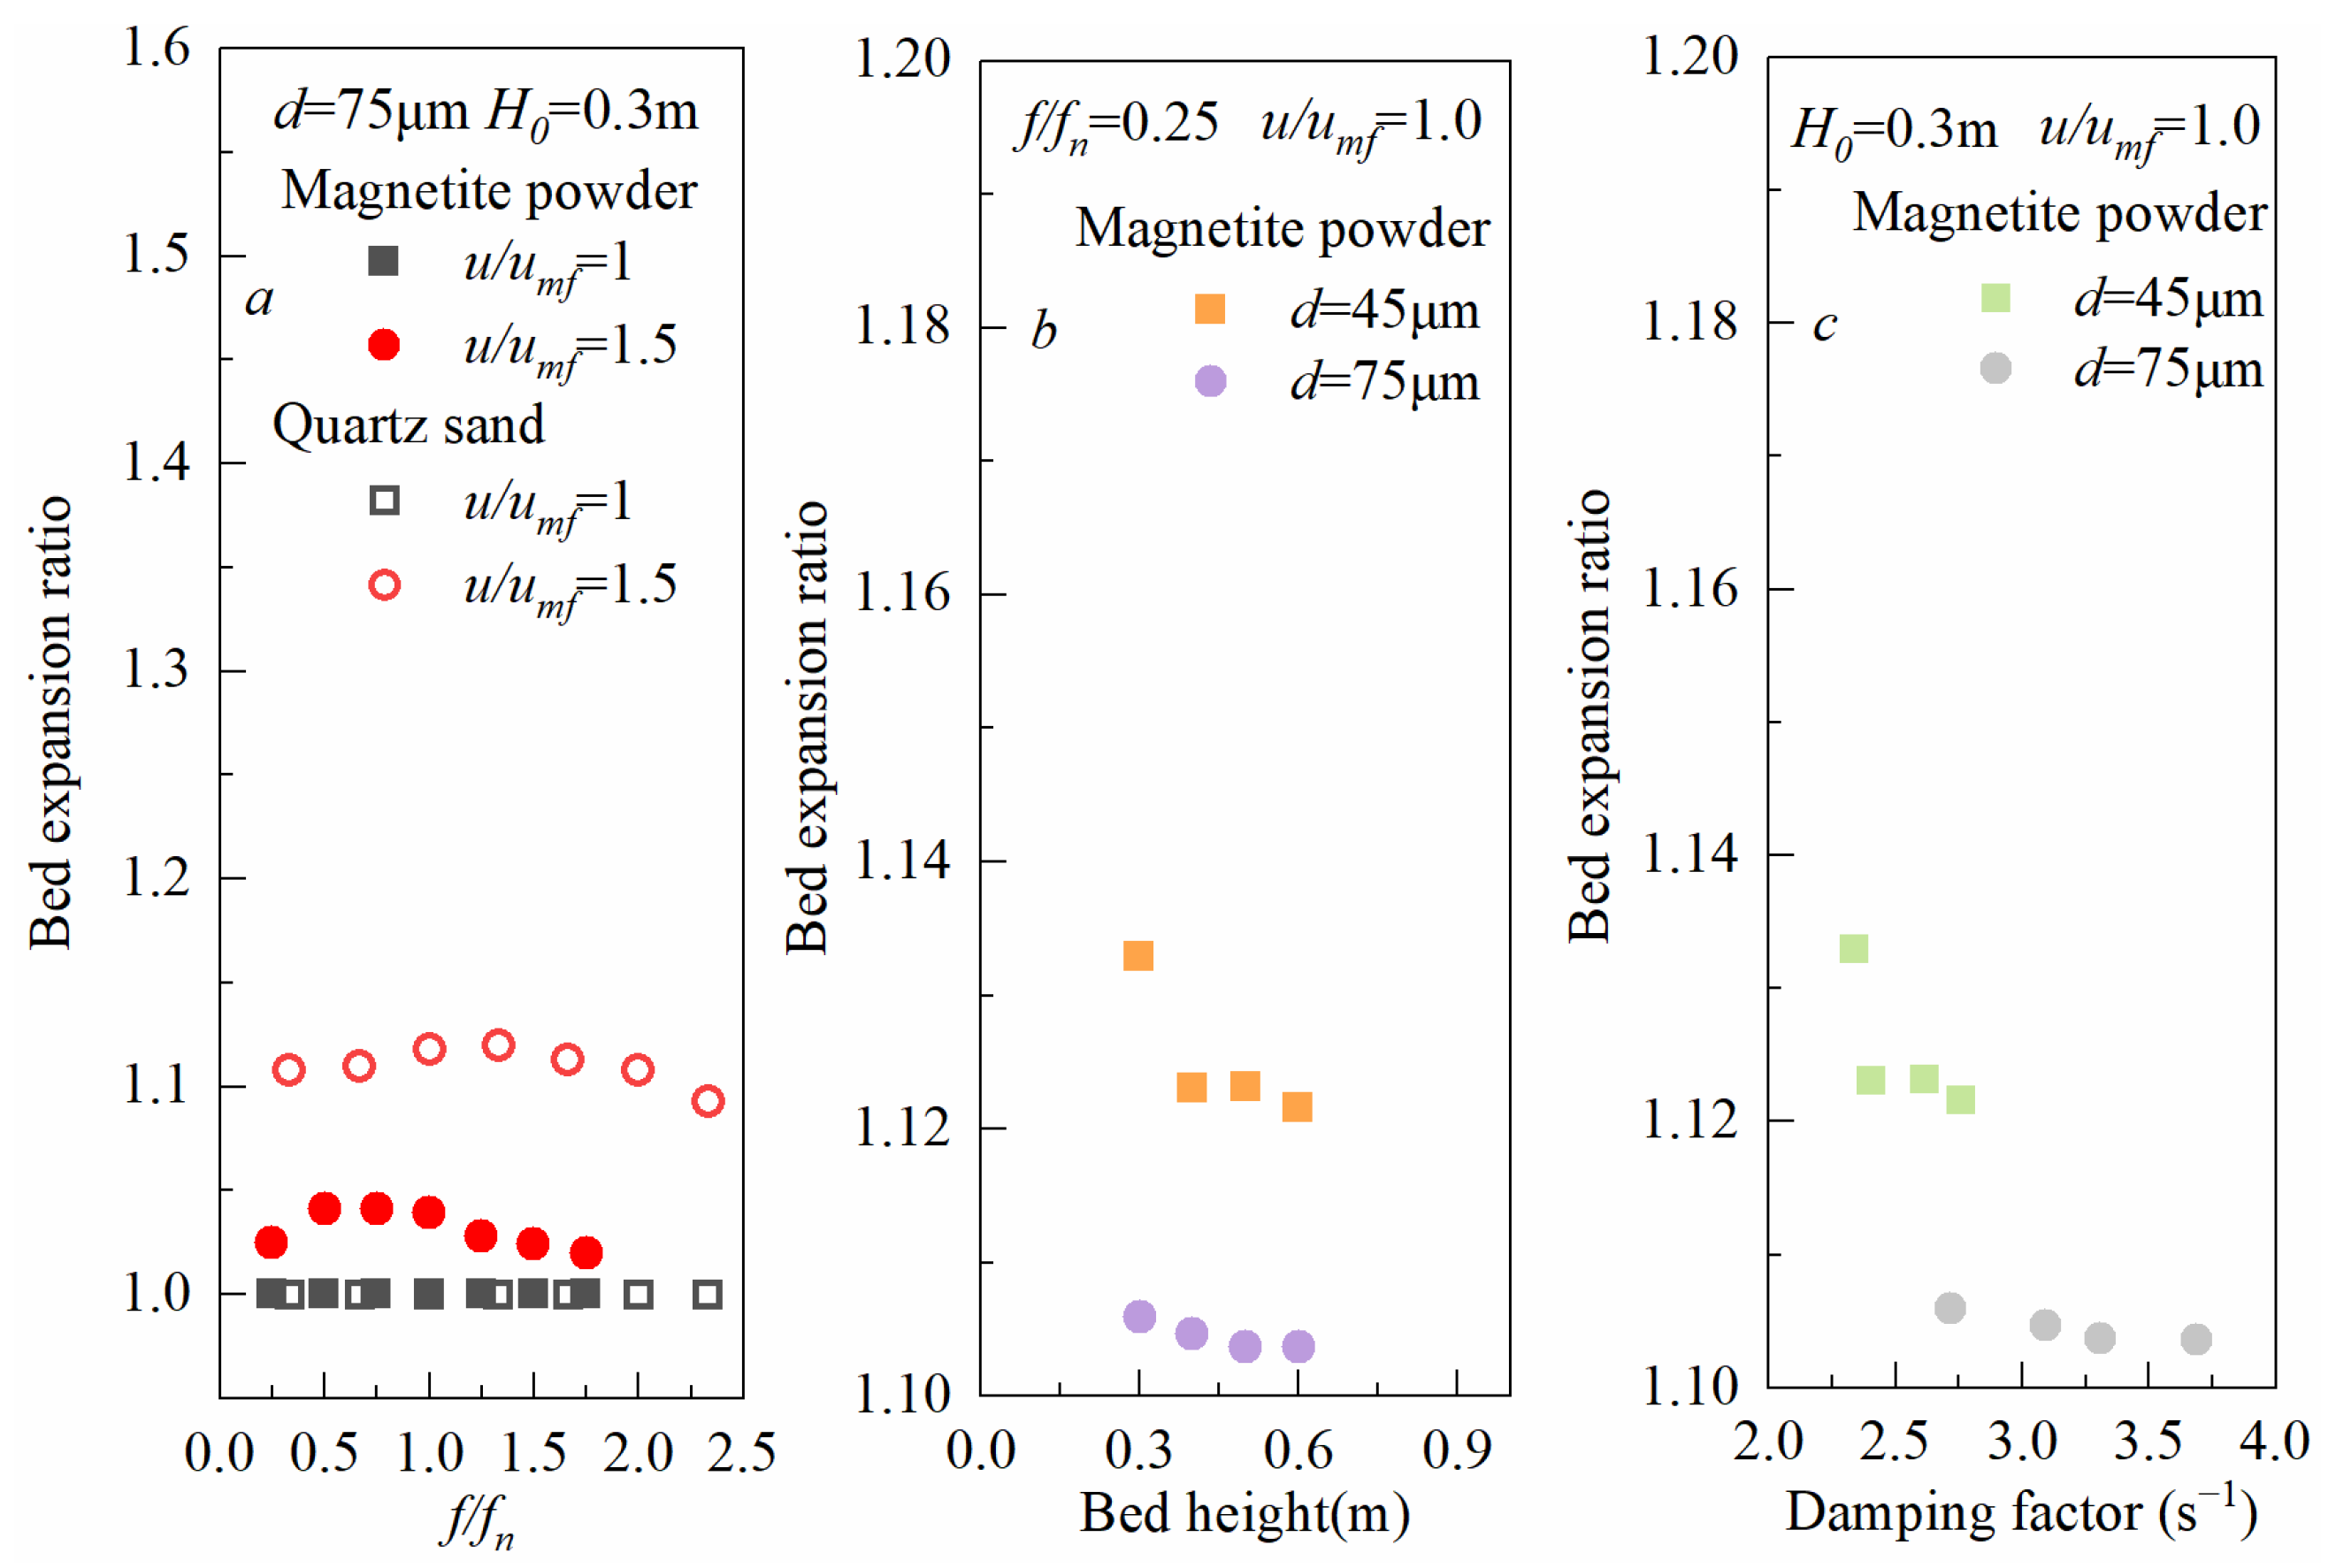
The analysis in Section 3 indicates that the bed expansion ratio is typically influenced by factors such as particle density, particle size, gas velocity, pulsation frequency, and bed height, as illustrated in Figure 3a,b. As the particle size, particle density, and bed height increase, the bed expansion ratio consistently decreases. Conversely, an increase in gas velocity leads to a continual rise in the bed expansion ratio. Furthermore, when the natural frequency of the bed reaches a specific fixed value, increasing the pulsation frequency results in an initial increase followed by a decrease in bed height.
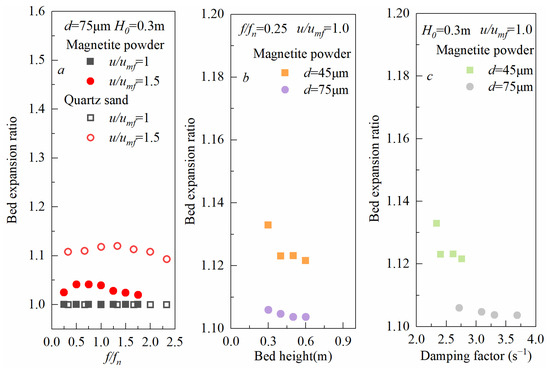
Figure 3.
Variation law of bed expansion ratio ((a): Relationship between the bed expansion ratio and f/fn; (b): Relationship between the bed expansion ratio and bed height; (c): Relationship between the bed expansion ratio and damping factor).
However, the existing research has demonstrated that the efficiency of vibrational energy transfer is also affected by the natural frequency (fn). This gives rise to a dimensionless number (f/fn) that characterizes the vibrational state of fluidized beds [27]. When f/fn = 1, resonance occurs within the fluidized bed, leading to a significant increase in the bed expansion ratio. Additionally, fluidized beds are influenced by the damping factor (β); higher damping coefficients result in increased dissipation rates. As shown in Figure 3c, an increase in the damping coefficient causes a reduction in the bed expansion ratio.
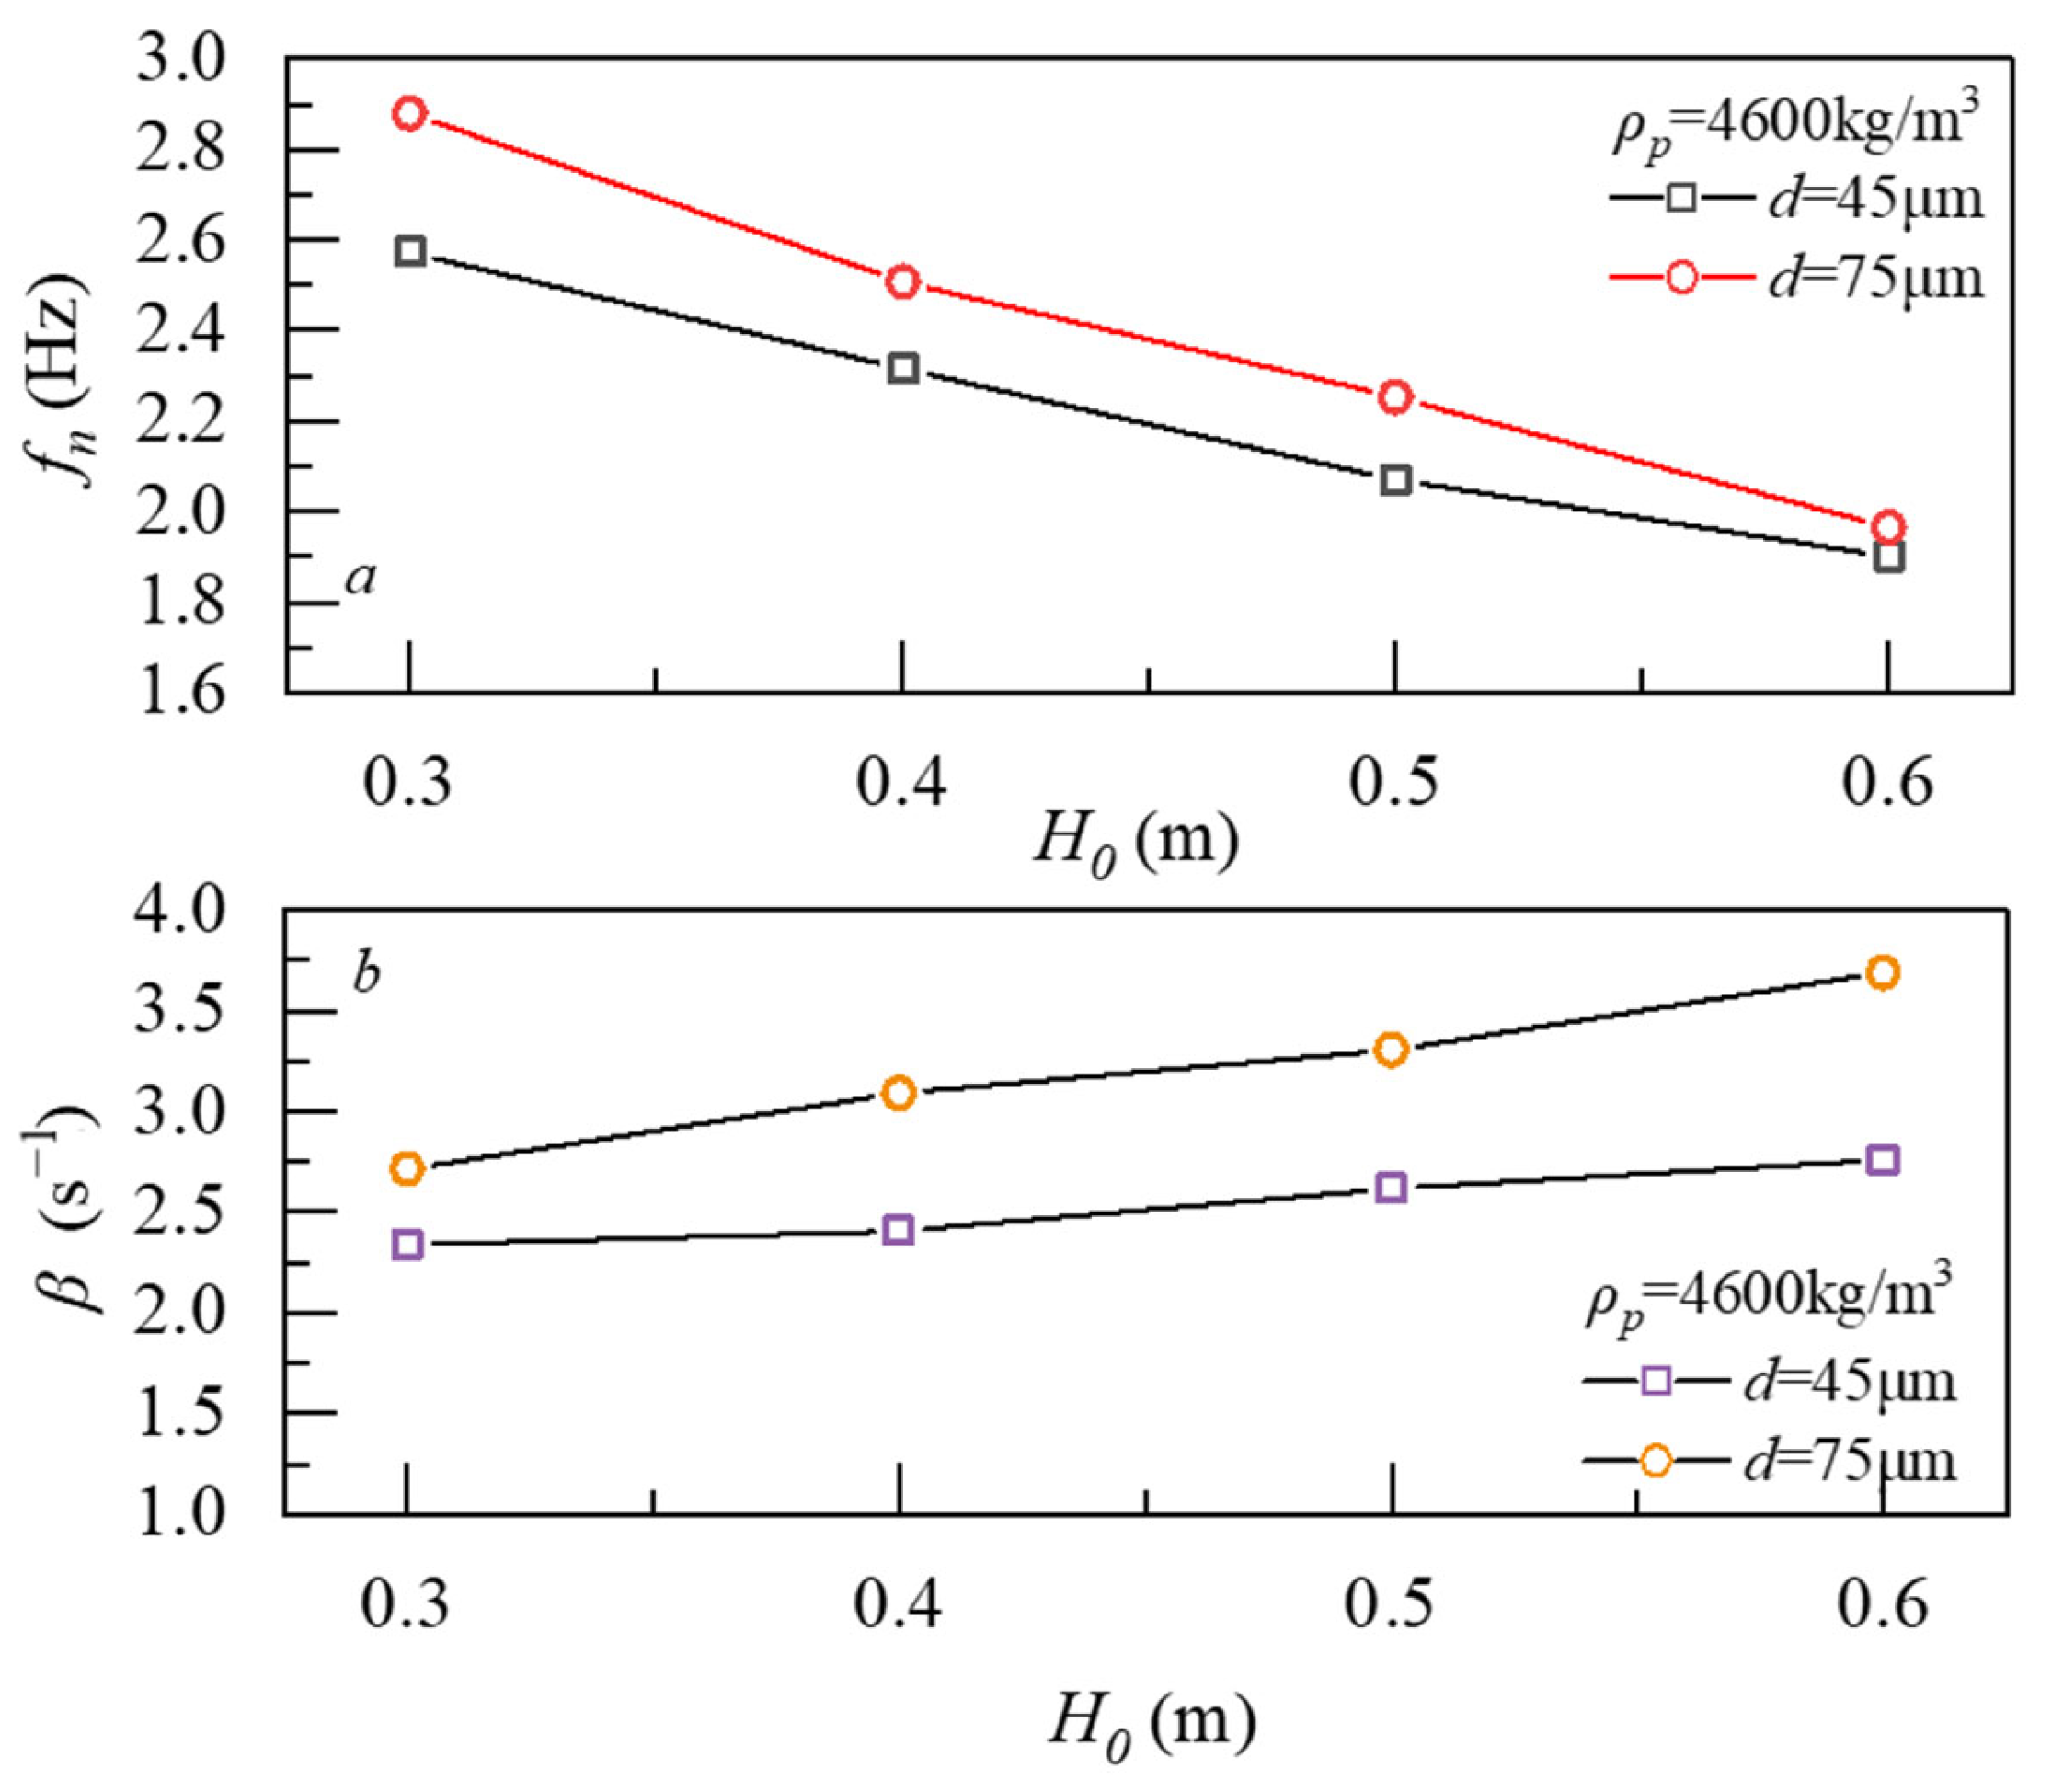
It is important to note that both natural frequency and the damping factor are related to factors such as the bed height, particle size, and density—as depicted in Figure 4. Therefore; the approach will consider particle density, particle size, gas velocity, pulsation frequency, and bed height as characteristic parameters for predicting the bed expansion ratio in Section 4.
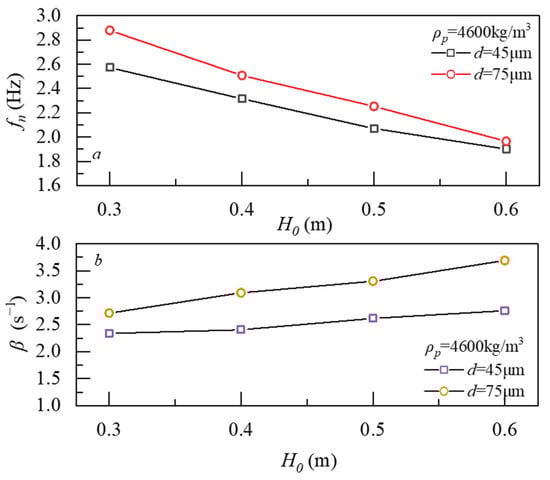
Figure 4.
Variation of natural frequency and damping factor ((a): Variation of natural frequency; (b): Variation of damping factor).
Moreover, the pulsed fluidized bed represents a complex high-dimensional process in which its fluidization characteristics are influenced by both the aforementioned particle properties and operational parameters. In practical operations, it is essential to monitor and adjust particle properties and operational parameters in real time. However, due to the large volume of data involved and the numerous degrees of freedom associated with fluidized beds—characterized by a multitude of variables—the challenge of modeling becomes significantly more difficult. Furthermore, within the high-dimensional space of fluidized beds, data processing, feature extraction, and model training become increasingly intricate and challenging. This study aims to introduce dimensionless numbers for dimensional reduction—namely, the Reynolds number (Re), the Archimedes number (Ar), the ratio of pulsation frequency to natural frequency (f/fn), and the ratio of the initial height to the diameter of the bed (H0/D)—to update the data set. The Reynolds number and Archimedes number are both dimensionless quantities used in fluid mechanics to characterize fluid motion properties [28].
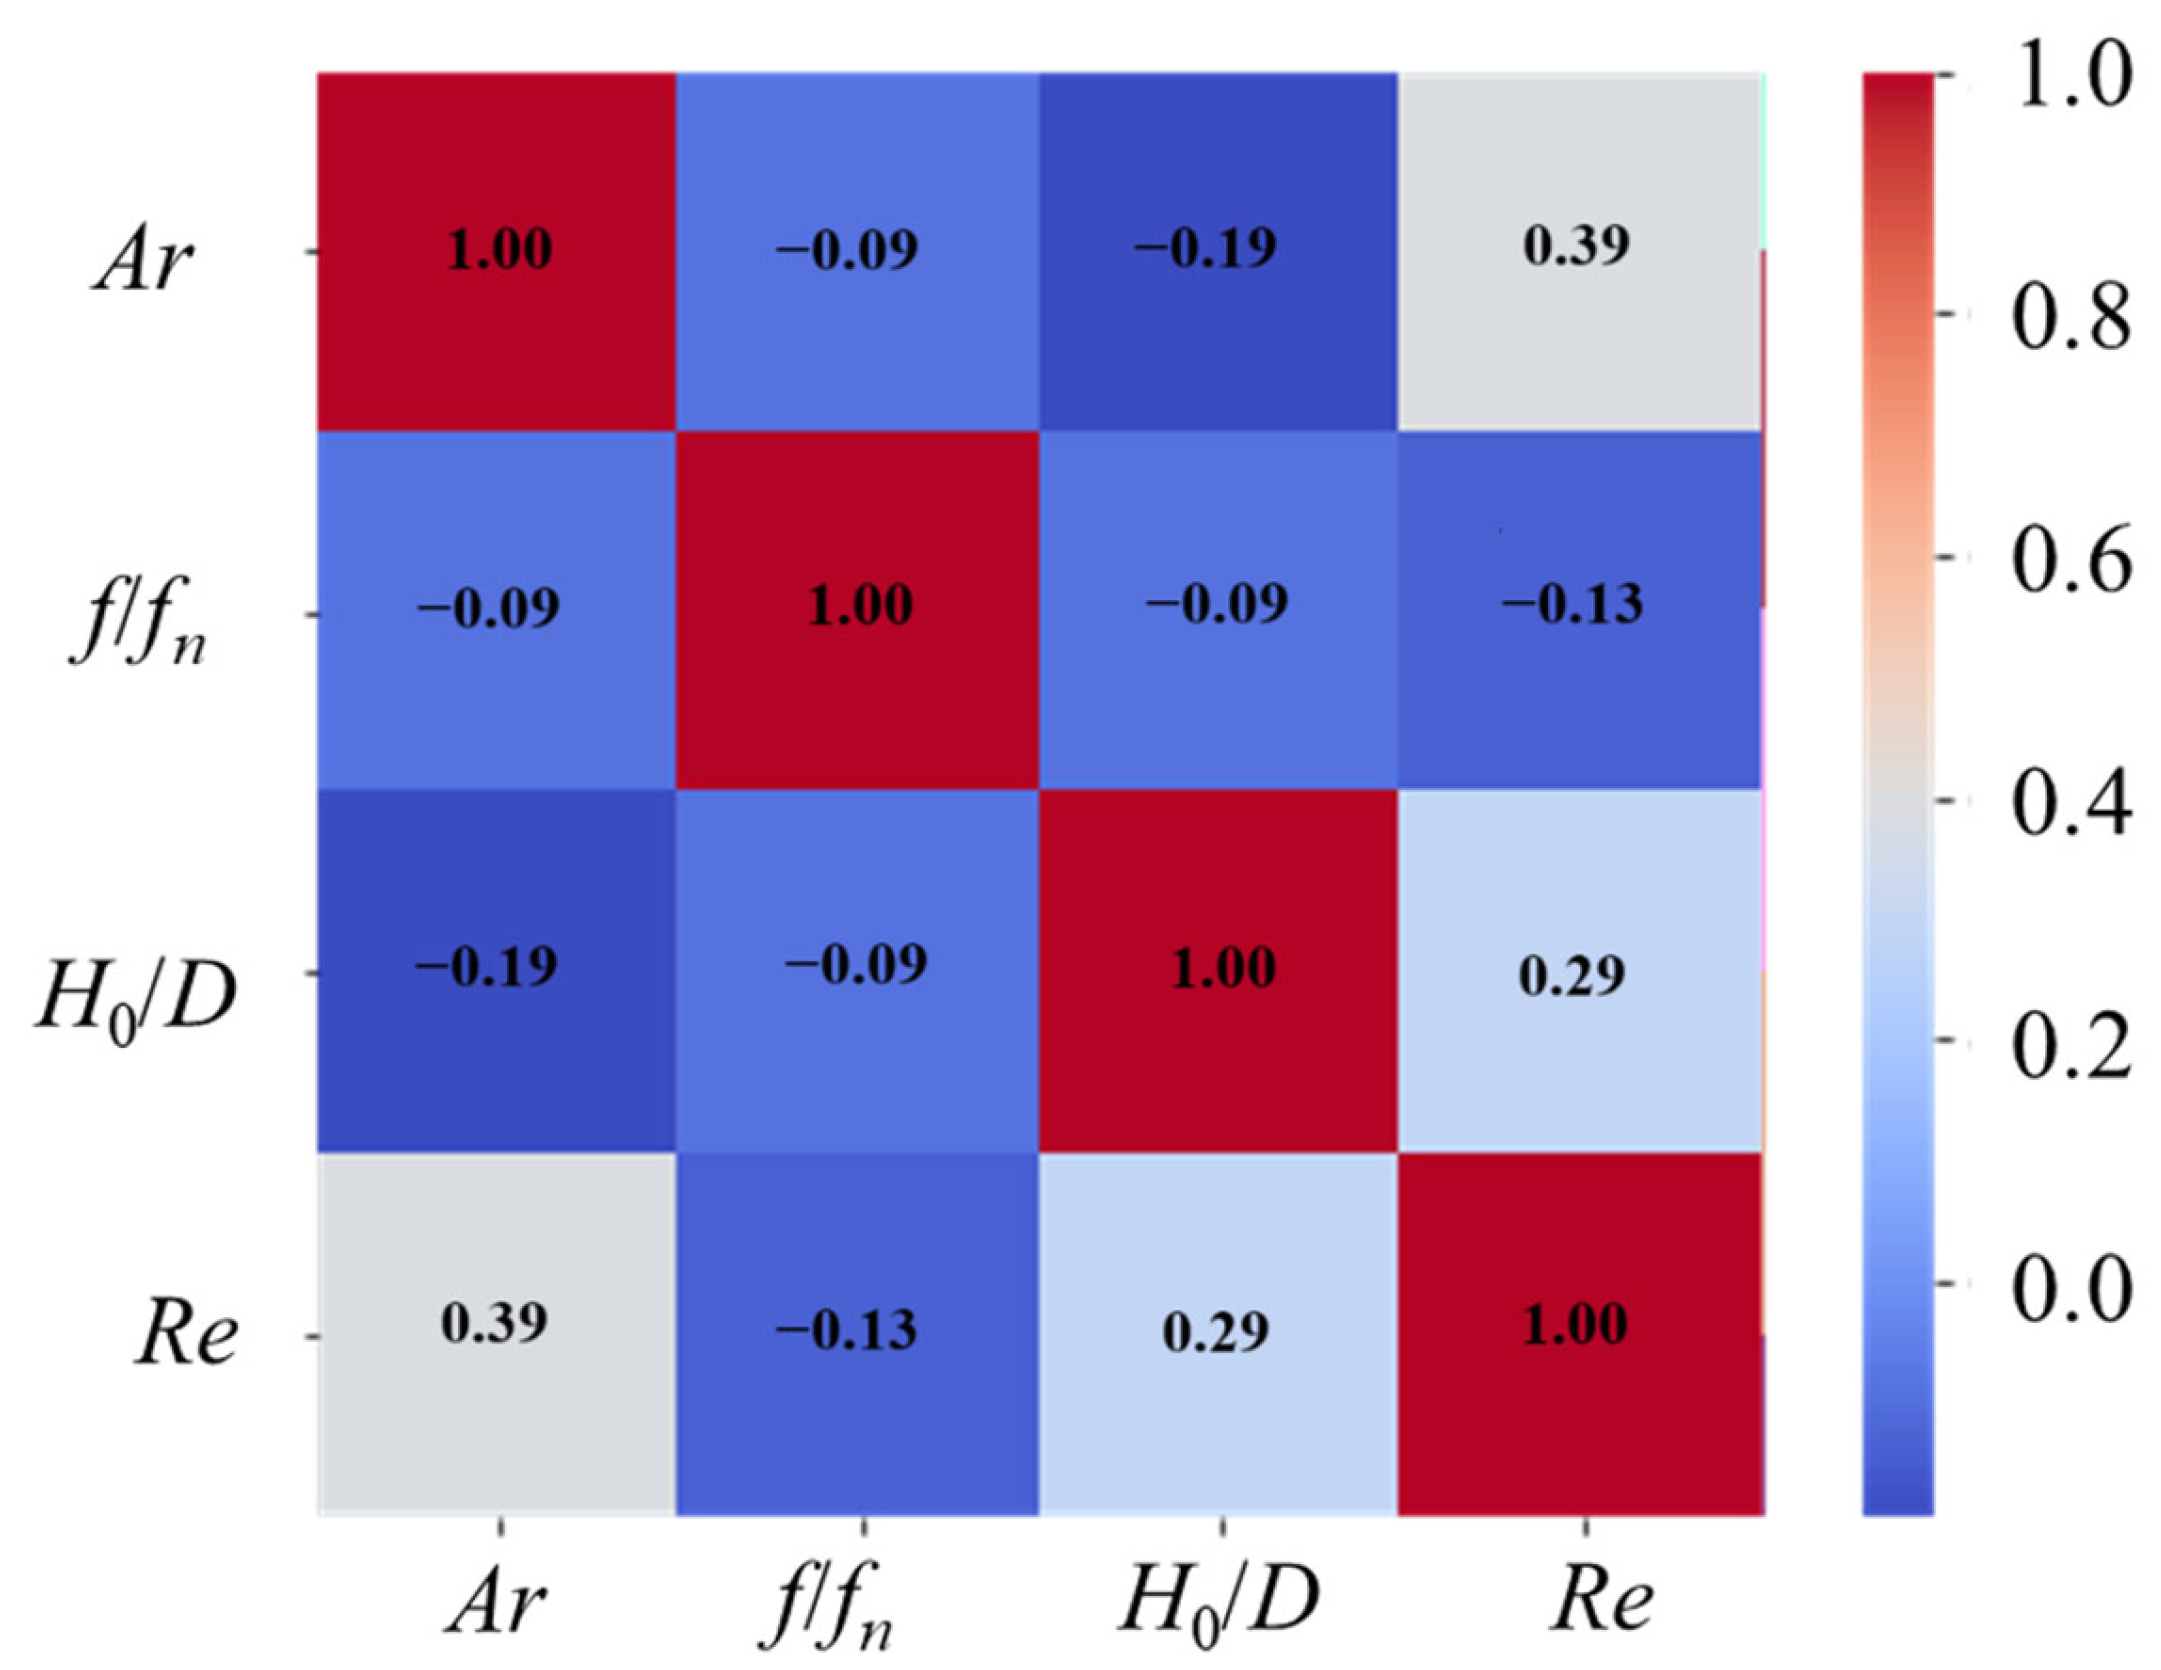
A further investigation was conducted on the correlations among the introduced dimensionless numbers. As illustrated in Figure 5, a weak correlation exists only between Re and Ar. Therefore, the aforementioned dimensionless numbers can be utilized to evaluate the predictive accuracy of the model.
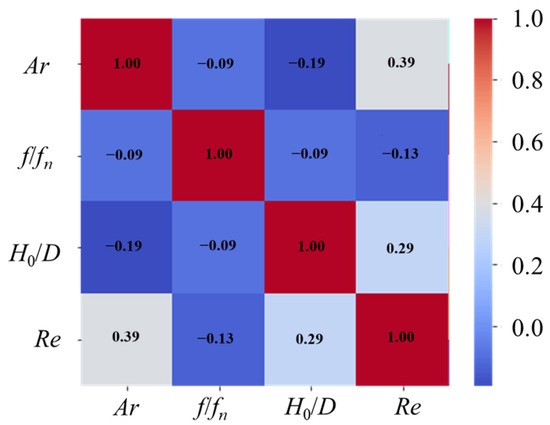
Figure 5.
Correlation heatmap.
4.2. Basic Data Processing
The 203 experimental data groups were divided into a training set and a testing set. The training set comprised 70% of the total data, utilized for model training, while the remaining 30% served to evaluate the model’s accuracy.
The ridge regression model is an enhancement of the linear regression model, designed to address the issue of excessively large coefficients that may arise in traditional linear regression. To mitigate this problem, an L2 regularization term is introduced into the mean squared error (MSE) loss function of the linear regression model, thereby penalizing overly large coefficients.
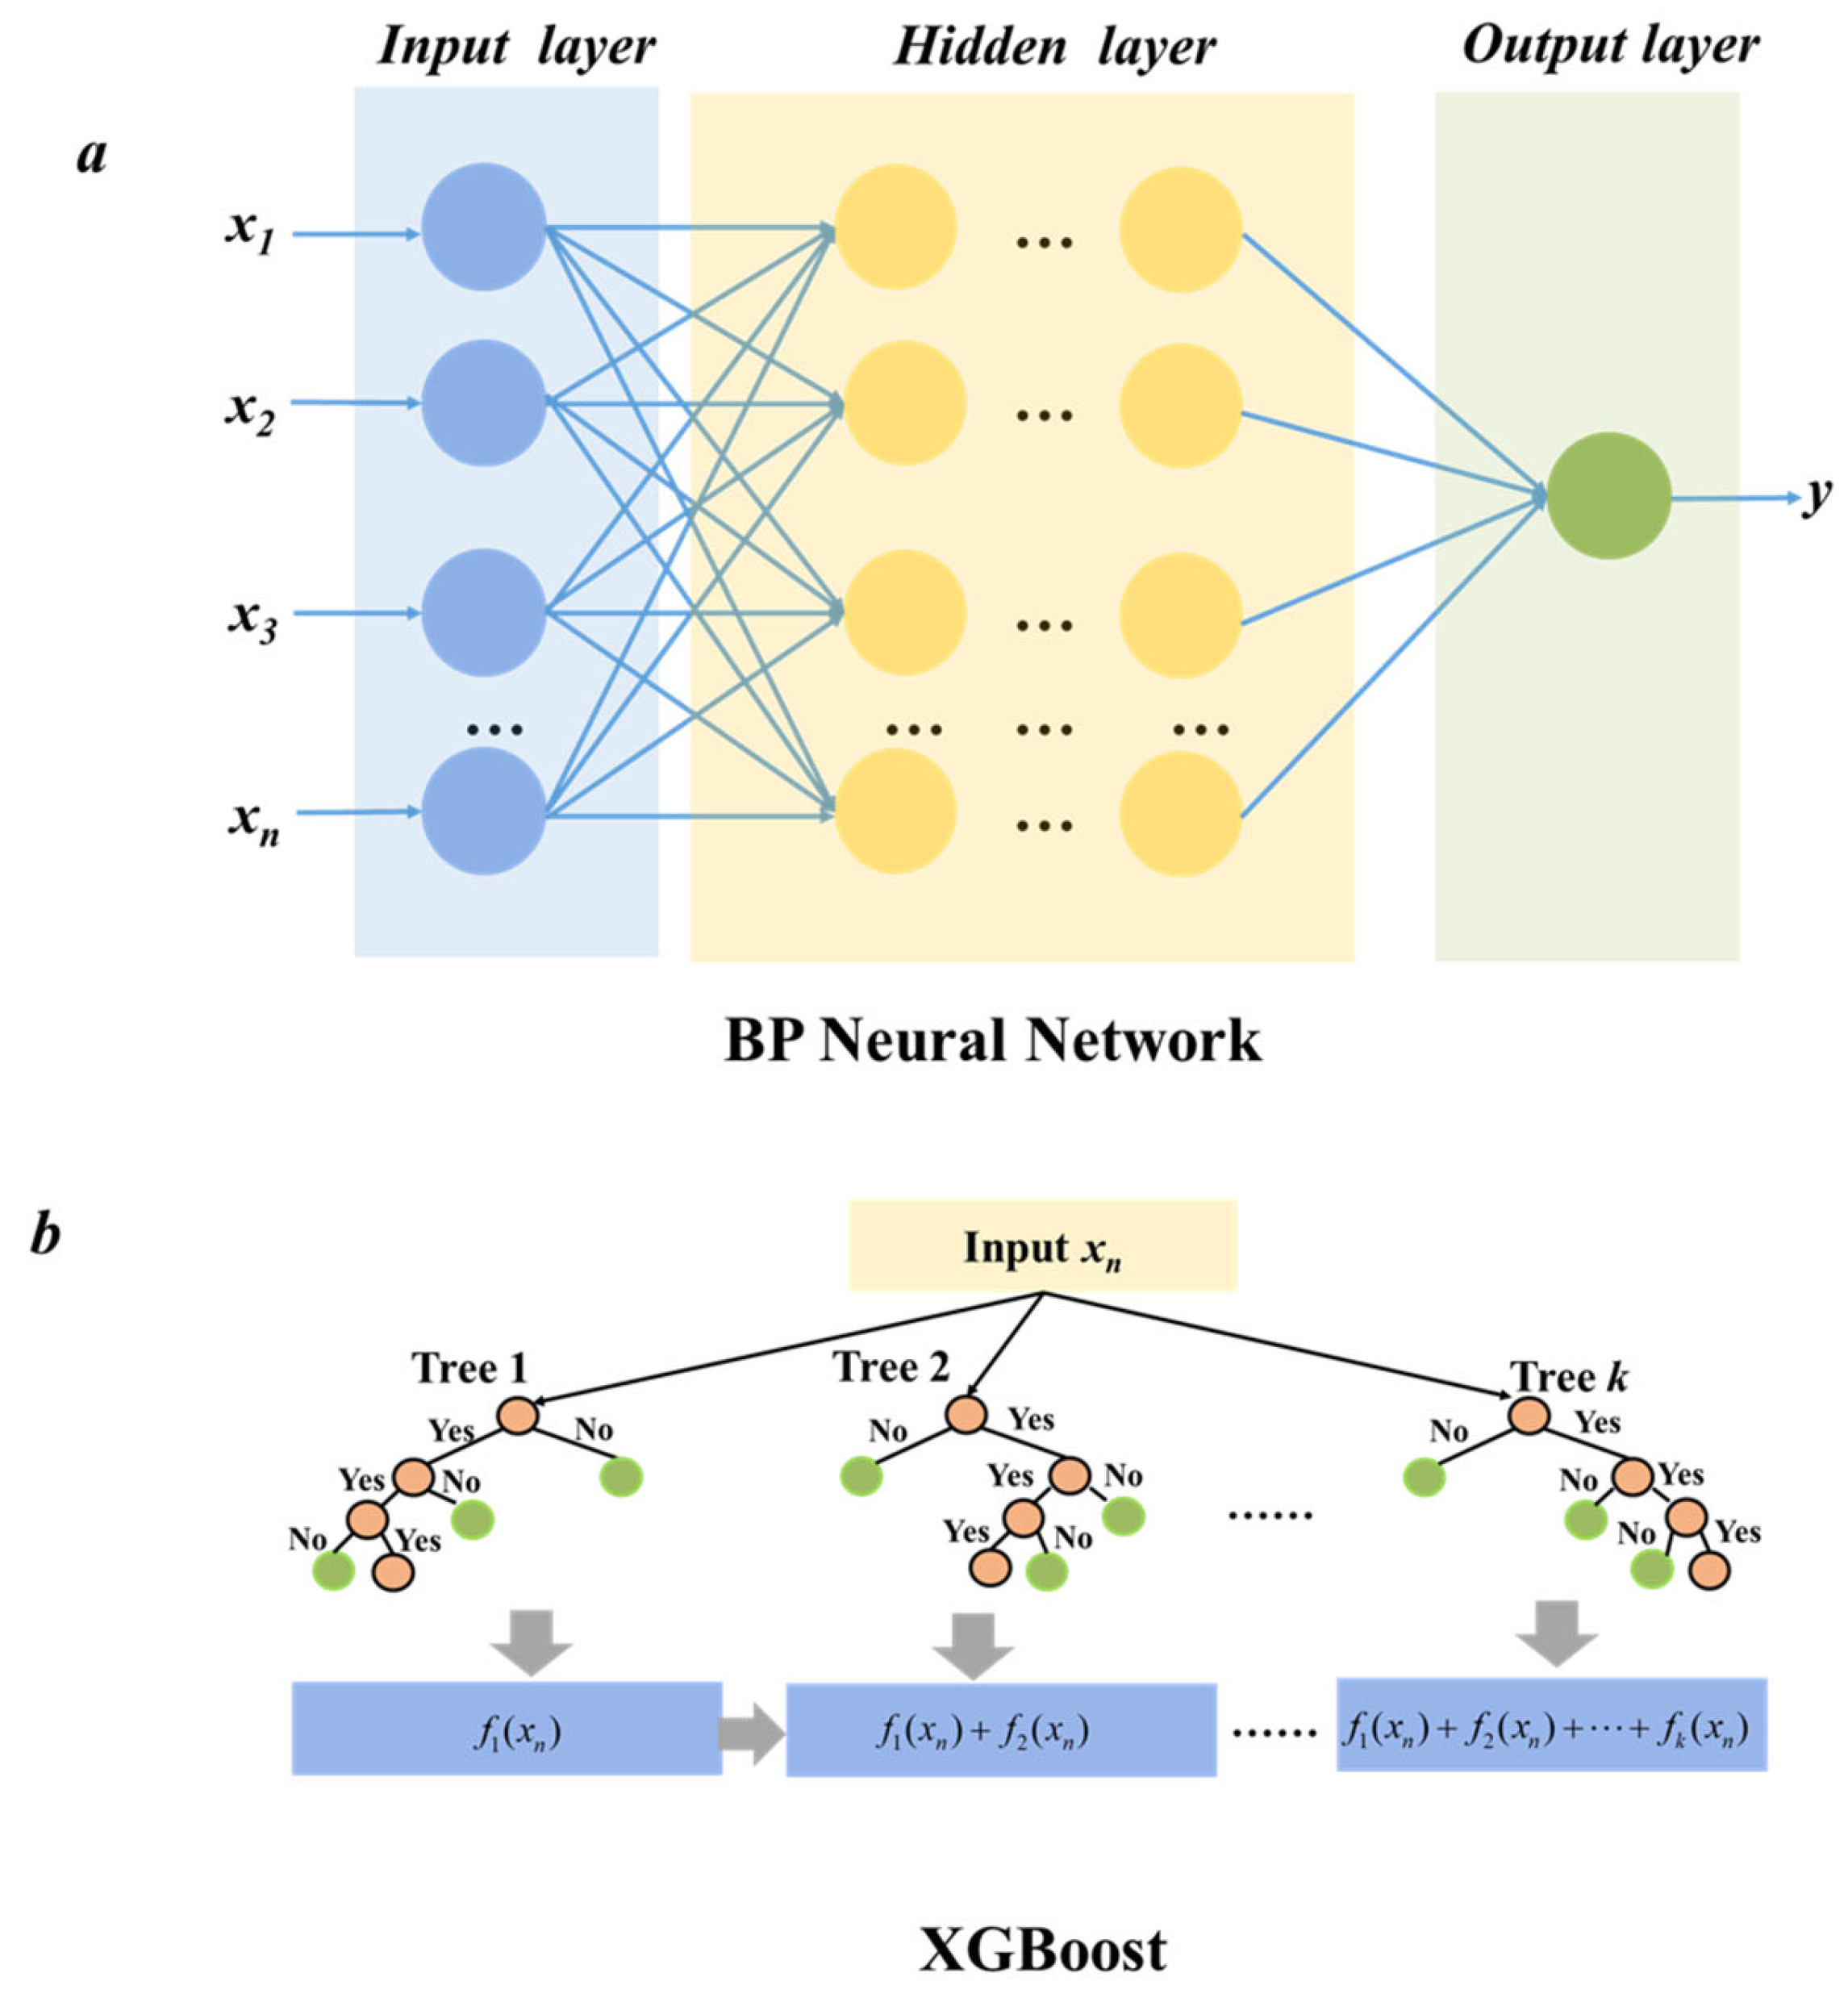
The backpropagation (BP) neural network model is a type of multilayer feedforward neural network that is trained using the error backpropagation method. It consists of an input layer, hidden layers, and an output layer, with the hidden layers comprising one or more layers. Each layer may contain multiple nodes, as illustrated in Figure 6a.

Figure 6.
Schematic diagram of BP neural network and XGBoost model ((a): BP Neural Network; (b): XGBoost).
Extreme gradient boosting (XGBoost) is an optimized ensemble tree model based on the existing gradient boosting decision tree (GBDT) framework, which demonstrates effective applicability in both classification and regression tasks [29,30]. As a forward additive model, its core lies in the adoption of ensemble learning—specifically, the boosting methodology—which integrates multiple weak learners into a single weak learner. This approach involves making collaborative decisions through multiple trees where each tree’s output represents the difference between the target value and all preceding trees’ predicted outcomes. By summing together these results, one arrives at the final prediction, thereby enhancing the overall effectiveness of the model. Additionally, this technique helps reduce both model complexity and overfitting risks. The general principles of the XGBoost model are presented in Equation (13) and Figure 6b, respectively.
where n represents the number of samples, denotes the predicted values for the samples, K indicates the total number of regression trees, k refers to the k-th tree, fk represents the k-th regression tree, and xn is defined as the feature vector of the data.
The aforementioned three machine learning algorithms were employed for model training. Subsequently, predictions on the testing-set data were made based on the trained models. The root mean square error (RMSE) and the coefficient of determination (R2) were utilized to evaluate the performance of the models.
The genetic algorithm (GA) originated from computer-simulation studies of biological phenomena and is classified as a type of search algorithm. Due to its inherent randomness and adaptive advantages, it has been widely applied to optimization problems in complex systems. In the problem-solving process, the genetic algorithm first establishes an initial population comprised of a set of potential solutions. Subsequently, following the principles of natural selection and the survival of the fittest observed in biology, individuals within the population are selected based on their fitness values through operations such as selection, crossover, and mutation to continuously generate new populations. During this process, the fitness values of different individuals are progressively optimized. Finally, when an individual meets specific convergence criteria, the search process is halted; this individual represents the optimal solution for the target problem being addressed. Therefore, a genetic algorithm is employed to identify the optimal parameters for both BP neural networks and XGBoost.
The experimental data are divided into a training data set and a testing data set, with 70% of the experimental data randomly selected to form the training data set and the remaining 30% constituting the testing data set. To mitigate the impact of different dimensions on prediction outcomes, normalization is applied to the original data, mapping feature values within the range of [0, 1]. Upon the completion of the training process, inverse normalization is performed on the predicted output values to obtain actual predictions. In order to achieve optimal model performance, the GridSearchCV method was employed for hyperparameter tuning. This process utilized 5-fold cross-validation and negative mean squared error as the scoring metric for the grid search. The primary hyperparameters, including the number of trees, optimal maximum tree depth, learning rate, and subsample size, were computed in parallel, allowing for a swift identification of the best parameter combinations. Through systematic hyperparameter optimization, the model can significantly enhance the accuracy of bed expansion ratio prediction. In the optimization process of genetic algorithms, it is essential to balance the predictive speed and accuracy of the model. This can be achieved by setting the parameters of the genetic algorithm based on previous research and practical computational costs. The population size is set to 50 to ensure diversity within the population. The number of generations for evolution is established at 50, which allows for a thorough exploration of the solution space while avoiding unnecessary computational expenses. The crossover rate is maintained at 0.5 to preserve genetic diversity within the population, and the mutation rate is set to 0.1 to prevent the algorithm from becoming trapped in local optima.
The default weak learner utilized is the decision tree-based model (gbtree). After optimization, the final parameters of the XGBoost model are as follows: a total of 60 trees; an optimal maximum tree depth set to 6; a fixed learning rate of 0.2; and a subsample parameter value of 0.51. The optimal learning rate for BP neural network is defined as 0.375.
4.3. SHAP Value
Machine learning possesses considerable potential in the realm of data prediction. However, researchers frequently neglect to offer explanations for their predictions, which creates a significant barrier to the widespread adoption of machine learning techniques [31]. The Shapley additive explanations (SHAP) value assists users in interpreting the predictions made by complex models. The SHAP value is a widely utilized method, primarily rooted in cooperative game theory (CGT), to explain the predictive outcomes of various models, including both classification and regression tasks. This approach is particularly valuable for elucidating the reasons behind predictions made using complex black-box models. SHAP quantifies the contribution of each feature to the model’s predictions and interprets these predictions as the sum of Shapley values associated with each input feature.
The SHAP framework represents the objective function of a model as a linear combination of input variables, with each variable’s contribution elucidated through Shapley values. When the objective function, f, encompasses multiple input variables, the predicted output, f(x), can be expressed as follows in terms of a binary linear function:
where f(x) denotes the predicted value of the sample within the decision tree. ∈ {0, 1}M indicates the number of features that are included in the decision path for a given sample, out of a total of M features. For a given sample, if a particular feature is not included in its decision path, the corresponding SHAP value for that feature will be zero. This indicates that the feature does not contribute to the attribution of the sample and has no impact on the final predicted value. signifies the baseline value provided via the model, which corresponds to its mean prediction, and refers to the contribution value of the i-th feature, also known as SHAP values.
According to the aforementioned formula, the output of the objective function for a sample can be viewed as the sum of all SHAP values of the input variables within that sample, along with a baseline value. Therefore, calculating SHAP values allows for an interpretation of the model. Based on Shapley values from cooperative game theory proposed by Shapley [32], the SHAP value can be expressed as follows:
where N represents the set of all features in the training data set, with a dimensionality of M, and S denotes a subset extracted from M, characterized by a dimensionality of . Furthermore, is calculated as the mean value of the samples based on the feature set S, with the addition of feature i, refers to the calculation of the sample mean solely based on the feature set, represents the weight of the difference in sample values under the subset of features S, specifically considering both scenarios: one that includes feature i and another that excludes it.
5. Evaluation of Prediction Accuracy in Machine Learning
5.1. Ridge Regression Model
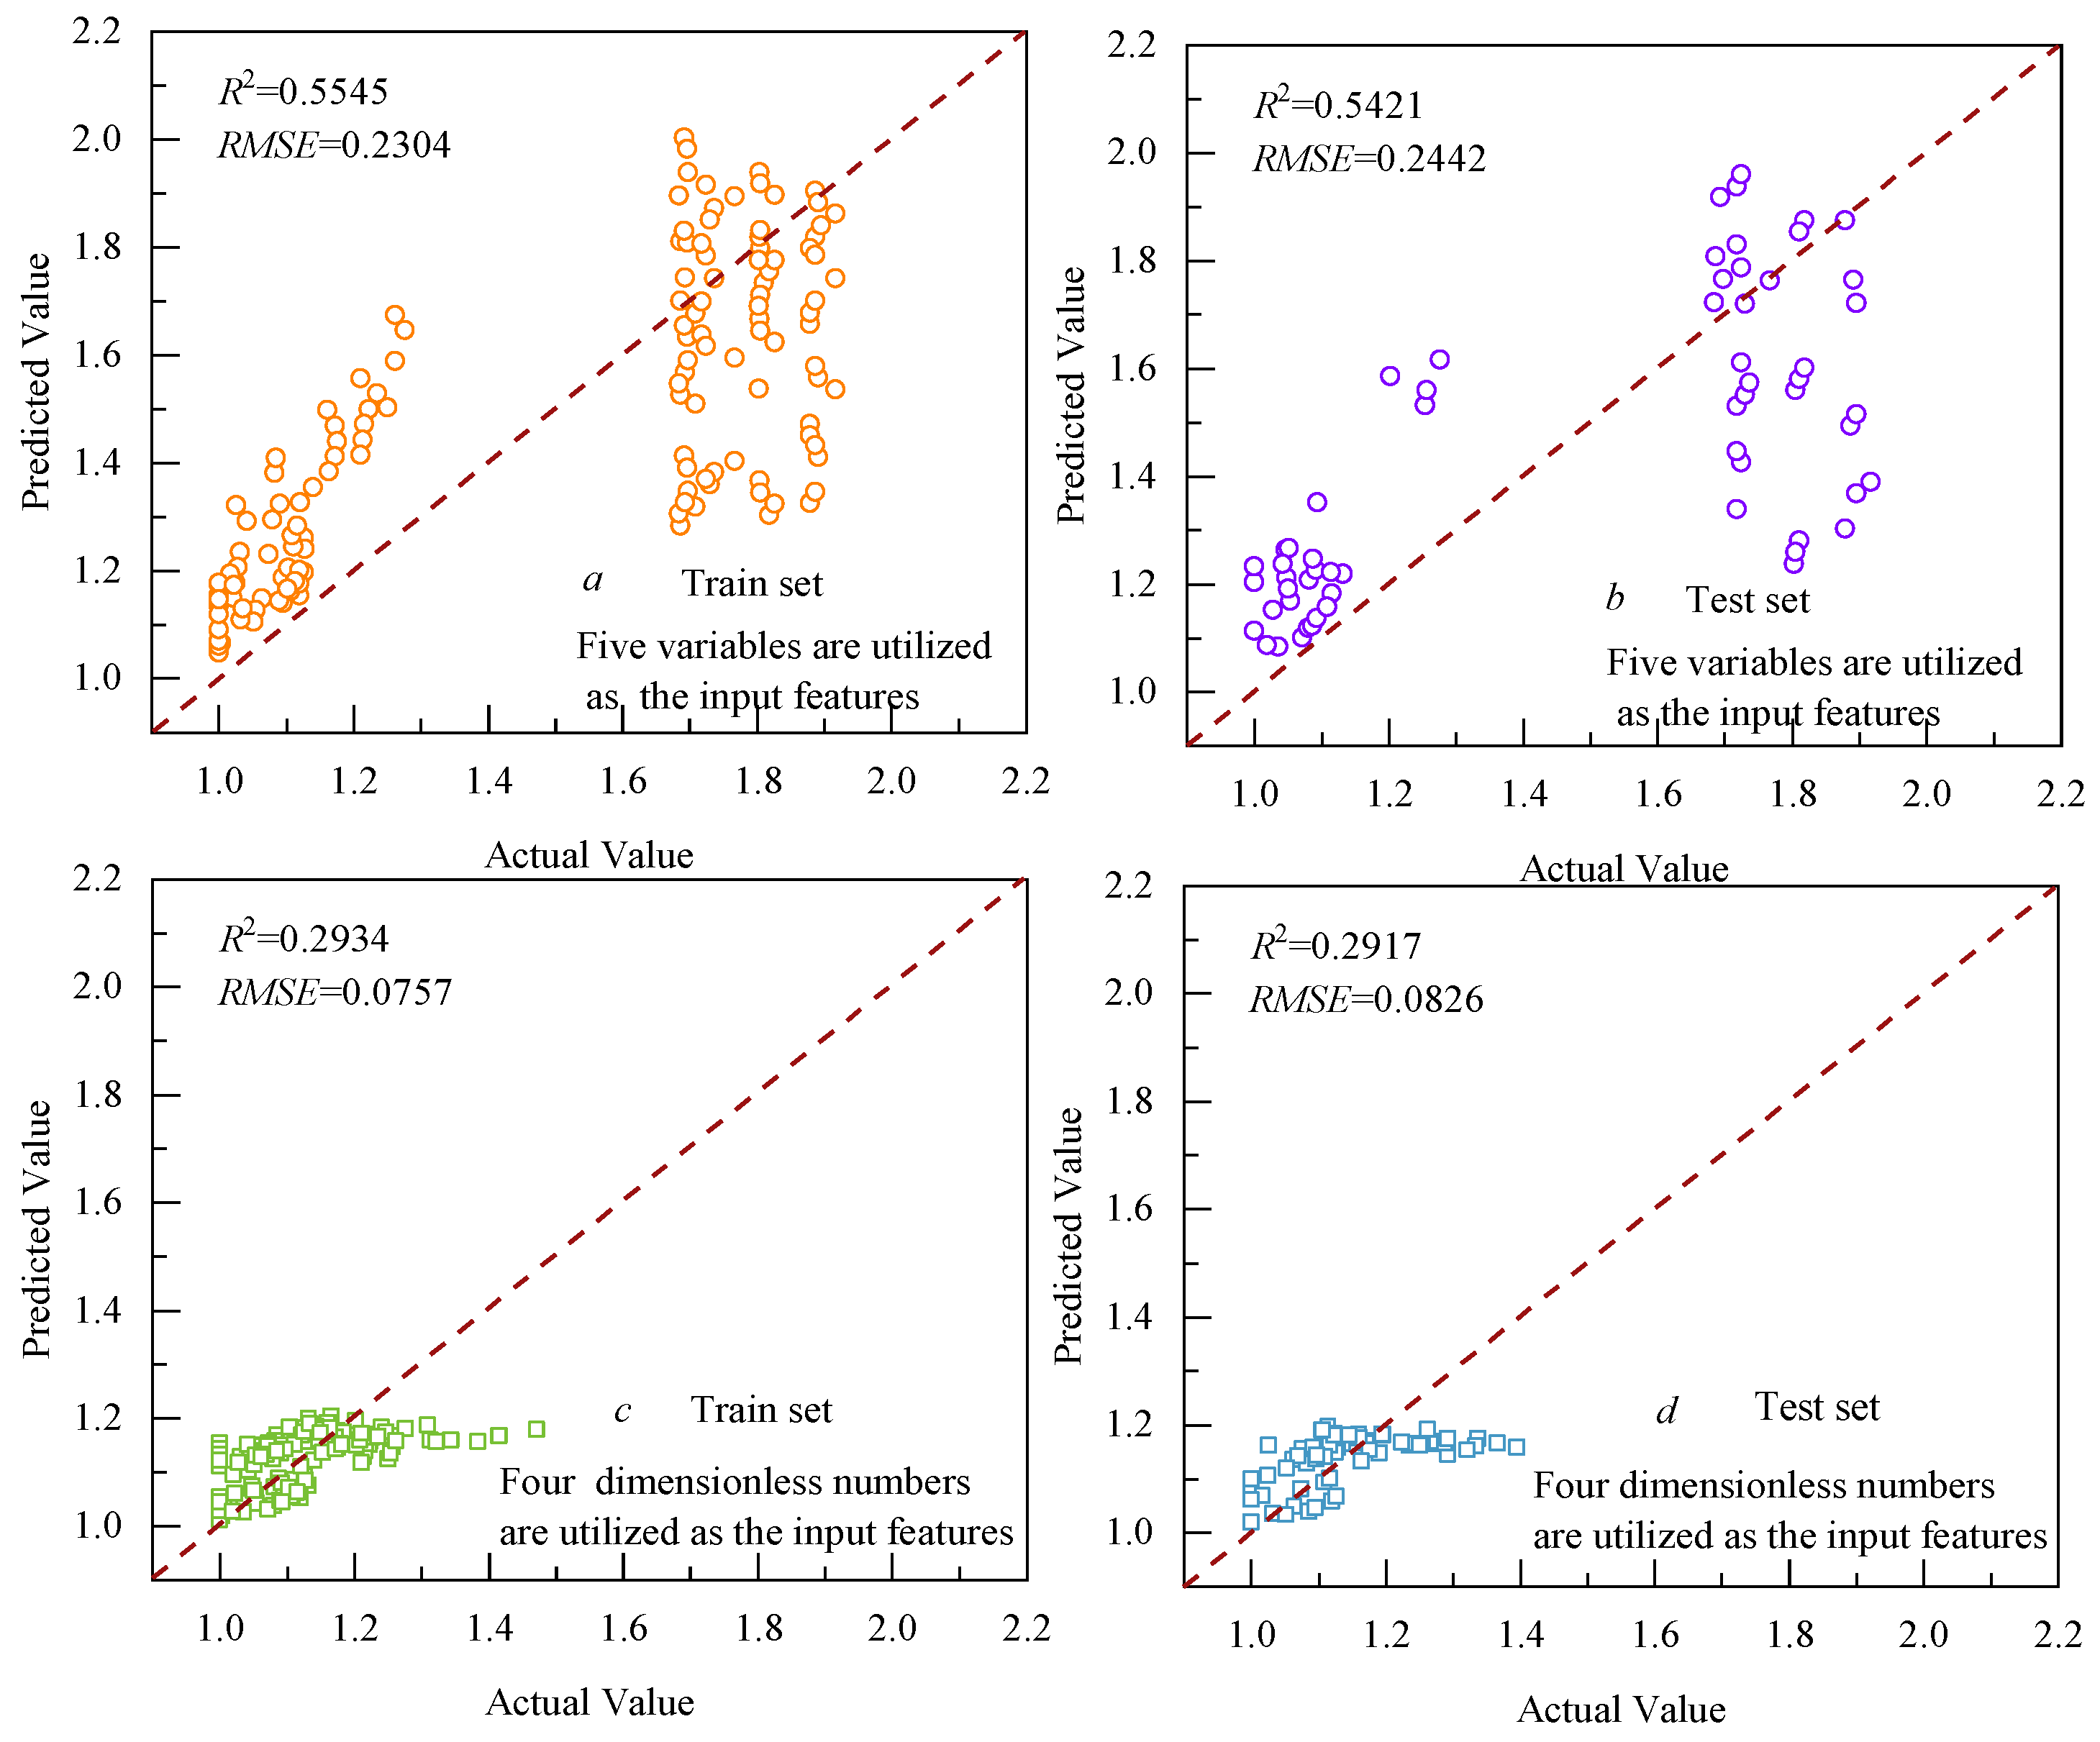
To begin with, the ridge regression model was executed to validate its suitability for determining whether the data exhibits linear regression characteristics. According to Section 4.1, the bed expansion ratio is related to particle size, density, gas velocity, pulsation frequency, and bed height. Therefore, the model’s performance is initially evaluated using these five variables as feature parameters, as illustrated in Figure 7a,b. The ridge regression model exhibited an R2 value of only 0.5545 on the training set, which further declined to 0.5421 on the testing set. Figure 7c,d provide additional insights into the performance of the ridge regression model when four dimensionless numbers were utilized as input feature parameters. As shown in these figures, the performance of the ridge regression model is relatively unsatisfactory; specifically, the R2 for the training set is approximately 0.2917 with an RMSE of 0.0757. On the testing set, R2 is about 0.2934 with an RMSE of 0.07826. Therefore, due to its linear characteristics, it can be concluded that the ridge model is not suitable for predicting fluidized bed expansion ratios.
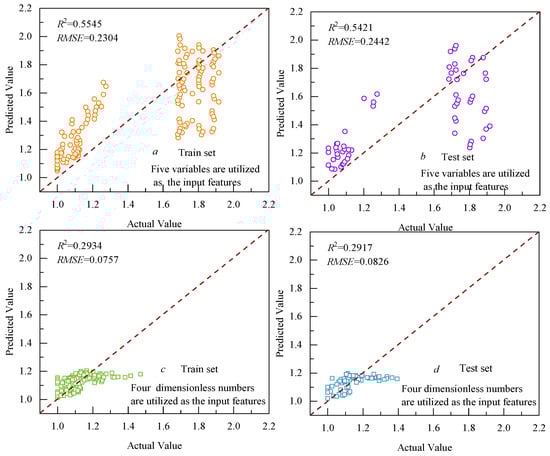
Figure 7.
Predictive accuracy of the ridge regression model ((a): Train set of five variables; (b): Test set of five variables; (c): Train set of four dimensionless numbers; (d): Test set of four dimensionless numbers).
5.2. BP Neural Network Model
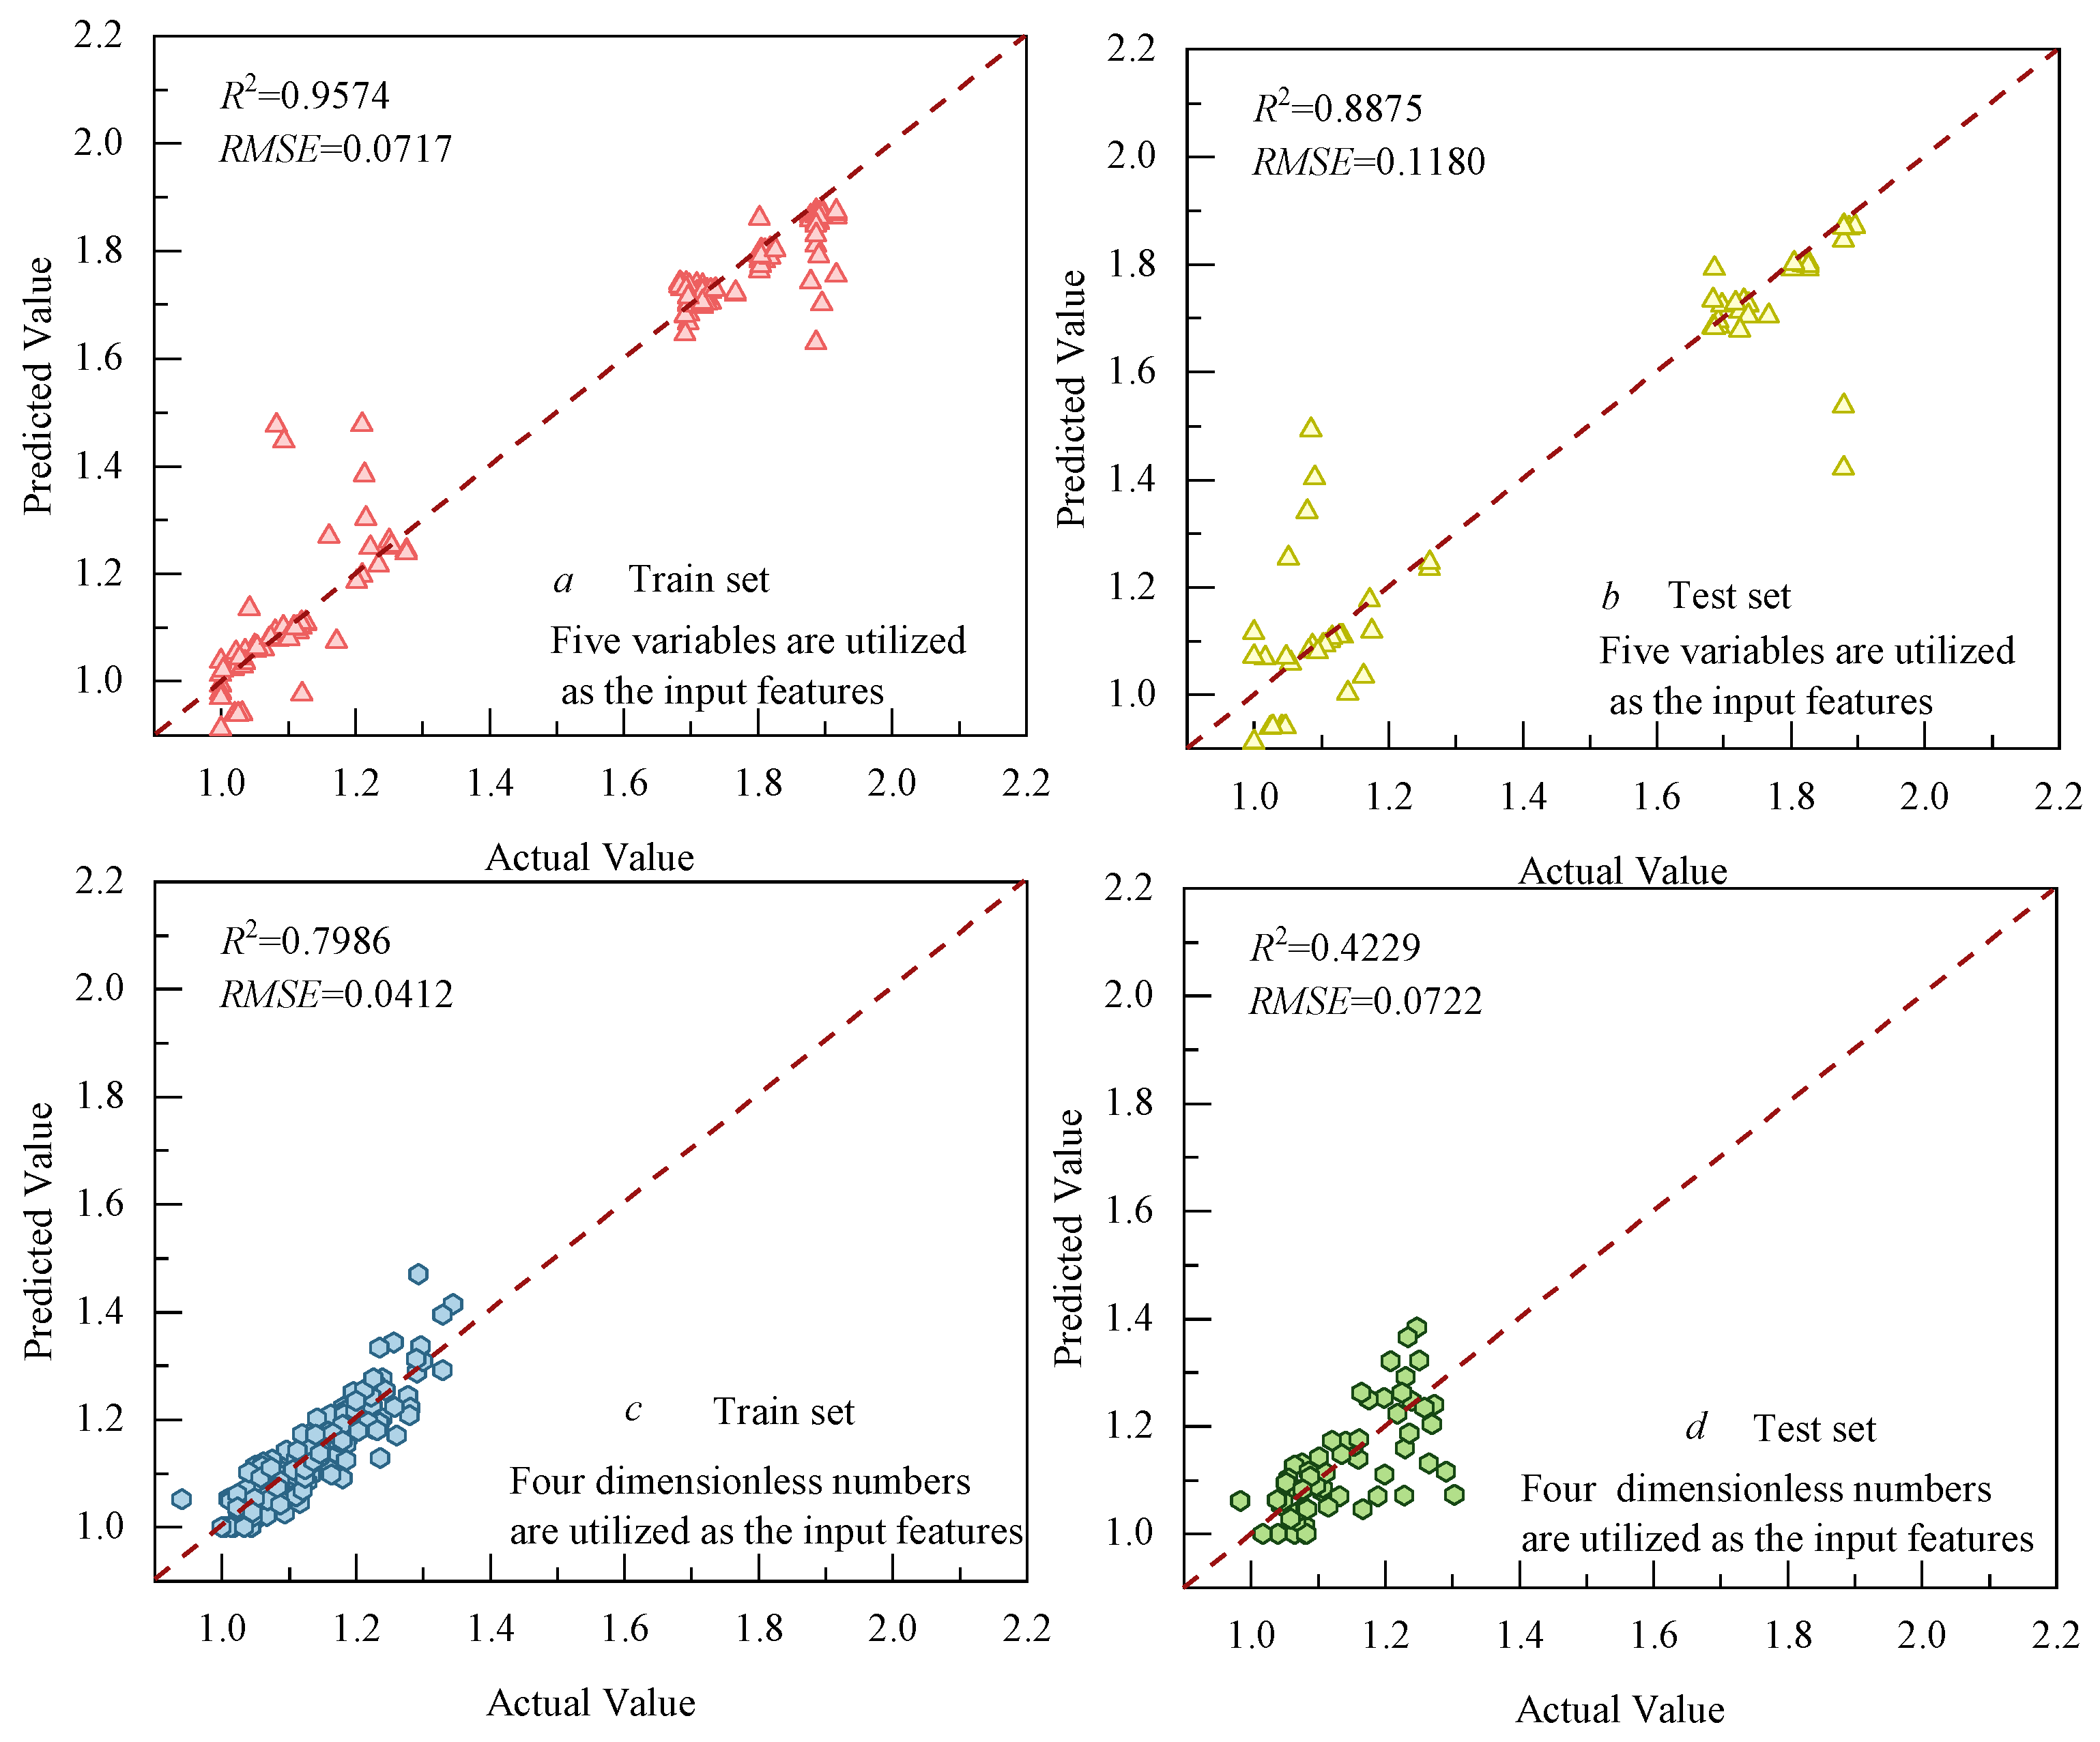
The BP neural network was utilized for prediction, as illustrated in Figure 8. The BP neural network model demonstrated superior predictive capabilities compared to the aforementioned ridge regression model. For the original feature parameters, the R2 value for the training set was 0.9574, with a corresponding RMSE of 0.0717; on the testing set, the R2 value decreased to 0.8875, and the RMSE increased to 0.1180.
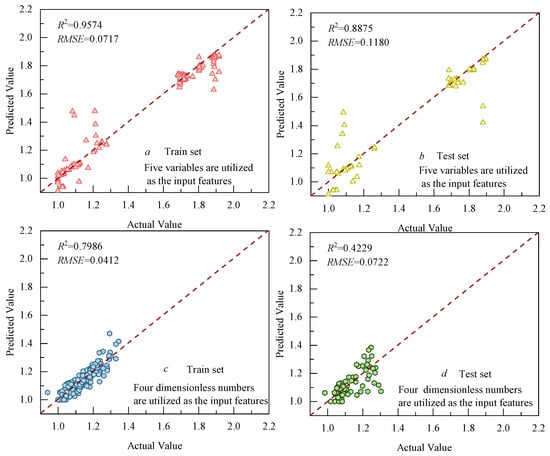
Figure 8.
Predictive accuracy of the BP neural network model ((a): Train set of five variables; (b): Test set of five variables; (c): Train set of four dimensionless numbers; (d): Test set of four dimensionless numbers).
However, when dimensionless numbers are considered, the performance of the BP neural network model remains suboptimal. The R2 value for the training set dropped to 0.7986, while it showed only 0.4229 on the testing set—significantly lower than the predictive accuracy of theoretical models described in Section 3.
5.3. XGBoost Model
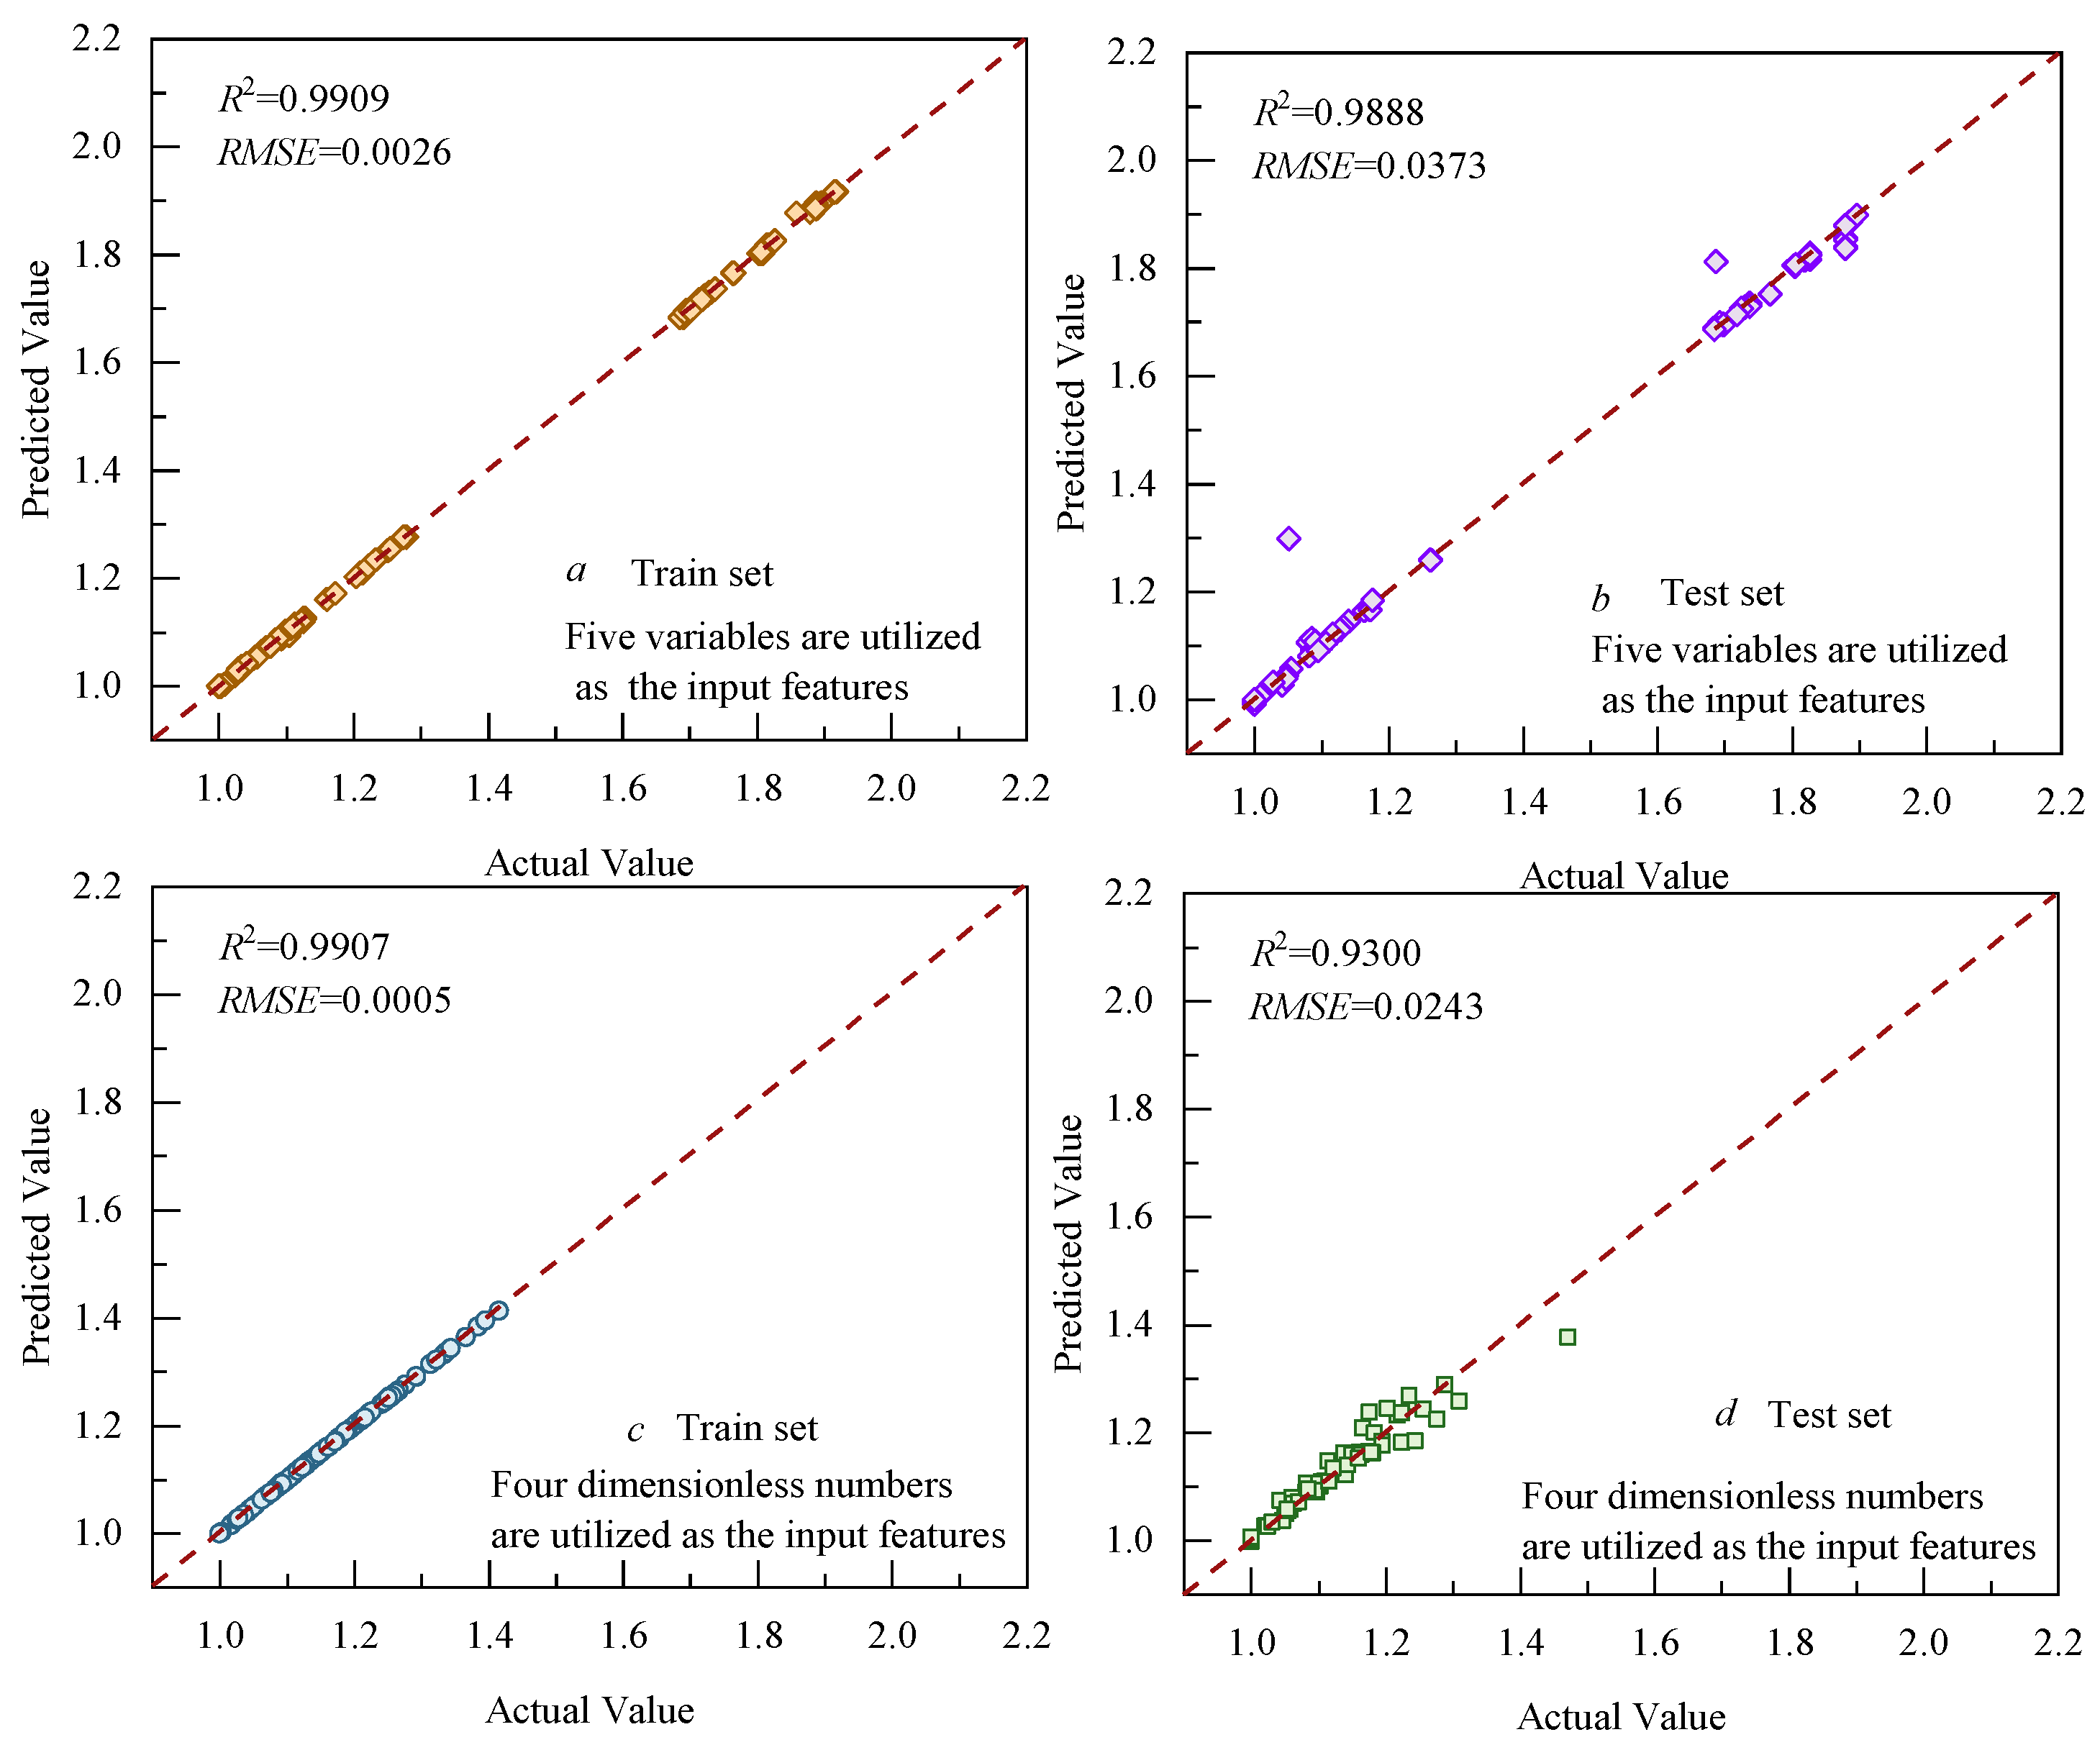
Based on the experimental data, the XGBoost model was trained. The prediction results of the original feature parameters are illustrated in Figure 9a,b. The model demonstrates excellent performance on the training set, achieving an R2 value of 0.9909, which surpasses both the BP neural network model and the theoretical model. In the testing set, the R2 value is recorded at 0.9888, indicating that the XGBoost model also possesses impressive predictive capabilities.
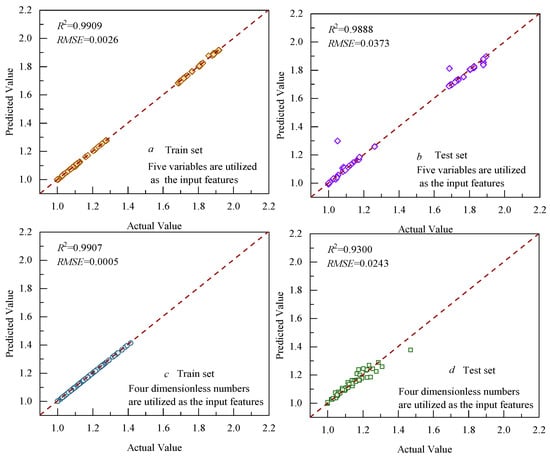
Figure 9.
Predictive accuracy of the XGBoost model ((a): Train set of five variables; (b): Test set of five variables; (c): Train set of four dimensionless numbers; (d): Test set of four dimensionless numbers).
Furthermore, a training and testing process was conducted using dimensionless data, as shown in Figure 9c,d. The R2 for the training set reached 0.9907, while, for the testing set, it achieved an impressive R2 of 0.9300. This underscores that the XGBoost model exhibits high predictive accuracy.
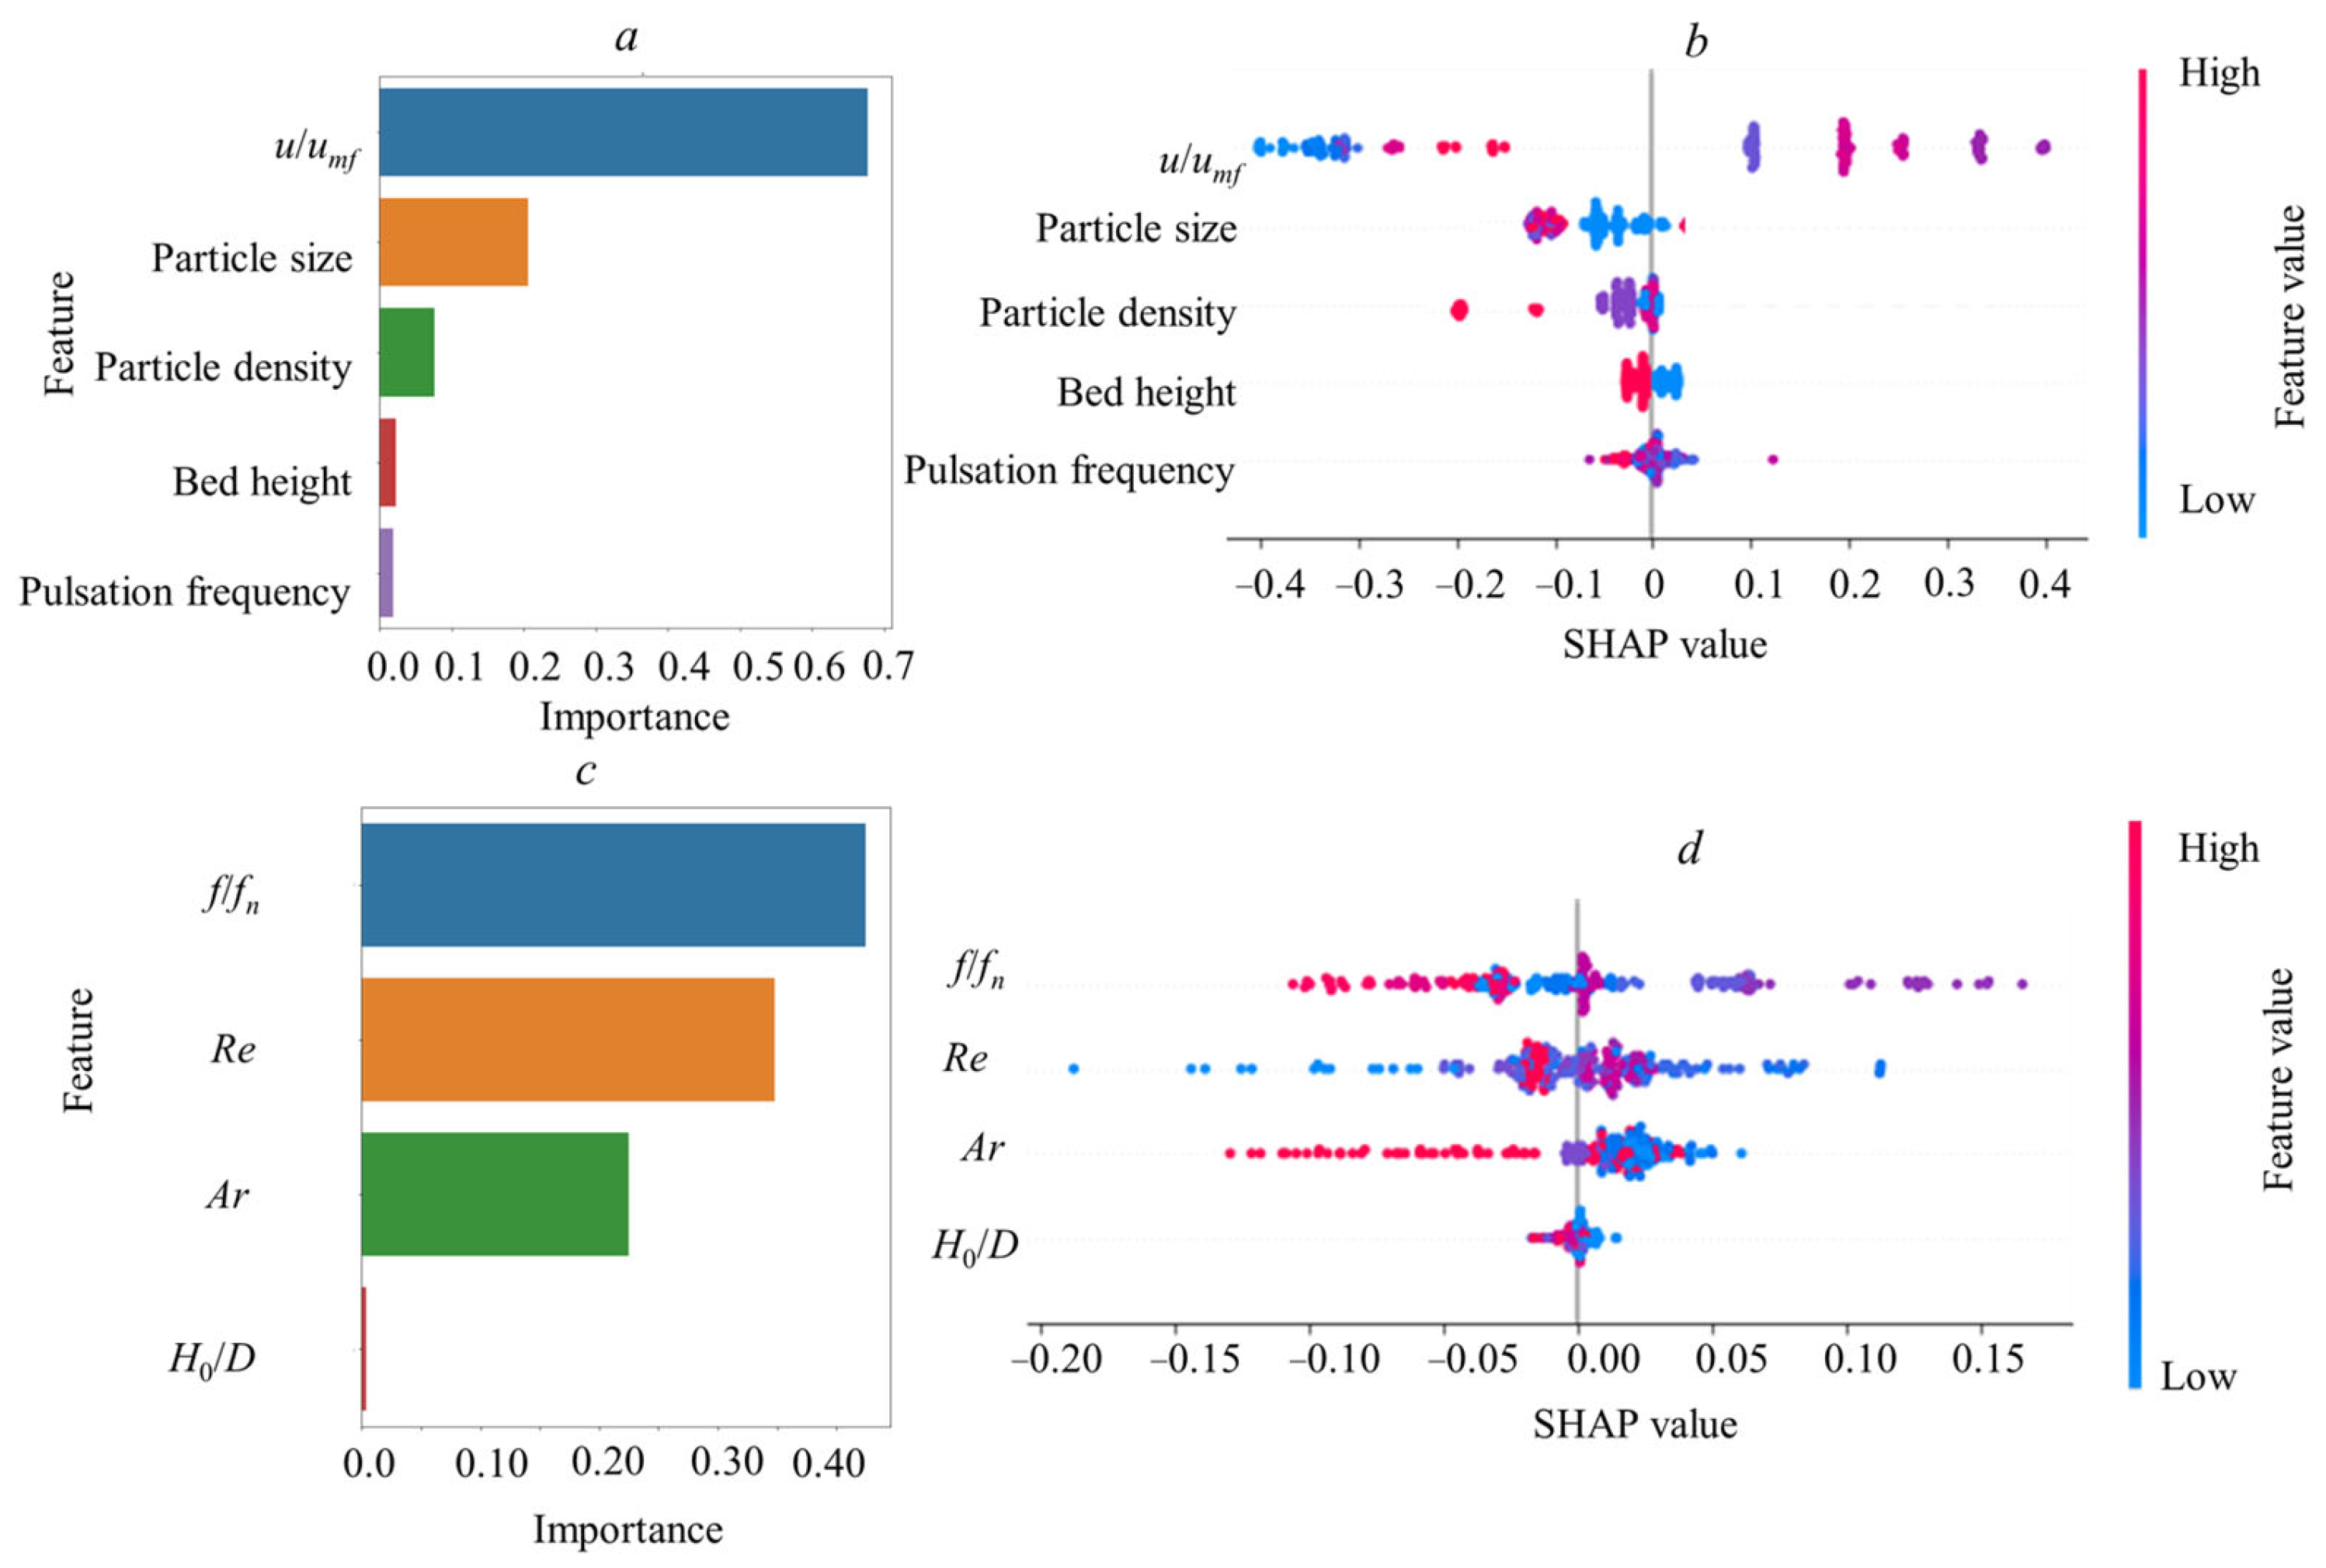
The SHAP values were utilized to conduct an interpretability analysis of the XGBoost model, with the relative importance of the original parameters illustrated in Figure 10a. Among these variables, gas velocity emerged as the most significant factor influencing bed expansion ratios. In contrast, bed height and pulsation frequency exhibited relatively weak effects. This suggests that, while bed height can impact bed expansion ratios, its influence is limited within a certain range. Furthermore, pulsation frequency typically interacts with fn, which is closely correlated with other variables. As such, relying solely on the magnitude of pulsation frequency yields little predictive power for significant variations in bed expansion ratios. Gas velocity, along with particle size and density, are identified as primary determinants affecting bed expansion ratios. Additionally, the SHAP values (as shown in Figure 10b) indicate that gas velocity has a positive impact on the bed expansion ratio, while particle size and density exert a negative influence. This ranking is further corroborated in Section 4.1.
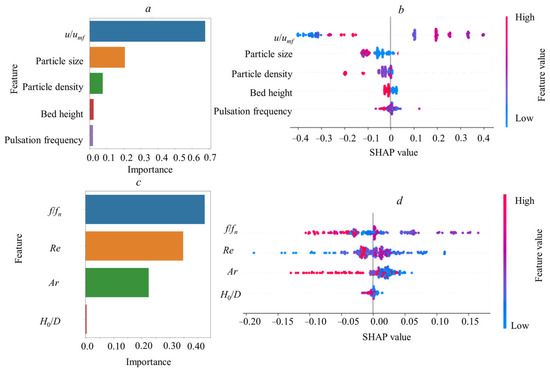
Figure 10.
An interpretability analysis of the XGBoost model utilizing SHAP values ((a): Importance of five variables; (b): SHAP values of five variables; (c): Importance of four dimensionless numbers; (d): SHAP values of four dimensionless numbers).
A further investigation into the relative importance of four dimensionless numbers (Figure 10c) reveals that f/fn is the most significant factor influencing the bed expansion ratio, followed by Re and Ar, while H0/D has a minimal impact. Furthermore, as illustrated in Figure 10d, the SHAP values transition from positive to negative correlation with an increasing f/fn. This phenomenon can be attributed to the trend in the bed expansion ratio, which initially increases and then decreases with variations in f/fn, reaching its maximum at f/fn = 1. Regarding Re, both particle size and gas velocity can lead to a decrease in this parameter. Specifically, as the particle size diminishes, the bed expansion ratio increases—the correlation here is negative; conversely, when the gas velocity decreases, the bed expansion ratio also declines—indicating a positive correlation. Consequently, this results in a scenario where lower values of Re contribute more substantially to the bed expansion ratio; however, as Re increases further, this contribution diminishes. Moreover, larger particle sizes result in reduced bed expansion ratios; hence Ar exhibits a negative correlation under these conditions.
6. Conclusions
- (1)
- As the particle size, density, and bed height increase, the bed expansion ratio continuously decreases. Conversely, an increase in gas velocity leads to a sustained rise in the bed expansion ratio. Furthermore, when the inherent frequency of the bed reaches a specific fixed value, an increase in pulsation frequency results in an initial increase, followed by a decrease in bed height.
- (2)
- In evaluating the model’s performance, XGBoost exhibited the highest prediction accuracy; for training sets utilizing original parameters, its R2 value was 0.9909. In the testing set, this R2 value reached 0.9888. When dimensionless data were used for both training and testing purposes, the R2 value for the training set was 0.9907, while that for the testing set was 0.9300.
- (3)
- SHAP value analysis indicates a positive correlation between gas velocity and bed expansion ratio, whereas particle diameter and density exhibit a negative correlation with it. The influences of bed height and pulsation frequency are relatively weak. For dimensionless numbers, f/fn has a significant impact on the expansion ratio, while H0/D shows a minimal influence.
Author Contributions
Conceptualization and methodology, Y.L. and H.J.; software, Y.L.; data curation, Y.L.; writing—original draft preparation, Y.L.; writing—review and editing, Y.L.; visualization, H.J.; supervision, K.H.; project administration, L.D. All authors have read and agreed to the published version of the manuscript.
Funding
This research was funded by the National Natural Science Foundation of China grant number 52404278, the Basic Research Program of Jiangsu grant number BK20240105, and the Open Fund of the National & Local Joint Engineering Research Center for Mineral Salt Deep Utilization of the Huaiyin Institute of Technology grant number SF202412.
Data Availability Statement
The original contributions presented in the study are included in the article, further inquiries can be directed to the corresponding author.
Conflicts of Interest
The authors declare no conflict of interest.
Nomenclature
| AD | Area of single hole on air distributor, m2. |
| Ar | Archimedes number. |
| d | Particle diameter: m. |
| Mean bubble diameter, m. | |
| D | Diameter of the fluidized bed, m. |
| f | Pulsation frequency: Hz. |
| fe | Proportion of emulsion phase. |
| fn | Natural frequency: Hz. |
| fk | The k-th regression tree. |
| The calculation of the sample mean solely based on the feature set. | |
| The mean value of the samples based on the feature set S, with the addition of feature i. | |
| The predicted value of the sample within the decision tree. | |
| g | Gravitational acceleration, m/s2. |
| H | Bed expansion height, m. |
| Hmf | The bed height at the minimum fluidization velocity, m. |
| H0 | Initial bed height, m. |
| i | The i-th element. |
| k | The k-th tree. |
| K | The total number of regression trees. |
| M | The total number of features. |
| n | The number of samples. |
| N | The complete set of samples within the data set. |
| Re | Reynolds number. |
| S | A subset extracted from M. |
| The dimensionality of S. | |
| u | Gas velocity: m/s. |
| umf | Minimum fluidization velocity, m/s. |
| ub | Rising velocity of the bubble group, m/s. |
| ubr | Rising velocity of a single bubble, m/s. |
| xn | The feature vector of the data. |
| The predicted values for the samples. | |
| Y | Correction factor. |
| The number of features included in the decision path corresponding to this sample. | |
| Greek symbols | |
| δ | Proportion of the bubble phase. |
| ϕ0 | The baseline value provided via the model. |
| ϕi | The contribution of the i-th feature. |
| β | Damping factor: s−1. |
| ρp | Particle density: kg/m3. |
Abbreviations
| AE | Acoustic emission. |
| ANNs | Artificial neural networks. |
| BP | Backpropagation. |
| CGT | Cooperative game theory. |
| RFs | Random forests. |
| RMSE | Root mean square error. |
| GA | Genetic algorithm. |
| GBDT | Existing gradient boosting decision tree. |
| ML | Machine learning. |
| MSE | Mean squared error. |
| SHAP | Shapley additive explanation. |
| XGBoost | Extreme gradient boosting. |
References
- Zhang, K.; Wang, S.; Li, B.; He, Y.; Zhao, Y. Heat transfer in a pulsed fluidized bed by using coupled CFD-DEM method. Powder Technol. 2020, 367, 497–505. [Google Scholar]
- Ali, S.S.; Asif, M.; Ajbar, A. Bed collapse behavior of pulsed fluidized beds of nano-powder. Adv. Powder Technol. 2014, 25, 331–337. [Google Scholar]
- Sung, W.C.; Jung, H.S.; Bae, J.W.; Kim, J.Y.; Lee, D.H. Segregation phenomena of binary solids in a pulsed fluidized bed. Powder Technol. 2022, 410, 117881. [Google Scholar]
- Li, Y.; Hong, K.; Zhou, C.; Zhang, Y.; Dong, L. Resonance-induced particle mixing and segregation phenomena in a forced oscillation fluidized bed. Chem. Eng. Sci. 2024, 299, 120448. [Google Scholar]
- Li, X.; Zhang, R.; Yao, Q.; Meng, X.; Sun, Z.; Li, Z.; Qiu, F.; Li, P.; Zhou, E. Catalytic effects of key compositions in biomass ashes on coal gasification reactivity and structural evolution characteristic during gasification process. J. Clean. Prod. 2025, 499, 145197. [Google Scholar]
- Chen, H.; Zhu, L.; Song, Y.; Liu, Z.; Wang, X.; Zhao, C.; Lu, X. Study on flow characteristics of bidirectional sinusoidal liquid pulsed gas-liquid-solid multiphase fluidized bed. Chem. Eng. Res. Des. 2022, 183, 104–117. [Google Scholar]
- Francia, V.; Wu, K.; Coppens, M.-O. On the role of energy dissipation in a dynamically structured fluidized bed. Chem. Eng. Sci. 2022, 248, 117189. [Google Scholar]
- Liu, Y.; Ohara, H.; Tsutsumi, A. Pulsation-assisted fluidized bed for the fluidization of easily agglomerated particles with wide size distributions. Powder Technol. 2017, 316, 388–399. [Google Scholar]
- Ali, S.S.; Al-Ghurabi, E.H.; Ajbar, A.; Mohammed, Y.A.; Boumaza, M.; Asif, M. Effect of frequency on pulsed fluidized beds of ultrafine powders. J. Nanomater. 2016, 2016, 4592501. [Google Scholar]
- Li, Y.; Zhou, C.; Yang, L.; Lv, G.; Ren, Y.; Zhao, Y. Prediction of Bed Density in a Pulsed Gas–Solid Fluidized Bed. Ind. Eng. Chem. Res. 2021, 61, 968–976. [Google Scholar]
- Machado, V.; Hirata, T.; Menegalli, F. Agglomeration of soy protein isolate in a pulsed fluidized bed: Experimental study and process optimization. Powder Technol. 2014, 254, 248–255. [Google Scholar] [CrossRef]
- Wu, K.; de Martín, L.; Coppens, M.-O. Pattern formation in pulsed gas-solid fluidized beds—The role of granular solid mechanics. Chem. Eng. J. 2017, 329, 4–14. [Google Scholar] [CrossRef]
- Hirata, T.A.M.; Dacanal, G.C.; Menegalli, F.C. Effect of operational conditions on the properties of pectin powder agglomerated in pulsed fluid bed. Powder Technol. 2013, 245, 174–181. [Google Scholar] [CrossRef]
- Zhu, L.; Chen, H.; Song, Y.; Shi, R.; Liu, Z.; Wei, X.; Zhao, C.; Ai, T. Study on flow characteristics of gas-liquid-solid circulating fluidized bed with central sinusoidal pulsating flow. Powder Technol. 2023, 421, 118415. [Google Scholar] [CrossRef]
- Wang, L.; Qi, G.; Tao, M.; Liu, X.; Hassan, M.; Lu, H. Simulated pulsed flow of gas and particles in a horizontal oppose-pulsed gas jets of bubbling fluidized bed. Adv. Powder Technol. 2018, 29, 3507–3519. [Google Scholar] [CrossRef]
- Chew, J.W.; Cocco, R.A. Application of machine learning methods to understand and predict circulating fluidized bed riser flow characteristics. Chem. Eng. Sci. 2020, 217, 115503. [Google Scholar] [CrossRef]
- Guo, Q.; Ye, M.; Yang, W.; Liu, Z. A machine learning approach for electrical capacitance tomography measurement of gas–solid fluidized beds. AIChE J. 2019, 65, e16583. [Google Scholar] [CrossRef]
- Xiao, H.; Oloruntoba, A.; Ke, X.; Gao, K.; Duan, L.; Liu, C.; Zhang, Y.; Wang, J. Improving the precision of solids velocity measurement in gas-solid fluidized beds with a hybrid machine learning model. Chem. Eng. Sci. 2024, 285, 119579. [Google Scholar] [CrossRef]
- Jiang, S.; Wu, K.; Francia, V.; Ouyang, Y.; Coppens, M.-O. Machine Learning Assisted Experimental Characterization of Bubble Dynamics in Gas–Solid Fluidized Beds. Ind. Eng. Chem. Res. 2024, 63, 8819–8832. [Google Scholar] [CrossRef]
- Hossein, F.; Errigo, M.; Cheng, S.; Materazzi, M.; Lettieri, P.; Arcucci, R.; Angeli, P. Acoustic emission and machine learning algorithms for particle size analysis in gas-solid fluidized bed reactors. Particuology 2024. [Google Scholar] [CrossRef]
- Razzak, S.A.; Alkhalaf, O.H.; Rahman, S.M.; Zhu, J. Quantum machine learning–A novel approach for hydrodynamics analysis and modeling of liquid-solid circulating fluidized bed risers. Chem. Eng. Sci. 2023, 282, 119310. [Google Scholar] [CrossRef]
- Kunii, D.; Levenspiel, O. Fluidization Engineering; Butterworth-Heinemann: Washington, DC, USA, 1991. [Google Scholar]
- Davidson, J.F.; Harrison, D. Fluidized Particles; Cambridge University Press: New York, NY, USA, 1963. [Google Scholar]
- Darton, R.C. Bubble growth due to coalescence in fluidized beds. Chem. Eng. Res. Des. 1977, 55, 274–280. [Google Scholar]
- Li, Y.; Zhou, C.; Lv, G.; Ren, Y.; Zhao, Y.; Liu, Q.; Rao, Z.; Dong, L. Prediction of minimum fluidization velocity in pulsed gas–solid fluidized bed. Chem. Eng. J. 2021, 417, 127965. [Google Scholar] [CrossRef]
- Li, Y.; Zhu, F.; Zhang, Y.; Zhao, Y.; Zhang, G.; Huang, Q.; Dong, L. Characterization of bubble behaviors in a dense phase pulsed gas–solid fluidized bed for dry coal processing. Particuology 2020, 53, 83–91. [Google Scholar] [CrossRef]
- De Martín, L.; Ottevanger, C.; Van Ommen, J.R.; Coppens, M.-O. Universal stability curve for pattern formation in pulsed gas-solid fluidized beds of sandlike particles. Phys. Rev. Fluids 2018, 3, 034303. [Google Scholar] [CrossRef]
- Kalman, H. Role of Reynolds and Archimedes numbers in particle-fluid flows. Rev. Chem. Eng. 2022, 38, 149–165. [Google Scholar] [CrossRef]
- Dhaliwal, S.S.; Nahid, A.-A.; Abbas, R. Effective intrusion detection system using XGBoost. Information 2018, 9, 149. [Google Scholar] [CrossRef]
- Lai, Y.; Peng, C.; Hu, W.; Ning, D.; Zhao, L.; Tang, Z. Adaptive optimization random forest for pressure prediction in industrial gas-solid fluidized beds. Powder Technol. 2025, 453, 120607. [Google Scholar] [CrossRef]
- Meng, Y.; Yang, N.; Qian, Z.; Zhang, G. What makes an online review more helpful: An interpretation framework using XGBoost and SHAP values. J. Theor. Appl. Electr. Commer. Res. 2020, 16, 466–490. [Google Scholar] [CrossRef]
- Liu, Y.; Liu, Z.; Luo, X.; Zhao, H. Diagnosis of Parkinson’s disease based on SHAP value feature selection. Biocybern. Biomed. Eng. 2022, 42, 856–869. [Google Scholar] [CrossRef]
Disclaimer/Publisher’s Note: The statements, opinions and data contained in all publications are solely those of the individual author(s) and contributor(s) and not of MDPI and/or the editor(s). MDPI and/or the editor(s) disclaim responsibility for any injury to people or property resulting from any ideas, methods, instructions or products referred to in the content. |
© 2025 by the authors. Licensee MDPI, Basel, Switzerland. This article is an open access article distributed under the terms and conditions of the Creative Commons Attribution (CC BY) license (https://creativecommons.org/licenses/by/4.0/).