Abstract
Active surface materials such as activated carbon are used in the removal of contaminants and dyes in effluents. The primary objective of this study was to convert starchy corncobs into valuable activated carbon, capable of efficiently adsorbing dyes, and to comprehensively analyze the resulting material’s physical and structural properties. To achieve this purpose, a 23 factorial design was employed to create optimized activated carbon for effective methylene blue dye adsorption. The factors considered were carbonization temperatures, carbonization times, and H3PO4 activating agent concentrations. This design yielded eight types of activated carbon, namely B-85%, D-85%, M-85%, L-85%, A-45%, S-45%, P-45% and X-45%, observing that the increase in temperature and carbonization time had negative effects on the adsorption capacity, while the increase in the percentage of activating agent had positive effects. The variant labeled as A-45% displayed the highest cationic methylene blue dye removal efficiency, boasting a remarkable adsorption capacity of 99.93%. This result almost reached the performance of commercial activated carbon, which exhibited a similar methylene blue dye removal efficiency (99.94%), while the removal efficiency of the anionic dye nigrosin was 95.24%. X-ray diffraction analysis of activated carbon A-45% indicated a slightly crystalline amorphous structure. Moreover, surface area analysis utilizing the BET method revealed that this material possessed a micromesoporous nature, mainly consisting of cylindrical micropores, resulting in an impressive surface area of 306,493 m2/g. FTIR analysis revealed the presence of functional groups, including O-H, C=C, C-O, C-X, and P=O, which create a highly polar surface that enhances the chemisorption of cationic molecules like methylene blue. These findings demonstrate the potential application of the synthesized activated carbon in industrial effluent treatment processes.
1. Introduction
In Perú, the majority of industries do not adequately treat their effluents, leading to significant environmental degradation, disruption of ecological balance, and adverse health impacts. To address this issue, there is an urgent need to develop cost-effective and sustainable adsorbent materials derived from abundant, low-cost raw materials. One promising resource is corncobs, which are widely available yet underutilized, particularly in the Southern regions of Peru. By converting these agricultural byproducts into high-surface-area adsorbents capable of removing contaminants from wastewater, this approach not only mitigates environmental pollution but also adds value to an otherwise discarded resource. Furthermore, this initiative has the potential to create employment opportunities, especially in regions like Apurímac, which are known for high-starch corn production. This dual benefit of environmental protection and economic development underscores the importance of leveraging local resources for sustainable solutions.
Synthetic dyes are extensively used across a wide range of industries, including textiles, plastics, leather, paper and pulp, tanneries, distilleries, food production, cosmetics, and pharmaceuticals, among others [1,2,3,4]. Globally, more than 100,000 commercial dyes are employed in these sectors, with annual production exceeding 700,000 tons [2,3,4]. However, the discharge of dye-laden wastewater from these industries poses a significant threat to aquatic ecosystems. These dyes impede light penetration, disrupt photosynthetic processes, inhibit the growth of aquatic biota, and often chelate metallic ions, leading to microtoxicity that harms fish and other organisms. Moreover, dyes can accumulate in polluted environments and enter the food chain through biomagnification, posing serious health risks to humans. Exposure to these contaminants has been linked to carcinogenic and mutagenic effects, as well as allergic reactions and neurotoxicity. Addressing the environmental and health impacts of synthetic dyes is therefore critical to safeguarding ecosystems and public health [1,4,5,6,7,8].
The molecular structure of dyes contains highly stable aromatic rings that make these compounds extremely resistant to removal from aquatic ecosystems and wastewater [2,4]. This persistence poses a significant threat to both ecosystem health and the organisms living within it, including humans. Given these environmental and health risks, developing effective methods for dye removal from water systems has become a critical priority.
Numerous methods have been developed for wastewater treatment to remove dyes, including adsorption, coagulation, flocculation, ion exchange, photocatalysis, electrochemical degradation, and more [1,3,9,10]. Among these approaches, adsorption stands out as one of the most efficient due to its design simplicity, operational flexibility, lack of toxic byproducts, resilience to toxic chemicals, and high selectivity [2,4,9,11].
Activated carbon is a highly porous adsorbent material characterized by its exceptional surface area and porous structure, making it particularly effective at removing contaminants from both aqueous solutions and gaseous environments [12] and especially effective as an adsorbent for the removal of synthetic dyes. Hence, over the past two decades, several studies have explored obtaining activated carbons from disposable organic raw materials due to their low cost, resulting in efficient activated carbons for synthetic dye removal [6,9,11,13,14,15].
The development of activated carbons from renewable plant biomass and agricultural waste is a rapidly advancing field of research. This growing interest is driven by industrial demand for cost-effective activated carbons with tailored properties, such as optimized surface area, controlled pore size distribution, specific functional groups, and magnetic properties, all of which are essential for efficient contaminant removal. The final physicochemical and structural characteristics of activated carbon are significantly influenced by several key factors. These include the choice of lignocellulosic biomass source and critical processing parameters, such as the activation methodology, the selection of activating agents, and the activation [12,16,17]. Understanding and optimizing these parameters is crucial for producing activated carbons with properties tailored to specific applications.
Numerous studies have investigated the production of activated carbon from various sources; however, limited information is available on activated carbon derived from amylaceous corncobs. Maize (corn) is a plant species native to the Americas, with its cultivation and domestication tracing back to pre-Hispanic times. Among its many varieties, one of the oldest domesticated species is amylaceous corn (Zea mays L. ssp. amylaceum), primarily cultivated in the high Andean regions of South America, including Peru, Ecuador, and Bolivia [18]. This variety possesses distinct genetic characteristics that set it apart from the more widely produced yellow corn. Agricultural statistics indicate that for every 100 kg of corn kernels harvested, approximately 18 kg of corncobs are generated as agricultural waste [19]. These corncobs, which are typically underutilized, represent a valuable biomass resource that can be transformed into value-added activated carbon, offering both environmental and economic benefits through waste valorization.
Hence, this study focuses on the production of activated carbon from amylaceous corncobs, sourced from the Apurímac Region in the Chincheros province of the Ongoy district. Moreover, it is important to emphasize that yield and adsorption effectiveness may vary depending on the source of the raw material.
It is noteworthy that this study aims to develop a process that transforms low-value raw materials like corncobs, which are underutilized in their place of origin, into activated carbon that meets quality and efficiency requirements for dye adsorption. In fact, this activated carbon can be employed not only for dye removal in the textile industry but also for a range of industries mentioned above, presenting a technological alternative to add value to agricultural waste resources, promoting an efficient circular economy process.
Among the various agricultural waste and plant biomass used for the production of activated carbon, notable examples include corncobs, coconut shells, banana peels, sucrose, rice husks, pine bark, willow bark, almond shells, coffee grounds, tea residues, and fir sawdust [11,12,13,15,17,20,21]. These studies examine the capacity to remove methylene blue [6,9], textile dyes, tannery dyes, heavy metals, and pharmaceuticals, as well as the study of adsorption models, kinetic equations, and the physicochemical and structural properties.
To summarize, the production of activated carbon from low-cost and readily available agricultural residues is a viable and sustainable approach. This study contributes to the growing body of knowledge by exploring the potential of starchy corncobs as a raw material for activated carbon production, with promising implications for wastewater treatment and environmental sustainability.
2. Materials and Methods
2.1. Reagents
Phosphoric acid (>85% purity, Merck, Darmstadt, Germany), activated carbon from vegetable sources (Clarimex CAE-ULTRA, Hidalgo, Mexico), methylene blue (Central Drug House P Ltd., New Delhi, India), and nigrosine (CHEMILAB, Lima, Peru) were used.
2.2. Organic Samples
The corncobs were collected in the Ongoy district (South Latitude 13°24′14″, West Longitude 73°40′12″), in the province of Chincheros, department of Apurímac. The biomass was classified, crushed, and sieved using a 2 mm mesh. The moisture content was determined using the thermogravimetric method as described by Nielsen [22] and the ash content was determined by the AOAC 900.02 A o B 920.117,923.03 method.
2.3. Synthesis of Activated Carbon
Activated carbon was produced through a chemical activation process with phosphoric acid using a 23 factorial design, with the studied factors being the concentration of the activating agent, carbonization time, and temperature. The experimental design matrix is shown in Table 1.

Table 1.
Factorial design matrix for the synthesis of activated carbon from starchy corncobs.
The mathematical model describing the process was developed based on a factorial design, using multiple regression implemented in the RStudio environment (version 4.3.0). Parameter optimization was performed using the L-BFGS-B algorithm, which allows for bound constraints and ensures computational efficiency in large-scale problems.
100 g of starchy corncob with a particle size of 2 mm was hydrated with 2 mL of deionized water. The formed mixture was pre-carbonized at 200 °C for 4 h. Chemical activation was carried out by soaking the pre-carbonized sample with phosphoric acid at different concentrations in a ratio (1:5 P/V) for a period of 24 h, allowing the acid to penetrate and react with the lignocellulosic material. The treated samples were vacuum-filtered and carbonized in a muffle furnace at different temperatures and times. The resulting activated carbons were washed with distilled water until a neutral pH was achieved and then dried at 150 °C for 2 h. The yield of activated carbon production was determined using Equation (1). To clarify this procedure, we have provided a graphical abstract of the process in Figure 1.
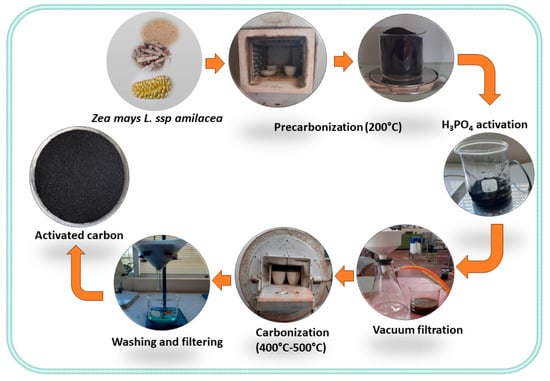
Figure 1.
Schematic representation of the activated carbon synthesis process.
2.4. Characterization of Activated Carbon
- Moisture Determination
Moisture analysis was conducted using the thermogravimetric method described by Nielsen [22].
- Ash Determination
The ash content of the activated carbon was determined using the ASTM D2866-11 method, at a temperature of 650 °C for 3 h.
- Apparent Density Determination
The method described by Mkungunugwa et al. [23] was used, employing a 10 mL graduated cylinder
- FTIR Analysis
The FTIR analysis was performed using a Nicolet iS10 diffuse reflectance Fourier transform infrared (FTIR) spectrophotometer from Thermo Scientific (Thermo Fisher Scientific Inc, Waltham, MA, USA). The activated carbon samples were ground and mixed with potassium bromide salts for analysis. The recorded spectra were analyzed using the Omnic 8.0 software.
- X-Ray Diffraction Analysis (XRD)
The X-ray diffraction analysis was performed using a Rigaku Miniflex II Desktop X-ray diffractometer (Rigaku, Tokyo, Japan), equipped with a copper source (λ Cu Kα = 1.5418 Å).
- Surface Area Analysis
The surface area and pore size distribution analysis were conducted using the Brunauer–Emmet–Teller (BET) method, based on the adsorption of nitrogen gas on the surface of the activated carbon in the Gemini VII 2390 V1.02 equipment (Micromeitics Instrument Corporation, Norcross, GA, USA).
- Determination of Dye Adsorption Capacity
The dye adsorption tests for the obtained activated carbons were carried out in batch mode. For this purpose, 1 g of activated carbon was placed in a flask containing 100 mL of dye at a concentration of 100 ppm. The sample was subjected to constant agitation at a temperature of 20 °C. At regular intervals (30 min), aliquots of samples were extracted, filtered, and centrifuged at 3500 rpm for 5 min. The dye content in the resulting solution was determined using UV-VIS spectroscopy, employing a maximum absorption wavelength of 666 nm for methylene blue and 586 nm for nigrosin.
The adsorption capacity of the activated carbon was calculated using Equation (4):
The percentage or efficiency of dye removal was calculated using Equation (5):
This test was performed using the eight activated carbon samples obtained, with each test repeated three times for accuracy and reliability.
3. Results and Discussion
3.1. Characterization of the Raw Material
The utilization of agricultural waste as a biomass source for producing higher value-added materials, such as activated carbon, represents an efficient and sustainable approach to resource optimization. Among the critical factors influencing the final properties of activated carbon are the characteristics of the precursor biomass, particularly its chemical composition, moisture content, and ash content [21]. A low moisture content in the raw material is advantageous for the carbonization process, as it reduces the time required to reach the optimal carbonization temperature. As shown in Table 2, the moisture and ash content percentages of the amylaceous corncobs analyzed in this study are relatively low and consistent with values reported in previous research. This facilitates the efficient production of activated carbon from this feedstock. Additionally, a low ash content indicates a minimal presence of minerals, which are non-volatile and can obstruct the pores of the activated carbon during the ignition process. Such obstructions may lead to pore collapse, a reduction in surface area, and ultimately, a decline in the material’s adsorption performance [17,24,25].

Table 2.
Moisture and ash content of the raw material.
3.2. Physical Characterization and Yield of Activated Carbons Synthesized from Corncobs by Chemical Activation with H3PO4
Ash content is a critical quality control parameter for activated carbon, as it directly reflects the mineral residue present in the final product. High ash content is associated with reduced adsorption capacity and performance [27] and may introduce contaminants during the adsorption process [9]. According to the international standard EN 12915-1, materials used in water treatment must not exceed 15% ash content [27]. As shown in Table 3, the activated carbon A-45% complies with this standard, exhibiting the lowest ash percentage (12.76%) and a high yield (57.57%). These characteristics serve as promising indicators of superior adsorption performance [15,28].

Table 3.
Yield, moisture content, ash content, and apparent density of activated carbons.
The ash content of activated carbon is influenced by several factors, including the composition of the raw material, pyrolysis conditions (temperature and contact time), and the activation method. Research indicates that slow pyrolysis, characterized by low temperatures and extended contact times, produces activated carbons with minimal ash content [27]. Specifically, phosphoric acid activation at temperatures ranging from 350 to 425 °C yields activated carbons with low ash content and high yield [17].
The moisture content of activated carbon A-45% is 12.37%, which is a favorable characteristic. Theoretically, lower moisture content maximizes the surface area available for adsorption [28]. Additionally, the low apparent density of activated carbon A-45% (0.230 g/mL) suggests high porosity, a desirable property for adsorption applications [15]. Collectively, these characteristics highlight the material’s potential for efficient and effective use in adsorption processes.
The yield of activated carbon A-45% (57.57%), as shown in Table 3, significantly surpasses the 18% yield reported by Alkali [29]. The yield of activated carbon is influenced by several factors, including the type of raw material, activation temperature, activation time, and the specific activating agents used. Phosphoric acid, as an activating agent, is particularly effective in decomposing lignocellulose and modifying its structure to produce carbonaceous materials with enhanced physical and chemical properties [23].
3.3. Dye Adsorption Capacity
The adsorption capacity and percentage removal of methylene blue dye were evaluated for eight types of activated carbon derived from corncobs (B-85%, D-85%, M-85%, L-85%, A-45%, S-45%, P-45%, and X-45%), alongside a commercially sourced activated carbon (CA). The performance of the produced adsorbent was compared. The adsorption capacity was determined using a methylene blue solution with an initial concentration of 100 ppm. Batch assays were conducted under continuous agitation at 450 rpm and room temperature. The results illustrate the adsorption capacities of the activated carbons over time, showing that methylene blue adsorption increased progressively, reaching a quasi-steady state at 180 min in some cases.
Figure 2 depicts a characteristic adsorption pattern: rapid initial uptake followed by a gradual slowdown. This trend suggests that the initial phase is dominated by the diffusion of the dye into the mesopores and micropores of the activated carbon. As the process continues, adsorption slows due to progressive pore saturation, eventually leading to an asymptotic curve in the final stage.
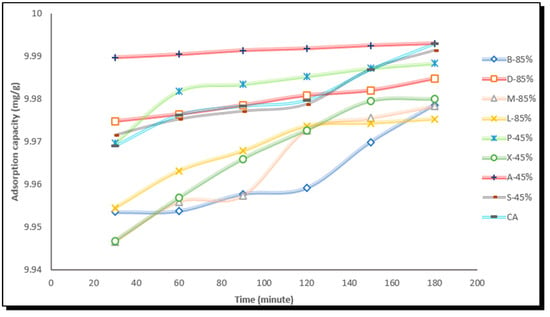
Figure 2.
Methylene blue adsorption capacity of activated corncob carbons.
Figure 3 shows the adsorption kinetics of methylene blue dye removal by various activated carbons derived from corncobs. Overall, all materials exhibit an increasing trend in dye removal over time, though with notable differences in rate and efficiency.
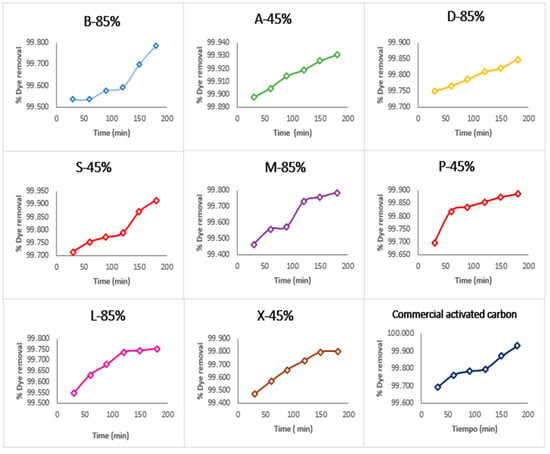
Figure 3.
Percentage of methylene blue dye removed by activated carbon from corncobs and commercial activated carbon.
The A-45% activated carbon stands out for its rapid adsorption kinetics, reaching near-complete removal (~100%) in significantly shorter time periods compared to other samples, including commercial activated carbon, which displays slower and less efficient performance. This contrast suggests that A-45% has greater surface accessibility, likely due to an optimized porous structure (micro- and mesopores) and the presence of active functional groups that enhance interaction with the cationic dye.
The superior kinetic behavior of A45 positions it as a highly effective adsorbent, ideal for applications requiring fast and complete contaminant removal, such as wastewater treatment systems or industrial decontamination processes.
Figure 4 illustrates the adsorption capacity of two dyes—methylene blue and nigrosin—over time. Methylene blue rapidly reaches its maximum adsorption (~10 mg/g) within the first 25 min, indicating fast kinetics and potentially high affinity for the adsorbent. In contrast, nigrosin shows a more gradual increase, reaching ~9 mg/g at 200 min, suggesting a slower process possibly governed by internal diffusion.
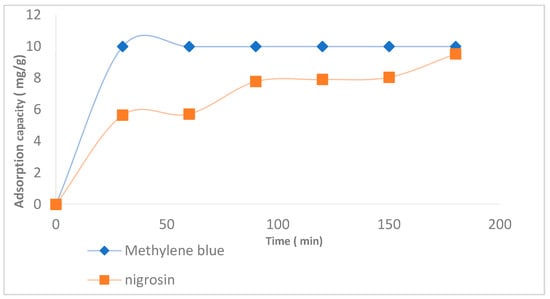
Figure 4.
Adsorption capacity of methylene blue and nigrosin dyes by activated carbon A45.
This kinetic difference may be attributed to the molecular structure, polarity, and size of the dyes, which influence diffusion rates and interaction with active sites on the adsorbent. The rapid saturation of methylene blue could be linked to its smaller molecular size and greater accessibility, while nigrosin, being bulkier or less polar, may require more time to reach equilibrium.
Furthermore, Figure 4 demonstrates that activated carbon A45 is capable of adsorbing both cationic dyes (such as methylene blue) and anionic dyes (such as nigrosin). This dual adsorption capacity is attributed to its surface characteristics, including a network of micro- and mesopores, and the presence of functional groups capable of forming transient interactions with both types of compounds. This combination of structural and chemical features makes A45 an effective and versatile adsorbent for treating water contaminated with a wide range of dyes.
The adsorption studies demonstrated that the activated carbon A-45% exhibited an excellent adsorption capacity for both methylene blue (9.993 mg/g) and nigrosin (9.524 mg/g) dyes (Table 4). These results were comparable to commercial activated carbon, indicating the effectiveness of the produced activated carbon in dye removal. The high adsorption capacity can be attributed to its large surface area, porous structure, and the presence of functional groups on the surface of the activated carbon.

Table 4.
Adsorption capacity and percentage of methylene blue and nigrosin dye removal at 180 min.
3.4. Influence of Process Parameters in the Synthesis of Activated Corncob Carbons on the Adsorption Capacity of Methylene Blue Dye
To analyze the influence of carbonization temperature (A), carbonization time (B), and phosphoric acid concentration (C) on the adsorption capacity of methylene blue dye, a 23 factorial design was employed. This design allowed us to identify which factor has the greatest impact on the adsorption capacity. The factorial ANOVA analysis formally verified whether the factors employed have a statistically significant relationship with the adsorption capacity of methylene blue dye.
Table 5 shows the results of the factorial ANOVA, concluding that the model’s regression determination coefficient (R2 adjusted = 94.72%) for the adsorption capacity of methylene blue dye was in good agreement with the experimental results. This indicates that 94.72% of the correlation is explained by the predicted model, demonstrating the model’s reliability.

Table 5.
Analysis of variance (ANOVA factorial).
The predicted model has a regression equation that helps forecast how the factors (A, B, C) will influence the production process of activated carbon and its adsorption capacity. The equation is as follows: Adsorption Capacity = 9.98372 − 0.000847 A − 0.003242 B + 0.004468 C − 0.002015 A × B − 0.001665 A × C − 0.000789 B × C + 0.000321 A × B × C
From the variance analysis (Table 5), it is concluded that all factors and their interactions are significant (p < 0.05), except for the interaction of factors (A, B, and C), which is not significant.
The response surface plot of the mathematical model reveals the combined influence of key process variables—activation temperature, activation time, and H3PO4 concentration—on the adsorption capacity of activated carbon derived from corncobs. The results indicate that adsorption capacity decreases significantly when these variables reach extreme values (either minimum or maximum), while the highest adsorption capacities are achieved under intermediate conditions.
As shown in Figure 5a, moderate levels of temperature and activation time favor the formation of activated carbons with high adsorption capacity. However, further increases in temperature lead to a decline in performance. This trend aligns with the findings of Xu et al. [17], who demonstrated that using H3PO4 as an activating agent promotes the development of micro–mesoporous structures with low ash content and high adsorption capacity when activation temperatures are low. In contrast, elevated temperatures cause mesopore collapse, H3PO4 polymerization, ash formation, and a reduction in adsorption efficiency.
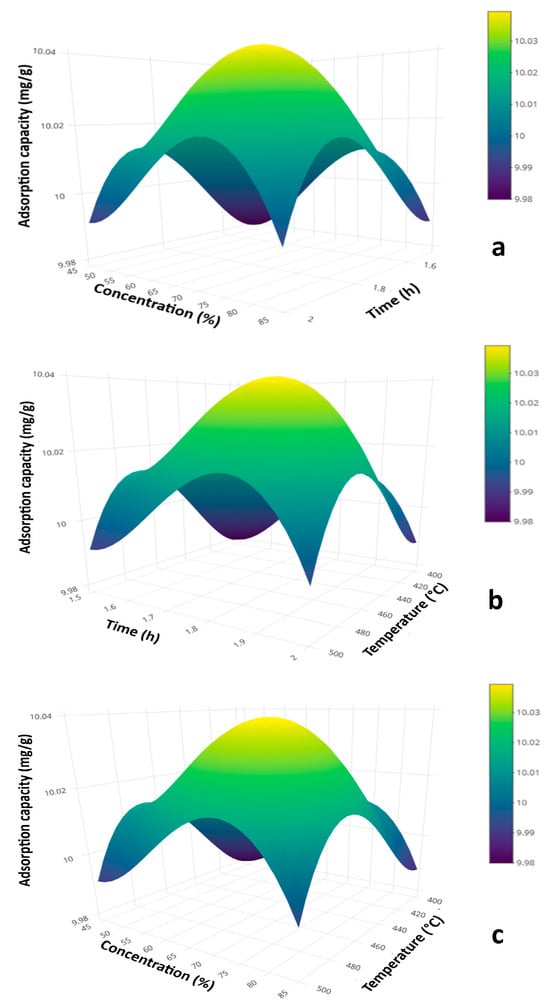
Figure 5.
Response surface plots illustrating the variation in adsorption capacity as a function of process variables: (a) activation time and H3PO4 concentration, (b) activation time and temperature, and (c) activation temperature and H3PO4 concentration.
The mathematical model also highlights the critical impact of activating agent concentration (H3PO4) on adsorption capacity. Figure 5c consistently shows that high concentrations of H3PO4 result in activated carbons with lower adsorption capacity, suggesting that high-performance carbons can be obtained using lower concentrations of the activating agent.
Developing a predictive mathematical model is particularly valuable for the sustainable production of activated carbon with tailored properties at an industrial scale, where energy efficiency and optimal reagent use are prioritized. Model optimization was performed using the L-BFGS-B algorithm, aimed at maximizing the response variable (adsorption capacity). The optimal conditions identified were 500 °C activation temperature, 2 h activation time, and 40% H3PO4 concentration. Under these conditions, the model predicts an adsorption capacity of 9.995 mg/g.
3.5. BET Analysis
The surface area and pore size distribution of the activated carbons with the highest (A-45%) and lowest (L-85%) methylene blue removal capacity were determined using the BET method. As shown in Table 6, activated carbon A-45% exhibited a larger surface area and total pore volume compared to activated carbon L-85%. Both samples displayed pore size distribution patterns characteristic of micro–mesoporous carbon, consistent with findings reported previously [30,31], with a predominance of micropores. Additionally, the average pore diameter of A-45% was smaller than that of L-85%, resulting in a higher surface area and enhanced dye adsorption capacity, as experimentally demonstrated. These results align with those of Kumaravel et al. [11], who reported similar correlations between surface area, micro–mesoporous structure, and methylene blue adsorption capacity for activated carbons derived from corncobs via phosphoric acid activation. However, their study involved higher activation temperatures.

Table 6.
Surface area of activated carbons A-45% y L85%.
Figure 6a,b present the nitrogen adsorption–desorption isotherms for activated carbon A-45%, while Figure 6c,d illustrate the corresponding isotherms for activated carbon L-85%. These isotherms, classified as type I and IV according to the IUPAC classification, reveal the presence of micro–mesoporous structures, typically in the form of slits, as reported previously [32,33]. Additionally, both carbons exhibit hysteresis loops in their isotherms. According to Liou and Wu [34], these loops suggest the occurrence of capillary condensation within the micro–mesoporous structures of the activated carbon.
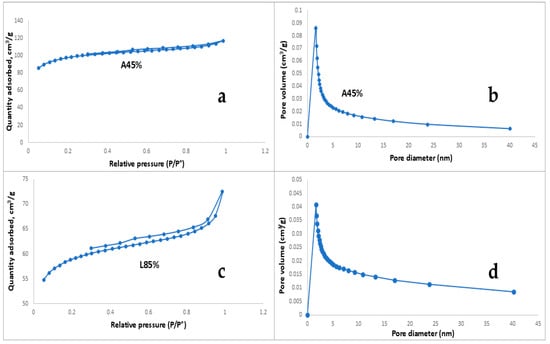
Figure 6.
(a) N2 adsorption–desorption isotherms for activated corncob carbon (A-45%); (b) pore size distribution for activated corncob carbon (A-45%); (c) N2 adsorption–desorption isotherms for activated corncob carbon (L-85%); (d) pore size distribution for activated corncob carbon (L-85%).
3.6. X-Ray Diffraction Analysis
Figure 7 presents the X-ray diffraction (XRD) pattern of activated carbon A-45%. The XRD pattern exhibits a broad peak centered around 2θ = 24° and a smaller, broad peak around 2θ = 43°, corresponding to the (002) and (100) diffraction planes [11], respectively. These peaks indicate the predominantly amorphous structure of activated carbon A-45%. Additionally, the presence of sharp and narrow peaks around 2θ = 21°, 24°, and 28° suggests the presence of a more ordered, graphitic carbon structure [12].
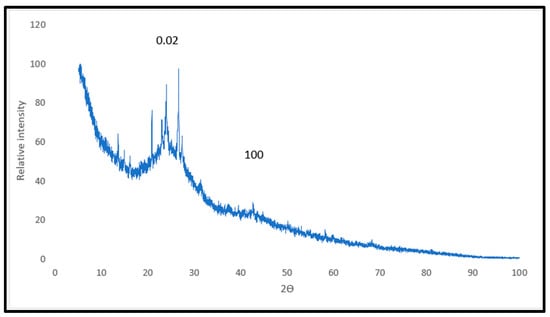
Figure 7.
XRD pattern of activated carbon A-45%.
The XRD analysis of activated carbon A-45% revealed a slightly crystalline amorphous structure, indicating the presence of both crystalline and amorphous phases.
3.7. FTIR Analysis
FTIR analysis was employed to identify the functional groups present on the surface of the activated carbons. Figure 8 and Figure 9 depict the functional groups of activated carbons A-45% and L-85%, respectively. Table 7 presents the wavenumbers of activated carbons A-45% and L-85% and their corresponding functional groups. The FTIR spectrum of carbon A-45% exhibits a broad band around 3606 cm−1, attributed to O-H stretching vibrations of hydroxyl groups commonly found in activated carbons. The band at 1610.42 cm−1 corresponds to C=C stretching, indicating the presence of aromatic rings typical of carbon materials [11]. The presence of the band at 1169.68 cm−1 represents C-O stretching, suggesting the presence of ester or carboxylic acid groups and/or P=O stretching, corresponding to phosphate groups [17]. Additionally, the band at 493.42cm−1 represents C-X stretching, generally referring to a carbon–halogen bond where the halogen can be chlorine, bromine, iodine, or fluorine. The FTIR spectrum of activated carbon L-85% is similar to that of activated carbon A-45%. Based on the analysis, it can be concluded that the functional groups present on the surface of the obtained activated carbons are predominantly polar, facilitating the adsorption of cationic molecules. Consequently, the obtained carbons exhibit a high capacity for cationic dyes such as methylene blue and a moderate adsorption capacity for anionic molecules like nigrosin. These findings are consistent with those reported by Kumaravel et al. [11] Maulina and Iriansyah [24], and Farnane et al. [35].
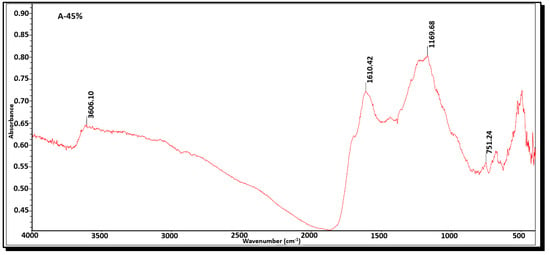
Figure 8.
FTIR spectra of activated carbon A-45%.
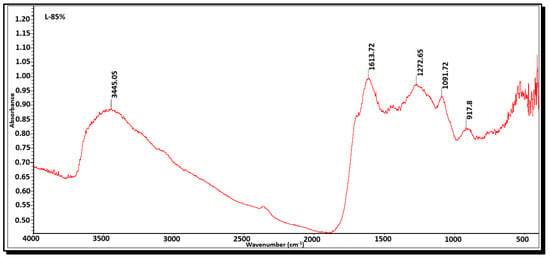
Figure 9.
FTIR spectra of activated carbon L85%.

Table 7.
Functional groups according to FTIR analysis of activated carbons.
4. Conclusions
This study employed a 23 factorial design to systematically optimize activated carbon production from corncobs for methylene blue adsorption. Mathematical modeling and experimental results identified the optimal conditions: H3PO4 activation at intermediate temperature and time, combined with a low activating agent concentration. These parameters yielded activated carbon with superior adsorption efficiency, demonstrating the effectiveness of this approach for tailoring sustainable adsorbents from agricultural waste.
Through chemical activation with phosphoric acid under mild conditions, activated carbons were successfully obtained from starchy corncobs. Among the tested variants, A-45% exhibited the highest adsorption capacity for both cationic and anionic dyes, a high surface area, large pore volume, and low ash content.
BET analysis confirmed a micro–mesoporous structure for A-45%, predominantly microporous, facilitating the adsorption of molecules of various sizes. XRD analysis revealed its amorphous nature, while FTIR analysis identified polar and acidic functional groups on its surface, enhancing cationic molecule adsorption.
This study demonstrated that starchy corncobs, an agricultural waste product, can produce high-performance activated carbon for wastewater treatment. The optimally produced carbon (A-45%) showed excellent adsorption of both cationic and anionic dyes, matching commercial alternatives.
The research established a method to create activated carbon with tailored pore structures and functional properties from corncobs, suitable for industrial applications. This approach offers dual benefits: converting agricultural waste into valuable materials while developing effective, environmentally sustainable water treatment solutions.
Author Contributions
Conceptualization, R.G.B., C.M.R. and R.A.P.I.; Methodology, R.G.B.; Formal Analysis, R.G.B.; Research, R.G.B.; Writing—Original Draft Preparation, R.G.B.; Writing—Review & Editing, C.M.R., R.A.P.I. and K.G.B.; Software, U.R.-C. and K.G.B.; Data Curation, K.G.B., R.G.B., J.C.W.H. and H.L.G.R.; Editing, U.R.-C. All authors have read and agreed to the published version of the manuscript.
Funding
This research received no external funding.
Data Availability Statement
The original contributions presented in this study are included in the article. Further inquiries can be directed to the corresponding author.
Acknowledgments
The authors would like to express their gratitude to the Faculty of Chemistry and Chemical Engineering (FQIQ) at the Universidad Nacional Mayor de San Marcos, Lima, for providing the necessary facilities to explore the production method. We also extend our appreciation to the Mass Transfer and Organic Chemistry Laboratories of the Faculty of Chemical Engineering and Metallurgy at the National University of San Cristóbal de Huamanga for their invaluable support and resources that contributed to the success of this research.
Conflicts of Interest
The authors declare no conflicts of interest.
References
- Alam, S.; Ilyas, M.; Ullah, S.; Rahman, N.U.; Zahoor, M.; Umar, M.N.; Ullah, R. Fabrication of Magnetic Activated Carbon from Corn-Cob Biomass for the Removal of Acidic Dyes from Wastewater. Desalin. Water Treat. 2024, 317, 100049. [Google Scholar] [CrossRef]
- Ho, S. Removal of Dyes from Wastewater by Adsorption onto Activated Carbon: Mini Review. J. Geosci. Environ. Prot. 2020, 8, 120–131. [Google Scholar] [CrossRef]
- Jaafar, M.T. UV-A Activated ZnO Mediated Photocatalytic Decolorization of Nigrosine (Acid Black 2) Dye in Aqueous Solution. J. Geosci. Environ. Prot. 2017, 5, 138–147. [Google Scholar] [CrossRef]
- Piaskowski, K.; Świderska-Dąbrowska, R.; Zarzycki, P.K. Dye Removal from Water and Wastewater Using Various Physical, Chemical, and Biological Processes. J. AOAC Int. 2018, 101, 1371–1384. [Google Scholar] [CrossRef]
- Ardila-Leal, L.D.; Poutou-Piñales, R.A.; Pedroza-Rodríguez, A.M.; Quevedo-Hidalgo, B.E. A Brief History of Colour, the Environmental Impact of Synthetic Dyes and Removal by Using Laccases. Molecules 2021, 26, 3813. [Google Scholar] [CrossRef]
- Bedin, K.C.; Souza, I.P.A.F.; Cazetta, A.L.; Spessato, L.; Ronix, A.; Almeida, V.C. CO2-Spherical Activated Carbon as a New Adsorbent for Methylene Blue Removal: Kinetic, Equilibrium and Thermodynamic Studies. J. Mol. Liq. 2018, 269, 132–139. [Google Scholar] [CrossRef]
- Kheddo, A.; Rhyman, L.; Elzagheid, M.I.; Jeetah, P.; Ramasami, P. Adsorption of Synthetic Dyed Wastewater Using Activated Carbon from Rice Husk. SN Appl. Sci. 2020, 2, 2170. [Google Scholar] [CrossRef]
- Ramasundaram, S.; Manikandan, V.; Vijayalakshmi, P.; Devanesan, S.; Salah, M.B.; Ramesh Babu, A.C.; Priyadharsan, A.; Oh, T.H.; Ragupathy, S. Synthesis and Investigation on Synergetic Effect of Activated Carbon Loaded Silver Nanoparticles with Enhanced Photocatalytic and Antibacterial Activities. Environ. Res. 2023, 233, 116431. [Google Scholar] [CrossRef]
- Dimbo, D.; Abewaa, M.; Adino, E.; Mengistu, A.; Takele, T.; Oro, A.; Rangaraju, M. Methylene Blue Adsorption from Aqueous Solution Using Activated Carbon of Spathodea Campanulata. Results Eng. 2024, 21, 101910. [Google Scholar] [CrossRef]
- Lewoyehu, M. Comprehensive Review on Synthesis and Application of Activated Carbon from Agricultural Residues for the Remediation of Venomous Pollutants in Wastewater. J. Anal. Appl. Pyrolysis 2021, 159, 105279. [Google Scholar] [CrossRef]
- Kumaravel, S.; Geetha, M.; Niyitanga, T.; Kumar, D.S.; Al-Ansari, M.M.; Mythili, R.; Suganthi, S.; Guganathan, L.; Murugan, A.; Ragupathy, S. Preparation and Characterization of Activated Carbon from Corn Cob by Chemical Activation and Their Adsorption of Brilliant Green Dye from Wastewater. Process Saf. Environ. Prot. 2024, 188, 1338–1345. [Google Scholar] [CrossRef]
- Shahcheragh, S.K.; Bagheri Mohagheghi, M.M.; Shirpay, A. Effect of Physical and Chemical Activation Methods on the Structure, Optical Absorbance, Band Gap and Urbach Energy of Porous Activated Carbon. SN Appl. Sci. 2023, 5, 313. [Google Scholar] [CrossRef]
- Chikri, R.; Elhadiri, N.; Benchanaa, M.; El Maguana, Y. Efficiency of Sawdust as Low-Cost Adsorbent for Dyes Removal. J. Chem. 2020, 2020, 8813420. [Google Scholar] [CrossRef]
- Fofana, A.; Yao Yobouet, A.; Daouda, K.; Eric-Simon Zran, V.; Kone, H.; Verdier Abouo, N.; Joel Boro-Bi, T.; Emmanuel Assidjo, N. Optimization of congo red dye adsorption with activated carbon from the cob of corn (Zea mays L.) By experimental plans. Int. J. Adv. Res. 2022, 10, 216–225. [Google Scholar] [CrossRef]
- Jawad, A.H.; Bardhan, M.; Islam, M.A.; Islam, M.A.; Syed-Hassan, S.S.A.; Surip, S.N.; ALOthman, Z.A.; Khan, M.R. Insights into the Modeling, Characterization and Adsorption Performance of Mesoporous Activated Carbon from Corn Cob Residue via Microwave-Assisted H3PO4 Activation. Surf. Interfaces 2020, 21, 100688. [Google Scholar] [CrossRef]
- Siipola, V.; Tamminen, T.; Källi, A.; Lahti, R.; Romar, H.; Rasa, K.; Keskinen, R.; Hyväluoma, J.; Hannula, M.; Wikberg, H. Effects of Biomass Type, Carbonization Process, and Activation Method on the Properties of Bio-Based Activated Carbons. BioRes 2018, 13, 5976–6002. [Google Scholar] [CrossRef]
- Xu, W.; Liu, J.; Sun, K.; Liu, Y.; Chen, C.; Wang, A.; Sun, H. Effect of Activation Temperature on Properties of H3PO4-Activated Carbon. BioRes 2021, 16, 4007–4020. [Google Scholar] [CrossRef]
- Narro León, T.P.; Piña Díaz, P.C. Manual de Producción de Maíz Amiláceo; INIA (Instituto Nacional de Innovación Agraria): La Molina, Peru, 2021; p. 154. Available online: https://repositorio.inia.gob.pe/handle/20.500.12955/1310 (accessed on 15 February 2025).
- Zhou, Q.; Cai, W.; Zhang, Y.; Liu, J.; Yuan, L.; Yu, F.; Wang, X.; Liu, M. Electricity Generation from Corn Cob Char Though a Direct Carbon Solid Oxide Fuel Cell. Biomass Bioenergy 2016, 91, 250–258. [Google Scholar] [CrossRef]
- Gayathiri, E.; Prakash, P.; Karmegam, N.; Varjani, S.; Awasthi, M.K.; Ravindran, B. Biosurfactants: Potential and Eco-Friendly Material for Sustainable Agriculture and Environmental Safety—A Review. Agronomy 2022, 12, 662. [Google Scholar] [CrossRef]
- Yang, F.; Xing, L.; Zhong, X.; Liu, Y.; Guo, Z.; Yang, J.; Yuan, A.; Pan, J. Volatile Acetic Acid Selective Adsorption by Biomass-Derived Activated Carbon with Humidity-Resistance: Tunable Implanting and Activation Approach of Activator. Sep. Purif. Technol. 2024, 341, 126891. [Google Scholar] [CrossRef]
- Nielsen, S.S. (Ed.) Food Analysis; Food Science Texts Series; Springer: Boston, MA, USA, 2010. [Google Scholar] [CrossRef]
- Mkungunugwa, T.; Manhokwe, S.; Chawafambira, A.; Shumba, M. Synthesis and Characterisation of Activated Carbon Obtained from Marula (Sclerocarya Birrea) Nutshell. J. Chem. 2021, 2021, 5552224. [Google Scholar] [CrossRef]
- Maulina, S.; Iriansyah, M. Characteristics of Activated Carbon Resulted from Pyrolysis of the Oil Palm Fronds Powder. IOP Conf. Ser.: Mater. Sci. Eng. 2018, 309, 012072. [Google Scholar] [CrossRef]
- Canales Flores, R.A.; Prieto García, F.; Otazo Sánchez, E.M.; Bolarín Miró, A.M.; Acevedo Sandoval, O.A. Physico-Chemical Characterization of Agricultural Residues as Precursors for Activated Carbon Preparation. Preprints 2017, 2017120086. [Google Scholar] [CrossRef]
- Dorofėjūtė, T.; Paulikienė, S.; Ūksas, T.; Zvicevičius, E.; Žiūra, K.; Lekavičienė, K. Assessment of the Characteristics of Corncobs Used for Energy Needs. Agronomy 2024, 14, 1127. [Google Scholar] [CrossRef]
- Castiglioni, M.; Rivoira, L.; Ingrando, I.; Meucci, L.; Binetti, R.; Fungi, M.; El-Ghadraoui, A.; Bakari, Z.; Del Bubba, M.; Bruzzoniti, M.C. Biochars Intended for Water Filtration: A Comparative Study with Activated Carbons of Their Physicochemical Properties and Removal Efficiency towards Neutral and Anionic Organic Pollutants. Chemosphere 2022, 288, 132538. [Google Scholar] [CrossRef]
- Dizbay-Onat, M. Evaluation of Physical Adsorption Properties of the Activated Carbon Layers Used in the Commercial Face Mask Inserts. Eng 2023, 4, 434–443. [Google Scholar] [CrossRef]
- Alkali, A.S. Optimization of Activated Carbon Preparation from Corncob Wastewater Treatment. Master’s Thesis, Ahmadu Bello University, Zaria, Nigeria, 2016. Available online: https://kubanni.abu.edu.ng/handle/123456789/8892 (accessed on 15 January 2025).
- Zhang, Z.; Jiang, C.; Li, D.; Lei, Y.; Yao, H.; Zhou, G.; Wang, K.; Rao, Y.; Liu, W.; Xu, C.; et al. Micro-Mesoporous Activated Carbon Simultaneously Possessing Large Surface Area and Ultra-High Pore Volume for Efficiently Adsorbing Various VOCs. Carbon 2020, 170, 567–579. [Google Scholar] [CrossRef]
- Ivanova, I.I.; Knjazeva, E.E.; Dobrjakova, I.V.; Monakhova, J.V.; Kozhina, O.V.; Tikhonova, A.A. Micro-Mesoporous Crystalline Material and Method of Making Said Material. RU Patent 2393992C1, 17 March 2009. Available online: https://patents.google.com/patent/RU2393992C1/en (accessed on 15 February 2025).
- Medhat, A.; El-Maghrabi, H.H.; Abdelghany, A.; Abdel Menem, N.M.; Raynaud, P.; Moustafa, Y.M.; Elsayed, M.A.; Nada, A.A. Efficiently Activated Carbons from Corn Cob for Methylene Blue Adsorption. Appl. Surf. Sci. Adv. 2021, 3, 100037. [Google Scholar] [CrossRef]
- Mojoudi, N.; Mirghaffari, N.; Soleimani, M.; Shariatmadari, H.; Belver, C.; Bedia, J. Phenol Adsorption on High Microporous Activated Carbons Prepared from Oily Sludge: Equilibrium, Kinetic and Thermodynamic Studies. Sci. Rep. 2019, 9, 19352. [Google Scholar] [CrossRef] [PubMed]
- Liou, T.-H.; Wu, S.-J. Characteristics of Microporous/Mesoporous Carbons Prepared from Rice Husk under Base- and Acid-Treated Conditions. J. Hazard. Mater. 2009, 171, 693–703. [Google Scholar] [CrossRef] [PubMed]
- Farnane, M.; Tounsadi, H.; Machrouhi, A.; Elhalil, A.; Mahjoubi, F.Z.; Sadiq, M.; Abdennouri, M.; Qourzal, S.; Barka, N. Dye Removal from Aqueous Solution by Raw Maize Corncob and H3PO4 Activated Maize Corncob. J. Water Reuse Desalin. 2018, 8, 214–224. [Google Scholar] [CrossRef]
Disclaimer/Publisher’s Note: The statements, opinions and data contained in all publications are solely those of the individual author(s) and contributor(s) and not of MDPI and/or the editor(s). MDPI and/or the editor(s) disclaim responsibility for any injury to people or property resulting from any ideas, methods, instructions or products referred to in the content. |
© 2025 by the authors. Licensee MDPI, Basel, Switzerland. This article is an open access article distributed under the terms and conditions of the Creative Commons Attribution (CC BY) license (https://creativecommons.org/licenses/by/4.0/).